
Abstract
Abstract
Understanding oocyte developmental competence remains a key challenge for reproductive biology and systems sciences. The transcriptome of oocytes in eutherians is highly complex and is associated with the success of embryo development. Due to sample limitations from humans, animal models are used for investigation of the oocyte transcriptome. Nonetheless, little is known about the diversity of the oocyte transcriptome across eutherians. In this report, comprehensive investigation of 7 public data sets in 4 species, human, macaque, mice, and cattle, shows that 16,572 genes are expressed in oocytes. Approximately 26% of the genes were expressed in all four species. There were 1390, 489, and 187 genes specifically expressed in human, mice, and cattle oocytes, respectively. Coexpression clustering of the genes specifically expressed in human oocytes revealed functional enrichment (FDR <0.05) of Gene Ontology (GO) terms important for oocyte physiology (i.e., “cellular response to metal ion,” “negative regulation of growth,” “hormone activity,” and “receptor activity”). Interrogation of 4 data sets revealed 26 genes whose expressions were significantly (FDR ≤0.1) associated with oocyte developmental competence and concordant fold change in 2 studies. The genes AK2, AKAP1, ECHS1, MRPL10, MRPL24, PTRH2, STX17, SUCLG1, SUOX, and TOMM34 were associated with the GO term “mitochondrion” (FDR <0.01). Collectively, the results offer new insights on gene transcript levels associated with oocyte developmental competence and the central role of mitochondrion for oocyte's health among eutherians. Caution should be exercised, however, when extending the inferences related to gene expression associated with oocyte quality across eutherians.
Introduction
D
Beginning with the activation of a quiescent oocyte in a primordial follicle, and following oocyte growth, the oocyte resumes meiosis with the breakdown of the nuclei–germinal vesicle (GV). The meiosis progresses until the oocytes are arrested in metaphase II (MII) (Touati and Wassmann, 2016) and can proceed after fertilization (Fig. 1A). The oocyte accumulates an abundance of messenger RNAs (mRNAs) and proteins that are vital for the embryo development (Gandolfi and Gandolfi, 2001; Traverso et al., 2011). Pharmacological block of the transcription in cleavage embryos has demonstrated that the cytoplasmic reserve can support embryo development (Tadros and Lipshitz, 2009) until 2 cells in mice (Wang and Dey, 2006), 4 cells in human and rat (Braude et al., 1988; Zernicka-Goetz, 1994), and 8–16 cells in cattle (Sirard, 2012).

The oocyte maturation.
Furthermore, the abundance of specific mRNAs accumulated in the oocyte is directly related to the potential to develop a blastocyst (Biase et al., 2014). The characterization of the mRNA features accumulated in the oocytes during folliculogenesis is central for a better understanding of embryo development as the oocyte is the major contributor of transcripts for the embryo before the embryo genome activation.
Several studies have characterized the transcriptome of oocytes in eutherians [i.e.: human (Fragouli et al., 2010; Grøndahl et al., 2010; Jones et al., 2008; Virant-Klun et al., 2013; Wells and Patrizio, 2008; Xue et al., 2013; Yan et al., 2013), mice (Pan et al., 2008; Su et al., 2007; Tang et al., 2009; Veselovska et al., 2015), macaque (Lee et al., 2008), cattle (Adona et al., 2016; Biase et al., 2014; Graf et al., 2014; Katz-Jaffe et al., 2009; Kues et al., 2008; Labrecque et al., 2016; Mamo et al., 2011; Misirlioglu et al., 2006; Regassa et al., 2011; Reyes et al., 2015), and pig (Paczkowski et al., 2011)], and a targeted comparison of genes expressed in oocytes of human, mice, and cattle has revealed variable expression of genes related to polyadenylation and translation factors (Reyes and Ross, 2016).
The rare development of interspecies embryo when a nucleus is fused with an oocyte (Beyhan et al., 2007) is experimental evidence that the reprogramming factors in the oocytes are highly specialized for the nucleus of the same species (Jiang et al., 2011). The understanding of interspecies differences in reprogramming factors may reveal several aspects of the singular ability of oocytes to reprogram the nucleus of a spermatozoid or a somatic cell (Teperek and Miyamoto, 2013).
In this study, I systematically mined data from seven microarray data sets produced from mammalian oocytes from human, macaque, mice, and cattle to provide a comparative view of the gene expression in oocytes across these four species (Fig. 1B). The oocyte transcriptome is highly variable across species, and the human oocyte is likely to have a greater complexity compared with mice and cattle. Finally, an investigation of genes associated with developmental models of oocyte quality yielded genes that have a high likelihood of being associated with good- versus bad-quality oocytes.
Materials and Methods
Data sources and processing
The biomedical literature was systematically searched using the PubMed repository (www.pubmed.gov) from the National Center for Biotechnology Information (NCBI Resource Coordinators, 2014). A broad query was performed using the term “oocyte microarray” and the resulting articles were screened for research that reported microarray data sets from human, macaque, cattle, or mice oocytes. A filter was applied to retain studies that deposited the raw data into public repositories. Finally, only data sets generated with the Affymetrix platform were further analyzed to avoid bias caused by selective inclusion of targets on different platforms.
Seven data sets generated from oocytes striped from granulosa cells were used for the downstream analyses (Table 1). Six data sets were available on the Gene Expression Omnibus (Barrett et al., 2009) and one data set was available on the ArrayExpress (Kolesnikov et al., 2015) repositories. Raw values for each data set were imported into R (Ihaka and Gentleman, 2012), assessed for quality, and further analyzed with Bioconductor packages (Gentleman et al., 2004; Reimers and Carey, 2006) (codes available on request).
GV, germinal vesicle; MI, metaphase I; MII, metaphase II.
Data sets were converted into an expression set with “affy” package (Gautier et al., 2004) and normalized by “GCRMA” algorithm (Gharaibeh et al., 2008). After GCRMA normalization, the probes were filtered to retain only those whose normalized values were >0.5 in all arrays of that study. The microarray's platform identifiers were annotated with the corresponding species NCBI ENTREZ gene identifier (Maglott et al., 2011). Multiple probes matching to one gene were filtered to retain the probe with the highest average of expression value, and downstream analyses were conducted at the gene level. For this study, standard practices for reproducible computational research (Sandve et al., 2013) were adopted.
Interspecies comparative gene expression
The ortholog database was downloaded from Mouse Genome Informatics repository (ftp://ftp.informatics.jax.org/pub/reports/HOM_AllOrganism.rpt, June 9, 2016) and mouse or cattle Entrez gene identifiers were mapped to the corresponding human orthologs. Genes not mapped to the ortholog database were eliminated from the interspecies comparative analyses.
The expressed genes matching to the ortholog database in all arrays were used for Principal component analysis with package “FactorMineR” (Lê et al., 2008). Intersection of genes expressed in all arrays was obtained using the concept (Lex and Gehlenborg, 2014) and the package “upsetR.” Comprehensive hierarchical clustering of all microarrays was performed with “varclust” function of the package “Hmisc,” using Pearson's correlation coefficient as similarity. The strength of data support to the resulting dendrogram was computed by bootstrapping (10,000 samplings) using the package “pvclust” (Suzuki and Shimodaira, 2006).
After sub setting the data to retain the 5701 genes expressed in all arrays, Pearson's correlation coefficients (r) between each of mouse or cattle arrays from MII oocytes and human arrays (also MII oocytes) were calculated using “cor” function in R software. The correlation coefficients were transformed according to Fisher's z algorithm (Corey et al., 1998; Silver and Dunlap, 1987) using “fisherz” function in R, and the range of distribution was statistically assessed with Tukey's test (Tukey, 1949) using “TukeyHSD” function in R software.
Coexpression analysis of species-specific expressed genes
For the human data set, a gene was considered as having species-specific expression if it was not expressed in any of the macaque, mice, or cattle microarrays analyzed (Table 1). For mice or cattle, a gene was considered as having species-specific expression if the gene was (i) expressed in all microarrays of the same species and (ii) not expressed in any samples of the other three species analyzed in this study.
Pair-wise gene coexpression analyses were performed after the calculation of Kendall's tau coefficient of correlation (τ) (Daniel, 1990), which is suitable for finding gene pathways (Kumari et al., 2012; Skinner et al., 2011). For clustering of the correlations, the dissimilarity was calculated as 1 − τ and the clustering was performed with average method using the package “flashClust” (Langfelder and Horvath, 2012). Groups of genes were accessed for enrichment of “biological process” and “molecular function” found in the Gene Ontology (GO) database (Ashburner et al., 2000) using “GOstats” package (Falcon and Gentleman, 2007) in R software. We used the genes expressed in the arrays for the respective species as a background for the enrichment testing. Probabilities of significance were adjusted for multiple hypothesis testing using the Benjamini–Hochberg false discovery rate (FDR) (Benjamini and Hochberg, 1995). Clusters of genes were considered enriched for a specific GO term if FDR <0.05.
Differential gene expression analysis of oocyte developmental competency
Three of the data sets generated from MII oocytes were used to for differential gene expression analyses. These data sets represent two developmental models of oocyte competence, namely, age of the female, and in vivo versus in vitro maturation. For the data set E-MEXP-2347, the samples corresponding to the two groups were MII oocytes collected from women 28 to 36 or 37 to 39 years of age. For GSE11667, the samples corresponding to the two groups were MII oocytes collected from mice 6 to 12 weeks or 60 to 70 weeks of age. For GSE12327, the samples corresponding for the two groups were in vivo matured or in vitro matured oocytes. Differential gene expression was obtained with “limma” package (Ritchie et al., 2015; Smyth, 2004) in R software.
Probabilities of significance were adjusted for multiple hypothesis testing using FDR. Different FDR thresholds were chosen for the data sets to subset genes with statistical significance p < 0.005. Genes were inferred as having association with developmental competence of oocytes if they were differentially expressed in two data sets and had the same direction of expression according to the biological model of developmental competency. Functional enrichment was investigated for the selected genes using “GOstats” package in R software. Probabilities of significance were adjusted for multiple hypothesis testing using FDR. A term was inferred as enriched if FDR <0.05.
Results
Overview of oocyte expression data sets
Seven studies quantified the genome-wide expression of oocytes in human (Grøndahl et al., 2010), monkey (Lee et al., 2008), cattle (Kues et al., 2008; Mamo et al., 2011; Regassa et al., 2011), and mice (Pan et al., 2008; Su et al., 2007) using the Affymetrix platform, and deposited the raw data in public repositories (Table 1). Data from 67 microarray chips, 19 from oocytes at GV stage, and 48 from oocytes at MII stage are in the public domain and were used in this study. Using a consistent analytical procedure for all microarrays, there were 15,558, 11,970, 12,713, and 9963 genes expressed in human, monkey, mice, and cattle oocytes, respectively (Table 2), with normalized expression value >0.5 in all microarrays within each study.
Comparative analyses of oocyte transcriptome in human, monkey, mice, and cattle
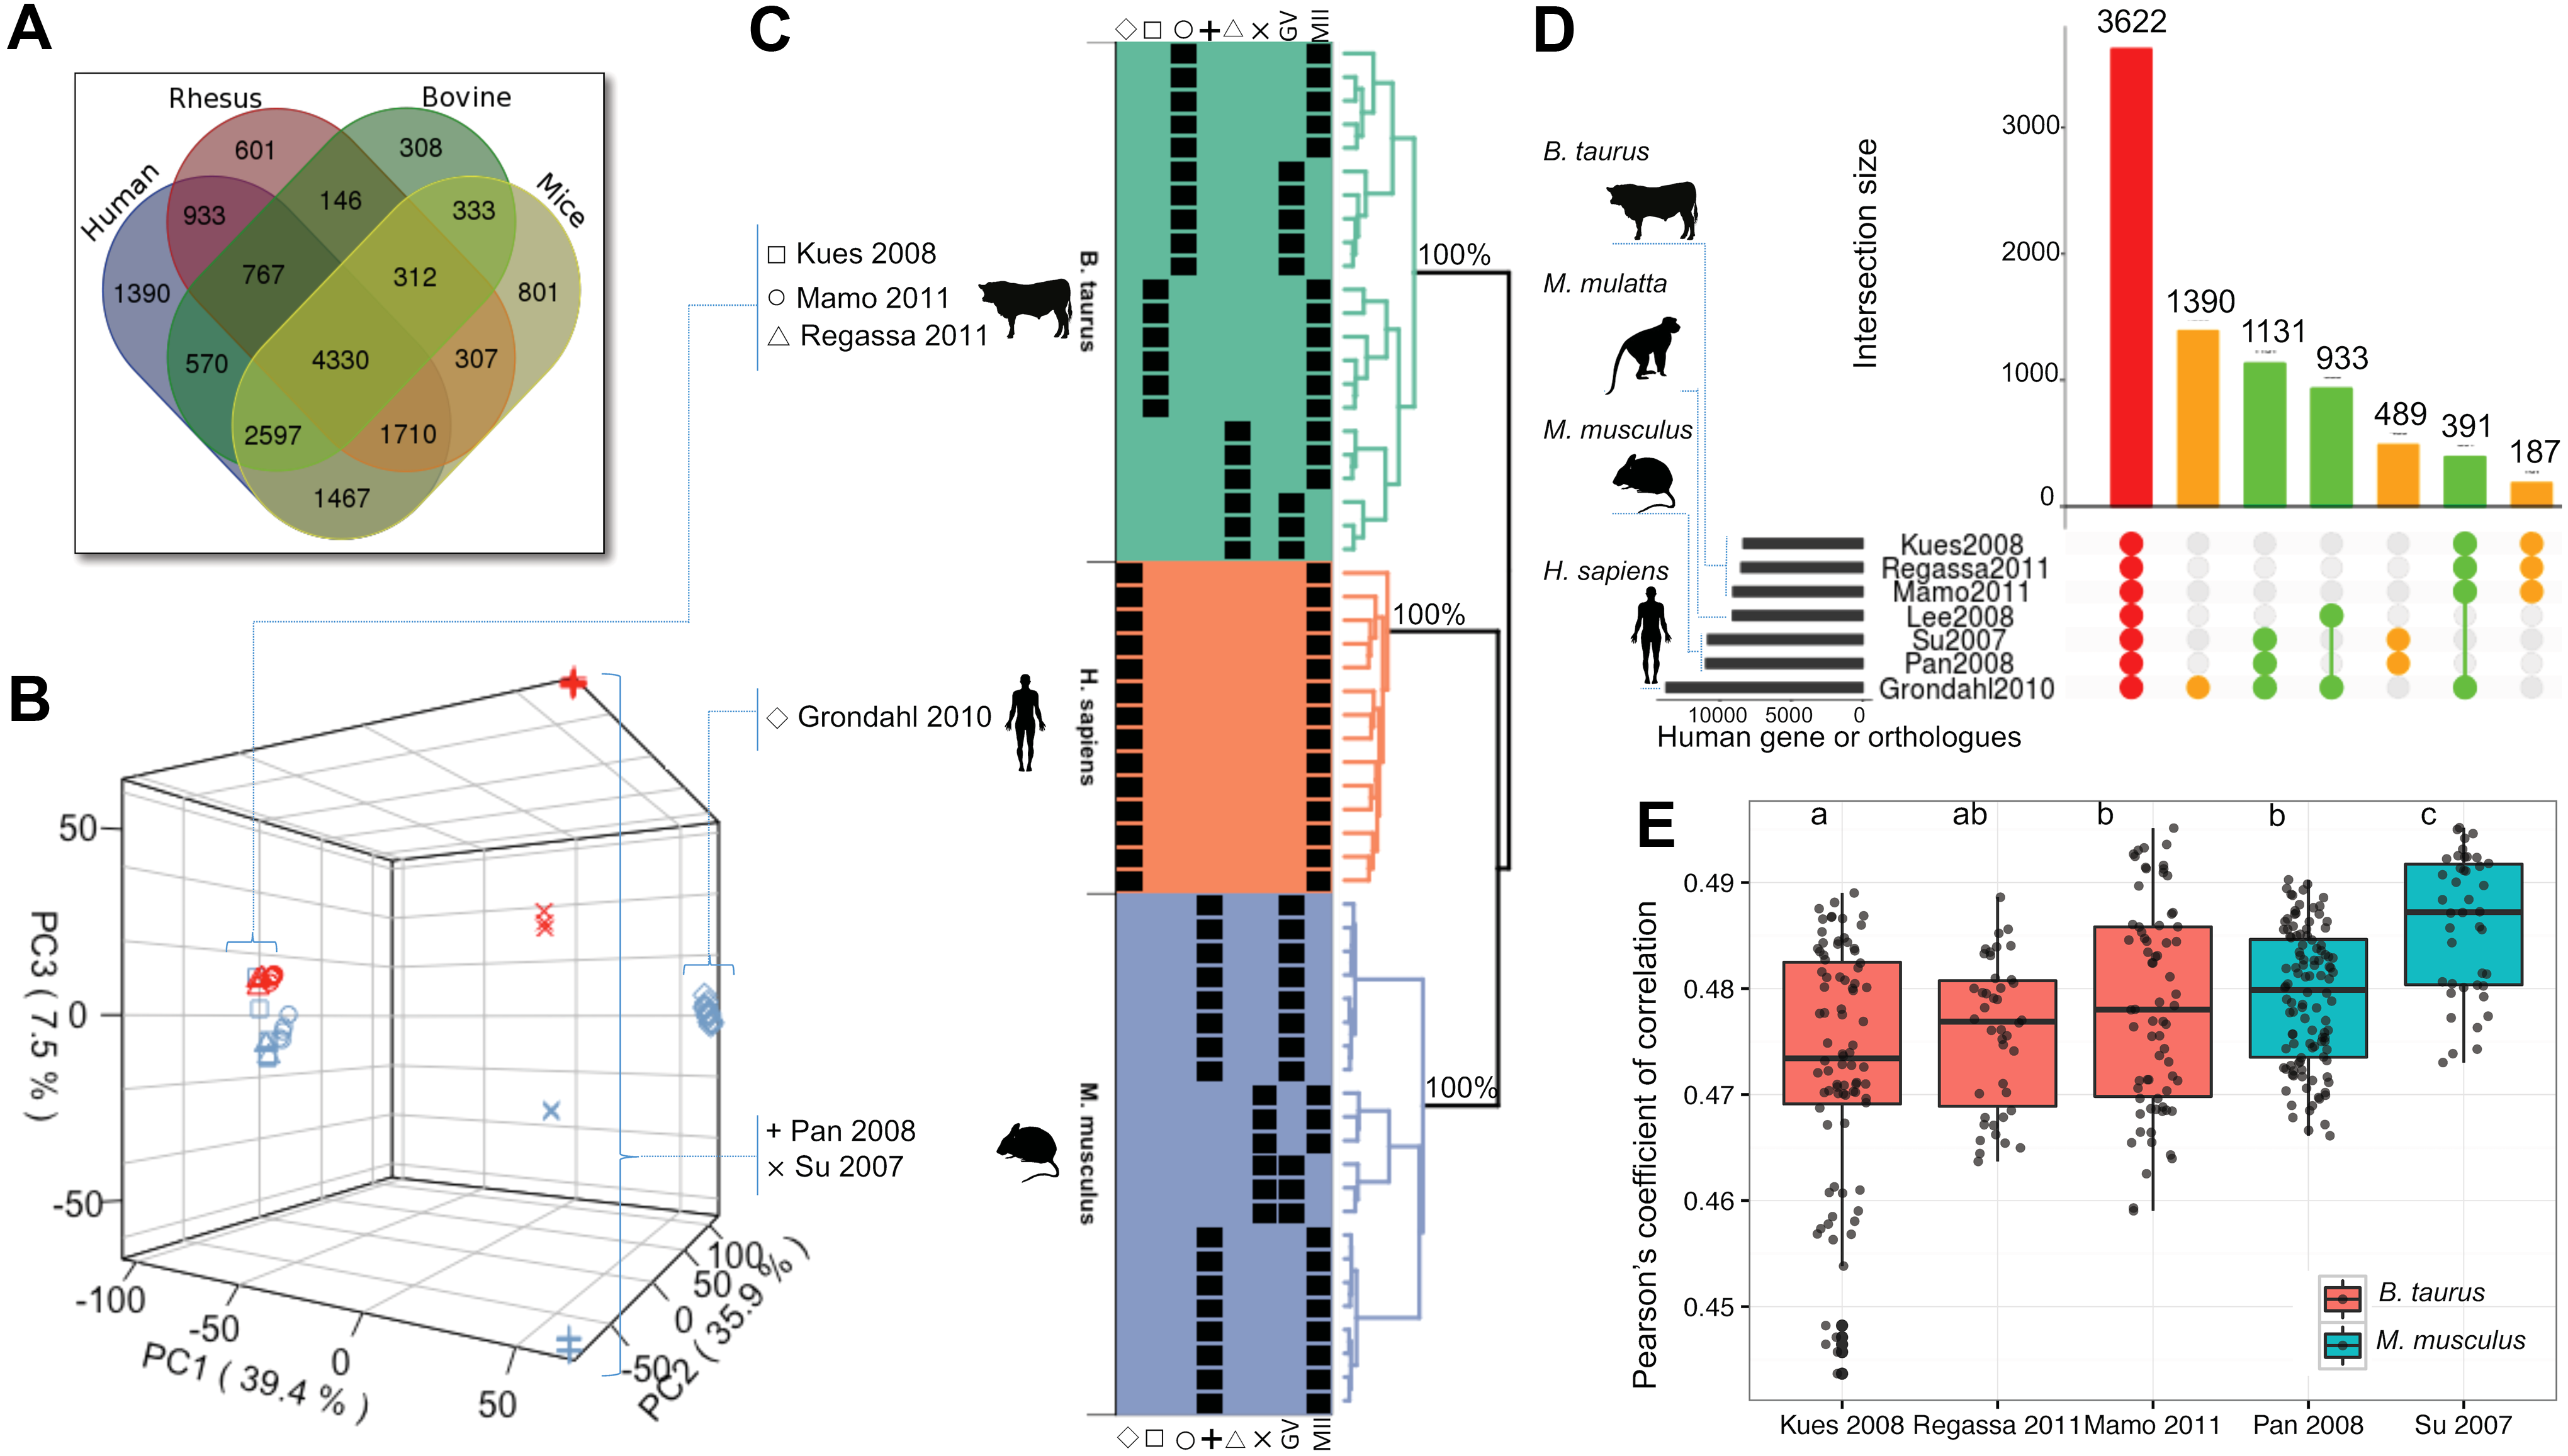
To allow a comparative analysis across species, all gene identifiers of the each microarray were matched to the corresponding human gene identifier as per gene homologous annotation from Mouse Genome Database (Bult et al., 2016; Eppig et al., 2015). For the data collected from human, monkey, mice, and cattle microarrays (Table 1), 13,764, 9106, 10,984, and 9079 genes were annotated in the homology database (Table 2). Among the 4 species, there were 16,572 genes expressed in oocytes (GV or MII) and 4330 were expressed in at least 1 data set of all 4 species (Fig. 2A).
Multispecies comparison of gene expression in oocytes.
Principal component analysis of the human, mice, and cattle genes expressed in oocytes highlighted that species was a major source of variation among data sets, followed by oocyte stage (GV or MII, Fig. 2B). Using Pearson's coefficient of correlation (r) as similarity metric, the data robustly clustered the samples by species (Fig. 2C, p = 100%, 10,000 bootstrap samplings). There was greater similarity of the gene expression data between human and mice (Fig. 2C). For cattle and mice data sets, the samples clustered by study and then by stage (Fig. 2C).
The clustering of the human, mice, and cattle using oocyte gene expression data is well aligned with the evolutionary proximity of these species, thus validating the cross-species variation presented in these data sets. The monkey data (Lee et al., 2008) clustered independently from all three species (human, mice, and cattle, Supplementary Fig. S1), which was likely caused by technical rather than biological variation, thereby not being biologically meaningful. Therefore, the gene expression data generated from rhesus monkey oocytes (Lee et al., 2008) were excluded from further quantitative comparison among species.
A qualitative and study-centered observation of the overlapping genes expressed in oocytes showed that 3622 human or human homologous genes were expressed in all microarrays for four species (Fig. 2D). Several genes were exclusively expressed in human (N = 1390), mice (N = 489), and cattle (N = 187) oocytes. Within species, mice and cattle data sets showed consistent expression across studies, with 84% and 85% of genes with corresponding human homologs expressed in all samples, respectively (Supplementary Fig. S2). Querying the data for specific overlapping gene expression between species revealed that 1131 genes were expressed in all human and mice oocyte samples but not in other species, 933 genes were expressed in all human and monkey samples but not in other species, and 391 genes were expressed in human and cattle samples, but not in other species analyzed (Fig. 2D and Supplementary Fig. S3).
Comparison of Pearson's coefficient of correlation between the microarray data generated from MII oocytes for each study (Kues et al., 2008; Mamo et al., 2011; Pan et al., 2008; Regassa et al., 2011; Su et al., 2007) and the human MII oocyte data set (Grøndahl et al., 2010) showed different proximity among them (Fig. 2E). One cattle data set (Kues et al., 2008) showed lowest average of correlation coefficient with human data set (
Functional analyses of genes specifically expressed in human oocytes
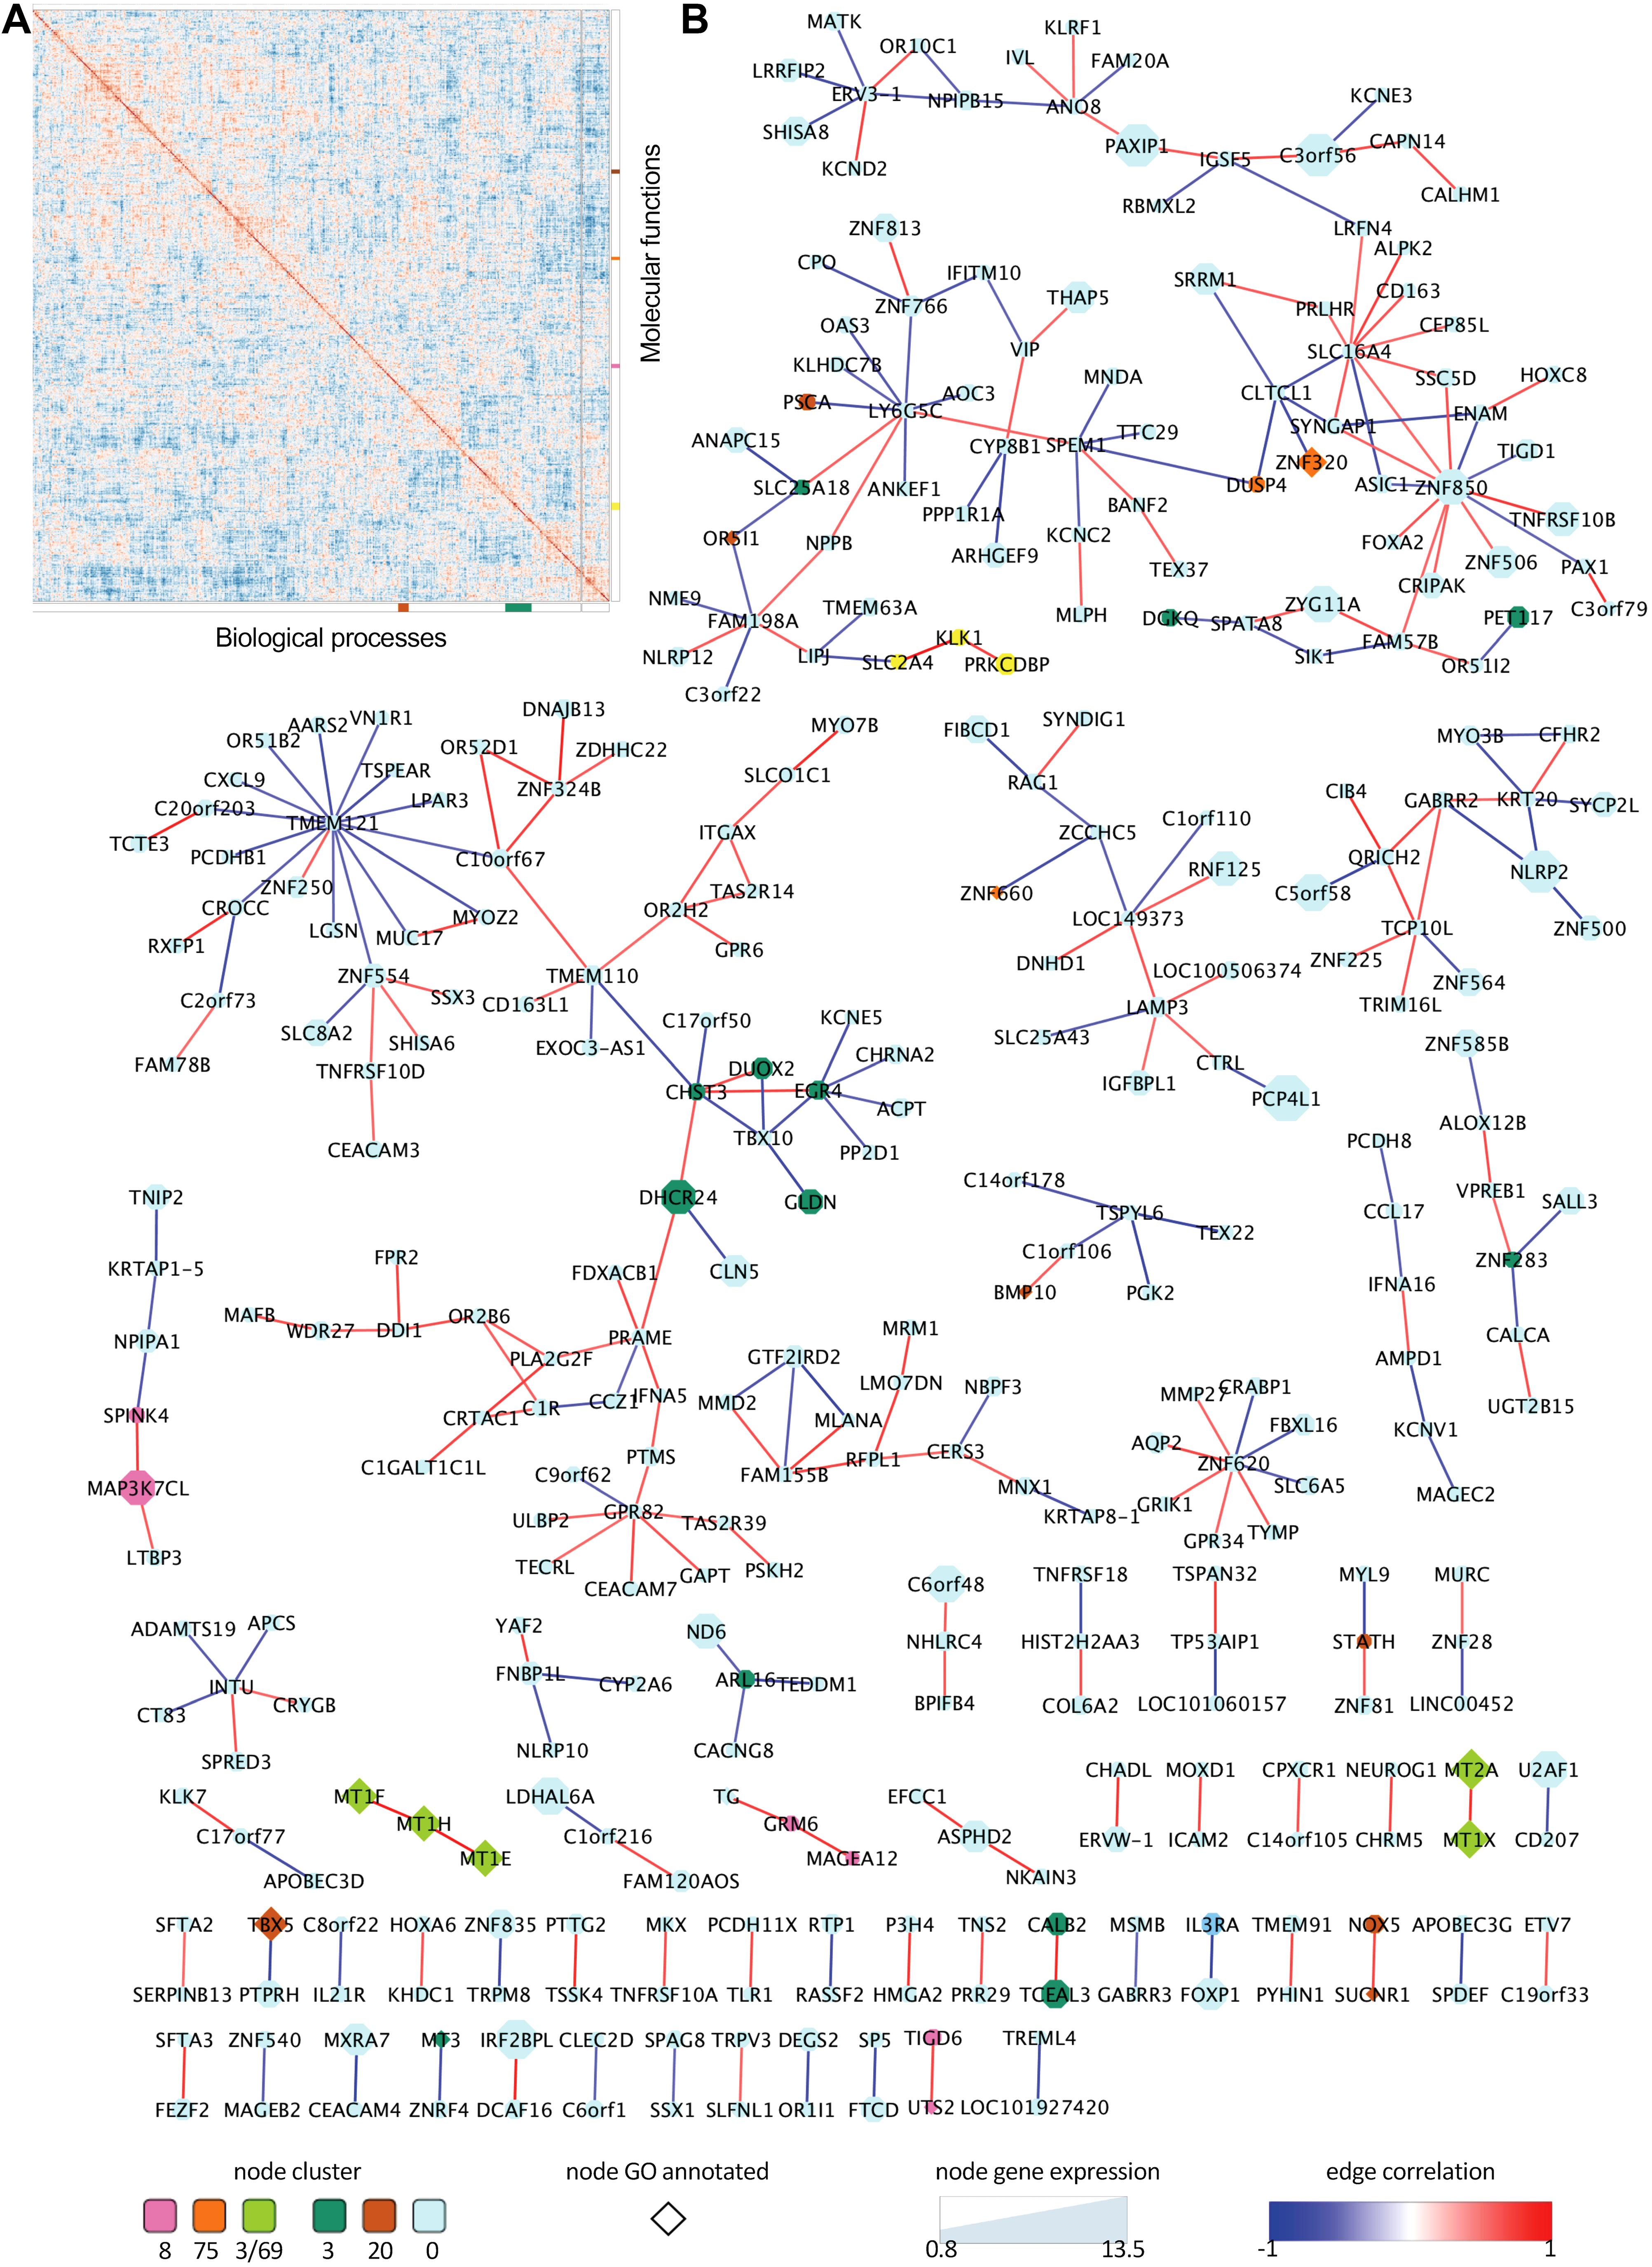
Out of 13,764 genes expressed in MII human oocytes, with homologous genes annotated for monkey, mice, or cattle, ∼10% showed specific expression in human (N = 1390). The gene coexpression approach was undertaken to investigate the functional ontology of those 1390 genes. Following the calculation of Kendall's tau correlation coefficient for each pair of genes, the coefficients were used as similarity metric for gene clustering (Fig. 3A). Enrichment test for GO terms of Biological Process and Molecular Function was performed at different heights of the clustering tree with redundant results at different heights, which is supporting evidence of association of some clusters with some GO functional terms (Fig. 3A). The clusters formed at the highest cutting threshold with the most representative GO terms are presented in the main text.
Network analyses of genes specifically expressed in human MII oocytes.
Testing for GO term enrichment revealed two modules of coexpressed genes enriched (FDR <0.05) for Biological Processes (Fig. 3A and Table 3). Cluster 3 (green label) presented genes (ATP2B4, F3, IFNG, MT1E, MT1F, MT1H, MT1X, MT2A, MT3) enriched for the functional terms “cellular response to metal ion” and “negative regulation of growth.” Module 20 (brown label) presented four genes (BMP10, PSAPL1, TBX5, WNT2) annotated with terms linked to regulation of development, growth, or proliferation of organ, tissue, or cell. There were four clusters that showed enrichment (FDR <0.05) for GO Molecular Functions (Fig. 3A and Table 4). Cluster 8 (pink label) grouped genes (CCK, TG, UTS2) with enrichment for “hormone activity.” Cluster 20 (brown label) presented genes (CXCR2, OR5I1, SUCNR1, TLR8) enriched for “receptor activity.” Cluster 69 (yellow label) grouped genes (MT1E, MT1F, MT1H, MT1X, MT2A, PGLYRP2) with enrichment for “zinc ion binding.” Cluster 75 (orange label) grouped genes (GABPB2, ZCCHC24, ZFP1, ZNF320, ZNF660, ZNF700, ZNF853) functionally related to “cation binding” or “nucleic acid binding” or “metal ion binding.”
FDR, false discovery rate; GO, Gene Ontology.
Given the large number of genes with expression detected in human oocyte only, an investigation of coexpression networks was conducted with those pairs of genes with significant correlated expression (p < 0.05). Notably, 345 genes composed 309 pairs with coexpression (Fig. 3B). Despite the retention of pairs of genes with significant correlation, the network presented the scale-free physical property if hierarchical networks, as demonstrated by the power law, fitted distribution of number of nodes by degree of connection (Supplementary Fig. S4). The four genes (1% of the network) that had the greatest connectivity were TMEM121, ZNF850, SLC16A4, LY6G5C (degree = 15, 12, 10, 9, respectively).
Expression of genes associated with oocyte developmental competence
Four data sets collected and reanalyzed presented two distinct models of developmental competence of oocytes, namely: (i) aging of the female and (ii) in vitro maturation of oocytes (Table 5). In all four data sets, independent analyses of differential gene expression, contrasting oocytes with high or low developmental competence, identified several genes whose expression was associated with oocyte potential to develop an embryo (Table 5). Different stringency thresholds were selected to allow for identification of genes whose expression is associated with oocyte quality, yet under the stringent control for multiple hypothesis test. In all selected FDR thresholds, raw p value was <0.005.
DEG, differentially expressed gene.
Comparative analysis of the differentially expressed genes (DEGs) in four data sets revealed little overlap of DEGs associated with oocyte quality (Fig. 4A). There was no DEG associated with oocyte quality in three of the four studies, and all overlaps occurred between two studies (Fig. 4A). Seventy-seven DEGs were common to two studies. Sixty-eight DEGs overlapped between the results obtained from mice (Pan et al., 2008) and cattle (Kues et al., 2008) data sets, six DEGs overlapped between the results obtained from mice (Pan et al., 2008) and monkey (Lee et al., 2008) studies, and three DEGs were associated with oocyte quality in both monkey (Lee et al., 2008) and cattle (Kues et al., 2008) studies (Fig. 4A).

Multispecies comparison of DEGs associated with oocyte developmental competence.
Most surprisingly, there was a trend for inversed correlation (r = −0.34, p < 0.05) for the fold change of the same DEGs identified in two studies. Forty-nine genes were upregulated in good-quality oocytes in one study but they were downregulated in another study. Only 28 DEGs presented equivalent direction of expression in 2 studies when oocytes of good developmental competency were compared with counterparts of poor developmental competency (Fig. 4B and Table 6).
FC, fold change.
Functional investigation of the 28 DEGs showing concordant direction of expression in good- versus poor-quality oocytes showed no enrichment of GO Biological Process or Molecular Function (FDR >0.1). Nonetheless, it is noteworthy that seven genes (AKAP1, ISY1, MRPL10, NAA15, POLR2B, SUCLG1, ZNF638) were related to poly(A) RNA binding. Notably, these 28 DEGs showed enrichment of GO terms associated with cellular compartment (Fig. 4C). Interestingly, 26 genes (AK2, AKAP1, CCSER2, DCTN3, DUSP1, ECHS1, EIF3B, IFT122, KDELR2, MINA, MRPL10, MRPL24, NAA15, NUP50, NUP54, POLR2B, PTRH2, RFX7, STX17, SUCLG1, SUOX, TOB2, TOMM34, UBE2T, ZBTB45, ZNF638) were annotated with the significantly enriched GO term “intracellular organelle” (FDR <0.01, Fig. 4C). Remarkably, 10 genes (AK2, AKAP1, ECHS1, MRPL10, MRPL24, PTRH2, STX17, SUCLG1, SUOX, TOMM34) were annotated with the significantly enriched GO term “mitochondrion” (FDR <0.01, Fig. 4C).
Discussion
Systematic analysis of existing data sets has gained increasing importance for the discovery of molecular features associated with biological phenotypes or phenomena (Plocik and Graveley, 2013). In the current study, I report a meta-analysis (Haidich, 2010) using seven microarray data sets from human, macaque, mice, and cattle oocytes. First, I focused on species-specific gene expression with an in-depth functional analysis of the genes specifically expressed in human oocytes. Next, I reanalyzed four data sets that characterized the transcriptome of oocytes of contrasting developmental potential to find commonalities in DEGs and direction of expression. The results reported here are relevant to different branches of developmental biology; they provide new insights regarding the interspecies complexity of the oocyte transcriptome and the long quest for molecular biomarkers of healthy oocytes.
All 7 data sets explored in this study generated a collection of more than 16,000 genes expressed in oocytes from 4 species. Clustering of multispecies based on gene expression data produces variable results depending on the tissue selected (Brawand et al., 2011). In this study, the robust phylogenetic tree produced by oocyte gene expression data was consistent with the human, mouse, and cattle species phylogeny generated by whole-genome data (Prasad et al., 2008; Sims et al., 2009). Nonetheless, the samples from monkey clustered as an outlier of this tree (Supplementary Fig. S1). Phylogenetic trees produced from diverse tissues place macaques closer to humans comparative with mice (Brawand et al., 2011).
Therefore, this outlier positioning of macaque oocyte samples is unlikely to be a consequence of the evolution history of macaque, and it may have been caused by an unknown bias in the data set. The phylogenetic relationship among human, mice, and cattle was supported by the number of overlapping genes between human and mice, and human and cattle that are expressed in oocytes. Moreover, the correlation of expression levels of genes expressed in MII oocytes further confirmed the phylogenetic tree among human, mice, and cattle.
The differentiation of morphological or physiological phenotypes among species is not always depend on the gain or loss of gene function, but are also related to changes in gene regulation (Brawand et al., 2011; Romero et al., 2012). This investigation revealed 3622 genes expressed in oocytes of human, macaque, mice, and cattle that may represent the core gene expression of GV and MII oocytes among these four species.
To understand the nature of species-specific gene expression, the homologous genes were overlapped according to their on/off status. Interestingly, there were 1390, 489, and 187 genes with expression detected exclusively in human, mice, and cattle oocytes. The species-specific gene expression in MII oocytes is strongly suggestive of an evolutional pressure on gene regulation (Romero et al., 2012) of oocytes. The number of genes may be slightly biased toward human due to the limited number of samples studied, the use of human-centered gene homology, and the different stages of functional annotation of the genomes.
Nonetheless, the rigorous constrain of qualitative overlapping of genes that were expressed in all samples and according to their on/off status makes this result invaluable for the understanding of the gene regulation in oocytes of different species. In addition, it shows potential shortcomings related to the use of animal models to research the oocyte biology in eutherians. For instance, if an investigation using an animal model makes inferences related to specific genes or networks expressed in oocytes, the consultation of whether the gene is specifically expressed in that animal model may guide the translational potential, or lack thereof, of that inference to humans.
The results of functional analysis of the 1390 genes expressed in human oocytes but not in macaque, mice, and cattle, suggested the evolution of hierarchical gene regulatory networks (Barabási and Oltvai, 2004; Erwin and Davidson, 2009) in human oocytes. The clustering of the expression of those genes and further testing for GO enrichment revealed functional modules (Dong and Horvath, 2007) of gene expression that are likely relevant for fertility in humans.
For example, the results highlighted genes related to the response to zinc ion. The regulation of meiosis progression in mammals is dependent on the zinc-dependent signaling (Bernhardt et al., 2012; Kim et al., 2010, 2011), possibly triggered by fertilization (Que et al., 2015). While in mice the mechanism of zinc efflux is dependent on ZIP6 and ZIP10 proteins (Kong et al., 2014), it remains unknown how human oocytes modulate the fertilization-induced zinc spark. Potential differences in zinc homeostasis have been described between human and mice oocytes (Duncan et al., 2016), and the results presented here are suggestive that, in human oocyte, metallothioneins play a role in controlling zinc homeostasis (Palmiter, 2004).
Another supporting evidence of functional importance of those genes was the formation of a hierarchical, scale-free network from their coexpression (Barabási and Oltvai, 2004; Erwin and Davidson, 2009). Despite the dependency on the accuracy of the homology annotation, collectively, the results show cohesive evidence that oocytes are conserved cells, but existing physiological distinctions across species likely controlled by regulatory networks, that changed with the speciation process.
Quantitative analysis of the genes expressed in multiple species was not conducted because the inferences heavily rely on orthogonal conservation of gene function and networks (Okyere et al., 2014). However, analysis of orthologous gene expression has been successfully used to find candidate genes associated with contrasting phenotypes in mammals (Grigoryev et al., 2004; Kobayashi et al., 2010; Kristiansson et al., 2013; Uosaki and Taguchi, 2016). Therefore, comparative gene expression was used to search genes associated with the developmental potential of oocytes at MII stage of development. Given the high number of genes expressed in all four species analyzed in the present study, and the limited number of genes whose expression is limited to one species, one would hypothesize that the expression of genes associated with oocyte developmental potential is highly conserved across species.
Moreover, it would be expected that studies using similar models of assessment of oocyte developmental competency would have a greater number of overlapping DEGs. Unexpectedly, there was a small number of DEGs associated with oocyte quality in two studies. The greatest overlapping occurred between the bovine (Kues et al., 2008) and mice (Pan et al., 2008) studies that used different models of developmental competence. Further investigation on the direction of expression revealed that <50% of the DEGs common to two studies presented equivalent direction of expression according to oocyte developmental potential. Collectively, these results suggest that the scientific community must exercise caution when extending the inferences related to gene expression associated with oocyte quality to other eutherians.
Comparing the 26 DEGs associated with oocyte developmental competence showed one gene overlapping with previous reports associating gene expression with oocyte quality. The gene dual specificity phosphatase 1 (DUSP1) was previously identified with higher expression in oocytes with lower developmental potential (O'Shea et al., 2012). The role of DUSP1, also known as mitogen-activated protein kinase phosphatase-1, in oocytes is unknown. In somatic cells, it has been documented that the expression of DUSP1 is stimulated by the follicle-stimulating hormone (Khan et al., 2015) or glucocorticoids (Shipp et al., 2010), and the protein DUSP1 interacts with MAP kinases with inhibitory consequences (Cheng et al., 2015; Moncho-Amor et al., 2011).
In oocytes of most eutherians, with exception of mice, the MAPK pathway is activated playing a role of stabilizing Maturation Promoting Factors (Yamashita et al., 2000), which has a central function for the oocyte maturation (Ferreira et al., 2009). In bovine and monkey, the upregulation of DUSP1 in oocytes of poor quality is likely to reduce the MAPK–MFP network needed for proper oocyte maturation.
The 26 genes associated with oocyte developmental competence and with equivalent direction of expression in at least two studies did not show enrichment for Biological Processes or Molecular Function. Nonetheless, there was enrichment for terms linked to Cellular Compartment and most genes were associated with proteins present in the mitochondria organelle. Mitochondria are key organelles that regulate calcium signaling, ATP production, and the production of reactive oxygen species for proper oocyte function (Dumollard et al., 2007; Wang et al., 2009).
Specific for the oocyte developmental competence, it has been demonstrated that mitochondria content and function are directly linked to fertilization outcome (Cagnone et al., 2016; El Shourbagy et al., 2006; Reynier et al., 2001; Santos et al., 2006). Even though the biological consequences of the dysregulation of those 10 genes are uncertain, the effects of this altered gene expression are likely negative for the mitochondrial function. Collectively, the DEGs identified in these analyses further support the implication of the mitochondrial function as a central determinant of the oocyte developmental competence (Wang et al., 2009).
Conclusions and Expert Outlook
The results presented here show that 4330 genes compose the core transcriptome of oocytes in multiple eutherians (human, macaque, mice, and cattle). The remainder of the oocyte transcriptome (over 50%) is composed by mRNAs with expression restricted to one or some specific species. As demonstrated for genes specifically expressed in human oocytes, the species-specific gene regulation is poised to have functional consequences toward building a developmentally competent oocyte. Finally, 26 genes emerged from a multispecies analysis as potential biomarkers of oocyte developmental competence. The results strongly support that healthy mitochondria are key contributors for the physiology of a healthy oocyte.
We are still far from understanding the underlying physiological differences of oocytes among eutherians. Even more challenging is the task of understanding the molecular blueprint that differentiates a developmentally competent oocyte from one that cannot sustain an embryo development. These results collectively offer new insights on oocyte developmental competence and the central role of mitochondrion for oocyte health. Caution should be exercised, however, when extending the inferences related to gene expression associated with oocyte quality to other eutherians.
Footnotes
Acknowledgments
I am indebted to all the researchers who made their data sets available in public repositories. Likewise, I am thankful for the creators and maintainers of public repositories, GEO and ArrayExpress, and for the comments from anonymous reviewers.
Author Disclosure Statement
The author declares that no conflicting financial interests exist.
Abbreviations Used
References
Supplementary Material
Please find the following supplemental material available below.
For Open Access articles published under a Creative Commons License, all supplemental material carries the same license as the article it is associated with.
For non-Open Access articles published, all supplemental material carries a non-exclusive license, and permission requests for re-use of supplemental material or any part of supplemental material shall be sent directly to the copyright owner as specified in the copyright notice associated with the article.