




Abstract
Abstract
Bovine milk is important for both veterinary medicine and human nutrition. Understanding the bovine milk proteome at different stages of lactation has therefore broad significance for integrative biology and clinical medicine as well. Indeed, different lactation stages have marked influence on the milk yield, milk constituents, and nourishment of the neonates. We performed a comparative proteome analysis of the bovine milk obtained at different stages of lactation from the Indian indigenous cattle Malnad Gidda (Bos indicus), a widely available breed. The milk differential proteome during the lactation stages in B. indicus has not been investigated to date. Using high-resolution mass spectrometry-based quantitative proteomics of the bovine whey proteins at early, mid, and late lactation stages, we identified a total of 564 proteins, out of which 403 proteins were found to be differentially abundant at different lactation stages. As is expected of any body fluid proteome, 51% of the proteins identified in the milk were found to have signal peptides. Gene ontology analyses were carried out to categorize proteins altered across different lactation stages based on biological process and molecular function, which enabled us to correlate their significance in each lactation stage. We also investigated the potential pathways enriched in different lactation stages using bioinformatics pathway analysis tools. To the best of our knowledge, this study represents the first and largest inventory of milk proteins identified to date for an Indian cattle breed. We believe that the current study broadly informs both veterinary omics research and the emerging field of nutriproteomics during lactation stages.
Introduction
T
Although there are sufficient reports on diverse composition and biological functions of bovine milk, the dynamics of relative abundances of milk proteins at different lactation stages for any of the Indian breeds have not been investigated till date. Therefore, we subjected whey component of the milk collected from multiple cows during different lactation stages to quantitative proteomic analysis. We used Malnad Gidda cattle breed (Bos indicus) to study the temporal expression of milk proteins at different lactation stages using high-resolution Fourier transform LC-MS/MS analysis.
Malnad Gidda is a unique dwarf indigenous breed with compact body frame weighing around 80–120 kg and is native to heavy rainfall areas of the Western Ghats and coastal region of Karnataka, India (Ramesha, 2001). It is greatly preferred by the farmers because of the low maintenance cost and its adaptable nature to the agroclimatic conditions of the Western Ghats (Ramesha et al., 2013). The average lactation milk yield, daily milk yield, peak yield, and intercalving period among the elite cows under field condition was 522.3 ± 69.4 L, 2.2 ± 0.3 L, 3.4 ± 0.4 L, and 14.9 ± 0.9 months, respectively. The percentage composition of fat, protein, lactose, and solid nonfat among Malnad Gidda cow's milk was 5.7, 3.4, 4.8, and 9.2, respectively. Malnad Gidda cattle are found to have reproductive uniqueness and their milk was reported to have high lactoferrin content (225.2 ± 31.4) (Ramesha et al., 2015).
In the current study, we attempted to explore the altered bovine milk proteome at different lactation stages using tandem mass tag (TMT)-based quantitation and mass spectrometry analysis. We identified 564 proteins, which are the largest inventory of milk proteins from B. indicus till date, out of which 403 proteins were found to be differentially abundant across different lactation stages. Functional analysis and literature survey also revealed the significance of expression of proteins in respective lactation stages. To the best of our knowledge, this is the first and preliminary investigation of milk proteome collected from early, mid, and late lactation stages of Malnad Gidda, a dwarf and unique indigenous breed of India.
Materials and Methods
Sample collection
For this study, healthy Malnad Gidda cows were selected under the field milk recording program conducted at National Dairy Research Institute (NDRI), Bangalore. Milk samples were collected from three individuals of early (15 days to 3 months of postpartum), mid (3–6 months of postpartum), and late (6–9 months of postpartum) lactation stages. Exact days of collection of milk from each animal and associated detail are given in Supplementary Table S1(Supplementary Data are available online at www.liebertpub.com/omi). The milk collection was done through routine hand milking procedure practiced by cattle rearing farmers.
Therefore, it is waived from ethical clearance. Somatic cell count (SCC) for all the samples were performed using NucleoCounter® SCC-100™ system (ChemoMetec, Denmark) as per the manufacturer's guidelines. The SCC of all samples were in the normal physiological limits of <100,000 cells/mL, which indicates that the individuals used for this study were free of any infection. Collected samples were stored at −80°C until further analysis.
Milk fractionation and casein depletion
Milk samples were processed as previously described (Reinhardt et al., 2013) with slight modifications. Samples were thawed and ultracentrifuged using Beckman Coulter Optima XPN-90 ultracentrifuge (90 Ti rotor 50,000 g for 20 min, 4°C). The whole milk was fractionated into casein pellet and exosome fraction at the bottom, the supernatant of crude whey fraction in the middle, and a fat layer on the top. The crude whey fraction was separated out for further analysis.
To increase the proteome discovery, high abundant protein such as casein was depleted from the crude whey by isoelectric precipitation using sodium acetate buffer (3 M, 4.6 pH, 27°C). Later, it was centrifuged at 5000 rpm for 5 min, and the resulted casein pellet was discarded. Depletion efficiency of casein from whey was further confirmed by loading the sample in 10% sodium dodecyl sulfate–polyacrylamide gel electrophoresis. Protein amount of 50 μg from three individuals of early lactation stage was pooled for further analysis; the same procedure was applied for mid and late lactation samples. An overview of the experimental design and labeling strategy is provided in Figure 1.

Schematic work flow followed for the quantitative proteomic analysis of bovine milk in different lactation stages. Whey fraction was separated from whole milk of early, mid, and late lactation stages; casein was depleted using isoelectric precipitation; protein was then digested to peptides and labeled with TMT reagents; and samples were then pooled and fractionated using basic reverse phase liquid chromatography. LC-MS/MS analysis of the fractions was carried out in replicates using high-resolution mass spectrometer. The mass spectrometry data were analyzed against a protein database of Bos taurus.
In-solution digestion and TMT labeling
An amount of 150 μg of protein from each lactation stage was subjected to reduction using 5 mM dithiothreitol (in 50 mM triethylammonium bicarbonate (TEABC) buffer, 60°C, 30 min) followed by alkylation using 20 mM iodoacetamide (in 50 mM TEABC, 10 min in the dark at room temperature). The reduced and alkylated proteins were then subjected to buffer exchange with 9 M urea, and the final urea concentration was bought down to <2 M using 50 mM TEABC buffer using 30 kDa MWCO spin filters (EMD Millipore, Billerica, MA). This was followed by in-solution digestion using modified sequencing grade Trypsin (1:50) (Promega, Madison, WI) with overnight incubation at 37°C.
Digested peptides from early, mid, and late lactation stages were separately labeled with three of 6-plex TMT reagents according to the manufacturer's instructions. The digested peptides were dried and reconstituted in 50 mM TEABC (pH 9.5) and added to corresponding TMT reagents dissolved in anhydrous acetonitrile. Early, mid, and late lactation peptides were labeled with 131, 130, and 129 TMT reagents, respectively, and incubated at room temperature for 2 h. The reaction was quenched by the addition of 5% hydroxylamine. The labeled peptides from three lactation stages were then pooled for fractionation.
Fractionation using basic pH RPLC
Fractionation of pooled labeled peptides was carried out as described earlier (Selvan et al., 2014). Samples were reconstituted in 1 mL basic reverse phase liquid chromatography Solvent A (10 mM TEABC in 5% acetonitrile, pH 9.5). By employing an increasing gradient of 7–100% Solvent B (10 mM TEABC in 95% acetonitrile, pH 9.5), peptides were fractionated in XBridge C18, 5 μm, 250 × 4.6 mm column (Waters Corporation, Milford, MA) with a flow rate of 500 μL/min for 120 min on an Agilent 1200 series HPLC system. The eluting peptides were collected in a 96-well plate and were concatenated to obtain 12 fractions. The peptides were concentrated by vacuum centrifugation and subjected to C18 StageTip cleanup before LC-MS/MS analysis.
LC-MS/MS analysis
Fractionated samples were analyzed on Orbitrap Fusion Tribrid mass spectrometer (Thermo Scientific, Bremen, Germany) interfaced with Proxeon Easy-nLC II system (Thermo Scientific). The peptides were first loaded on a preanalytical column (2 cm × 75 μm, Magic C18 Aq) (Michrom Bioresources, Inc.) using solvent A (0.1% formic acid) at a flow rate of 3 μL/min. Peptides were then resolved on an analytical column (20 cm × 75 μm, Magic C18 Aq) using an increasing gradient of 5–30% of solvent B (95% acetonitrile, 0.1% formic acid) at a flow rate of 300 nL/min for 120 min.
The data dependent acquisition of MS spectra in the range of 400–1600 m/z was carried out using Orbitrap mass analyzer with a mass resolution of 120,000 at 200 m/z at MS level, 30,000 resolution at MS/MS level, and 60,000 resolution at MS/MS/MS level. Higher energy collision dissociation was selected as the fragmentation mode with 37% normalized collision energy. The automatic gain control was set to 2 × 10⁶ ions for full MS, 1 × 10⁶ ions for MS/MS, and 5 × 10⁵ ions for MS/MS/MS, respectively. Internal calibration was executed using lock mass from ambient air (m/z 445.1200025).
Data analysis
Due to the unavailability of genome and protein databases of B. indicus, we used the protein database of taxonomically related species Bos taurus. The mass spectrometry data were searched using Sequest HT and Mascot (Version 2.2) search algorithms through Proteome Discoverer 2.1 software suite (Thermo Scientific, Breman, Germany) against B. taurus RefSeq database (Version 81). The search parameters used were as follows: trypsin was specified as a digestive enzyme with one missed cleavage. Oxidation of methionine was selected as dynamic modification, whereas carbamidomethylation of cysteine and TMT 6-plex derivation at N-terminus of the peptide and at lysine were set as a fixed modification.
The reporter ion tolerance window was set at 20 ppm. The precursor ion mass tolerance was set to 10 ppm, and fragment ion mass tolerance of 0.05 Da was allowed during the search. The identifications were filtered using 1% false discovery rate at peptide spectrum match (PSM) level, which was estimated by searching the data against the decoy database. Quantitation node under the consensus workflow was used to calculate the relevant ratios. TMT reporter ion intensities from the unique peptides were considered for the calculation of protein abundance. Fold change ratio of each protein was estimated by comparing the abundance of reporter ions corresponding to early, mid, and late lactation stages. Normalization of reporter ion intensities was enabled on Proteome Discoverer suite with protein database of B. taurus as background.
Data availability
Mass spectrometry data generated in this study were submitted to the publically available database to make it accessible to the scientific community. Proteome data have been deposited to the ProteomeXchange Consortium (http://proteomecentral.proteomexchange.org) through the PRIDE partner repository (Vizcaino et al., 2013) with the dataset identifier PXD007655.
Quantitation and bioinformatics analysis
Proteins with fold change value of 1.5 were considered as differentially regulated proteins. PANTHER (www.pantherdb.org) (Mi et al., 2013) and DAVID (https://david.ncifcrf.gov/tools.jsp) (Huang da et al., 2009) web resources were used for Gene Ontology (GO) analyses and to categorize proteins based on biological processes, cellular component, and molecular function. Protein–protein interactions were predicted using String (Version 10.0) tool and to identify enriched pathways. The heat map was generated using Perseus software (Version 1.5.8.5). Signal peptide domains were also fetched from SignalP (Version 4.1) (www.cbs.dtu.dk/services/SignalP/).
Results and Discussion
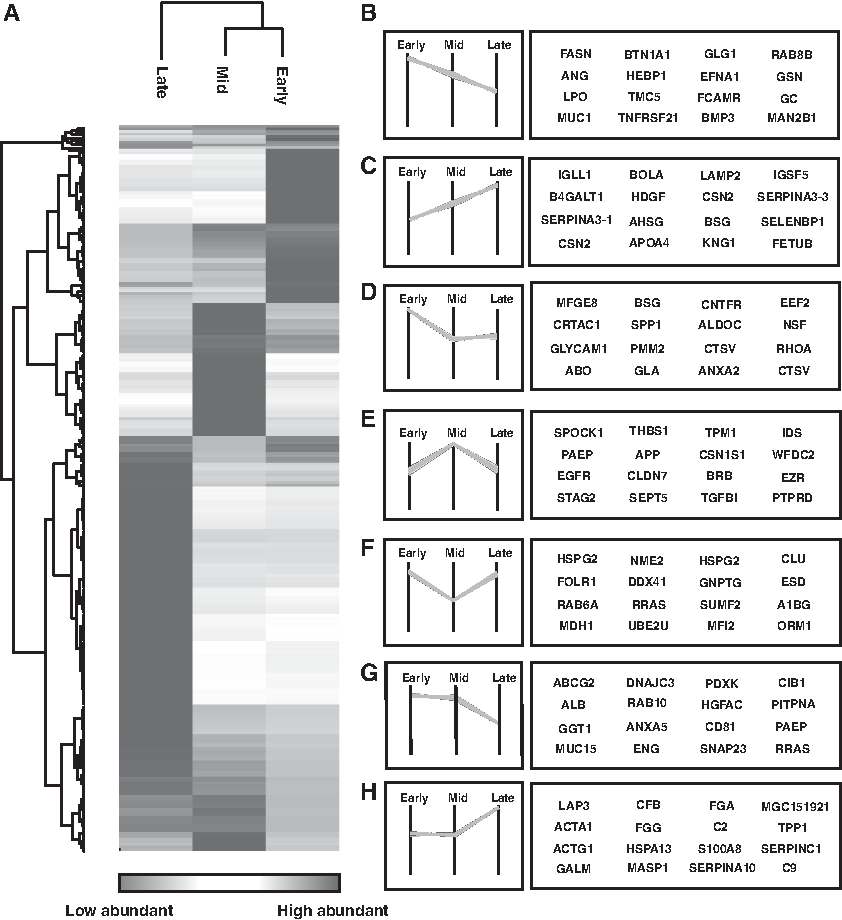
LC-MS/MS analysis of TMT labeled peptides from early, mid, and late lactation stages resulted in the generation of 226,272 MS/MS spectra and 26,043 PSMs, which led to the identification of 2272 peptides corresponding to 564 proteins. Out of which, 403 proteins were found to be differentially expressed (1.5-fold) in different lactation stages. We identified 286 proteins (51% of total proteins identified), which were predicted to have signal peptides. The lists of total proteins, differentially abundant proteins, PSMs and peptides identified in this study are provided in Supplementary Tables S2, S3, S4 and S5, respectively. A partial list of proteins identified across lactation stages that have been studied previously is provided in Table 1. The expression pattern of protein across the lactation stages is shown as Heat map in Figure 2A and the list of the hierarchical clustered proteins is provided in Supplementary Table S6.
Functional analysis of protein identified using gene ontology
Gene Ontology analysis was carried out to identify biological processes, molecular functions, and cellular localization associated with the differentially abundant proteins (Fig. 3) identified in this study. The most prominent biological processes that represent the data were cellular (25%) and metabolic processes (20%). Rest of the proteins was involved in response to stimuli (11%), biological regulation (10%), localization (9%), and so on. Molecular functions chiefly represented were catalytic activity (49%), binding activity (32%), structural molecule activity (6%), receptor activity (6%), and transporter activity (6%). The categorization based on cellular localization showed that 39% proteins were from cell parts, 22% were from the extracellular region, and 20% from cell organelles. Gene ontology analysis of altered protein at each lactation stage upon comparison with each other is shown in Figure 4.
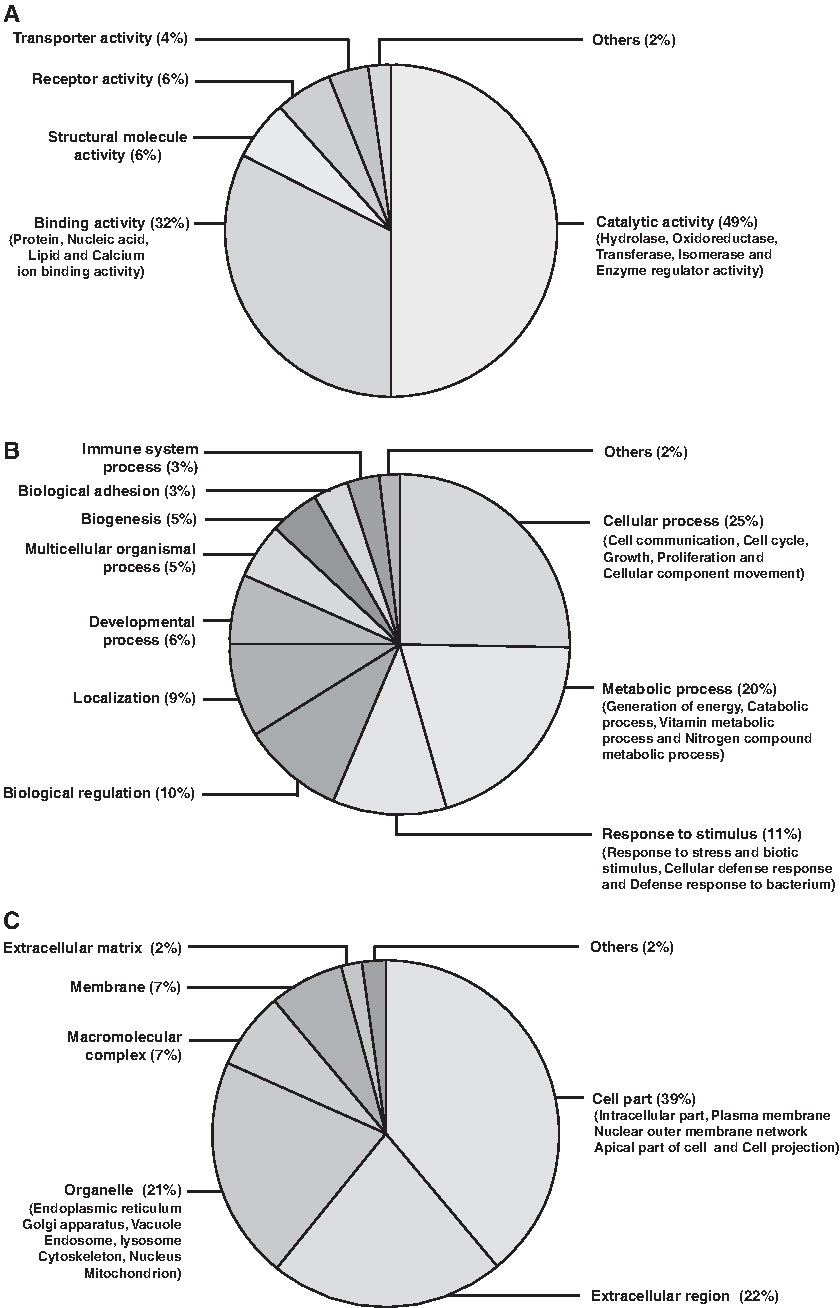
Gene ontology based functional annotation of differentially abundant proteins over the course of lactation stages.
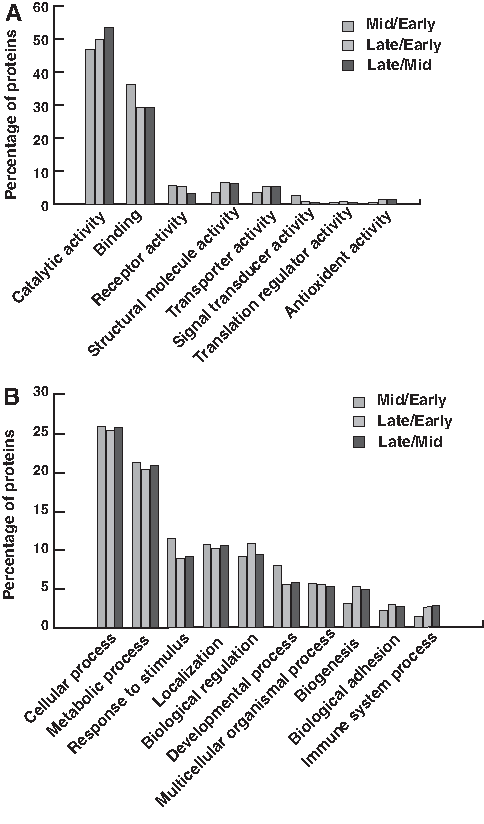
Gene ontology based bioinformatics analysis of differentially abundant proteins in different lactation stages on comparison with each other.
Proteins with decreased abundance on progression of lactation stages
A subset of proteins in our study was found to exhibit a decreasing trend in the abundance from early to late lactation stages (Fig. 2B). For instance, the abundance of fatty acid synthase (FASN) was decreasing from early to late lactation. FASN was found to be less abundant in late lactation (3-fold) compared to early lactation. It plays a significant role in de novo fatty acid biosynthesis (Li et al., 2015) and also plays role in maintenance, development, and functional competence of mammary gland (Suburu et al., 2014).
Figure 5A shows the representative MS/MS spectrum of one peptide for FASN. Angiogenin (ANG) showed the similar pattern and was found to be less abundant in mid lactation (1.6-fold) and late lactation (1.8-fold) compared with early lactation. Its strong angiogenic potency has been already studied in the bovine ovary (Lee et al., 1999). High abundance of ANG in the early lactation could be due to the intense angiogenesis that took place during the endothelial cell proliferation of mammary gland. Another instance, the amount of butyrophilin subfamily-1 member-A1 (BTN1A1) was decreasing from early to late lactation and was found to be less abundant (2-fold) in late lactation. BTN1A1 has been studied previously for its role in milk fat globule formation (Wickramasinghe et al., 2012).
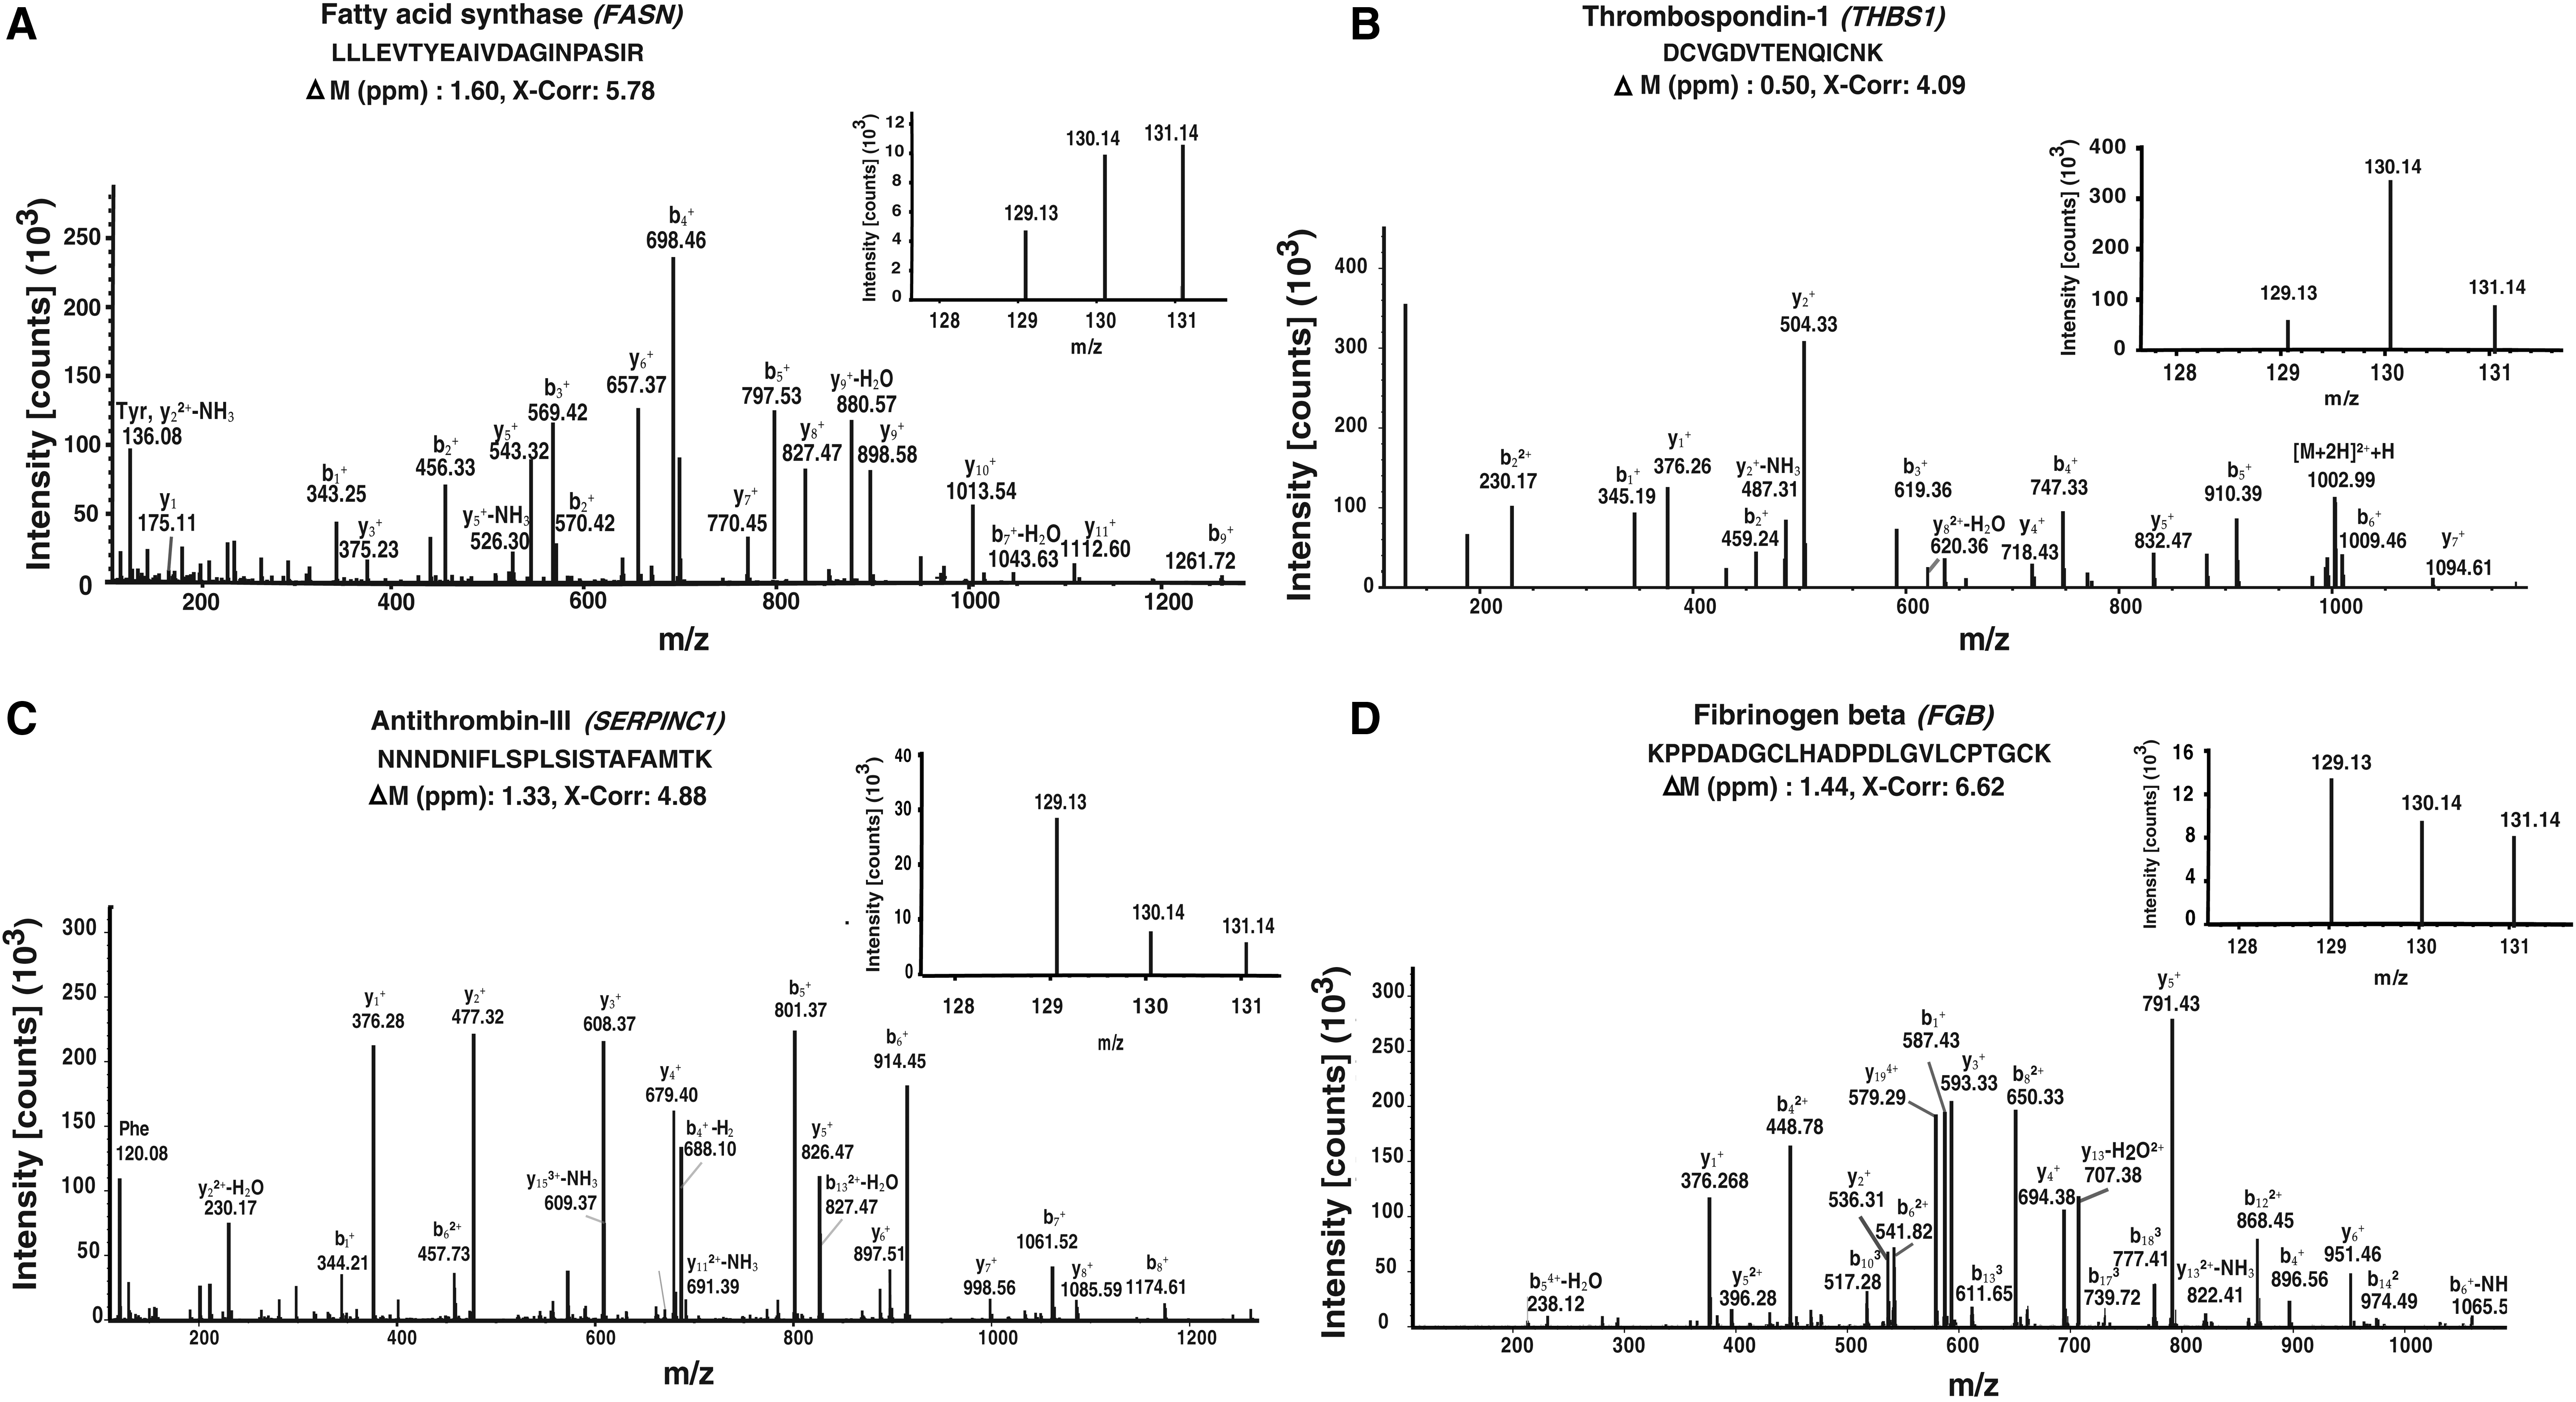
Representative MS/MS spectra of some differentially regulated proteins identified in the study.
Proteins with increased abundance on progression of lactation stages
In our study, a subset of proteins was showing an increasing pattern of abundance from early to late lactation (Fig. 2C). For example, the amount of beta-1,4-galactosyltransferase-1 (B4GALT1) was on the rise from early to late lactation and found to be most abundant in late lactation (2-fold) compared to early lactation. B4GALT1 is a membrane bound glycoprotein potentially associated with lactose biosynthesis and milk production. It has been previously reported that the expression of B4GALT1 enzyme rises upon the rise in the demand for lactose synthesis on the progression of lactation (Shahbazkia et al., 2012).
Another example, immunoglobulin lambda-like polypeptide-1 (IGLL1) also showed similar pattern and was found to be high in abundance in late lactation (1.5-fold). It is a surrogate light chain protein expressed during mammalian B-cell development. In an earlier report, expression of IGLL1 was found to be elevated only in fetal bone marrow and lymph node but not in adult bovine tissues, suggesting that B-cell lymphopoiesis in cattle is active during fetal stage and declines in adulthood (Ekman et al., 2012). We identified two serine protease inhibitors, SERPINA3-1 and SERPINA3-3 with increasing abundance, and were found to be most abundant in late lactation (2.9- and 3-fold, respectively) compared to early lactation. These serine protease inhibitors were found to be part of the plasminogen activating cascade and blood coagulation pathway.
Proteins differentially regulated in early lactation
We identified a subset of proteins which are differentially abundant only in early lactation compared to other stages (Fig. 2D). For example, milk fat globule-EGF factor-8 (MFGE8) or lactadherin was found to be highly abundant (3-fold) in early lactation stage compared to mid and late lactation stages. High abundance of lactadherin in early lactation and marked decrease during the weaning stage has been reported earlier as well (Nakatani et al., 2013). Anticoagulant activity of bovine lactadherin by inhibiting the enzyme complexes of blood coagulation also has been studied (Shi and Gilbert, 2003). Another example is cartilage acidic protein-1 (CRTAC1), which was found to be 5-fold less abundant in early lactation compared with mid and late lactation. Cadherin-1 (CDH1) was found to be 1.6-fold lower in abundance in early lactation compared to mid and late lactation. It is a cell adhesion molecule, which plays a vital role in differentiation of trophoblastic tissue and placental remodeling during pregnancy in bovine (Li et al., 2003; Lu et al., 2013).
Proteins differentially expressed in mid lactation
We identified around 100 candidates, which are differentially abundant only in mid lactation compared with other lactation stages (Fig. 2E, F, respectively). Interestingly, previous studies have reported some of these differentially regulated proteins to be associated with pregnancy and embryo development. These findings are highly interesting in the context that during mid lactation stages, these cows usually are in the early stages of the next pregnancy, although we cannot exactly confirm natural insemination and fertilization, as these cows openly graze with bulls. However, in the present study we confirmed that all the sampled cows in mid lactation stage were pregnant. For example, histidine-rich glycoprotein (HRG) is reported to have a role in angiogenesis in human female reproductive tract during pregnancy and in preimplantatory embryos (Nordqvist et al., 2010). HRG is an adapter protein and was found to be most abundant only in mid lactation (1.7-fold).
The protein level expression of testican-1 (SPOCK1) and thrombospondin-1 (THBS1) was found to be most abundant (2.7-fold) in mid lactation. These proteins are reported to have important roles in endometrium receptivity (Zhang et al., 2015), which is a crucial step in embryo implantation in mammals. The representative MS/MS spectrum of a peptide belonging to thrombospondin-1 is shown in Figure 5B. Progestagen-associated endometrial protein (PAEP) (1.9-fold more abundant), also known as β-lactoglobulin, plays a significant role in modulating cell proliferation to enhance immune responses (Tai et al., 2016). It is a progesterone-associated secretory glycoprotein found to be highly abundant during the time of early pregnancy in human. Furthermore, they possess immunosuppressive activity in the fetomaternal interface to protect the fetal semiallograft from maternal immune rejection (Seppala et al., 2002; SundarRaj et al., 2009).
Proteins differentially regulated in late lactation
We identified 120 candidates which are differentially abundant in late lactation stage compared with other lactation stages (Fig. 2G, H, respectively). For example, ATP-binding cassette subfamily G member-2 (ABCG2) was found to be 5.7- and 3-fold less abundant in late compared with early and mid lactation, respectively. It is a transporter protein, which plays a significant role in proliferation of mammary epithelial cells (MECs) (Janjanam et al., 2013). The high abundance of ABCG2 in early stages of lactation could be due to its expression during the development of MECs, which later secreted to milk. Another example is bovine transcobalamin-2 (TCN2); just similar to its ortholog in human, it is an important transport protein for the intestinal uptake of cobalamine (Vitamin B-12) and dissemination into peripheral tissues (Hine et al., 2014). It was found to be 1.5- and 2-fold more abundant in late lactation compared to early and mid lactation, respectively.
The abundances of serine protease inhibitors (SERPINC1, SERPINA3, SERPINA10, SERPINA3-7, SERPINA7, SERPIND1, SERPINB1, and SERPING1) were found to be higher in late lactation stages compared to other lactation stages. Among these, SERPINC1, SERPINA3, SERPINB1, and SERPINA10 (2-, 2-, 4-, and 2-fold high abundant) were found to have a role in blood coagulation in the pathway enrichment analysis. We also found multiple complement proteins (C2, C3, C6, C7, and C9) in higher abundance in the late lactation stage. The representative MS/MS spectrum of one peptide for antithrombin-III (SERPINC1) is shown in Figure 5C.
Proteins with secretory potential
Signal peptides are short and transient sequences generally found at the amino-terminus of proteins, which destines for their translocation/secretion (Choo et al., 2005). As mammary glands possess a remarkable capacity to synthesize and secrete proteins during lactation, it is highly reasonable to expect signal peptides in a large number of milk proteins. We analyzed our data to identify signal peptides containing proteins. Consequently, we identified 286 proteins with signal peptide information that constitutes 51% of the total proteins identified in this study. The majority of the secretory proteins such as casein and transferrin are known to be synthesized within MECs, whereas <20% are transported from blood plasma to MECs by transcytosis, which includes immunoglobulin and albumin (Burgoyne and Duncan, 1998). A partial list of proteins with signal peptide information is provided in Table 2, and a list of all signal peptide containing proteins is provided in the Supplementary Table S7, respectively.
Proteins involved in complement and coagulation cascade pathway
We identified 30 proteins that were found to be actively involved in complement and coagulation cascade pathway. Out of which, 20 proteins were found to possess signal peptide sequence at their amino-terminus, and the majority of proteins were differentially regulated in mid and/or late lactation compared to early lactation. Figure 6 shows the protein–protein interactions of molecules involved in this pathway. Some of the proteins identified in this pathway, such as plasminogen (PLG), prothrombin (F2), and hepsin (HPN), have been reported to have an association with hemostasis and blood coagulation (Ploplis, 2001; Sun and Degen, 2001; Wu, 2001).

Protein–protein interactions enriched in complement and coagulation cascade pathway. The interaction networks were built using STRING tool on medium confidence (0.4).
Coagulating factors such as fibrinogen alpha, fibrinogen beta, and fibrinogen gamma proteins (FGA, FGB, and FGG) were found to be most abundant in late lactation (1.8-, 1.8-, and 1.6-fold, respectively) compared to other lactation stages. Figure 5D shows the representative MS/MS spectrum of one peptide for fibrinogen beta. Complement components such as C2, C3, C5, C6, C7, C8A, and C9 and coagulation factors-V, IX, and XII (F5, F9, and F12) are the other candidates that were found to have a role in this pathway in this study.
Conclusions
In this study, we carried out an unbiased investigation of altered proteome of milk during early, mid, and late lactation stages of Indian indigenous cattle breed, Malnad Gidda. Although India ranks first in world's milk production and has largest livestock population, proteomic studies in the milk of Indian breed remain unexplored. Our data represent the first inventory of proteins from B. indicus, which offers insight to the quantitative changes in milk proteome during lactation stages. Bioinformatics analyses and literature survey revealed the significance of abundance of proteins at respective lactation stages.
The current study will serve a strong foundation for the future proteomic studies on milk, as bovine milk is one of the most consumed mammalian milk in India; moreover, bovine milk proteins could potentially confer the same function as their human counterparts. However, further research is required to understand the correlation between altering protein expression with physiological adaptation manifested in the bovine maternal system during lactation.
Footnotes
Authors' Contributions
T.S.K.P. and K.P.R. conceptualized and designed the study. K.P.R. identified and recruited animals from different regions of coastal Karnataka and collected milk samples and carried out somatic cell count for the study. K.P.R. also gathered associated information on these cows. U.K., M.D., M.B., A.R., and G.D. were also involved in sample collection. P.M., G.D., L.G., and M.D. carried out sample preparation and fractionation. M.K. carried out mass spectrometry analysis. P.M., U.K., G.D., and L.G. analyzed the mass spectrometry data. A.P. performed the computational programming. P.M. wrote the article, and all authors revised the article for important intellectual content and have approved the article for submission and publication.
Acknowledgments
This study is funded by the Karnataka Livestock Development Agency (KLDA), Government of Karnataka, India, for funding the joint research project to NDRI (Kajaaasam/prani/kajasaaasam/NAFCC/2016–17). The authors also thank the National Agricultural Scientific Fund (NASF), Indian Council of Agricultural Research, Government of India for partially funding a joint grant to TSKP (F.No. NASF/GTR-5005/2015–16).
Praseeda Mol and Lathika Gopalakrishnan are recipients of INSPIRE Senior Research Fellowships from Department of Science and Technology (DST), Government of India. Uday Kannegundla is a recipient of Prime Minister's Fellowship, Department of Science and Technology, Government of India. Gourav Dey and Manish Kumar are recipients of Senior Research Fellowships from the University Grants Commission (UGC) and the Council of Scientific and Industrial Research (CSIR), Government of India, respectively. Manjunath Dammalli is on deputation from Siddaganga Institute of Technology (SIT), Tumkur, India, to pursue his research work at Institute of Bioinformatics toward a Ph.D. degree under the Faculty Improvement Program of The Sree Siddaganga Education Society, Tumkur, India. Marappa Basavaraju and Akhila Rao are recipients of Senior Research Fellowships funded by KLDA, Government of Karnataka, India.
Author Disclosure Statement
The authors declare that no competing financial interests exist.
Abbreviations Used
References
Supplementary Material
Please find the following supplemental material available below.
For Open Access articles published under a Creative Commons License, all supplemental material carries the same license as the article it is associated with.
For non-Open Access articles published, all supplemental material carries a non-exclusive license, and permission requests for re-use of supplemental material or any part of supplemental material shall be sent directly to the copyright owner as specified in the copyright notice associated with the article.
