




Abstract
Abstract
Target of rapamycin (TOR) is a major signaling pathway and regulator of cell growth. TOR serves as a hub of many signaling routes, and is implicated in the pathophysiology of numerous human diseases, including cancer, diabetes, and neurodegeneration. Therefore, elucidation of unknown components of TOR signaling that could serve as potential biomarkers and drug targets has a great clinical importance. In this study, our aim is to integrate transcriptomics, interactomics, and regulomics data in Saccharomyces cerevisiae using a network-based multiomics approach to enlighten previously unidentified, potential components of TOR signaling. We constructed the TOR-signaling protein interaction network, which was used as a template to search for TOR-mediated rapamycin and caffeine signaling paths. We scored the paths passing from at least one component of TOR Complex 1 or 2 (TORC1/TORC2) using the co-expression levels of the genes in the transcriptome data of the cells grown in the presence of rapamycin or caffeine. The resultant network revealed seven hitherto unannotated proteins, namely, Atg14p, Rim20p, Ret2p, Spt21p, Ylr257wp, Ymr295cp, and Ygr017wp, as potential components of TOR-mediated rapamycin and caffeine signaling in yeast. Among these proteins, we suggest further deciphering of the role of Ylr257wp will be particularly informative in the future because it was the only protein whose removal from the constructed network hindered the signal transduction to the TORC1 effector kinase Npr1p. In conclusion, this study underlines the value of network-based multiomics integrative data analysis in discovering previously unidentified components of the signaling networks by revealing potential components of TOR signaling for future experimental validation.
Introduction
Evolutionarily conserved target-of-rapamycin (TOR)
The two Tor proteins, Tor1p and Tor2p, form two TOR complexes in yeast Saccharomyces cerevisiae and mammals, namely, TOR Complex 1 (TORC1) and TOR Complex 2 (TORC2) (mTORC1 and mTORC2 in mammals) (Heitman et al., 1991; Wullschleger et al., 2006).
TORC1 consists of Kog1p, Lst8p, Tco89p, and either Tor1p or Tor2p, whereas TORC2 consists of Tor2p, Avo1p, Avo2p, Avo3p, Bit61p (and/or its paralog Bit2p), and Lst8p. In yeast cells, rapamycin forms a complex with Fpr1p and this complex directly binds and inhibits TORC1. Owing to its direct inhibition by rapamycin, downstream processes regulated by TORC1, such as protein and ribosome synthesis, amino acid biosynthesis, nitrogen assimilation pathways, stress response, and autophagy are well established (Dikicioglu et al., 2018; Hughes Hallett et al., 2014b; Loewith and Hall, 2011).
Although TORC1 is widely studied, TORC2 remained poorly characterized due to its insensitivity to acute rapamycin treatment (Loewith et al., 2002) caused by its subunit Avo3p, which prevents the binding of Fpr1p-rapamycin complex (Gaubitz et al., 2015). However, prolonged rapamycin treatment was reported to inhibit mTORC2 signaling (Lamming et al., 2012; Sarbassov et al., 2006). The documented roles of TORC2 include the control of spatial bud growth through regulation of actin cytoskeleton and cell wall organization, and the regulation of endocytosis in response to environmental stress conditions (Rispal et al., 2015; Roelants et al., 2017a; b). In addition, TORC2 was also reported to be associated with ribosomes (Zinzalla et al., 2011), sphingolipid biosynthesis (Aronova et al., 2008), and DNA damage response and genome stability (Weisman et al., 2014).
Like rapamycin, caffeine, one of the most widely used psychoactive pharmaceuticals, has also been reported to affect TOR signaling by directly inhibiting TORC1 in many organisms, including yeast, plants, and mammals (Rallis et al., 2013; Reinke et al., 2006; Saiki et al., 2011). As a low-affinity ATP analog, its effects on cell growth and morphology, DNA repair, intracellular calcium homeostasis, and cell cycle progression were reported in budding yeast (Kuranda et al., 2006). Both rapamycin and caffeine treatments were reported to have similar effects on several processes such as transcription, ribosome biogenesis and assembly, amino acid and protein synthesis, nitrogen catabolite repression, stress response, cell wall integrity, autophagy, and life span extension (Huber et al., 2009; Kuranda et al., 2006).
Despite the numerous studied concentrating on TOR signaling, there is still much to be elucidated regarding its mechanism. For instance, the inhibition of the Sch9p branch of TOR signaling by oxidative, osmotic and heat stresses as well as glucose starvation is known (Hughes Hallett et al., 2014a). However, it is an open question if this is a direct or indirect regulation, that is, through one or more unknown proteins, or inactivation of TORC1.
Moreover, it was shown that AMPK/Snf1p inactivates TORC1 signaling under glucose starvation by inhibiting Sch9p and Pp2Ap, and the lack of SNF1 does not activate Pp2Ap branch under simultaneous starvation of glucose and nitrogen. This points out an additional unknown mechanism, which cooperates with Snf1p to inhibit Pp2Ap branch of TORC1 signaling (Hughes Hallett et al., 2014a). There are many other open questions regarding the mechanisms how TOR senses nutrient cues and stress conditions, and how the signal is transmitted to TOR. Moreover, the downstream effectors of TORC1 that mediate the positive effects of rapamycin on lifespan and the regulation of transcription factors (TFs) linked to cell growth control are also still unknown (Kennedy and Lamming, 2016; Tee, 2018).
Notably, similar effects that rapamycin and caffeine display on global gene expression prompted us to hypothesize that TOR signaling is mediated through common upstream and downstream regulators, that is, a common intracellular signal transduction pathway, in response to rapamycin and caffeine.
Here, by taking the advantage of the direct and specific inhibition of TOR signaling by rapamycin and caffeine, we designed a network-based multiomics study to integrate data from transcriptomics, interactomics, and regulomics levels in yeast to elucidate formerly undiscovered components of TOR signaling. This study makes an original contribution to biomedical literature through screening of TOR-mediated rapamycin and caffeine signal transduction routes, and defining its new components with a probable role in rapamycin and/or caffeine signaling by integrating transcriptome, interactome, and regulome in the yeast S. cerevisiae.
Materials and Methods
Strains, fermentations, sampling, RNA isolation, microarray data acquisition, and analysis
In this study homozygous hoΔ/hoΔ strain of S. cerevisiae BY4743 (MATa/MATΔ his3Δ1/his3Δ1 leu2Δ0/leu2Δ0 lys2Δ0/+ met15Δ0/+ ura3Δ0/ura3Δ0) was used. The growth conditions were previously described as well as sampling, RNA extraction, and microarray data acquisition were carried out as described by (Dikicioglu et al., 2018). In particular, in this study, the set of fermentations where the dissolved oxygen saturation was adjusted to100% before inoculation without further air supply and pH was controlled at 5.5 was used.
All microarray data files that comply with MIAME (Brazma et al., 2001) guidelines are submitted to the EBI's ArrayExpress database with the accession numbers E-MTAB-6628 for control dataset and E-MTAB-7373 for rapamycin- and caffeine-treated datasets (www.ebi.ac.uk/arrayexpress).
To identify differentially expressed genes in response to rapamycin or caffeine treatment, transcriptome datasets were analyzed through one-way analysis of variance (ANOVA) test followed by FDR correction. A corrected p-value threshold of <0.05 was used to define statistical significance. Then, Tukey's honestly significant difference (HSD) test was applied (α = 0.05) in MATLAB (The MathWorks, Inc.) as post hoc analysis for multiple comparisons to determine the significantly expressed genes only in response to rapamycin or only in response to caffeine.
The common set of genes significantly expressed under both conditions was further integrated with the yeast transcriptional regulatory network (TRN) and used to identify reporter TFs through the Reporter Features Algorithm (Oliveira et al., 2008). Panther Overrepresentation Test was used for Gene Ontology (GO) Enrichment Analysis (http://pantherdb.org) accessed on 10/2018. Binomial test was used as the statistical test for significance and GO terms with FDR corrected p-value <0.05 were considered significant.
Construction of TOR signaling network
A TOR protein-protein interaction network was constructed using the Selective Permissibility Algorithm (SPA) (Arga et al., 2007) around the core proteins of TOR signaling, that is, the upstream and downstream components. In SPA, the physical interactors of the core proteins are filtered according to their similarity to core proteins in terms of GO annotations. In particular, the GO annotations of each protein are compared with the annotations of the core proteins. If a match is caught for at least one term from all branches (i.e., biological process, molecular function, and cellular component), then the corresponding protein is included in the network, since it possesses similar molecular functions in analogous biological processes with at least one of the core proteins.
The final network consists of the core proteins and the proteins that pass the above described filtering strategy. At the last step, self-loops and duplicated edges are eliminated. The protein-protein interaction data were obtained from BioGRID database (version 3.3.123) (Chatr-Aryamontri et al., 2017). The GO annotations of yeast proteins were obtained from Saccharomyces Genome Database (SGD) (Cherry et al., 2012). Cytoscape (Lopes et al., 2011) was used to visualize and analyze the network. Identification of the densely connected regions, that is, modules, was performed using MCODE plugin (Bader and Hogue, 2003).
Identification of reporter TFs
The Reporter Features Algorithm (Oliveira et al., 2008) was used to identify the key TFs eliciting a specific transcriptional response. The algorithm takes as input a TRN consisting of protein-DNA interactions and p-values representing the differential expression levels of genes. Each p-value is then converted into z-score by using the inverse normal cumulative distribution function. Gene expression levels in the form of z-scores are then mapped onto the regulatory network and a score is calculated for each TF based on the score of genes regulated by that TF. At the last step, the z-scores of TFs are converted back to p-values using the normal cumulative distribution function.
In the constructed yeast TRN, TFs presented in the consensus list of Yeast Search for Transcriptional Regulators and Consensus Tracking (YEASTRACT) (Teixeira et al., 2006) and the proteins annotated with TF, transcriptional regulator, transcriptional repressor, transcriptional activator, or transcriptional co-repressor/co-activator activity in SGD were considered. The target genes of these TFs, with a reported direct evidence, were retrieved from YEASTRACT. The constructed yeast TRN includes 187 TFs and 145685 TF-gene interactions.
Linear path analysis in TOR signaling network
To identify all the possible signaling routes in TOR signaling network from any starting protein to any reporter TF, the All_Simple_Paths algorithm was used as implemented in the software package NetworkX in Python language (Hagberg et al., 2008). For this purpose, a total of 81 proteins, which are annotated with the receptor activity or specified as receptors in their descriptions according to SGD, were set as the starting proteins of linear paths. Path length was defined as the number of proteins in the path, and the maximum path length was chosen as 7, which is the diameter of the reconstructed TOR signaling network (i.e., the maximum length of the shortest paths connecting any two molecules within the network).
The identified linear paths were filtered in terms of the presence of any component of TORC1 and TORC2 complexes. The paths that do not pass through one of the components of TORC1 or TORC2 were eliminated to define the TOR-mediated signaling routes. Then, the resultant paths were scored according to the co-expression levels of adjacent genes within the paths. For this purpose, the genome-wide gene expression profiles of the yeast cells cultivated in the presence of rapamycin or caffeine were recruited to analyze the existence of a correlation between the expression profiles of genes encoding the proteins in the network. Pearson correlation coefficient (PCC) was used to enumerate the co-expression levels. The score of a path was calculated by taking the geometric average of PCCs of the adjacent proteins defined in that path:
where N is the path length. Scoring and elimination of paths were carried out in R (v.3.4.4). To evaluate the significance of the path scores, we generated 106 random paths with similar length distribution. Then, we calculated z-scores for each path score and then converted to p-value using normal standard distribution function. Paths with score ≥0.9275 (corresponding to p-value <0.005) were considered significant. Cytoscape (v3.7) (Lopes et al., 2011) was used to visualize the significant paths.
Results
Comparative analysis of the transcriptional responses to rapamycin and caffeine
The transcriptional responses of yeast cells to the presence of rapamycin or caffeine were comparatively analyzed through one-way ANOVA test considering an FDR-corrected p-value threshold of 0.05. To determine the significantly expressed genes between each pair of conditions, Tukey's HSD test was applied and significantly different means were extracted (α = 0.05). A total of 3108 genes were found to show a significant expression change, and among them, 1268 genes were found to be significantly expressed in response to both chemicals in common, while 1173 and 334 genes were specifically expressed in response to rapamycin or caffeine, respectively (Fig. 1A and Supplementary Table S1).
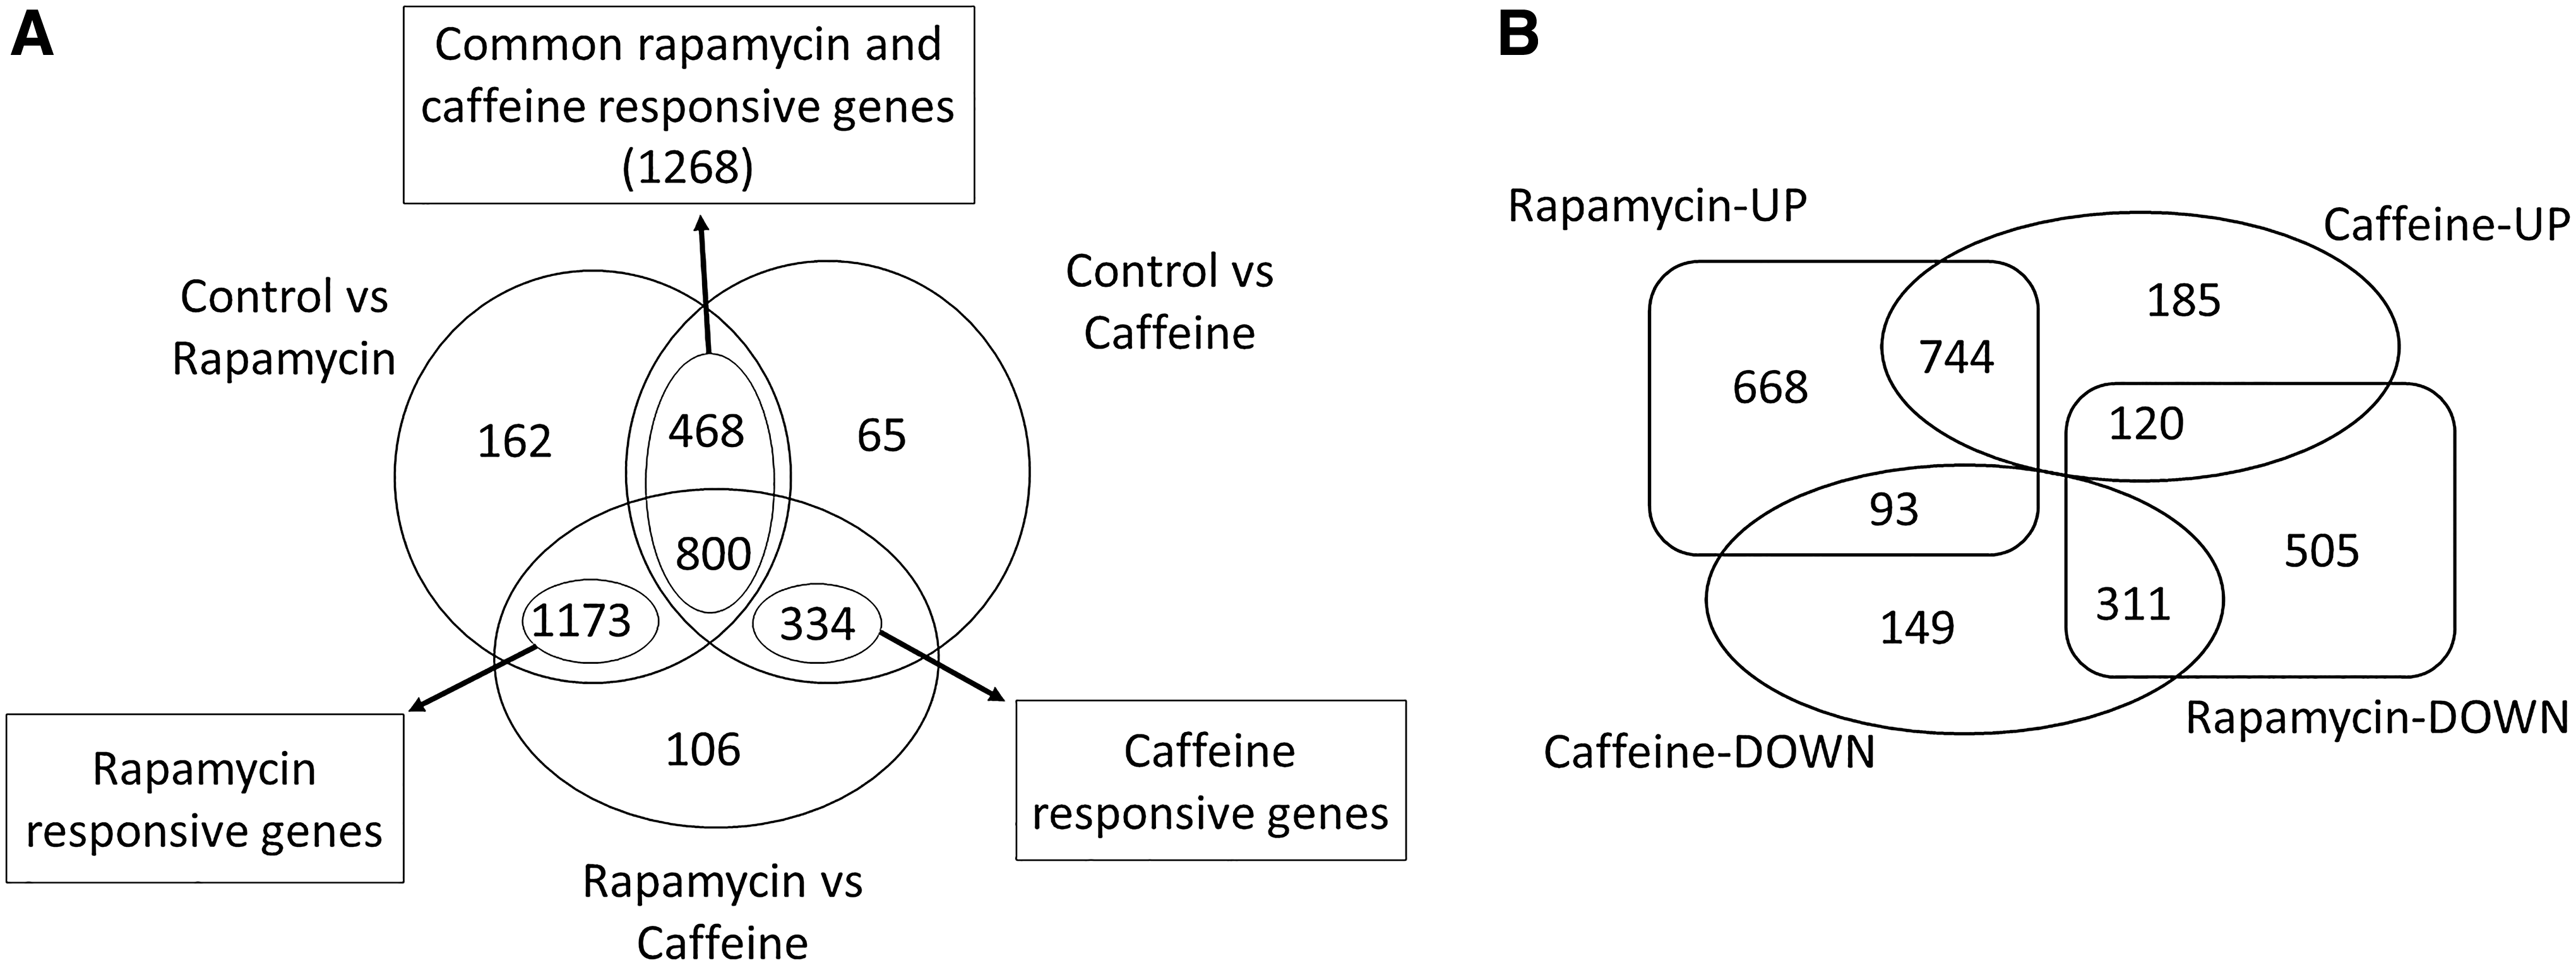
Number and distribution of significantly expressed genes in response to rapamycin or caffeine.
Then, these groups of genes were further investigated taking into consideration their directions of regulation. This clustering revealed that 668 genes were upregulated and 505 genes were downregulated only in response to rapamycin, while 185 genes were upregulated and 149 genes downregulated specifically in response to caffeine. Furthermore, 744 genes were upregulated and 311 genes were downregulated in both cases, 93 genes were upregulated in response to rapamycin, while they were downregulated in response to caffeine, and 120 genes were downregulated in response to rapamycin, whereas they were upregulated in the presence of caffeine (Fig. 1B and Supplementary Table S1).
The 668 genes upregulated only in response to rapamycin were mainly associated with aerobic respiration, glyoxylate cycle, macroautophagy and microautophagy, cellular response to reactive oxygen species, proteasomal ubiquitin-dependent protein catabolic process, glutathione metabolic process, and fatty acid beta oxidation processes. The 505 genes downregulated only in response to rapamycin were significantly enriched with ribosome biogenesis, translation, glycolysis, DNA replication, protein glycosylation, Endoplasmic Reticulum (ER) to Golgi vesicle-mediated transport, and protein import into nucleus and mitochondrial matrix GO biological process terms.
The 185 genes induced only in response to caffeine were involved in the processes such as cellular transition metal ion homeostasis, cytoplasmic translation, and tryptophan and ergosterol biosynthesis, whereas no significantly associated GO terms were found for 149 genes that were repressed only in response to caffeine.
The common 744 genes upregulated in response to both chemicals were significantly enriched with tricarboxylic acid (TCA) cycle, carnitine and propionate metabolic process, asparagine, sphingolipid, and glycerolipid catabolic processes, acyl-CoA metabolic process, proteasome assembly, mitotic cell cycle, ribosome biogenesis, and telomere maintenance, while the 311 genes downregulated in response to both rapamycin and caffeine were significantly associated with guanosine triphosphate (GTP) biosynthetic process, G2/M transition of mitotic cell cycle, methionine biosynthetic process, and chromatin remodeling.
The 93 genes induced with rapamycin, while they were repressed with caffeine, were the genes involved in spermidine transmembrane and putrescine transport. On the other hand, 120 genes, repressed with rapamycin and induced with caffeine, were mainly associated with “de novo” nicotinamide adenosine dinucleotide (NAD), inosine monophosphate (IMP), and purine nucleobase biosynthetic process, cytoplasmic translation, and ribosome biogenesis.
Construction of a TOR signaling network
To identify possible TOR-mediated signaling routes, at the first step, we constructed a protein-protein interaction network around 33 core proteins of TOR signaling (i.e., the members of TOR signaling cascade and the well-known upstream and downstream components) (Supplementary Table S2). For this purpose, as required by the SPA procedure (Arga et al., 2007), the Annotation Collection Table (ACT) of the core proteins was created with their GO annotations in three categories, that is, biological process, molecular function, and cellular component. To prevent exclusion of proteins due to the lack of available literature data, along with the GO annotations of the core proteins, the “unknown” terms of each category were also included into the ACT.
The resultant ACT included 104 terms for biological process, 45 terms for molecular function, and 40 terms for cellular component categories (Supplementary Table S3). Through the employment of ACT as the filtering criteria and protein interactome data from BioGRID database (3.3.123), SPA resulted with a TOR signaling network comprising 2467 proteins and 19377 interactions (Supplementary Table S4). The topological analysis of the network revealed its scale-free connectivity distribution (with network diameter and characteristic path length of 7 and 2.854, respectively) following a power-law model, P(k) ≈ k−γ, with γ = 1.37, as in many biological networks (Fig. 2).
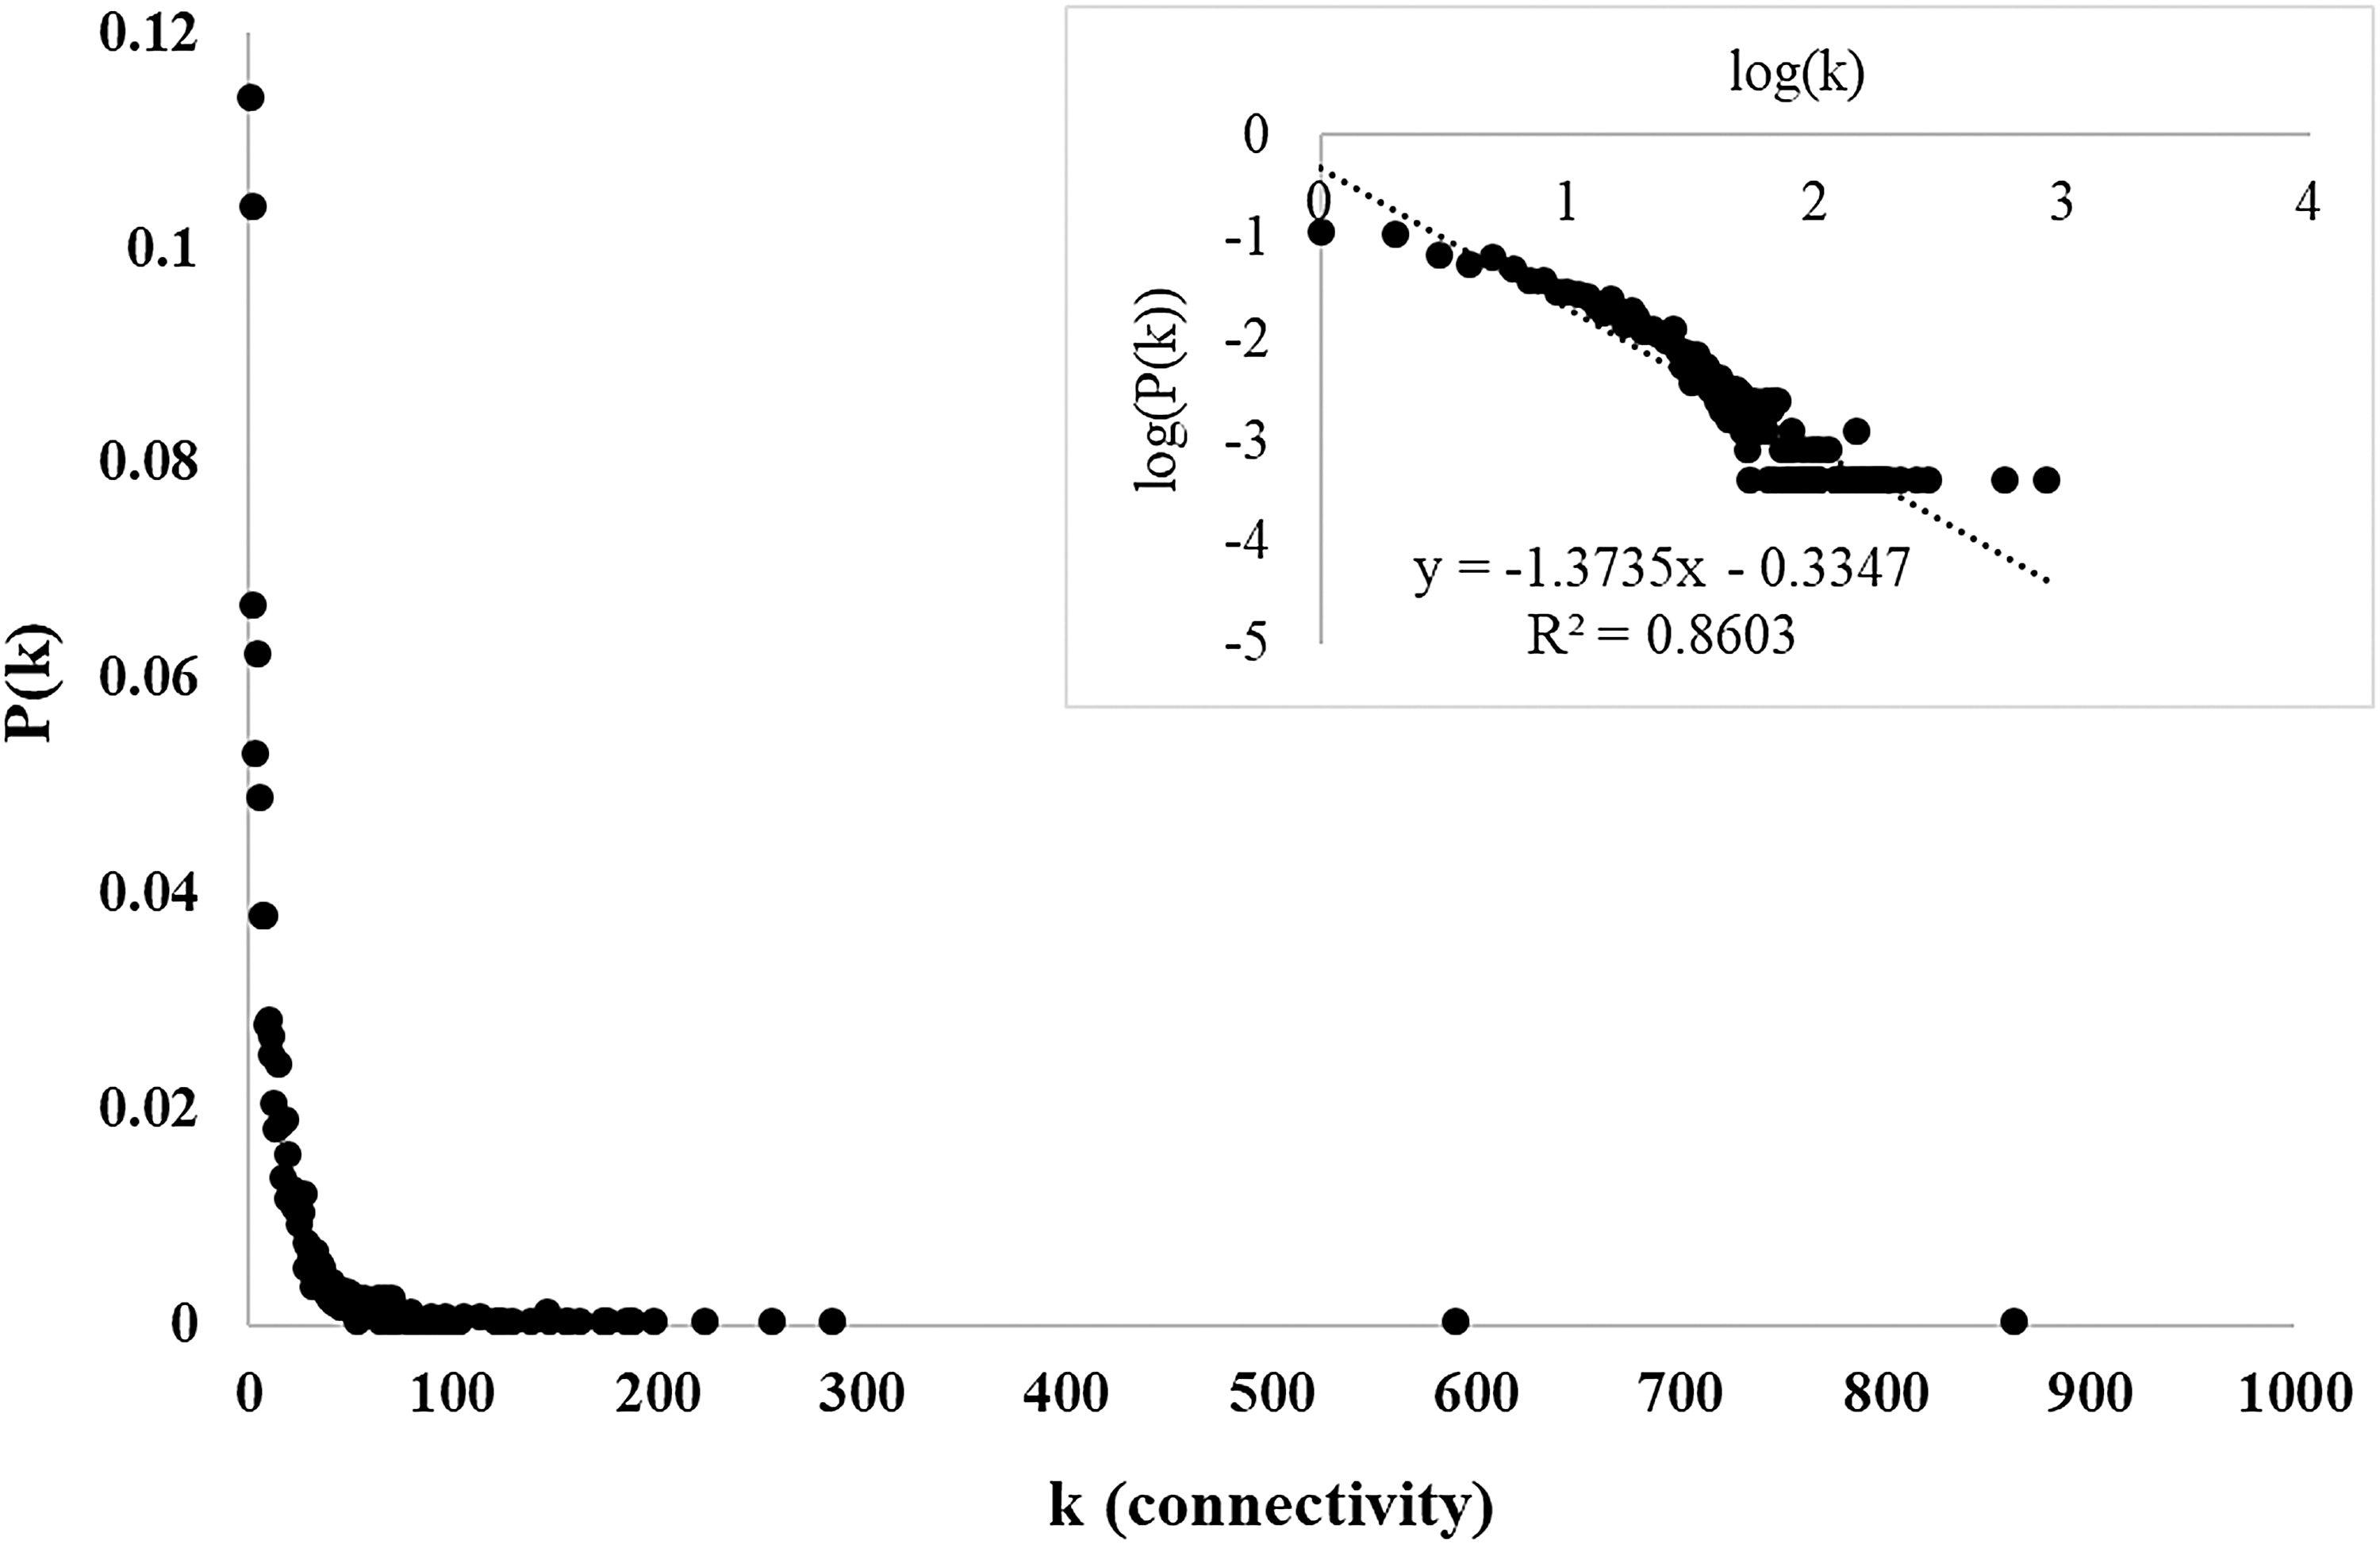
Connectivity distribution of reconstructed TOR signaling protein interaction network. Connectivity of proteins versus frequency in the reconstructed TOR signaling protein interaction network was plotted. The log–log plot of the frequency of proteins with a given connectivity was presented in the inner plot, indicating the scale-free connectivity distribution of the network. TOR, target of rapamycin.
The modular structure of the reconstructed TOR signaling network was further analyzed to determine highly connected modules using MCODE plugin of Cytoscape. We identified a total of 25 modules (Supplementary Table S5), and GO enrichment analyses of these modules resulted in significant associations with well-known biological processes regulated through TOR signaling (Supplementary Table S6), such as ribosome biogenesis, rRNA processing, transport, response to stress, transcription, and regulation of transcription, chromatin remodeling/silencing, cell wall organization, and autophagy, demonstrating that the constructed network could serve as a good template for the identification of new components of TOR signaling pathway.
Identification of the possible TOR-mediated signaling routes
Since no rapamycin- or caffeine-responsive receptor was predicted in the genome of any organism and both rapamycin and caffeine are able to diffuse through plasma membrane, to focus on the intracellular signaling events and track intracellular signaling paths, we collected all proteins annotated with receptor activity or specified as receptors in their descriptions in SGD (Supplementary Table S7). The resultant 81 proteins were set as the potential starting components of TOR-mediated signaling.
We determined the potential target components of the signaling routes as the reporter TFs around which the common transcriptional changes are significantly concentrated in response to rapamycin and caffeine treatments. For this purpose, we integrated the gene expression levels of common 1268 DEGs in response to rapamycin and caffeine with yeast TRN (Supplementary Table S8) through Reporter Features algorithm. Among the 187 TFs defined in yeast genome, 27 proteins were identified as reporter TFs with a significance level of p < 0.01 (Fig. 3 and Supplementary Table S9), and these proteins were set as the potential target components of TOR-mediated signaling.
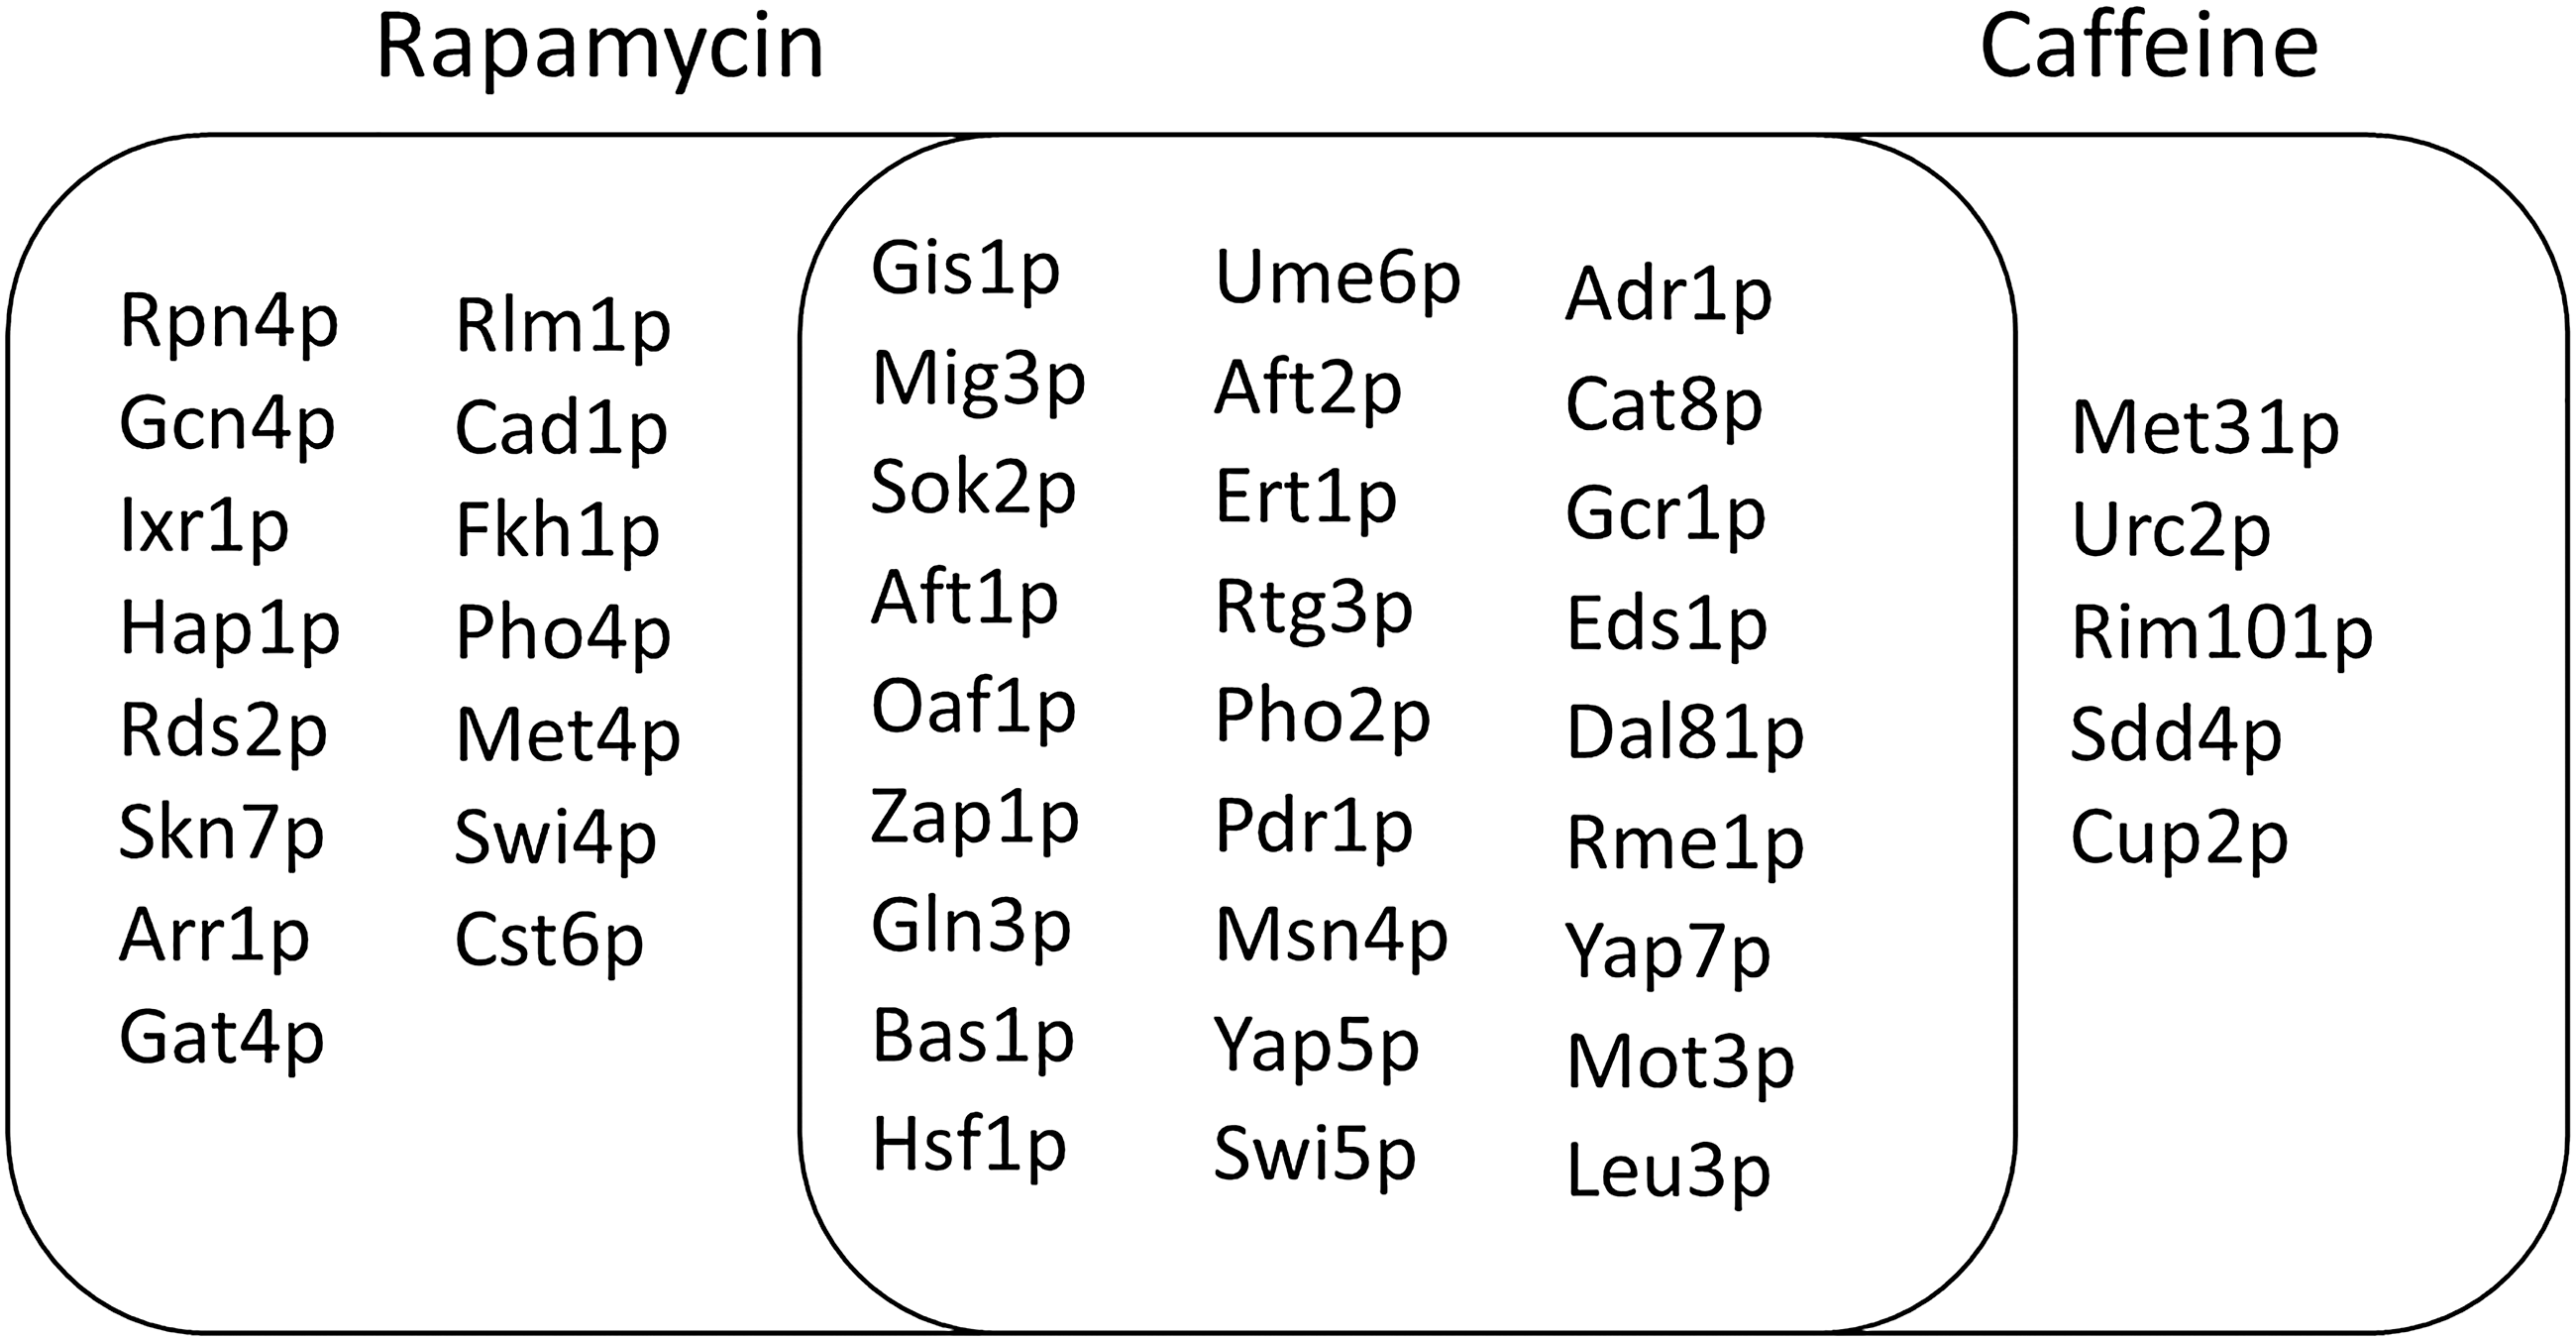
Reporter transcription factors in response to rapamycin or caffeine. Venn diagram shows the reporter TFs in response to rapamycin (purple) or caffeine (orange) identified through Reporter Features Algorithm. The intersection represents the proteins identified as reporter TFs in response to both chemicals. TF, transcription factor.
Twenty-seven common reporter TFs mainly included the ones that regulate stress response, nutrient limitation, ion homeostasis, carbon and nitrogen metabolisms, glycolysis, gluconeogenesis, and cell cycle.
Rapamycin-specific reporter TFs were involved in the regulation of cell integrity, stress response, iron metabolism, chromatin silencing, phosphate metabolism, sulfur amino acid pathway, cell cycle, utilization of nonoptimal carbon sources, chromosome stability, proteasomal genes, aerobic genes, spore wall assembly, gluconeogenesis, and genes involved in resistance to arsenic compounds. Reporter TFs involved in the transcriptional organization of caffeine-responsive genes were implicated in the regulation of methionine biosynthetic genes, cell wall assembly, DNA damage, and copper genes.
Considering 81 potential starting and 27 potential target components, we employed the All_Simple_Paths algorithm to identify all possible TOR-mediated signaling routes on the reconstructed TOR signaling network. The maximum path length was set as 7, which was the network diameter representing the maximum length of the all shortest paths connecting any two proteins within the network. Simulations resulted with >106 possible signaling paths starting from any of the starting components (i.e., receptor proteins) and ending with one of the target components (i.e., reporter TFs).
The identified signaling paths were filtered in terms of the presence of any component of TORC1 and TORC2 complexes. We observed that 10 out of the 81 starting proteins revealed possible routes passing through any component(s) of TORC1 or TORC2 ending at the 27 target proteins.
These 10 starting proteins include transmembrane signaling receptor Mid2p with a documented role in rapamycin signaling to the Protein kinase C (PKC) pathway (Torres et al., 2002), plasma membrane osmosensor Sln1p, which is an upstream regulator of TORC2 (Leskoske, 2017), two proteins having SNAP receptor activity, one is Ykt6p that belongs to the family of SNAREs, essential components of vesicular trafficking, and the other is Sso1p, yeast orthologue of Syntaxin-1A (Stx1Ap) whose expression is controlled by mTORC1 with a negative feedback loop (Leskoske, 2017), signal recognition particle (SRP) receptor alpha subunit Srp101p, type I transmembrane sorting receptor for multiple vacuolar hydrolases Pep1p, functional homolog of human obesity receptor gene-related protein Vps55p, homolog of human cystic fibrosis transmembrane receptor Yor1p, autophagy receptor with a role in degradation of the ER and nucleus Atg39p whose expression is controlled by TORC1 (Nakatogawa and Mochida, 2015), and Prr1p with receptor signaling protein serine/threonine kinase activity.
The TOR-mediated paths were scored according to the co-expression levels of adjacent genes within the paths (as described in Materials and Methods section), and paths with a score greater than 0.9275 (p < 0.005) were considered significant. As a result, a total of 201 paths were identified as significant, which were starting from six proteins (i.e., Pep1p, Srp101p, Vps55p, Prr1p, Atg39p, and Sso1p) (Table 1) and targeting 16 reporter TFs (Table 2). Among the 125 proteins of these paths, TORC1 components Tor1p and Tco89p and TORC2 components Tsc11p (Avo3p), Bit2p, and the common member of the two complexes, Lst8p, were identified.
Signaling Initiators (Starting Proteins) That Reveal Linear Paths (Path Score >0.9275)
Target Proteins (Reporter Transcription Factors) of the Linear Paths (Score >0.9275)
Network-based multiomics integrative analysis identifies novel components of TOR signaling.
TOR, target of rapamycin.
A hypothetical TOR-mediated rapamycin-/caffeine-signaling network
The mapping of significant paths to construct hypothetical TOR-mediated rapamycin- and caffeine-signaling network resulted with an intertwined topology (Fig. 4). Through a comprehensive literature survey on biological roles of the network proteins and integration of phenotypic information on rapamycin and/or caffeine sensitivity, we identified four proteins (i.e., Atg14p, Rim20p, Ret2p, and Spt21p) with unknown molecular functions and three proteins (i.e., Ylw257wp, Ymr295cp, and Ygr017wp) with unknown molecular function and biological process information, which were reported to have rapamycin- or caffeine-sensitive phenotypes.
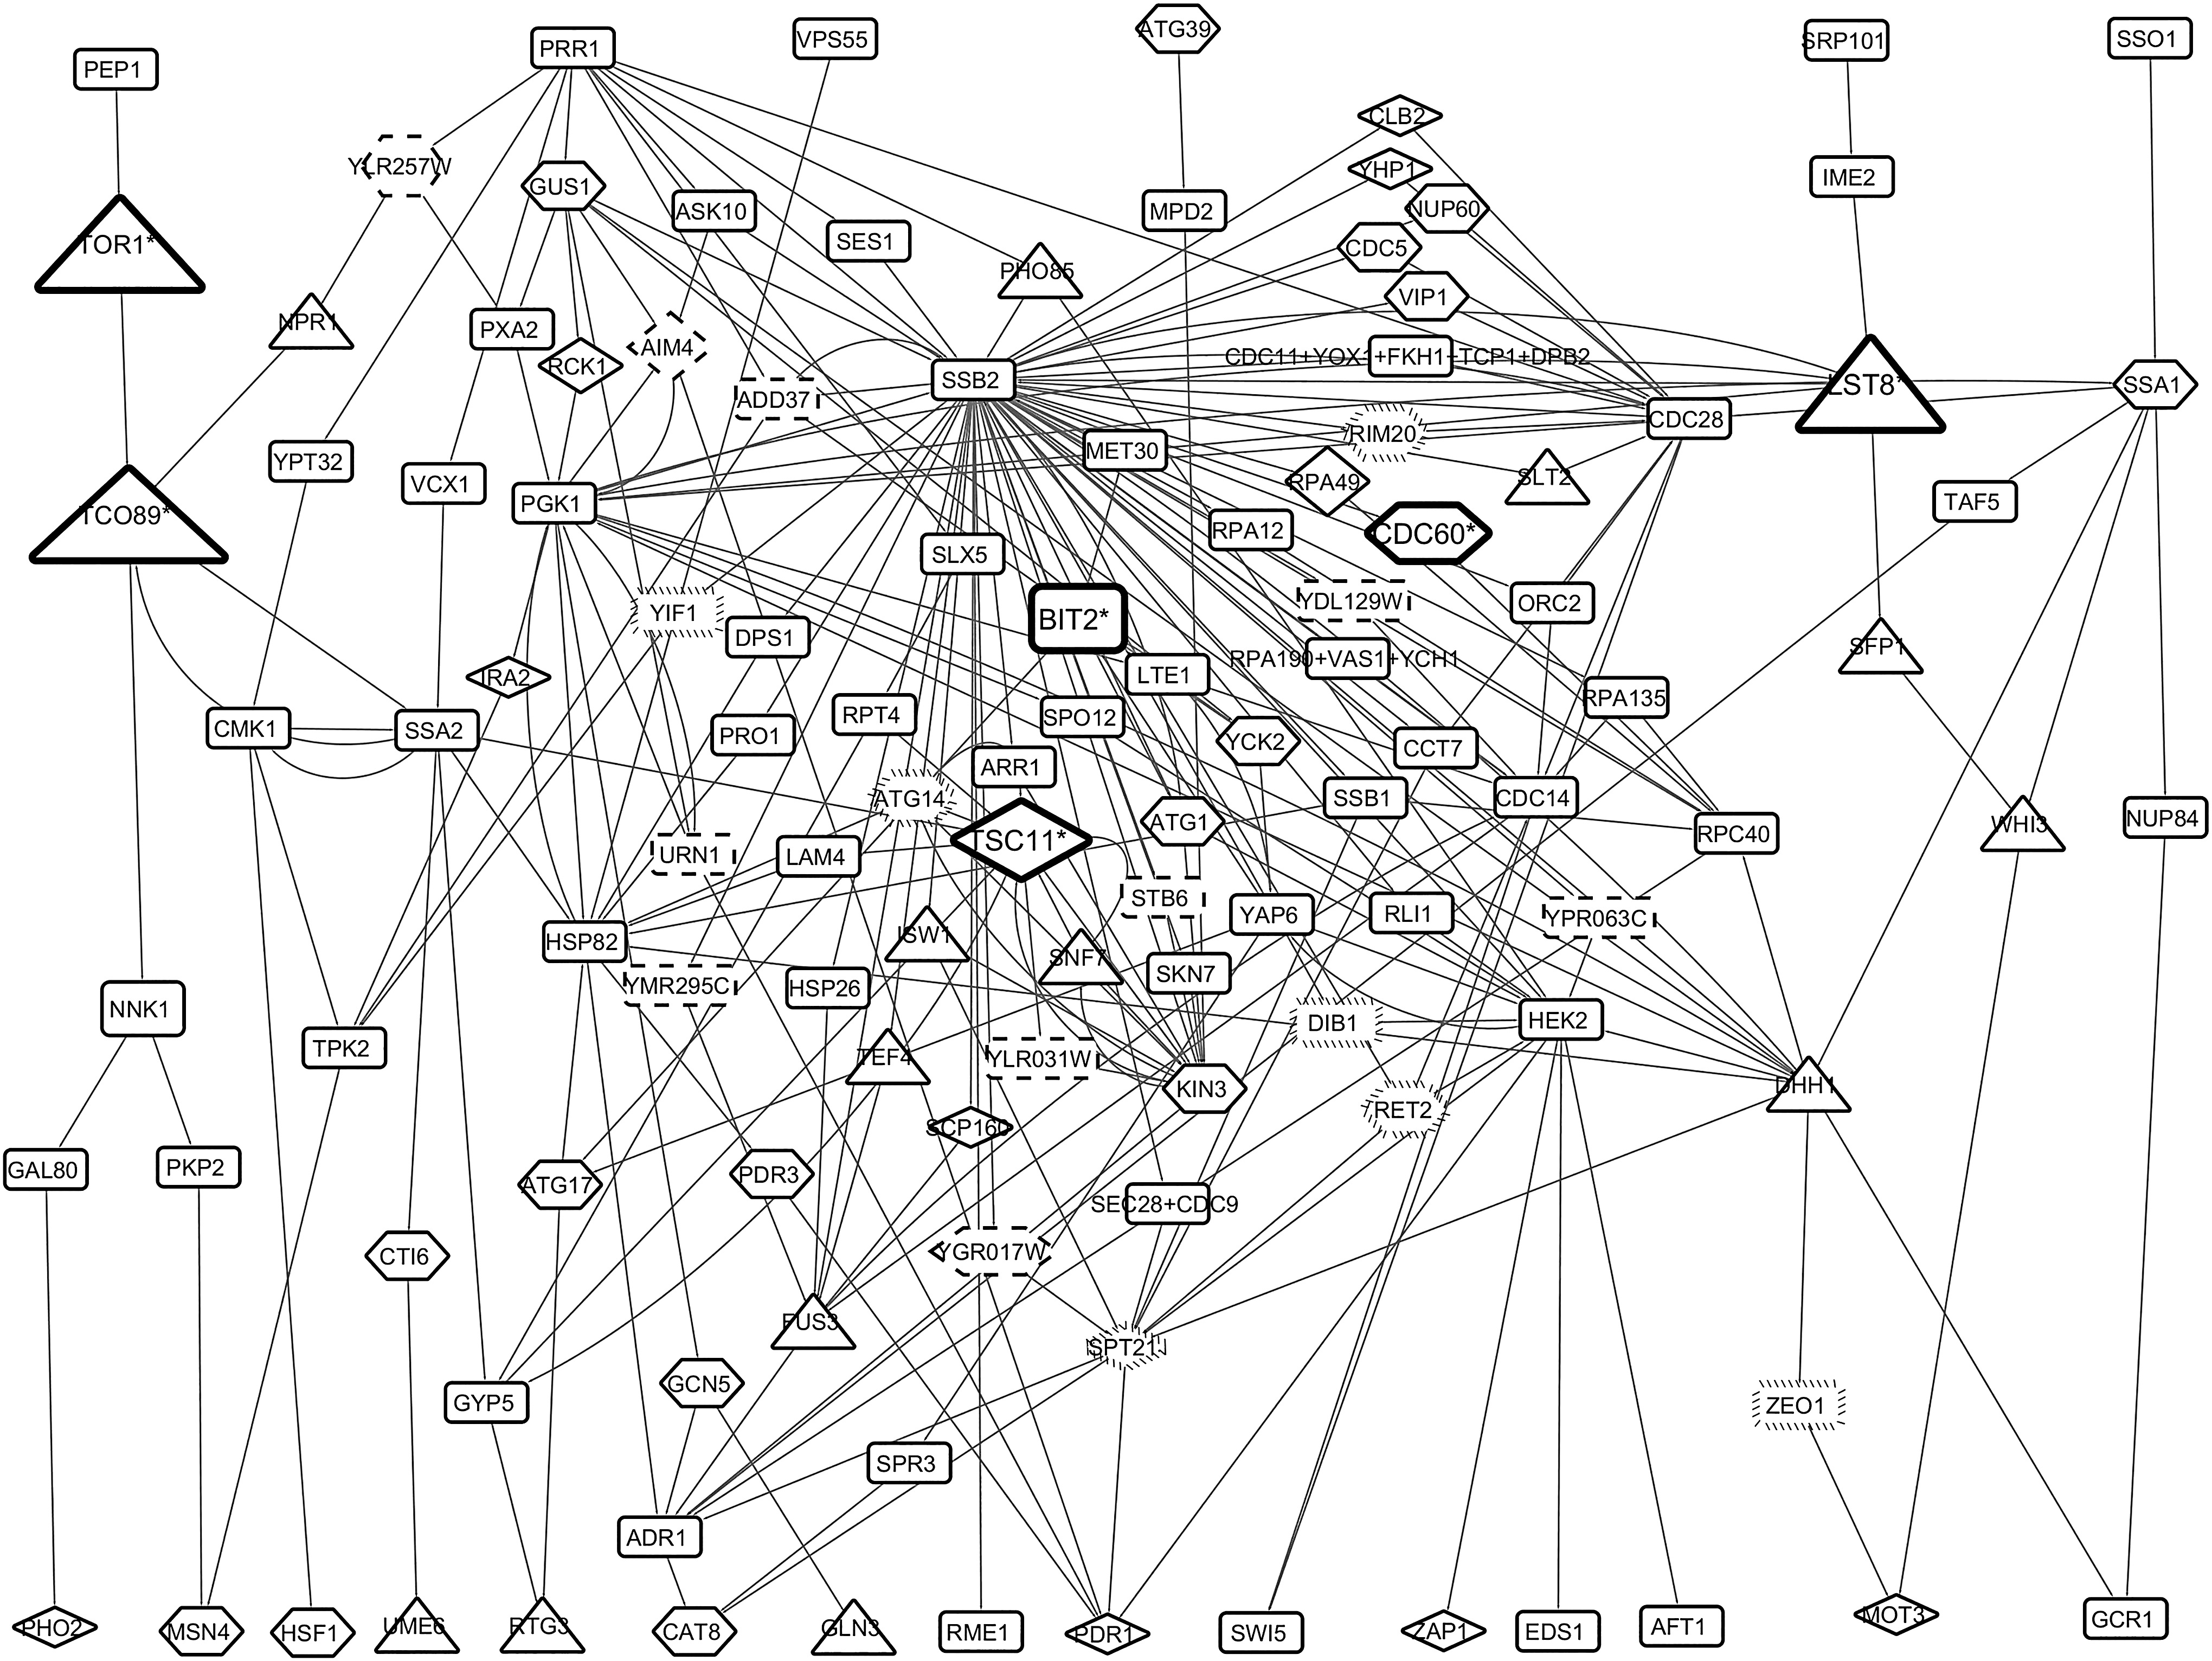
The intertwined structure of hypothetical TOR-mediated rapamycin- and caffeine-signaling network. Hexagonal and diamond nodes indicate the proteins, their overexpression, or null mutations reported to be sensitive to rapamycin or caffeine, respectively. Triangle nodes represent the proteins, their overexpression, or null mutations reported to be sensitive to both rapamycin and caffeine. Triangle nodes in bold and the protein names with asterisks represent the members of TORC1 or TORC2 complexes, nodes with dash borders represent the proteins with unknown molecular function and biological processes, nodes with backward slash borders represent proteins with unknown molecular function. Receptor proteins are located in the upper part, as the first proteins of the paths, and TFs are located in the bottom part, as the last proteins of the paths.
Discussion
Integration of multiomics data is valuable for understanding and a better characterization of complex biological processes in cells to identify novel biomarkers and drug targets. Diseases are generally regulated by complex signaling networks comprising a set of genes that coordinate and interact with each other. Multiomics data integration facilitates the extraction of information from multiple datasets that cannot be gained from any single dataset alone. A number of studies have taken the advantage of application of pathway- and network-based approaches on multiomics data to build a comprehensive model for the data-driven biomarker and drug target discovery (Calimlioglu et al., 2015; Cun and Fröhlich, 2013; Dayan et al., 2017; Gov et al., 2017; Karagoz et al., 2015; Li and Zhan, 2015).
TOR, as being the main regulator of anabolism and catabolism in response to several environmental and stress conditions, lies in the heart of signaling networks that control cellular growth. Since it is implicated in several pathologies, TOR-signaling pathway has always been an appealing target for studies aiming to elucidate its mechanism, thanks to rapamycin, the direct inhibitor of TORC1.
In addition to rapamycin, caffeine has also been reported to directly inhibit TORC1 (Rallis et al., 2013; Reinke et al., 2006; Saiki et al., 2011) and show similar effects to rapamycin on several processes such as transcription, ribosome biogenesis and assembly, amino acid and protein synthesis, nitrogen catabolite repression, stress response, cell wall integrity, autophagy, and life span extension (Huber et al., 2009; Kuranda et al., 2006). The remarkably high number of common genes significantly expressed in response to both rapamycin and caffeine obtained through our comparative analysis further supported the findings of previous studies (Fig. 1).
This observation oriented us to hypothesize that TOR signaling could be mediated through common upstream and downstream regulators in response to rapamycin and caffeine, that is, a common intracellular signal transduction pathway. Therefore, tracking the signaling routes in the presence of these chemicals could help us to elucidate new components of this mechanism. For this purpose, we followed a multiomics integrative framework to build a TOR-mediated rapamycin- and caffeine-signaling model to unravel unknown upstream components, which transduce the signal to TORC1/TORC2, and downstream components of TOR signaling, which in turn regulates several diverse biological processes.
To identify possible TOR-mediated signaling routes, we constructed a protein-protein interaction network around the annotated proteins of TOR signaling. The topological analysis of the network revealed its scale-free characteristics as in many biological networks. The network diameter and characteristic path length were also order of magnitude significantly smaller than the number of proteins in the network, meaning that despite the large size of the network, any two nodes in the network can be reached by relatively short paths along existing links, emphasizing the small world characteristics of the reconstructed network.
In addition, analysis of the modular structure of the TOR-signaling network demonstrated that the reconstructed network consists of modules of proteins related with the processes, such as ribosome biogenesis, rRNA processing, transport, response to stress, transcription, and regulation of transcription, chromatin remodeling/silencing, cell wall organization, and autophagy, which are the well-known processes that are regulated by TOR signaling, and hence the reconstructed network could function as a proper model to identify the new components of TOR-mediated signaling in S. cerevisiae.
To focus on the intracellular signaling events, we employed all 81 proteins annotated with receptor activity or specified as receptors in their descriptions in SGD as potential signaling initiators, since no rapamycin- or caffeine-responsive receptor was predicted in the genome of any organism and both rapamycin and caffeine are able to diffuse from plasma membrane. Similarly, considering the previous experiences indicating that TOR signaling regulates the transcription of genes functioning in diverse biological processes, we identified 27 reporter TFs around which the common transcriptional changes are significantly concentrated in response to rapamycin and caffeine treatments, and set them as potential target components of the signaling routes.
The majority of these reporter TFs were regulating stress response, nutrient limitation, ion homeostasis, carbon and nitrogen metabolisms, glycolysis, gluconeogenesis, and cell cycle processes.
Identification of all possible TOR-mediated signaling routes on the reconstructed TOR signaling network (considering 81 potential signaling initiators and 27 potential target components), filtering the identified signaling paths in terms of the presence of any component of TORC1 and TORC2 complexes, and scoring the TOR-mediated signaling paths according to the co-expression levels of adjacent genes resulted in a total of 201 paths, which were starting from six signaling initiator proteins (i.e., Atg39p, Pep1p, Prr1p, Srp101p, Sso1p, and Vps55p) (Table 1) and targeting 16 reporter TFs (Table 2).
Among these receptors, Atg39p is an autophagy receptor with a role in the degradation of the ER and nucleus, and Sso1p, a yeast orthologue of Syntaxin-1A (Stx1Ap), has SNAP receptor activity and one of the essential components of vesicular trafficking. Expressions of both receptors are controlled by TORC1 (Nakatogawa and Mochida, 2015). Pep1p is a type I transmembrane sorting receptor for multiple vacuolar hydrolases, Prr1p has protein serine/threonine kinase activity, Srp101p is an SRP receptor alpha subunit, and Vps55p is a functional homolog of human obesity receptor gene-related protein.
The targeted TFs were regulating genes in diverse biological processes such as iron utilization and homeostasis (Atf1p), nitrogen catabolite repression and assimilation (Gln3p and Rtg3p), response to stress (Hsf1p, Mot3p, and Msn4p,), glycolysis (Adr1p and Gcr1p), nonfermentative growth (Cat8p), phosphate metabolism (Pho2p), pleiotropic drug response (Pdr1p), cell cycle (Swi5p), and meiosis (Rme1p and Ume6p). Among those, Rtg3p is a bHLH/Zip TF that activates retrograde (RTG) and TOR pathways; Eds1p and Zap1p are zinc-regulated TFs, which bind to zinc-responsive promoters to induce transcription of certain genes in presence of zinc, and repress other genes in low zinc. The regulations of nitrogen assimilation pathways (through Npr1p, Gln3p, and Rgt1p/Rgt3p), stress response (through Msn2p/Msn4p), and autophagy (through Atg1p) by TORC1 were previously documented (Hughes Hallett et al., 2014b; Loewith and Hall, 2011).
The joining of the paths constituted a hypothetical TOR-mediated rapamycin- and caffeine-signaling network (Fig. 4), which consisted of already known and candidate signaling mediators of TOR-mediating signaling in yeast. Through a comprehensive literature survey on biological roles of network proteins and integration of phenotypic information on rapamycin and/or caffeine sensitivity, we suggested several nonannotated proteins (i.e., Atg14p, Rim20p, Ret2p, Spt21p, Ylr257wp, Ymr295cp, and Ygr017wp) as potential components in the regulation of diverse biological processes through TOR-mediated signaling in S. cerevisiae.
Among these proteins, the null mutation of ATG14 was reported to show abnormal protein/peptide distribution in response to rapamycin (Araki et al., 2013; Sakoh-Nakatogawa et al., 2015), while null mutation of RIM20 (Xie et al., 2005) and overexpression of RET2 were reported to show decreased resistance to rapamycin (Butcher et al., 2006). Moreover, the null mutation of YLR257w (Huber et al., 2009) and overexpression of YGR017w (Butcher et al., 2006) were reported to show increased resistance to rapamycin.
When the topology of the network was investigated, we observed that removal of either node does not affect the transduction of signal to any TF in this network (Fig. 4). The only protein that cannot be reached according to the network topology upon removal of Ylr257wp is Npr1p, which is sensitive to both rapamycin and caffeine and reported to be negatively regulated through phosphorylation by TOR complex and have a role in regulation of nutrient permeability according to environmental variations together with TORC1 (Boeckstaens et al., 2015; Xie et al., 2005). Therefore, we suggest that further investigation of these unknown function proteins, particularly Ylr257wp, would enable us to unravel possible new effectors of TOR signaling.
Conclusions
Despite the numerous studies and increased knowledge on TOR signaling, we are still far from a complete understanding of this complex signaling network. Multiomics data integration is a valuable approach to understand and better characterize the complex biological systems as well as to identify its novel components. In this study we aimed to identify previously undiscovered components of TOR signaling by taking the advantage of direct and specific inhibition of TOR signaling by rapamycin and caffeine. For this purpose, we carried out a network-based multiomics integrative analysis employing data from transcriptomics, interactomics and regulomics sources in yeast.
In this study, we constructed TOR-signaling protein-protein interaction network to use as a model to search for linear rapamycin- or caffeine-signaling routes. To define the target proteins of the routes, we integrated transcriptome data of yeast cells, grown in the presence of rapamycin or caffeine, with yeast TRN. Scoring the linear paths passing from at least one component of TORC1 or TORC2 according to the co-expression levels of adjacent genes within the paths resulted with 201 significant linear paths, including seven previously unannotated proteins, namely, Atg14p, Rim20p, Ret2p, Spt21p, Ylr257Wp, Ymr295cp, and Ygr017wp, as potential components of TOR-mediated rapamycin and caffeine signaling in S. cerevisiae.
In our opinion, investigation of the role of Ylr257wp would be particularly informative since it was the only protein that its removal from the constructed network blocked the signal transduction to the TORC1 effector kinase Npr1p. This study highlights the multiomics integrative approaches as valuable tools in the discovery of novel components of signaling pathways, which could not be possible by using single data source. The results of this study make an original contribution to biomedical literature and our approach to data integration could be applied to other signaling networks to discover their potential components.
Footnotes
Acknowledgments
This work was supported by Marmara University Research Fund (BAPKO) through FEN-A-091116-0496 project, University of Padova Junior Project Grants: “Dynamic Modeling of TOR signaling pathway through systems biology approaches,” TUBITAK 110M692 project, Turkish State Planning Organization DPT-09 K120520 project, and the Boğaziçi University Research Fund 1932 project. Duygu Dikicioğlu would like to thank the Leverhulme Trust (ECF-2016-681) and the Isaac Newton Trust. The authors thank Tiziana Sanavia for comments and assistance in this study.
Author Disclosure Statement
The authors declare that no conflicting financial interests exist.

Abbreviations Used
References
Supplementary Material
Please find the following supplemental material available below.
For Open Access articles published under a Creative Commons License, all supplemental material carries the same license as the article it is associated with.
For non-Open Access articles published, all supplemental material carries a non-exclusive license, and permission requests for re-use of supplemental material or any part of supplemental material shall be sent directly to the copyright owner as specified in the copyright notice associated with the article.
