




Abstract
The Slit-Robo family of axon guidance molecules works in concert, playing important roles in organ development and cancer. Expressions of individual Slit-Robo genes have been used in calculating univariable hazard ratios (HRuni) for predicting cancer prognosis in the literature. However, Slit-Robo members do not act independently; hence, hazard ratios from multivariable Cox regression (HRmulti) on the whole gene set can further lead to identification of cancer-specific, novel, and independent prognostic gene pairs or modules. Herein, we obtained mRNA expressions of the Slit-Robo family consisting of four Robos (ROBO1/2/3/4) and three Slits (SLIT1/2/3), along with four types of survival outcome across cancers found in the Cancer Genome Atlas (TCGA). We used cluster heat maps to visualize closely associated pairs/modules of prognostic genes across 33 different cancers. We found a smaller number of significant genes in HRmulti than in HRuni, suggesting that the former analysis was less redundant. High ROBO4 expression emerged as relatively protective within the family, in both types of HR analyses. Multivariable Cox regression, on the other hand, revealed significantly more HR signatures containing Slit-Robo pairs acting in opposing directions than those containing Slit-Slit or Robo-Robo pairs for disease-specific survival. Furthermore, we discovered, through the online app SmulTCan's lasso regression, Slit-Robo gene subsets that significantly differentiated between high- versus low-risk prognosis patient groups, particularly for renal cancers and low-grade glioma. The statistical pipeline reported herein can help test independent and significant pairs/modules within a codependent gene family for cancer prognostication, and thus should also prove useful in personalized/precision medicine research.
Introduction
Initially discovered in the nervous system, the Slit-Robo pathway has been the focus of recent research due to its role in organ development (Blockus and Chedotal, 2016), as well as tumor progression and angiogenesis in several human cancers (Tong et al., 2019). Slits are large, secreted proteins, whose axonal repulsive activities are mediated by receptors of the Roundabout (Robo) family. The three Slit and four Robo genes are known to act in pairs/modules (Carr et al., 2017; Wu et al., 2001) and might be co-expressed tissue specifically.
For instance, in liver cancer, Slit-Robo members form two distinct co-expression modules, splitting into clusters of ROBO1-ROBO2-SLIT1 and ROBO4-SLIT2-SLIT3 (Avci et al., 2008). In others, the ROBO1-SLIT2 pair emerges frequently, for example, in breast cancer, ROBO1 as well as ROBO2 are present while deeming SLIT2 a potential chemoattractant (Choi et al., 2014; Qin et al., 2015; Rezniczek et al., 2019).
In gastric cancer, ROBO1 and SLIT2 are both downregulated (Xia et al., 2019), while SLIT2, upregulated in renal cell tumors, is expressed by human embryonic kidney cells where ROBO1 activation leads to malignancy (Ho et al., 2017; Zhou et al., 2011). In addition to these, SLIT2 can pair with ROBO3 in regulation of the migration of Gonadotropin-releasing hormone (GnRH) neurons (Cariboni et al., 2012), and with ROBO4 in inhibition of pathological neovascularization in the retina (Jones et al., 2009). On the other hand, the SLIT3-ROBO4 pair can promote angiogenesis and vascularization in engineered stem cells (Paul et al., 2013).
The abovementioned findings strongly indicate that Slit-Robo pairs/modules may function as oncogenes or tumor suppressors cancer and tissue specifically. Indeed, previous studies have associated the misexpression of Slit-Robo pathway members with prognostic significance in multiple cancers primarily through univariable survival analyses (Schmid et al., 2007; Xia et al., 2019; Zhang et al., 2015). However, there is not yet a pan-cancer Slit-Robo family analysis using multivariable Cox regression, which can provide cancer-specific independent prognostic signatures.
Survival analyses performed on gene sets report univariable as well as multivariable estimates using Kaplan–Meier (K-M) plots and tables of HR (Chen et al., 2020; Meng et al., 2020). Most often, the univariable estimates are primarily used to filter genes before the multivariable analysis and reduce the size of the gene set (Wu et al., 2020). Obtaining risk scores [e.g., RNA processing genes in colorectal cancer (Lu et al., 2020)] as well as predicting the best subsets of a given gene set (e.g., netrins and their receptors (Ozhan et al., 2021)) are among many advantages of using multivariable Cox regression models.
Herein we report the hazard ratio estimates (HRuni and HRmulti) of univariable and multivariable Cox regression using Slit-Robo pathway expression from the Cancer Genome Atlas's Pan-Cancer (TCGA-PANCAN) dataset (Gao et al., 2019) obtained from UCSC Xena (Goldman et al., 2020). Both HRuni and HRmulti estimates identified ROBO4 expression as the most protective, while the HRmulti signatures of Slit-Robo pairs acting in opposite directions were more common than any other Slit-Robo, Slit-Slit, or Robo-Robo pairs. These findings suggest that Slits and Robos may balance each other in their expression, and/or those that pair may work together.
Moreover, a median prognostic index (PI) calculated from Slit-Robo models using SmulTCan (Ozhan et al., 2021) successfully differentiated between high- and low-risk groups for several cancers, including those of the kidney and low-grade glioma. Our findings implicate that gene families that exhibit interdependence, such as Slit-Robo, can benefit from multivariable Cox regression to establish the most influential and independent family members.
Materials and Methods
Computation of HR matrices
The results shown in this study are in whole or in part based upon data generated by TCGA Research Network: https://www.cancer.gov/tcga/.
The TCGA-PANCAN TSV file containing normalized RNA-Seq expression values of the four Robos and the three Slits was obtained from UCSC Xena (http://xena.ucsc.edu). This file contained tissue samples across 33 TCGA datasets for the Slit-Robo genes (https://portal.gdc.cancer.gov). Primary (or primary blood derived for LAML) tumor samples for each survival type, that is, overall survival (OS), disease-specific survival (DSS), disease-free survival (DFS), and progression-free survival (PFS), were separately analyzed with Cox regression.
The “UCSCXenaTools” Bioconductor package (Wang and Liu, 2019) was used to download survival TXT files of each of the datasets from TCGA. Sample sizes of each dataset consisting of primary tumors in the downloaded PANCAN file from Xena having expression values of all Slit-Robo members are shown in Supplementary Table S1; these samples were used in multivariable Cox regression and best-subset coefficient computations.
The SmulTCan's statistical pipeline was adopted to calculate the HRuni and HRmulti values as described previously (Ozhan et al., 2021). Briefly, an HR and its associated p-value were calculated for each of the seven Slit-Robo genes in each cancer dataset from both univariable and multivariable Cox regressions, using the coxph() function of the “survival” package in R (Therneau and Grambsch, 2000). This function was also used in calculating low:high risk ratios of the PI analyses (Ozhan et al., 2021).
Datasets GBM, SKCM, THYM, and UVM were excluded from both univariable and multivariable DFS analyses, due to absence of information regarding DFS. THYM was excluded from the DSS, while KICH and MESO were excluded from the DFS analyses due to multivariable models not converging. The LAML dataset was used only in the univariable Slit-Robo analyses for OS, since it lacks data for the remaining survival types.
Statistical comparison of univariable and multivariable Cox regression results
We summarized, with a workflow diagram, the steps of statistical comparisons performed between the HRuni and HRmulti matrices where the rows represented the cancers, and the columns each of the seven Slit-Robo family members (Supplementary Fig. S1). Euclidean distances of HRuni and HRmulti matrices were calculated with the default parameters of dist() in R. To equalize matrix dimensions for each survival type, the corresponding dataset in HRuni was removed for which there were no HRmulti entries. Datasets excluded from HRuni matrices were LAML in OS and PFS; LAML and THYM for DSS; and GBM, SKCM, THYM, UVM, LAML, KICH, and MESO for DFS.
HRuni and HRmulti matrices were then compared using the Mantel test to identify the correlation between these matrices by the “cultevo” package with the Spearman method (Stadler, 2018); and the correlation constant r ± the standard error (SE) was reported. Differences between element-wise Euclidean distances of HRuni and those of HRmulti from Cox regressions were obtained for each Slit-Robo member in each survival dataset and the box plots were drawn. The numbers of genes significant in HRuni and HRmulti, separately, were calculated and tested in a pair-wise manner with the Wilcoxon signed-rank test. Finally, for each survival type, we calculated the χ2 statistic and its p-value to test the significance of association between Slit-Robo (SR) or Slit-Slit/Robo-Robo (SS/RR) pairing and the direction of the HR. The analyses were carried out in the R v4.0.0 environment (www.r-project.org).
Data visualization
Visualization of univariable and multivariable Cox regression results with heat maps was achieved using packages “gtools” (Warnes et al., 2020) and “heatmaply” (Galili et al., 2018). The “heatmaply” package incorporating the hclust() function of R was used for hierarchical clustering with “complete” linkage. “RColorBrewer” (Neuwirth, 2014) and “ggpubr” (Kassambara, 2020) were used in coloring and arranging the positions of the plots.
In the heat maps, logarithmically transformed HR values (log2HR
Computation of PIs for the best subsets of the Slit-Robo pathway
The percent area under the receiver operating characteristics (ROC) curve (AUC) calculations was made with tools from the “riskRegression” package (Gerds and Ozenne, 2020). The cv.glmnet() function from “glmnet” was used to compute coefficients of Slit-Robo using lasso, with the “nfolds” parameter set to the sample size of each dataset and the “family” parameter set to “cox”. A prognostic index (PI i ) for the ith sample in a cancer dataset was calculated as previously defined (Ozhan et al., 2021; Xue et al., 2019). Samples with a PI i value greater than the median PI for the dataset were labeled as high risk, while remaining samples were deemed low risk. The survfit() function of “survival” was used to determine p-values of the K-M analyses.
Results
Comparison of HRuni and HRmulti clusters of Slit-Robo family across TCGA datasets
Mantel's test provided a statistics for the comparison of HRuni and HRmulti matrices of Slit-Robo members and indicated that the two matrices were significantly, but moderately correlated for OS (r = 0.68 ± 0.14, p = 0.01 × 10⁻¹), DSS (r = 0.71 ± 0.15, p = 0.01 × 10⁻¹), DFS (r = 0.75 ± 0.16, p = 0.01 × 10⁻¹), and PFS (r = 0.74 ± 0.13, p = 0.01 × 10⁻¹). However, the number of genes found significant in HRmulti was less than that in HRuni (Table 1), suggesting the former was less redundant. Accordingly, both HRuni and HRmulti identified the higher expression of ROBO4 in association with better survival, in general.
Number of Significant Genes (p < 0.05) for Univariable and Multivariable Analysis Results for Each Gene in Each Survival Type
The number of significant genes in the univariable and multivariable analyses was pair-wise compared for each gene, and the Wilcoxon signed-rank p-values have been indicated for each survival type.
DFS, disease-free survival; DSS, disease-specific survival; Multi, multivariable; OS, overall survival; PFS, progression-free survival; Uni, univariable.
The mean difference values between Euclidean distances of HRuni and HRmulti estimates per gene were less than zero for all four survival types (Supplementary Fig. S2). This suggested that TCGA cancers became more similar among themselves according to the estimates of HRmulti. This was also supported by the shortened branch lengths among cancers in the heat map of HRmulti in each of the four survival types (Figs. 1–4) when compared with HRuni (Supplementary Figs. S3 and S4).
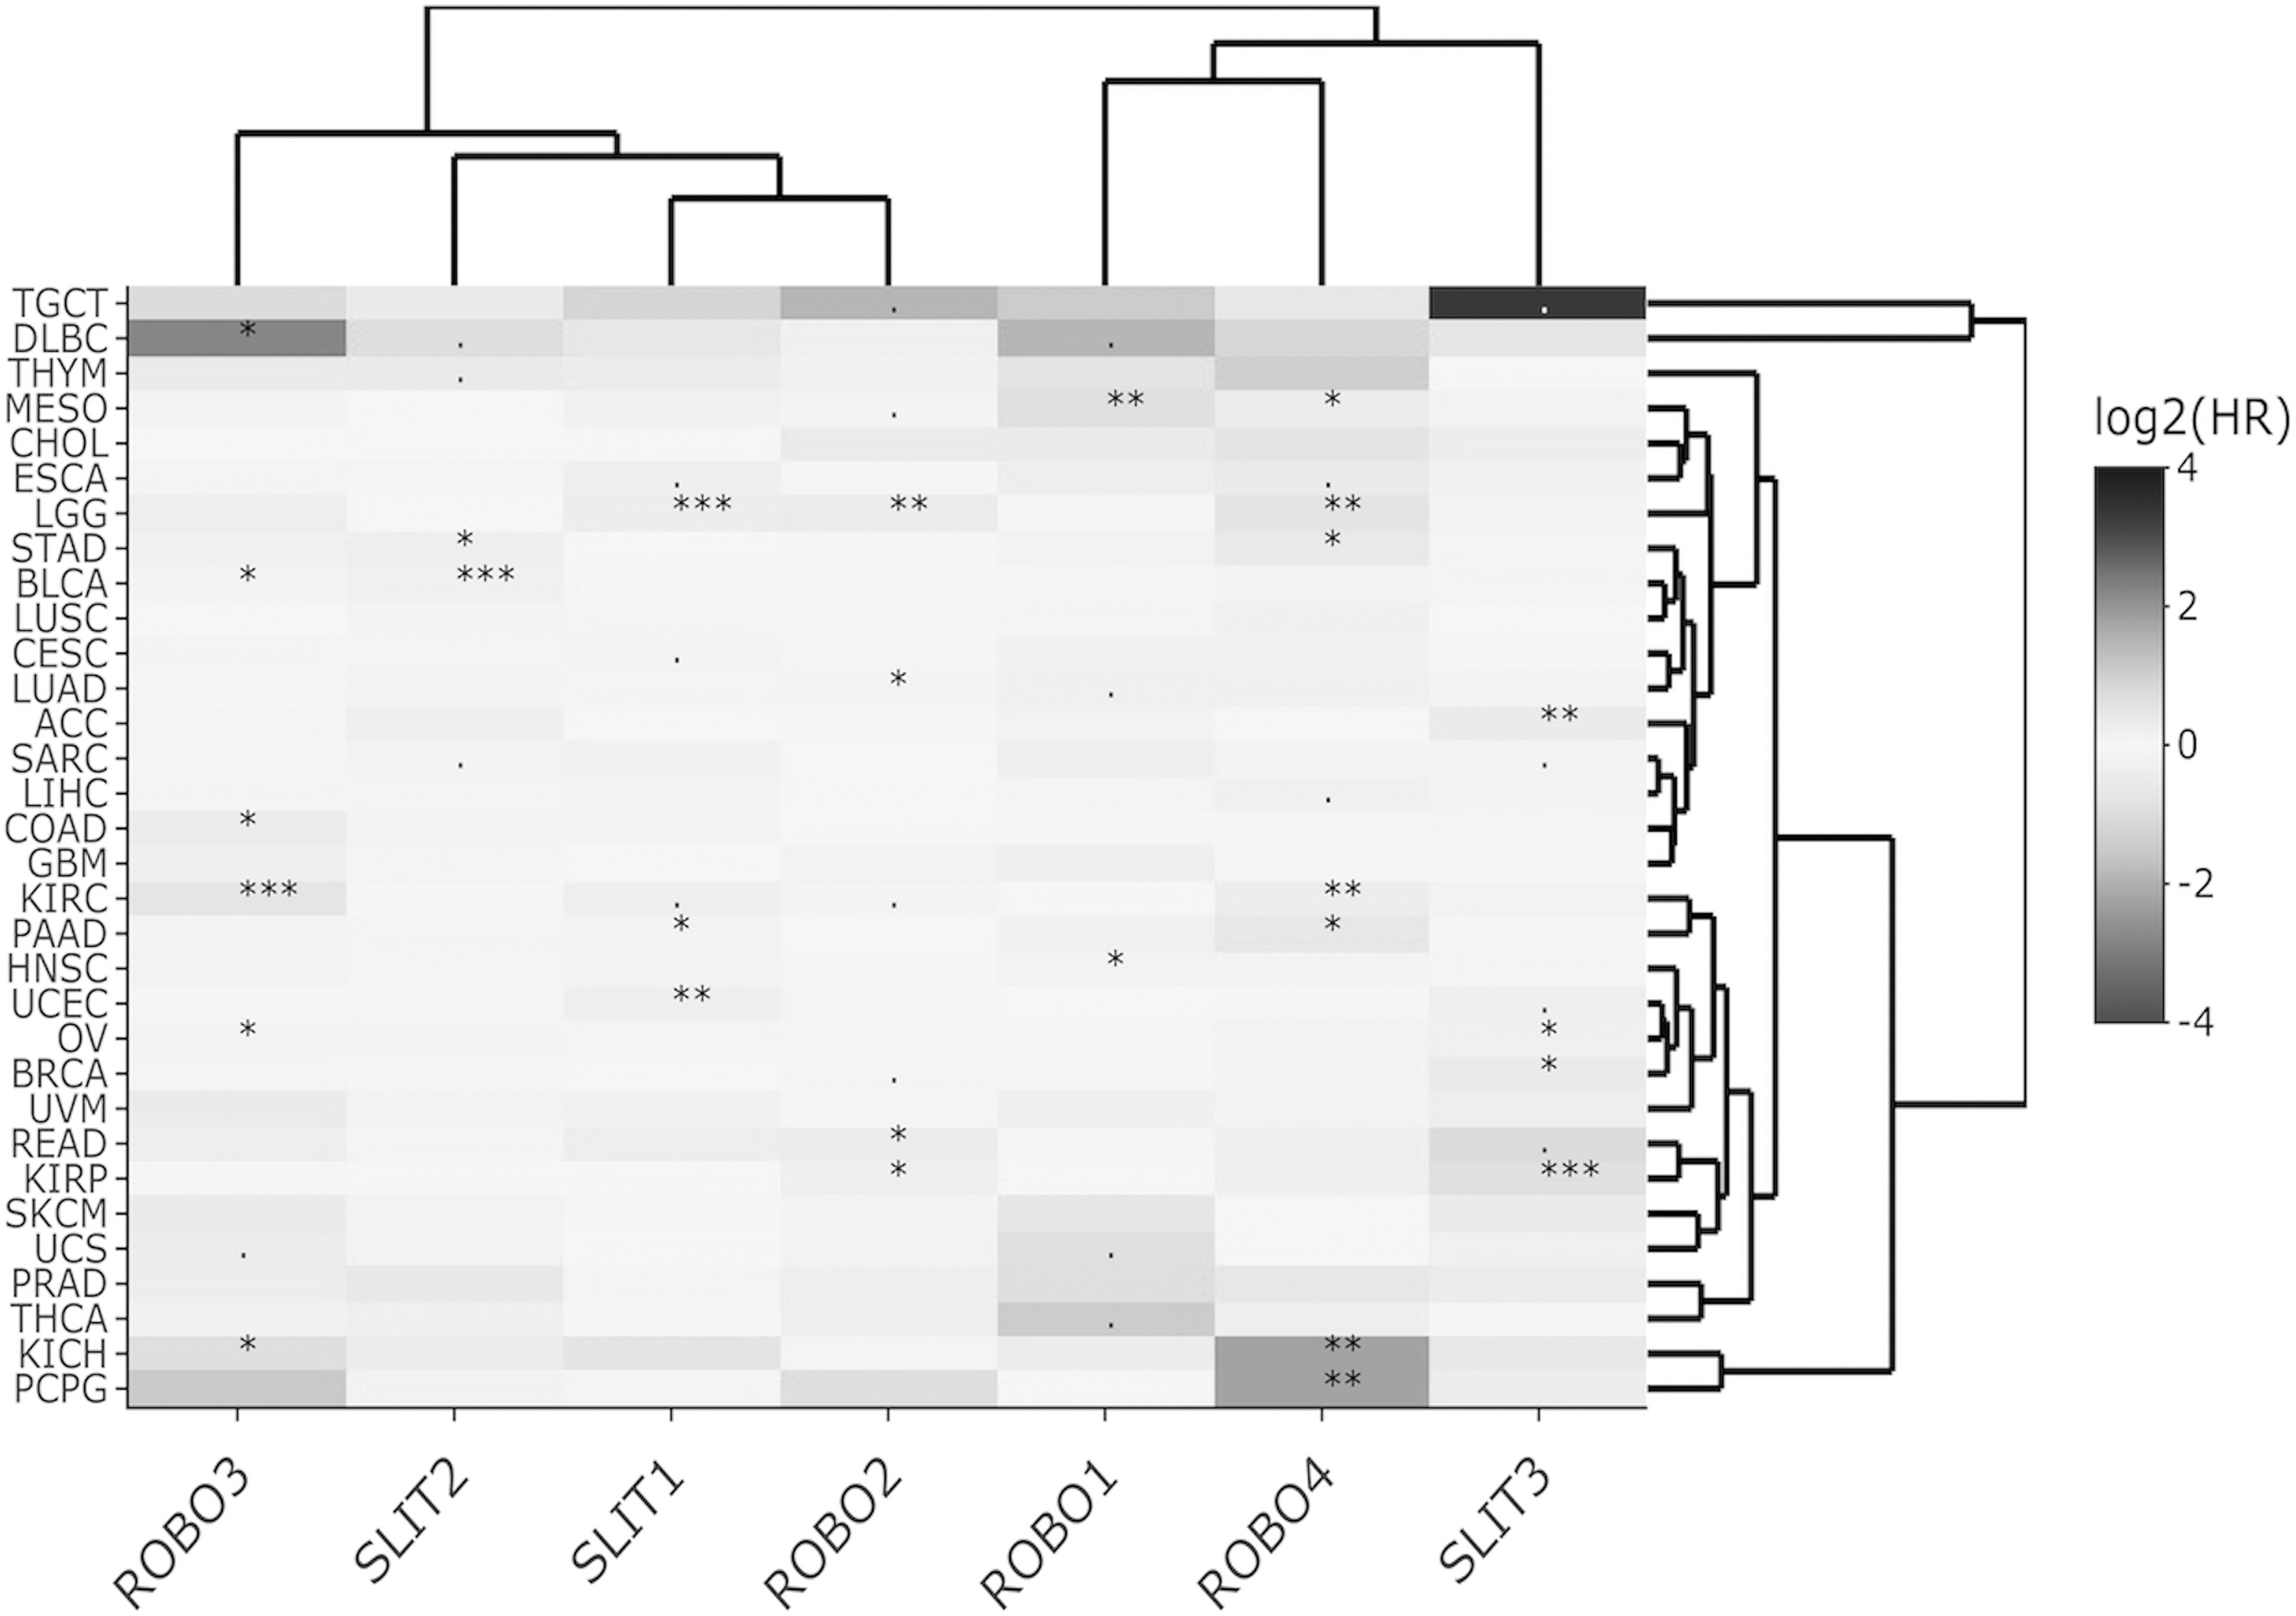
Heat map of Slit-Robo OS log2HR values across TCGA datasets for multivariable Cox regression. Significant HR associations are indicated with *** for p < 0.001, ** for p < 0.01, * for p < 0.05, and + for p < 0.1. HR, hazard ratio; OS, overall survival.
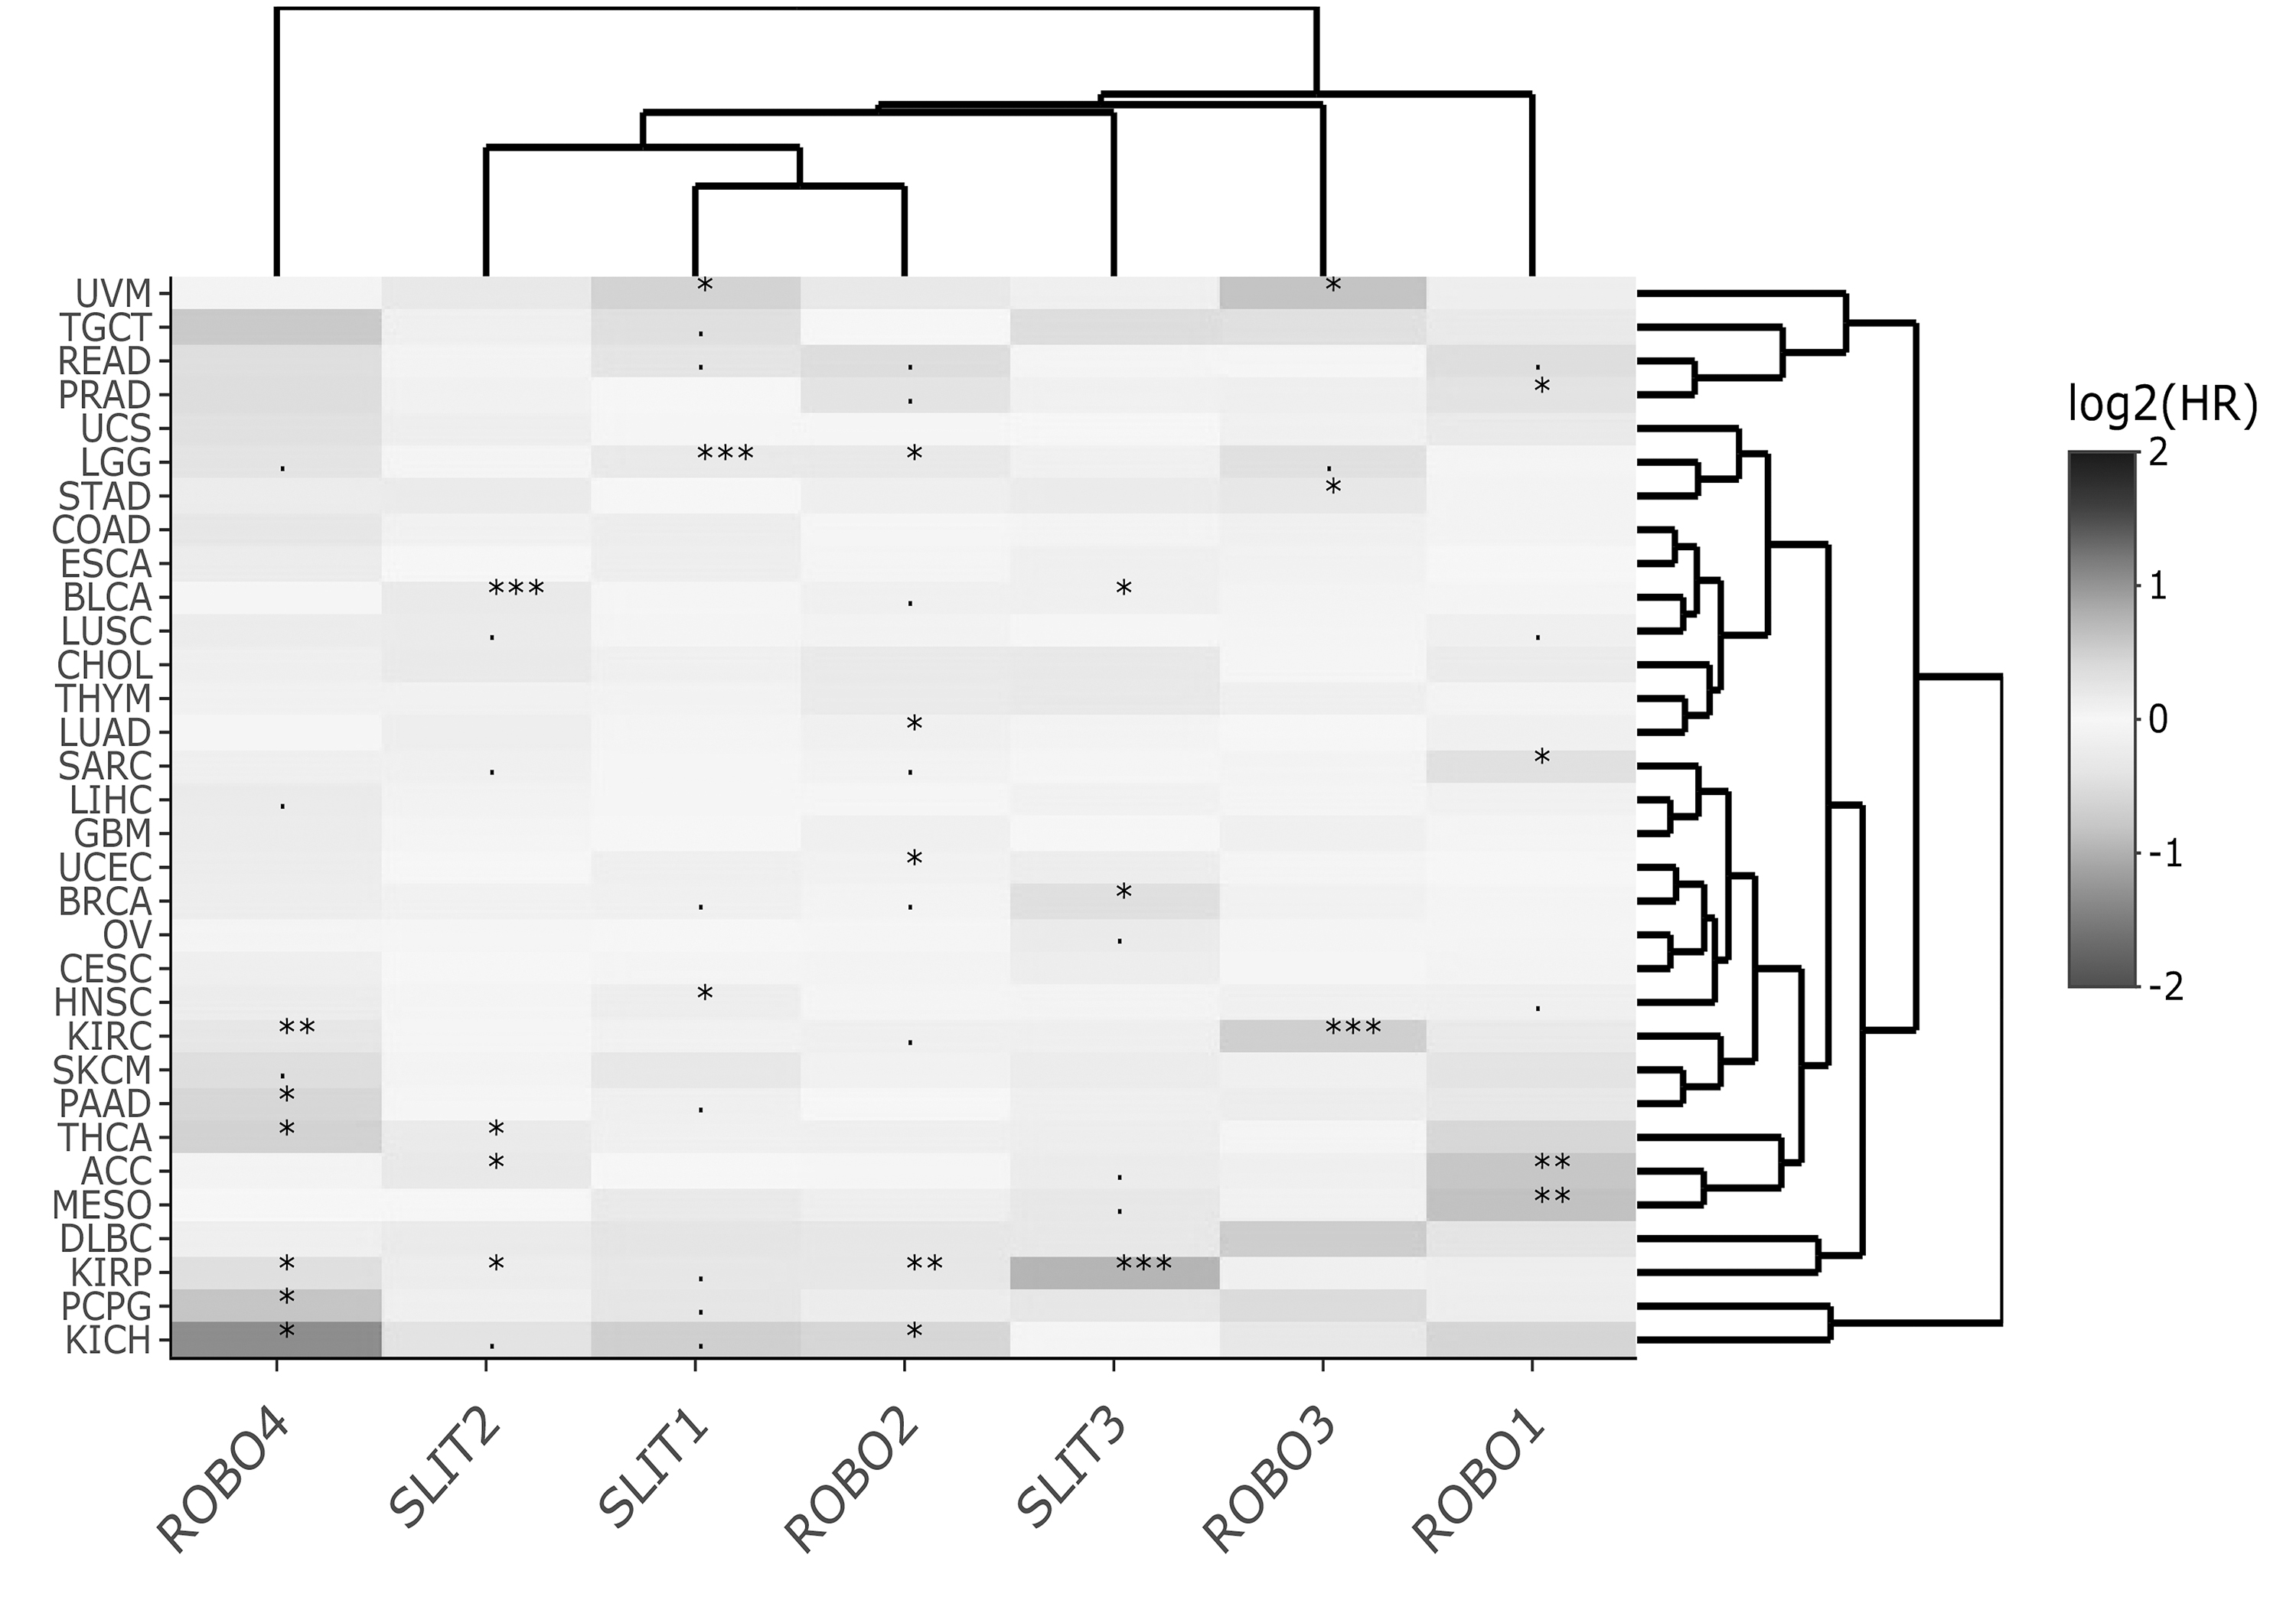
Heat map of Slit-Robo PFS log2HR values across TCGA datasets for multivariable Cox regression. Significant HR associations are indicated with *** for p < 0.001, ** for p < 0.01, * for p < 0.05, and + for p < 0.1. PFS, progression-free survival.
Moreover, the topology of HRmulti heat map revealed that log2HR-based clustering distinctly grouped the TCGA cancers, given their prognostic similarities rather than just their Slit-Robo expression patterns, that is, the cancers within the same cluster had more similar HR estimates across the gene set and hence the prognostic signature (Figs. 1–4). This represents a relatively novel approach to investigate gene or cancer clustering in transcriptomics. Interestingly, we found that female cancers BRCA, OV, CESC, and UCEC frequently clustered together, while BLCA-LUSC, SARC-LIHC, KICH-PCPG, and KIRC-PAAD were among other cancers paired in two or more survival types (Figs. 1–4).
On the other hand, the cluster heat maps of HRmulti estimates column-wise provided more insight into which genes exhibited similar HR profiles. For OS, two main clusters, namely, ROBO3-SLIT1-SLIT2-ROBO2 and ROBO1-ROBO4-SLIT3, emerged (Fig. 1). For DSS, the Slit-Robo family split into more prominent pairs, that is, SLIT3-ROBO4, SLIT2-ROBO3, and SLIT1-ROBO2 (Fig. 2). For DFS, ROBO1, ROBO2, and ROBO3, each paired with a different Slit, SLIT1, SLIT2, and SLIT3, respectively, while ROBO4 was found separately (Fig. 3). In PFS clustering, again ROBO4 diverged from the rest of the members, and ROBO2-SLIT1-SLIT2 were more closely associated (Fig. 4).
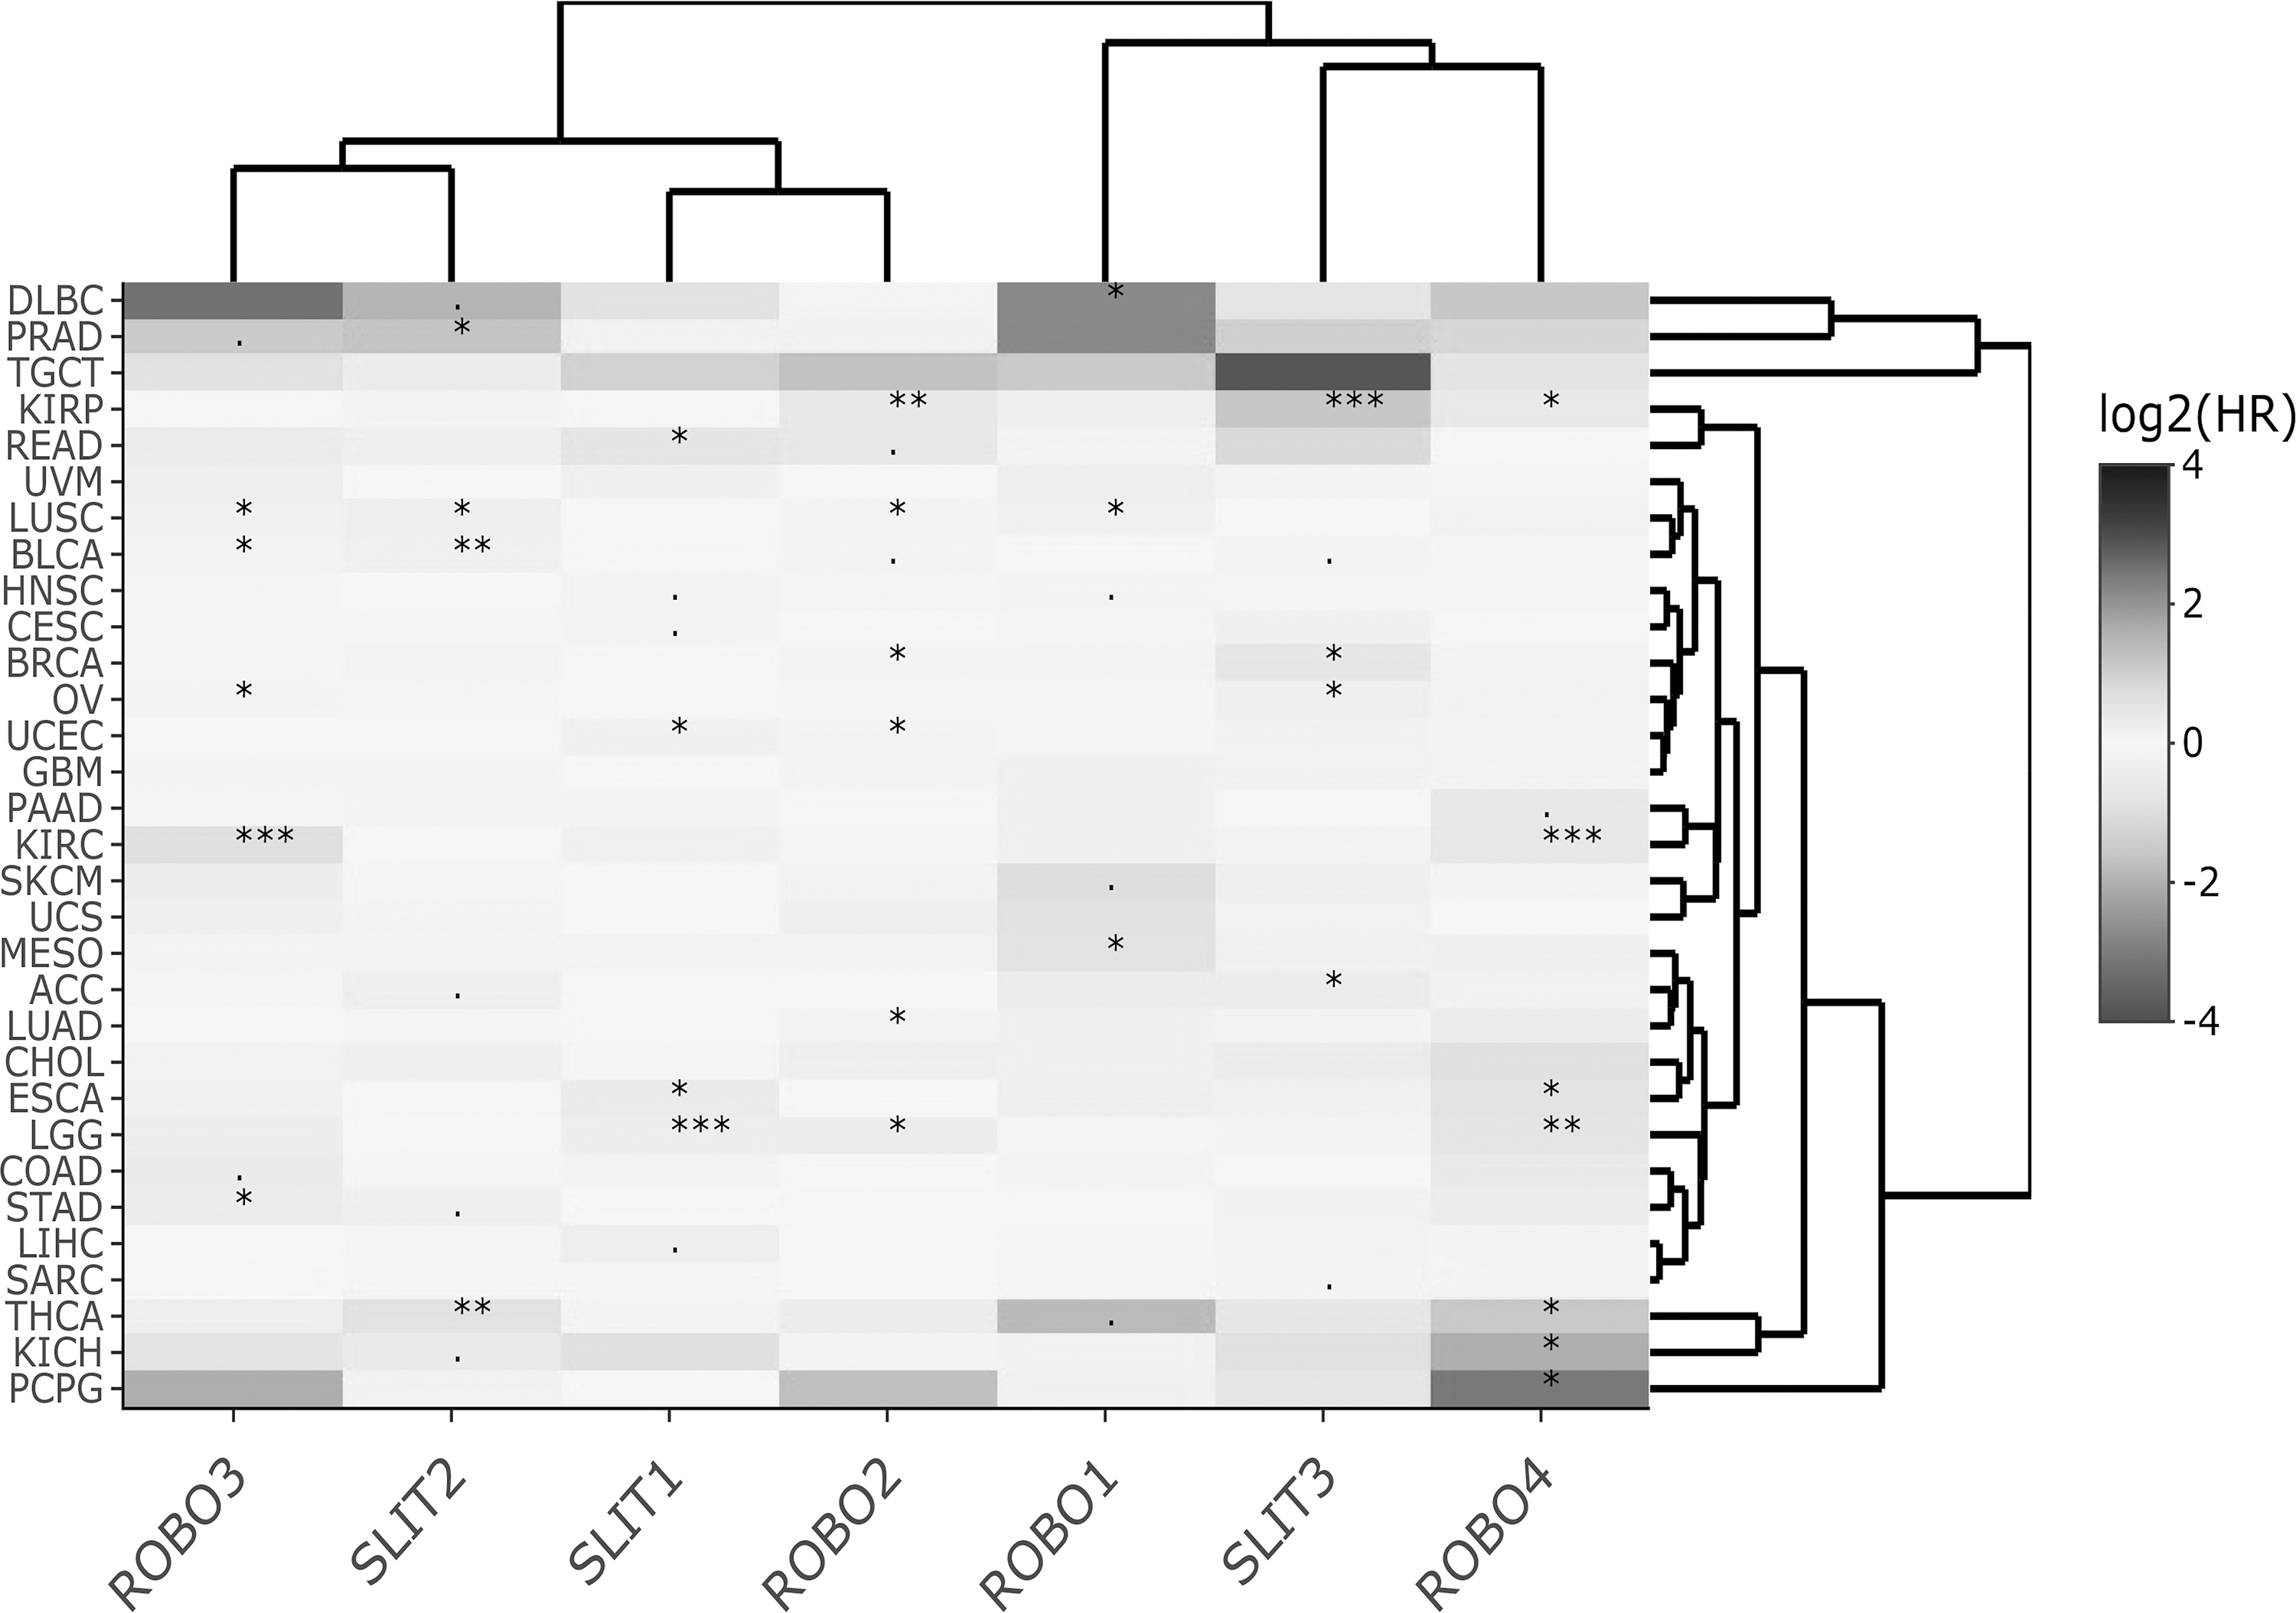
Heat map of Slit-Robo DSS log2HR values across TCGA datasets for multivariable Cox regression. Significant HR associations are indicated with *** for p < 0.001, ** for p < 0.01, * for p < 0.05, and + for p < 0.1. DSS, disease-specific survival.
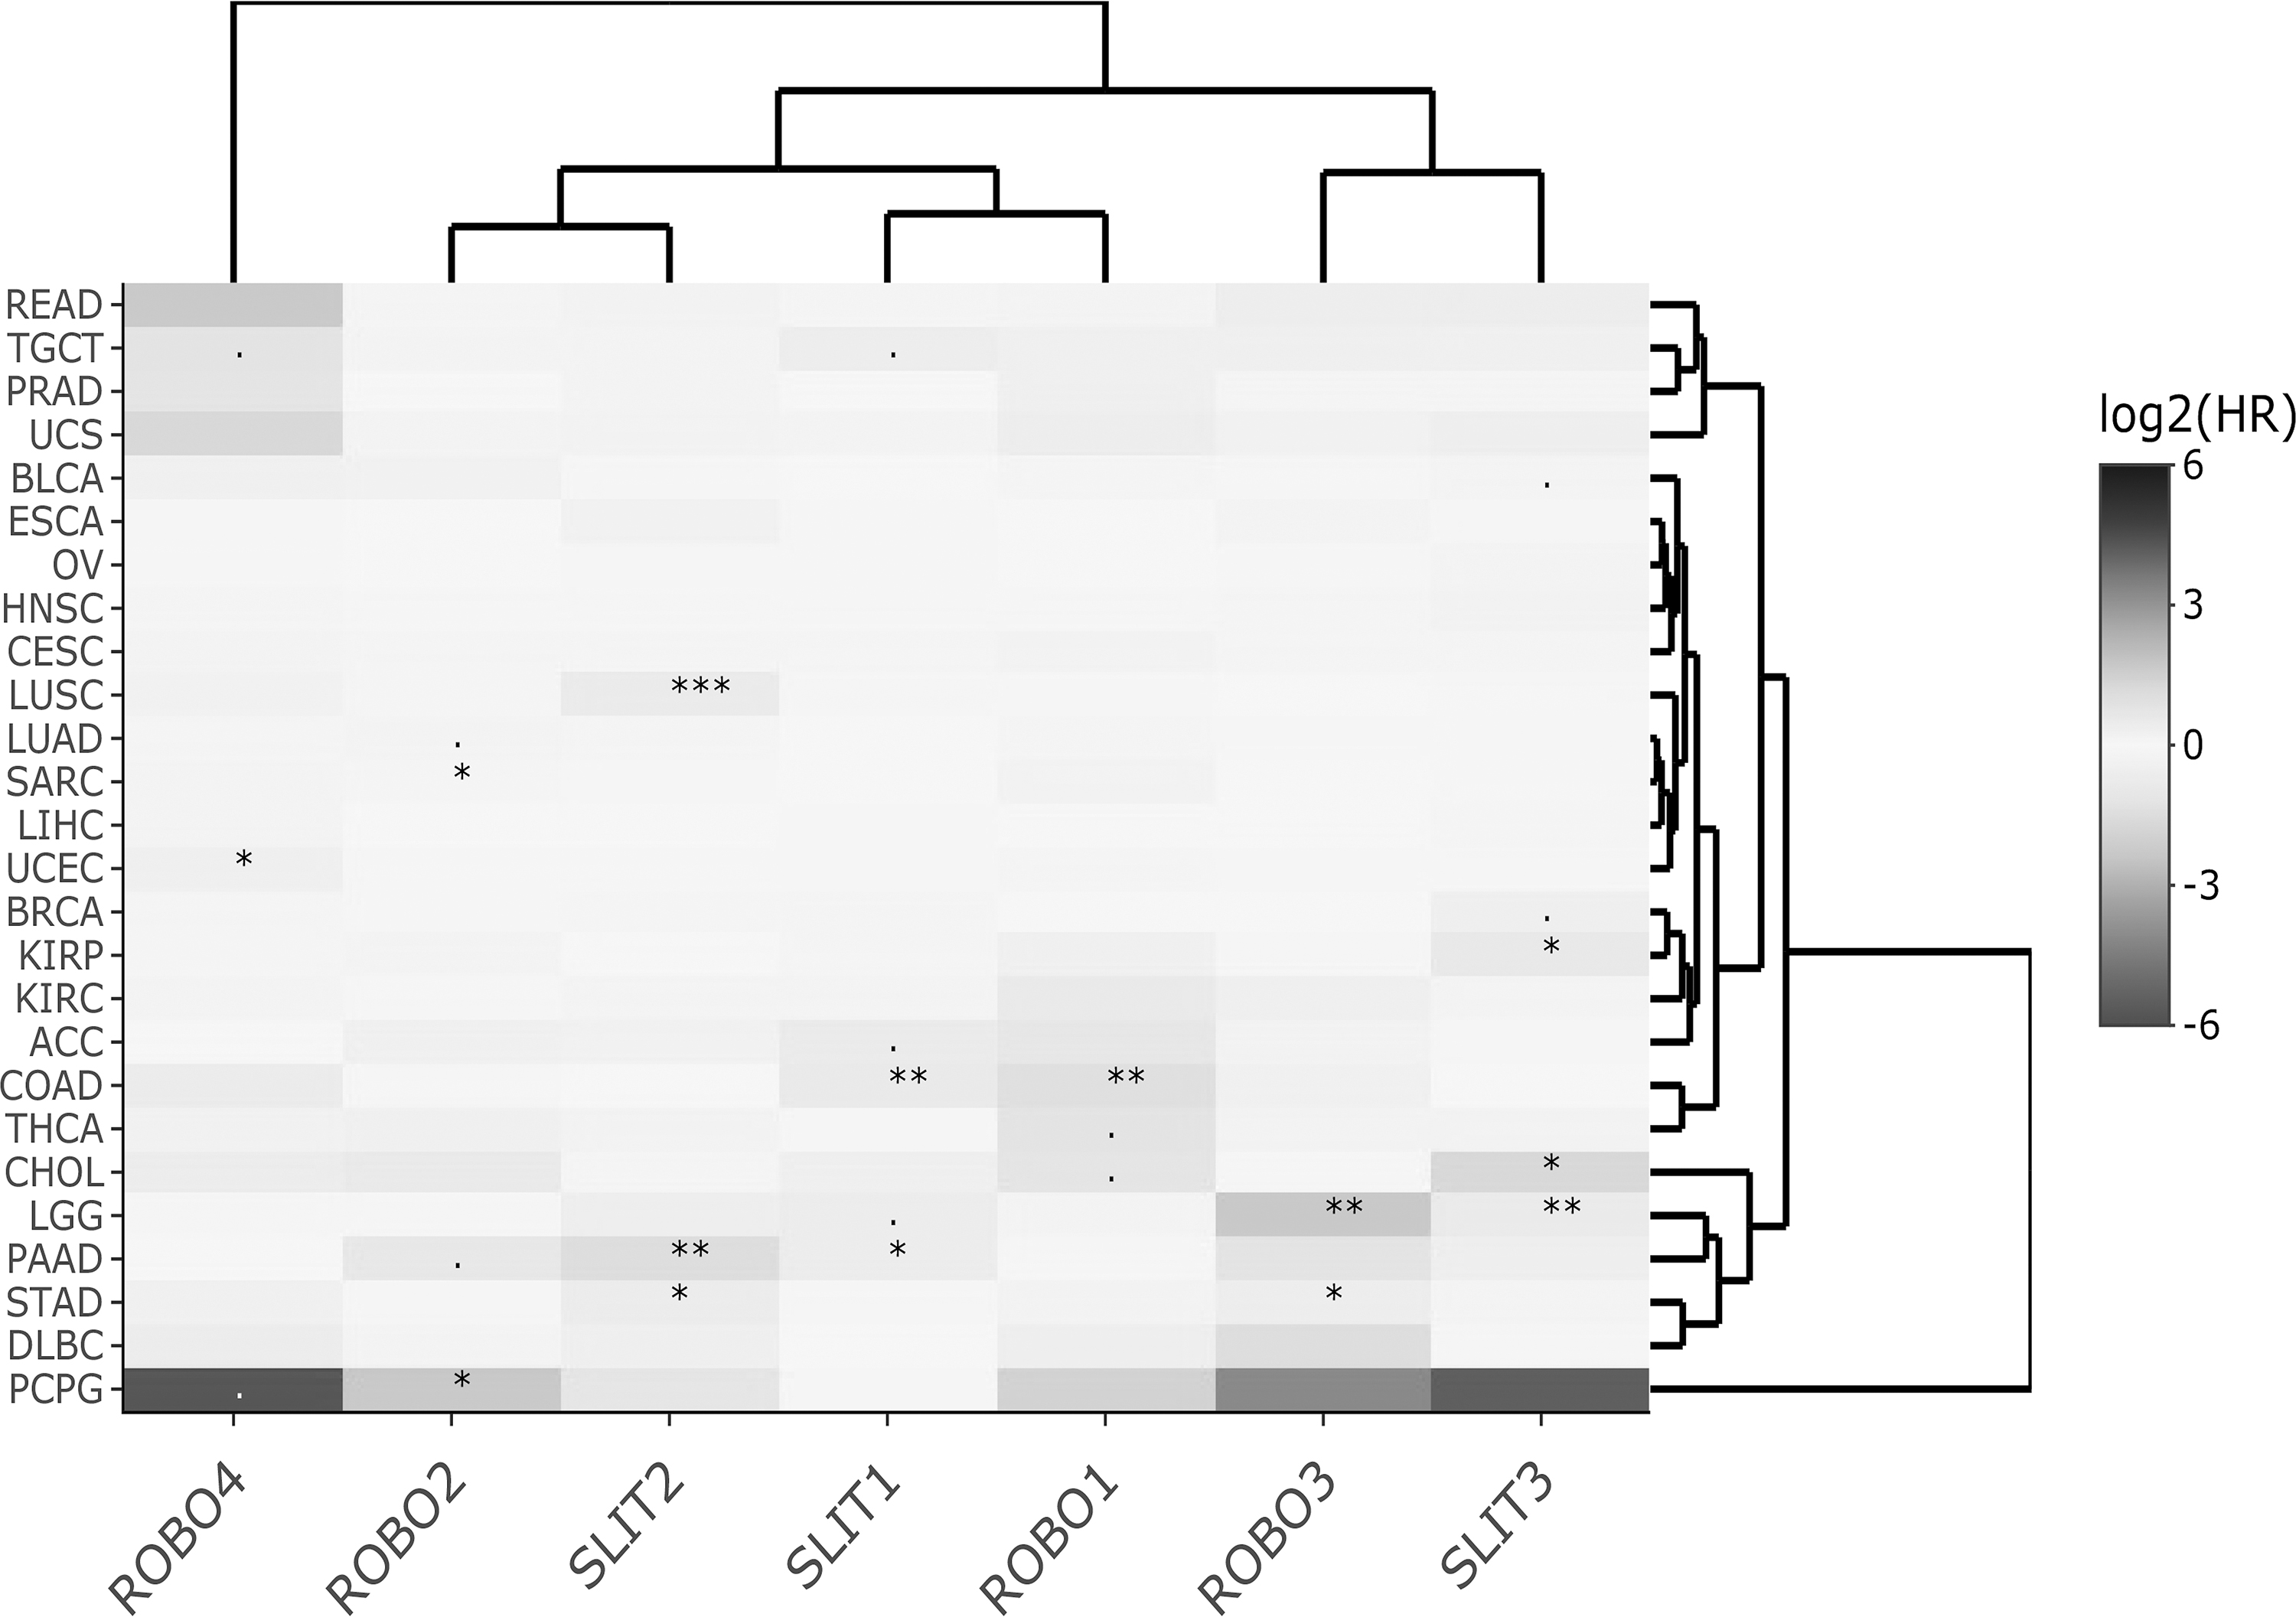
Heat map of Slit-Robo DFS log2HR values across TCGA datasets for multivariable Cox regression. Significant HR associations are indicated with *** for p < 0.001, ** for p < 0.01, * for p < 0.05, and + for p < 0.1. DFS, disease-free survival.
HRmulti estimates visualized by heat maps helped summarize the prognostic gene clusters with independent effects for each of the four survival types. Interestingly, the heat map of HRmulti estimates consisted of more pairs/modules with members from both Slit and Robo (Figs. 1–4) when compared with the HRuni heat maps (Supplementary Figs. S3 and S4). Moreover, the Slit-Robo pairs in opposing HR directions (>1 and <1 or <1 and >1) were observed more often than Slit-Slit or Robo-Robo pairs in either direction (χ2 ≅ 5.49, p < 0.05; Supplementary Table S2).
Discovery of independent Slit-Robo pairs across groups of TCGA cancers
Significant HRmulti results showed that several cancers had two or more Slit-Robo members simultaneously and independently implicated in prognosis (Tables 2 and 3). We highlighted below many of those recurrent Slit-Robo pairs/modules that were found to be significantly associated with prognosis of individual and/or groups of cancers in our multivariable analyses of TCGA datasets (Blum et al., 2018).
Slit-Robo HR Values Resulting from Multivariable Cox Regression Are Given for Those HRs with p < 0.05, for Survival Types DFS and PFS in the Investigated TCGA Datasets
Refer to Supplementary Table S1 for cancer dataset abbreviations.
Slit-Robo HR Values Resulting from Multivariable Cox Regression Are Given for Those HRs with p < 0.05, for Survival Types OS and DSS in the Investigated TCGA Datasets
Refer to Supplementary Table S1 for cancer dataset abbreviations.
ROBO3, ROBO4
Multivariable Cox regression analysis of the kidney clear cell carcinoma (KIRC) exhibited one of the most significant prognostic pairs with respect to Slit-Robo signaling, such that a higher expression of ROBO3, and independently lower expression of ROBO4, indicated worse prognosis in KIRC patients for OS, DSS, and PFS, but not DFS, while the effects of remaining Slit-Robo members were insignificant (Supplementary Fig. S5). Similarly, the HRmulti profile indicating a hazardous expression of ROBO3 and a protective one for ROBO4 was observed for OS (but not in the other survival types) in chromophobe renal cell (KICH) carcinoma (Supplementary Fig. S6).
SLIT3, ROBO2/ROBO4
Unlike KIRC and KICH, the papillary cell renal carcinoma KIRP exhibited a relatively different pattern. In addition to the lower expression of ROBO4 and that of ROBO2, a simultaneously higher expression of SLIT3 was significantly associated with poor prognosis in DSS and PFS, but partly in OS and DFS (Supplementary Fig. S7). SLIT3's higher expression accompanied by the decrease in ROBO2 expression was a biomarker of poor prognosis also in the breast invasive carcinoma (TCGA-BRCA) dataset for DSS (but not for DFS or PFS; Supplementary Fig. S8).
SLIT2, ROBO4/ROBO3/SLIT3
In this study, HRmulti values of the stomach adenocarcinoma dataset (TCGA-STAD) indicated that the SLIT2 and ROBO4 pair could be significant in prognosis and behaved independently, yet in the same direction (i.e., increased) for OS, whereas SLIT2 paired with ROBO3 instead in DFS (Supplementary Fig. S9). Higher levels of SLIT2 amidst lower levels of ROBO3 were significantly associated with worse prognosis also in TCGA-BLCA, the bladder carcinoma for OS and DSS; although for PFS, high SLIT2 levels were paired with low SLIT3 (Supplementary Fig. S10). Similarly, a higher expression of SLIT2, instead of SLIT3, and lower expression of ROBO3, and ROBO1 and ROBO2, were associated with worse prognosis for DSS in TCGA-LUSC, the lung squamous cell carcinoma dataset (Supplementary Fig. S11).
SLIT2, SLIT1, ROBO1/ROBO4
Increased expression of SLIT2 also indicated poor prognosis for PFS in TCGA-ACC, the adrenocortical cancer dataset, when together with that of ROBO1 (Supplementary Fig. S12). However, increased SLIT2 expression paired not with a Robo, but with decreased SLIT1 expression in TCGA-PAAD, the pancreatic adenocarcinoma dataset, resulted in worse prognosis for DFS (Supplementary Fig. S13).
On the other hand, the decreased expression of SLIT1 when combined with low ROBO4 levels indicated a worse prognosis in TCGA-PAAD (Supplementary Fig. S13; for OS). The same could be concluded for decreased SLIT2 with low ROBO4 in TCGA-THCA, the thyroid carcinoma dataset (Supplementary Fig. S14; for DSS and PFS). Nevertheless, a high level of SLIT1 was associated with worse prognosis in the esophageal cancer dataset TCGA-ESCA (Supplementary Fig. S15), as well as TCGA-COAD, the colorectal adenocarcinoma dataset (Supplementary Fig. S16). This hazardous effect of SLIT1 expression was in combination with increased expression of ROBO4 for DSS and that of ROBO1 for DFS, in ESCA (Supplementary Fig. S15) and COAD (Supplementary Fig. S16), respectively.
SLIT1, ROBO2/ROBO3/ROBO4
As demonstrated in the cases above, our results showed that a Slit could pair simultaneously with one or more Robo genes and yet the same pair could exhibit opposite expression patterns in different cancers. For example, increased SLIT1, but decreased ROBO2 indicated worse prognosis for DSS in TCGA-UCEC, the uterine corpus endometrial carcinoma, while the same was true for increased SLIT1, but decreased ROBO3 for PFS in TCGA-UVM, the uveal melanoma dataset (Supplementary Figs. S17 and S18). On the contrary, decreased SLIT1 along with increased ROBO2 and ROBO4 (instead of ROBO3) signified poor prognosis for TCGA-LGG, the low-grade glioma dataset (Supplementary Fig. S19; for OS and DSS).
SLIT3, ROBO3
Similarly, the same pair could be associated with different survival types in different cancers, yet in opposite manners as in the SLIT3-ROBO3 pair for DFS in TCGA-LGG (Supplementary Fig. S19) and for DSS in TCGA-OV, the ovarian carcinoma dataset (Supplementary Fig. S20). Low ROBO3 and high SLIT3 levels were associated with DFS in TCGA-LGG (Supplementary Fig. S19), while the opposite was true for OS and DSS in TCGA-OV (Supplementary Fig. S20).
Others
Several cancers had a single Slit or Robo gene significantly associated with one or more survival types. For instance, the HRmulti profile of the Slit-Robo pathway in the lung adenocarcinoma dataset TCGA-LUAD showed that higher ROBO2 expression was a significantly better predictor for OS, DSS, and PFS among lung adenoma patients, while other genes did not stand out as significant in any of the survival types (Supplementary Fig. S21).
Several other cancers, including TCGA-CHOL, the cholangioma dataset, exhibited significance for single genes rather than pairs (Supplementary Fig. S22). ROBO4 expression was protective in the pheochromocytoma and paraganglioma dataset TCGA-PCPG (for OS, DSS, and PFS; Supplementary Fig. S23), and in the liver hepatocellular carcinoma dataset, TCGA-LIHC, verging on significance (PFS; p < 0.1; Supplementary Fig. S24). Nevertheless, none of the Slit-Robo pathway members was significantly implicated with prognosis in the GBM, TGCT, and THYM datasets (Tables 2 and 3).
Discovery of the best Slit-Robo subsets for prognostication
We adopted the best subset selection method using lasso regression, as implemented in the SmulTCan app (Ozhan et al., 2021). PI values revealed (through K-M analyses) the effective discriminators of prognostic outcomes (Table 4 for OS and DSS; Table 5 for DFS and PFS) for several of the 15 TCGA datasets for which a best subset could be found. We emphasized below only those having highly significant K-M values.
Slit-Robo Best Subset Members and Corresponding Coefficients Obtained with Lasso Analysis of Each Dataset for OS and DSS Are Listed
Low:high risk HRs and their corresponding p-values, as well as the p-value of the K-M analysis results based on the PI calculated from the coefficients of each dataset are also given. Refer to Supplementary Table S1 for cancer dataset abbreviations.
AUC, area under the receiver operating characteristic (ROC) curve; K-M, Kaplan–Meier; PI, prognostic index; SE%, standard error %.
Slit-Robo Best Subset Members and Corresponding Coefficients Obtained with Lasso Analysis of Each Dataset for DFS and PFS Are Listed
Low:high risk HRs and their corresponding p-values, as well as the p-value of the K-M analysis results based on the PI calculated from the coefficients of each dataset are also given. Refer to Supplementary Table S1 for cancer dataset abbreviations.
The SLIT3-ROBO2 pair appeared in the K-M analysis of KIRP, acting opposingly, whereby SLIT3 contributed to higher risk and ROBO2 contributed to lower risk for OS, DSS, and PFS. K-M plots of KIRP in Figure 5 indicated significant differentiation between prognostic outcomes for three of four survival types. K-M analyses also produced one of the best outcomes for the KIRC dataset (Fig. 6) with the strong separation of low- and high-risk outcomes and minimal overlap of their confidence intervals particularly for PFS (Fig. 6c).

K-M plots of KIRP for
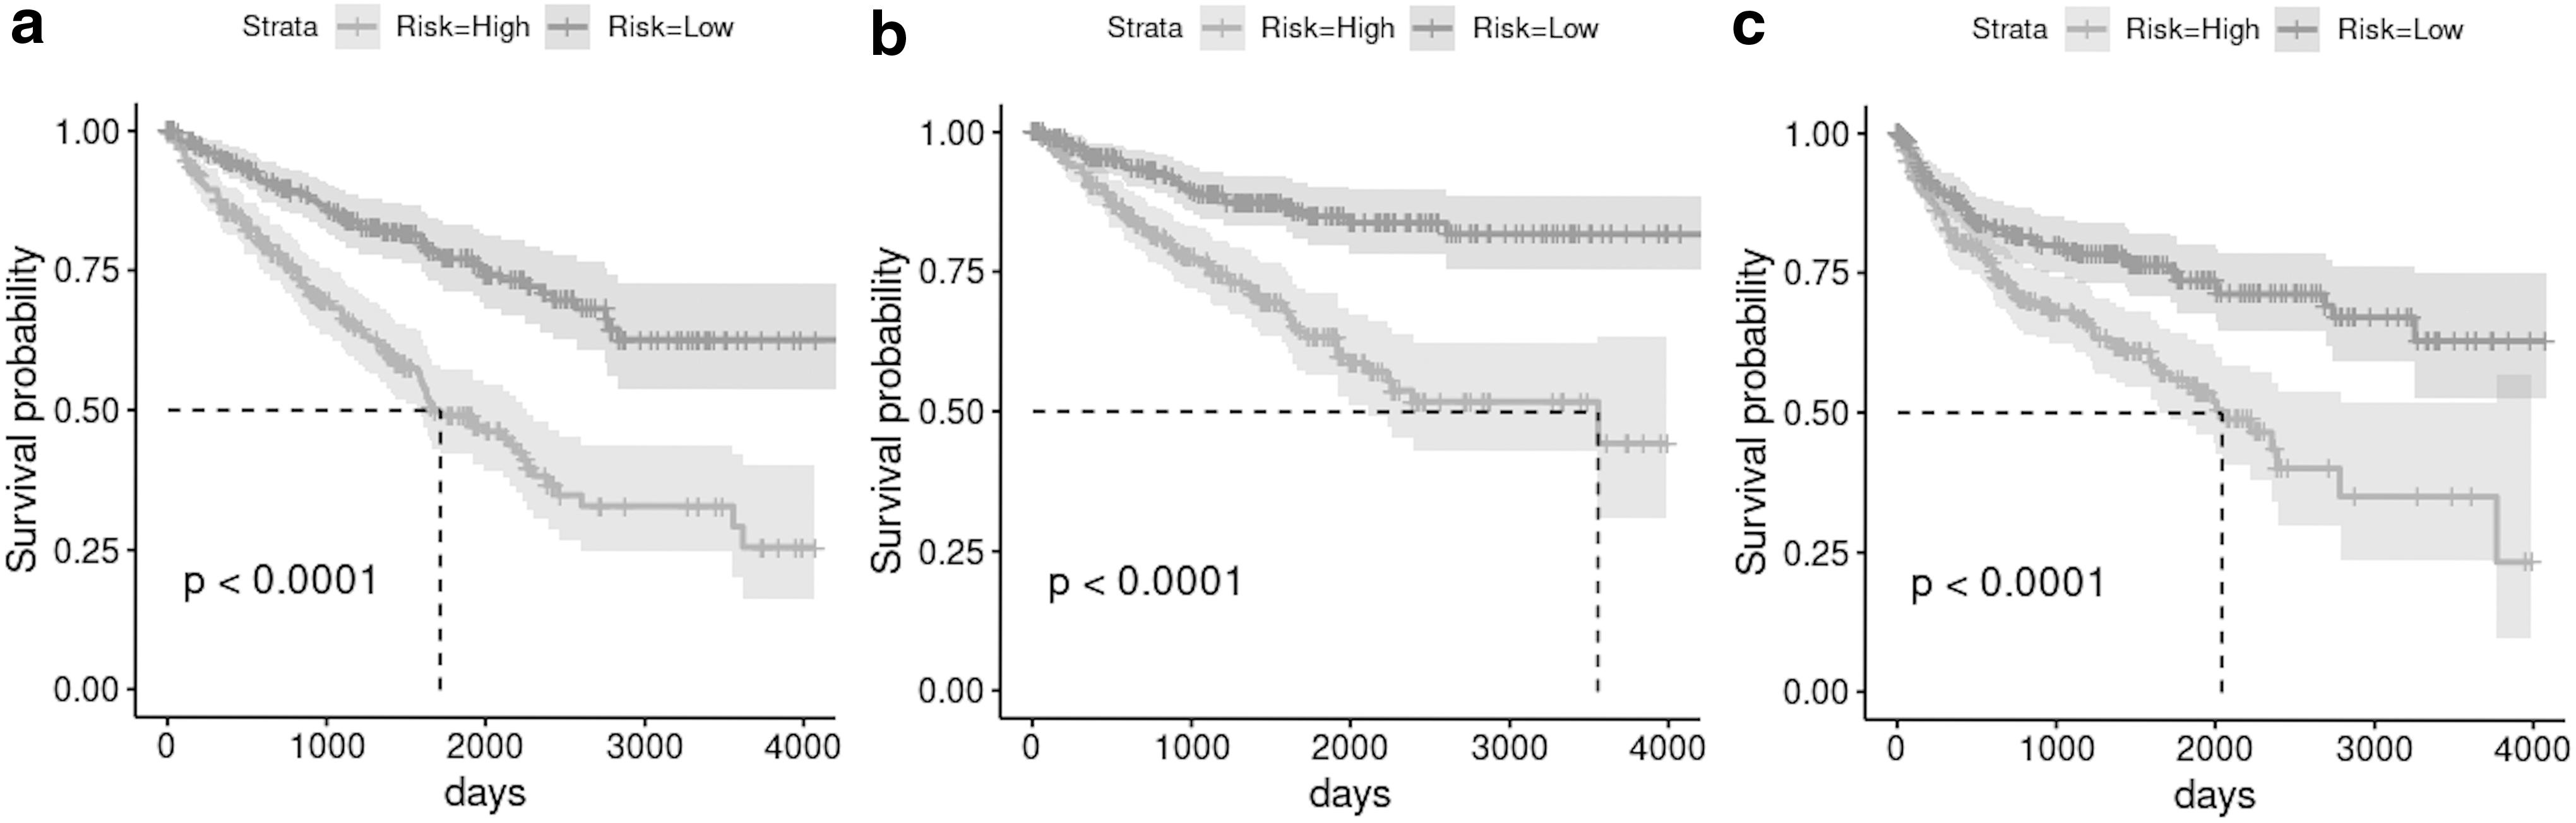
K-M plots of KIRC for
Low-to-high risk ratios of KIRC for the antagonistic Slit-Robo pair were in the range of 0.34–0.51 with AUC% ± SE% scores of PIs = 67.69 ± 2.96, 70.71 ± 3.25, and 63.56 ± 3.06 for OS, DSS, and PFS, respectively. High ROBO4 expression's protective effect was once again revealed in the K-M analyses, where the gene contributed to lower risk prognosis in KIRC for OS, DSS, and PFS acting opposingly to ROBO3 (Tables 4 and 5).
SLIT1 was the only contributing gene to the PIs calculated for LGG and UCEC, but indicated a lower risk in LGG and a higher one in UCEC. K-M plots of LGG for the four survival types indicated a significantly large AUC with SLIT1, also exhibiting one of the highest significances (p < 0.001 for Fig. 7a–d; Tables 4 and 5). While SLIT3 contributed to lower risk in TCHA-CHOL, ROBO1 and SLIT1 led to a higher risk in COAD (AUC% ± SE% values of the PIs were 76.90 ± 11.70 and 71.85 ± 6.05 for CHOL and COAD, respectively). Other K-M plots for significant differentiation between risk groups were for OS in MESO (see also Supplementary Fig. S25 for the forest plot), for DFS in PAAD, for OS, DSS, and PFS in ACC and UVM, and for DFS in KICH (Tables 4 and 5).

K-M plots of LGG for
Discussion
A prognostic HR GS refers to the expression pattern of a group of genes associated with the tumor prognosis and presents great potential for improving the prediction of survival rates (Wang et al., 2017). The role of axon guidance cues of the nervous system on cancer progression and prognosis has previously been emphasized (Hao et al., 2020; Ozhan et al., 2021). In this study we discovered independent HR GSs as pairs/modules of the Slit-Robo axon guidance gene family that can predict survival significantly across TCGA-PANCAN datasets. Moreover, we have demonstrated that the multivariable Cox survival analysis more frequently resulted in the independent pairing between Slits and Robo rather than only Robo-Robo or only Slit-Slit pairing.
We also were able to identify several recurrent signatures within different cancers; hence, these novel cancer-specific yet independent Slit-Robo pairs and/or modules we identified could provide promising leads for further tests. Consequently, we propose that such co-dependent ligand/receptor interactions, as in the case of Slit-Robo molecules, should be investigated with multivariable regression, applied to the whole family, without first filtering with univariable regression.
Our results further corroborated the importance of Slit-Robo in kidney cancers such that ROBO3, ROBO4, and/or SLIT3 were strongly associated with all three of kidney cancers. KIRC and KIHC were more similar to each other than they were to KIRP, which shared prognostic similarities with BRCA. The observed compartmentalization of Slit-Robo members in kidney cancers other than ROBO4 might indicate the different histological characteristics of clear, papillary, and chromophobe renal cell carcinomas and the differential level of expression of Slit-Robo members across their respective tissues.
The protective profile of ROBO4 by itself across many of the investigated TCGA cancer datasets, including the pheochromocytoma and paraganglioma dataset, TCGA-PCPG of neuronal origin, could also be attributed to ROBO4's angiogenesis-inhibiting properties, demonstrated in wound healing experiments (Zhang et al., 2016). A previous independent study has also indicated a lower ROBO4 in liver tumors (Avci et al., 2008), which our multivariable Cox regression analysis supported this with approaching significance in TCGA-LIHC.
Our results show that Slit-Robo pathway expression, when analyzed with multivariable Cox regression, has revealed other novel prognostic members of the pathway. One such example is the lung adenocarcinoma (LUAD) in which previous studies implicated SLIT2 expression (Rezniczek et al., 2019) that was shown to inhibit migration (Kong et al., 2015) and considered a tumor suppressor (Zhang et al., 2015). However, our analysis with LUAD, based on the whole Slit-Robo gene family, did not implicate SLIT2 as prognostic, but instead revealed ROBO2’s higher expression as a marker for poor prognosis, for three different survival types, that is, OS, DSS, and PFS.
ROBO2 has been previously shown to be decreased in prostate cancer as well, but was found to be upregulated in inflammatory breast cancer (Bieche et al., 2004; Dickinson et al., 2004); and our study is the first implicating increased ROBO2 expression, independent of its relationship to the other Slit-Robo members, in the prognosis of LUAD patients.
In our analysis, SLIT3 was the most significantly associated with poorer prognosis in BRCA, while independently, higher levels of ROBO2 were significantly better prognostically, supporting previous findings (Yuasa-Kawada et al., 2009). Previously, SLIT3 has been found to be a tumor suppressor in lung cancer cells whose silencing increases metalloproteinase activity (Zhang et al., 2015); however, in connection with reduced levels of ROBO2, SLIT3 could be an oncogene in BRCA.
Previous studies have also shown that specific Slit-Robo members acting in pairs are involved in various cellular functions and disorders other than cancer as previously introduced. Our HRmulti analysis demonstrated the presence of known Slit-Robo pairs also with impacts on cancer survival, not possible to extract otherwise, that is, using univariable Cox regression alone. For instance, our study showed that several well-known pairs from literature were associated with cancers, that is, the SLIT3-ROBO4 pair (Paul et al., 2013), with KIRP; the SLIT2-ROBO3 pair (Cariboni et al., 2012), with BLCA; the SLIT2-ROBO4 pair (Jones et al., 2009), with KICH; and the SLIT2-ROBO1 pair (Qin et al., 2015), with ACC.
Furthermore, in our analysis, many Slit-Robo pairs acted antagonistically. For instance, high expression of SLIT2 and lower expression of ROBO1 were hazardous for DSS in LUSC, DLBC, and THCA datasets. Other antagonistic pairs included the SLIT3-ROBO2 pair in KIRP for OS, DSS, and PFS; the SLIT3-ROBO3 pair in OV for DSS; and the SLIT1-ROBO2 pair in UCEC for DSS. In all of these, Slits had higher expression, while Robos had lower expression, and together they were associated with poor prognosis. It is tempting to speculate that these antagonistic pairs are likely to work together, while their individual expressions balance one another. Accordingly, the emerging role of antagonistic Slit-Robo pairs in cancer prognosis can be investigated further experimentally due to their novelty.
Conclusion
Univariable analyses helped compare the impacts of Slit-Robo members on each dataset across TCGA-PANCAN and identify which cancer types were more significantly affected by Slit-Robo alterations. However, the multivariable Cox regression was required to identify the independent Slit-Robo pairs and/or modules with significant HR signatures in cancer- as well as survival-specific manners.
Our study provided AUC% calculations of all the multivariable Slit-Robo models in the study for all four survival types (Supplementary Table S3), which could serve as a reference in future studies. Our results suggested higher expressions of SLIT1, SLIT2, and SLIT3 could be associated with poor prognosis when coupled with lower levels of expression in one or more Robos, although the opposite patterns also were detected. Moreover, KIRP and BRCA; BLCA and LUSC; and KIRC and KICH showed similar Slit-Robo HR profiles and/or best Slit-Robo subsets.
Our findings implicate that significantly associated members of the ligand-receptor pathways, as in the case of Slit-Robo pathway, should be tested as a family to better understand if they can be used in potential therapeutic applications. Our analyses further suggest that unique Slit-Robo pairs/modules, commonly exhibiting antagonistic patterns for DSS, exist among different cancers that can be used to differentiate between prognostic outcomes, that is, low or high risk. Furthermore, our methodology can easily be applied to other ligand-receptor pathways and/or gene sets known to act in pairs or modules to reveal novel HR GSs and determine how specific subsets of each pathway's members could be used to predict prognostic outcomes.
Availability of Data
The Slit-Robo TSV file obtained from UCSC Xena is available as a Supplemental file (Supplementary Data S1). Matrices generated from the coxph() HR calculations in this article can be found in the Supplementary Tables S4–S20. Forest plots of datasets mentioned in the text, for all analyzable survival types, can be found in Supplementary Figures S5–S25.
Code Availability
Code used in this research will be made available upon request to the authors.
Footnotes

References
Supplementary Material
Please find the following supplemental material available below.
For Open Access articles published under a Creative Commons License, all supplemental material carries the same license as the article it is associated with.
For non-Open Access articles published, all supplemental material carries a non-exclusive license, and permission requests for re-use of supplemental material or any part of supplemental material shall be sent directly to the copyright owner as specified in the copyright notice associated with the article.
