




Abstract
Markov models have frequently been used in genetic sequence analysis. The number of parameters of a Markov model increases exponentially with model order, so it is often recommended that the order be chosen based on the size of data being modeled, lower orders for small and higher orders for large dataset sizes. Approaches based on model selection criterion have also been proposed. An important problem in microbiology and evolutionary biology is to decipher chimeric genomes of microbes, particularly, identify segments of distinct ancestries in genomes and reconstruct the plausible evolutionary scenarios that might have shaped the chimeric genomes in the microbial world. In this study, we assessed a Markov model-based segmentation method for its ability to detect compositionally disparate segments in chimeric sequence constructs as a function of model order, sequence length, and phylogenetic divergence. Our results show that the choice of Markov model order depends on both sequence size and composition. Higher order Markov models were found to be more effective in delineating sequence segments arising from closely related organisms in longer constructs; on the other hand, lower order Markov models were found to be more appropriate in delineating sequence segments arising from distantly related organisms in shorter constructs. These findings are important and timely, with broad implications in fields such as epidemiology that has to deal with the emergence of novel pathogenic chimeras that arise by foreign DNA acquisition, and ecology where chimeric structures may arise in various ecosystems, necessitating more robust approaches for their deconstruction and interpretation.
Introduction
Probabilistic models, such as markov chain model, have been frequently used in biological sequence analysis (Azad and Borodovsky, 2004; Burks and Azad, 2020; Coggill et al., 2008; Durbin et al., 1998; Nicolas et al., 2002; Re and Azad, 2014; Thakur et al., 2007). An important problem in genome sequence analysis is deciphering genome chimerism, that is, identifying disparate segments representing different evolutionary histories within a genome. Segmentation methods based on Markov model have been shown to be effective in deconstructing prokaryotic genomes that have a significant fraction acquired from different sources through the evolutionary process of horizontal gene transfer (Azad and Li, 2013; Thakur et al., 2007).
These methods often use a fixed-order Markov model regardless of size of the genome or its parts being probed. In this study, we performed some “proof-of-concept” experiments to show that the segmentation algorithm could be augmented before its further applications in genome or metagenome analysis.
Among the model parameters, model order has a strong influence on the accuracy as observed in this study and also reported in earlier studies (Re and Azad, 2014). Finding an appropriate Markov model order for a given biological sequence is a nontrivial task. Questions such as should model order be determined based on sequence size and/or based on the complexity of genomic sequences are still open, despite significant advances in this field. Complexity of genomic sequence could be a function of many different factors, including evolutionary changes imparted by mutations, rearrangements, insertions, deletions, and acquisitions of foreign DNAs. It is also expected that DNAs from phylogenetically proximal organisms could be difficult to differentiate, while DNAs from phylogenetically distant species could be easier to differentiate even by utilizing lower order models.
To this end, we evaluated different techniques and examined the effect of different order models on deciphering artificially constructed chimeric genome sequences with DNAs from phylogenetically proximal or distant donors, and of various lengths.
Materials and Methods
Chimeric constructs
Chimeric sequences were generated by concatenating two sequences of equal or different lengths taken from two different species. The three phyla and corresponding species chosen for this study are as follows:
Proteobacteria: chimeric sequences were constructed by concatenating randomly sampled DNA sequence from Escherichia coli str. K-12 substr. MG1655 and sequence from a different proteobacterial species. These selected species were Salmonella enterica subsp. enterica serovar Typhi str. CT18, Erwinia amylovora ATCC 49946, Yersinia pestis A1122, Vibrio cholerae M66-2 chromosome I, Haemophilus influenzae 10810, and Rickettsia typhi str. B9991CWPP. Cyanobacteria: chimeric sequences were constructed by concatenating randomly sampled DNA sequence from Synechocystis sp. PCC 6803 and sequence from a different cyanobacterial species. These selected species were Leptolyngbya sp. PCC 7376 chromosome, Synechococcus elongatus PCC 6301, Prochlorococcus marinus str. MIT 9211, Microcystis aeruginosa NIES-843, Pleurocapsa sp. PCC 7327, and Gloeobacter violaceus PCC 7421. Actinobacteria: chimeric sequences were constructed by concatenating randomly sampled DNA sequence from Bifidobacterium longum subsp. longum BBMN68 and sequence from a different actinobacterial species. These selected species were Bifidobacterium adolescentis ATCC 15703 DNA, Gardnerella vaginalis 409-05, Mycobacterium abscessus subsp. bolletii 50594, and Conexibacter woesei DSM 14684.
All genomic sequences were downloaded from NCBI ftp server: ftp://ftp.ncbi.nih.gov/genomes/refseq/
For each phylum, one species was selected as a reference species: E. coli str. K-12 for Proteobacteria, Synechocystis sp. for Cyanobacteria, and B. longum for Actinobacteria, to make chimeric constructs by concatenating sequence from the reference with the sequence from other selected species within the same phylum. For each phylum, species were listed above in the order of their phylogenetic distance from the reference species. This was determined based on the taxonomy trees obtained from NCBI Common Tree (https://www.ncbi.nlm.nih.gov/Taxonomy/CommonTree/wwwcmt.cgi; see Fig. 1 for Proteobacteria, and Supplementary Figs. S1 and S2 for Cyanobacteria and Actinobacteria, respectively). Chimeric sequences of sizes 6, 12, 24, 36, 48, and 96 Kb were constructed in five different ways:
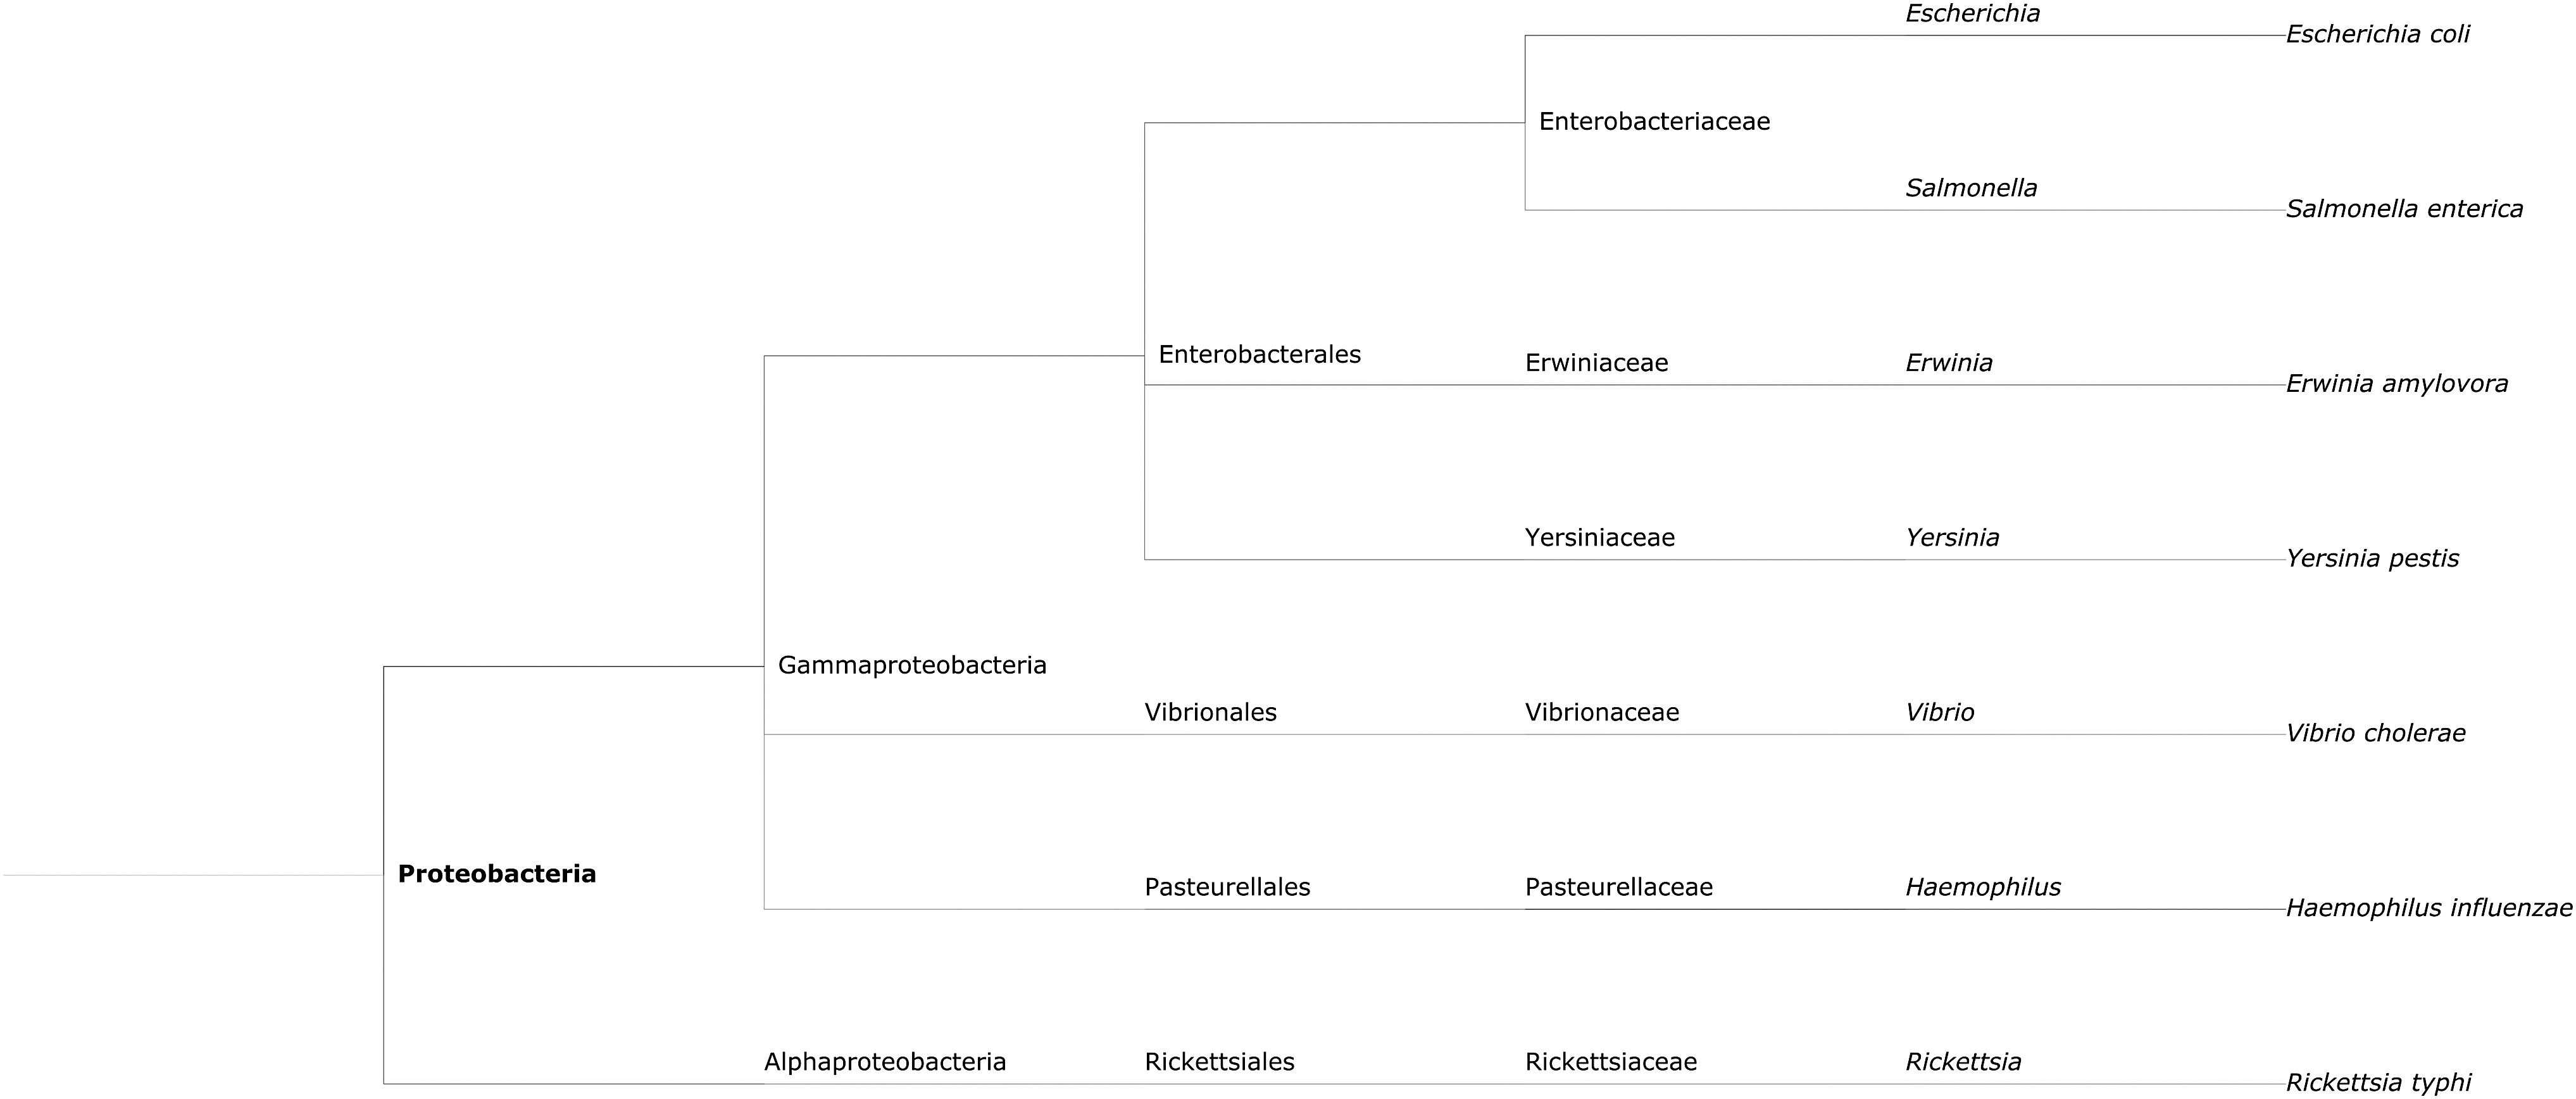
Taxonomy tree of representative species belonging to Proteobacteria obtained from NCBI Common Tree. The taxa are shown from species (tips of the tree) to phylum level (root), with genus, family, order, and class in between also indicated in the figure. The genome sequences from these representative species were used for construction of chimeric constructs, as described in the Materials and Methods section.
One-fourth reference sequence and three-fourth other species sequence from within the phylum.
One-third reference sequence and two-third other species sequence from within the phylum.
Half reference sequence and half other species sequence from within the phylum.
Two-third reference sequence and one-third other species sequence from within the phylum.
Three-fourth reference sequence and one-fourth other species sequence from within the phylum.
Segmentation method
Segmentation of a given DNA sequence involves partitioning it into two subsequences that are maximally distinct from one another based on a chosen statistical criterion. This entails recursive application to resulting subsequences until a halting criterion is met (Bernaola-Galvan et al., 1996; Li, 2001). A commonly used segmentation strategy maximizes an entropic divergence measure, namely, the Jensen-Shannon (JS) divergence, to construct this partition (Grosse et al., 2002). The segmentation algorithm computes JS divergence at each position in a given DNA sequence and then segments it into two at the position of where the JS divergence is maximum (Azad and Li, 2013; Bernaola-Galvan et al., 1996; Grosse et al., 2002).
` The JS divergence between two subsequences S1 and S2 of length l1 and l2, generated by partitioning at a position in sequence S of length L = l1 + l2, is obtained as
where H(.) is the Shannon entropy,
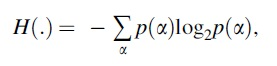
p(α) denotes the probability of nucleotide α, estimated as  , where N denotes count (Grosse et al., 2002).
The above measure of divergence is derived on the assumption of the independence of each nucleotide occurrence in S, which signifies the zeroth order Markov model. This can be generalized to higher order Markov models to account for short-range correlations within nucleotide ordering patterns.
Thakur et al. (2007) and Arvey et al. (2009) leveraged the power of Markov model in measuring the compositional heterogeneity, replacing nucleotide distribution with higher order oligonucleotide distribution in the JS divergence formulation (Arvey et al., 2009; Thakur et al., 2007). The generalized JS divergence to account for short-range correlations in the nucleotide ordering was obtained within the framework of Markov chain model of order m, defined for divergence between two subsequences S1 and S2 of length l1 and l2, generated by partitioning at a position in sequence S as
Here, Hm () denotes the conditional entropy function, defined as

where w denotes oligonucleotide of length m preceding the nucleotide b and p(w) is the probability of oligonucleotide w, defined as
and p(b|w) is the probability of nucleotide b, given the preceding oligonucleotide w, defined as
N(.) denotes the count. The standard JS divergence as given in Equation (1) is recovered for m = 0 (Arvey et al., 2009; Ludden et al., 1994; Thakur et al., 2007).
Assessment
Chimeric constructs allowed us to assess the power of the Markov model-based segmentation method in discriminating genomic sequences from different sources as a function of model order, sequence length, and phylogenetic divergence. Error was computed as the difference in the position of maximum divergence (from segmentation method) and the actual concatenation position in a chimeric construct. The mean errors were obtained as average over 1000 iterations. Note that in this study, we tested the ability of different order Markov models in identifying the join point of two disparate segments in a sequence construct, as the point of maximum JS divergence, in the first iteration of the segmentation method.
We also assessed two model selection criteria, namely, Akaike Information Criterion (AIC) and Bayesian Information Criterion (BIC) (Li, 2001; Ludden et al., 1994), in selecting the “optimal” model order. This assessment was done on the datasets of chimeric constructs. These criteria are briefly explained below.
Akaike Information Criterion: the AIC is defined as follows:
where L is the maximum likelihood and K is the number of free parameters in the model.
Bayesian Information Criterion: the BIC is defined as follows:
where N is the length of the sequence being analyzed.
BIC penalizes complex models more strongly than AIC. The smaller the BIC (or AIC), the better the model (Li, 2001). For our analysis, we measured the AIC and BIC for the two subsequence model, representing the two subsequences generated after segmentation of a sequence at the point of maximum divergence. The log likelihood for the two subsequence model for a given Markov model of order m is obtained as follows:
The number of free parameters K for two subsequence model for model order m is obtained as 2km(k − 1), k being the alphabet size [e.g., for m = 0, k is 4 for DNA sequences derived from alphabet (A,T,C,G)]. Markov model order that results in smallest BIC or AIC the maximum number of times out of 100 trials (sequence constructs) was deemed optimal in delineating the boundary of disparate segments in chimeric sequence constructs.
Results and Discussion
For the proteobacterial group, higher model orders (order 4–8, depending upon the size and composition of chimeras) yielded lower mean errors for chimeric DNA sequences assembled from phylogenetically proximal bacterial genomes (e.g., E. coli and S. enterica chimeric constructs). In contrast, usage of lower model orders (order 1–3) resulted in the lowest mean error for chimeric sequences assembled from phylogenetically distal genomes (e.g., order 1–3 for E. coli and H. influenzae chimeric constructs and order 0–3 for E. coli and R. typhi chimeric constructs) (Fig. 2; Supplementary Figs. S3–S6).

Mean error (in bases, Y-axis) by the segmentation method in identifying the join point of a DNA segment from Escherichia coli (reference genome) and the other DNA segment from one of the other proteobacterial species considered, namely, Salmonella enterica, Erwinia amylovora, Yersinia pestis, Vibrio cholerae, Haemophilus influenzae, and Rickettsia typhi, which are shown on X-axis in the order of their taxonomic proximity to E. coli. The mean error is shown as a function of both the taxonomic proximity to E. coli and the length (in kilobases) of the chimeric construct. The mean error is shown for the order of the Markov model used by the segmentation method that yields minimum value of mean error, in each instance. The “optimal” order of the model is also shown, just above the mean error point in the plot space for each instance. The overlapping mean error values for a taxon (Y-axis) are shown in an appropriate scale in an inbox in the plot space for better visualization, where needed. Each of the chimeric construct comprises its first one-fourth from E. coli and the remaining three-fourth from one of the other proteobacterial species shown on X-axis.
In some instances, model order with lowest mean error increases with chimeric construct size. For E. coli and S. enterica chimeric constructs of 1/2 E. coli and 1/2 S. enterica composition, fifth order was found optimal for sequence length 6 Kb, and eighth order for 96 Kb, while sixth and seventh for intermediate lengths (12–48 Kb). For E. coli and R. typhi chimeric constructs of 1/2 E. coli and 1/2 R. typhi composition, zeroth order was found most appropriate for length 6 Kb, second order for 12–24 Kb, and third order for 36–96 Kb (Supplementary Fig. S4).
Note, however, that in the former case (phylogenetically proximal), eighth order was found optimal for 96 Kb constructs, but in the latter (phylogenetically distant), it was only third order that yielded the lowest mean error for 96 Kb constructs. This suggests that model order cannot be chosen solely on the basis of sequence size, as has been done in previous studies (Re and Azad, 2014), but requires considering sequence composition as well.
Furthermore, the sizes of disparate components within a chimeric construct are also an important factor. In general, higher model orders performs better when both components are of similar size (Supplementary Fig. S4), while lower orders appear to be appropriate when one of the components is substantially smaller than the other (Fig. 2; Supplementary Fig. S6). This was observed specifically for sequence constructs with components from phylogenetically proximal genomes (e.g., E. coli and S. enterica). Furthermore, the error in localizing the join point decreases in general with phylogenetic divergence of the source organisms, particularly when the chimeric constructs are composed of taxonomically disparate sequences of dissimilar sizes.
Similarly, we carried out our analysis of sequence constructs obtained from species from two other phyla Cyanobacteria and Actinobacteria. We observed similar results for these phyla as well. In Cyanobacteria, for sequence constructs with sequences from the Synechocystis and Leptolyngbya, which belong to same order, but different families, model orders 3–6 yielded the lowest mean error (with a few exceptions) (Fig. 3; Supplementary Figs. S7–S10). For Synechocystis and G. violaceus constructs, where G. violaceus is now phylogenetically more distant, that is, from different orders within the same class, model orders 1–2 were found optimal (Fig. 3; Supplementary Figs. S7–S10). These results are consistent with those from other phylum studies, suggesting that the higher order Markov models are suitable for delineation of boundaries in sequence constructs with sequences from phylogenetically closer organisms, and vice versa for phylogenetically distant organisms.

Mean error (in bases, Y-axis) by the segmentation method in identifying the join point of a DNA segment from Synechocystis sp. (reference genome) and the other DNA segment from one of the other cyanobacterial species considered, namely, Leptolyngbya sp., Synechococcus elongatus, Prochlorococcus marinus, Microcystis aeruginosa, Pleurocapsa sp., and Gloeobacter violaceus, which are shown on X-axis in the order of their taxonomic proximity to Synechocystis. The mean error is shown as a function of both the taxonomic proximity to Synechocystis and the length (in kilobases) of the chimeric construct. The mean error is shown for the order of the Markov model used by the segmentation method that yields minimum value of mean error, in each instance. The “optimal” order of the model is also shown, just above the mean error point in the plot space for each instance. The overlapping mean error values for a taxon (Y-axis) are shown in an appropriate scale in an inbox in the plot space for better visualization, where needed. Each of the chimeric construct comprises its first one-fourth from Synechocystis and the remaining three-fourth from the one of the other cyanobacterial species shown on X-axis.
Unexpectedly, chimeric constructs representing Synechocystis and M. aeruginosa yielded more errors than constructs composed of genomic segments from Synechocystis and any of Leptolyngbya, P. marinus, and S. elongatus, which are all taxonomically more proximal to Synechocystis than M. aeruginosa (Fig. 4; Supplementary Figs. S7–S10). Our results thus indicate higher genomic proximity of M. aeruginosa from Synechocystis compared to that of Leptolyngbya, P. marinus, or S. elongatus from Synechocystis, contrary to taxonomic classification inferred based on select marker genes (e.g., 16 rRNA gene).

Mean error (in bases, Y-axis) by the segmentation method in identifying the join point of a DNA segment from Bifidobacterium longum (reference genome) and the other DNA segment from one of the other actinobacterial species considered, namely, Bifidobacterium adolescentis, Gardnerella vaginalis, Mycobacterium abscessus, and Conexibacter woesei, which are shown on X-axis in the order of their taxonomic proximity to B. longum. The mean error is shown as a function of both the taxonomic proximity to B. longum and the length (in kilobases) of the chimeric construct. The mean error is shown for the order of the Markov model used by the segmentation method that yields minimum value of mean error, in each instance. The “optimal” order of the model is also shown, just above the mean error point in the plot space for each instance. The overlapping mean error values for a taxon (Y-axis) are shown in an appropriate scale in an inbox in the plot space for better visualization, where needed. Each of the chimeric construct comprises its first one-fourth from B. longum and the remaining three-fourth from the one of the other actinobacterial species shown on X-axis.
In Actinobacteria, model orders between 4 and 8 yielded lowest mean error for chimeric constructs with disparate sequences from the same genus, Bifidobacterium (B. longum and B. adolescentis), while the model orders 1–4 were optimal for chimeric constructs with sequences from B. longum and C. woesei, representing different classes within the Actinobacteria phylum (Fig. 4; Supplementary Figs. S11–S14).
A notable observation was much lower error generated with constructs composed of segments from B. longum and G. vaginalis than those from B. longum and M. abscessus (Fig. 4; Supplementary Figs. S11–S14), even though G. vaginalis is taxonomically more proximal to B. longum than M. abscessus (Supplementary Fig. S2). This indicates more genomic proximity between B. longum and M. abscessus than between B. longum and G. vaginalis, contrary to taxonomic proximity inferred based on select marker genes. These findings suggest the need to revisit the taxonomic classification of certain species and reconcile the conflicts observed in their classification.
We wanted to investigate if the model order appropriate for a given chimeric DNA sequence could be determined using AIC or BIC. In most cases, we did not observe any change in model order, inferred “optimal” by AIC or BIC, as a function of phylogenetic divergence between sequences in chimeric constructs (Table 1; Supplementary Tables S1–S3). Model order varied (or not) with construct length irrespective of the composition of chimeric constructs. In Proteobacteria, for 12 Kb chimeric constructs, AIC selects model order 3 the maximum number of times for E. coli and S. enterica constructs, but model order 2 for E. coli and distantly related R. typhi constructs (Table 1). For 96 Kb constructs, AIC chooses model order 3 or 4 with no distinct pattern observed with the phylogenetic distance (Table 1).
For Each Chimeric Sequence of Size 12 or 96 Kb, Composed of a DNA Segment from Escherichia coli (One-Fourth) and a Segment from One of the Other Proteobacterial Species (Three-Fourth), Optimal Markov Model Order in Determining Join Point of These Segments Inferred Using Akaike Information Criterion or Bayesian Information Criterion Is Shown, Along with the Optimal Order Determined Empirically (“Order with Lowest Error”)

AIC, Akaike Information Criterion; BIC, Bayesian Information Criterion.
In all, but one instance, the orders inferred by AIC were different from the orders that generated lowest errors in our simulation experiments (Table 1). BIC chose model order 1 for 12 Kb, order 2 for 48 Kb (with one exception), and order 2 for 96 Kb chimeric constructs regardless of their composition (phylogenetic distance between the species contributing segments to the chimeric construct) (Table 1; Supplementary Table S1).
Furthermore, in Actinobacteria and Cyanobacteria, we observed similar pattern with both AIC and BIC. For AIC, the model order varied from 2 to 4, and for BIC from 1 to 2, for smaller to larger chimeric constructs (Supplementary Tables S2 and S3).
Notably, AIC or BIC inferences appeared to be concentrated on just one or two orders regardless of composition of chimeric constructs, for example, for 48 Kb constructs, the inferred order by AIC was almost always 3 (just one exception observed), while those by BIC was either 1 or 2 (Supplementary Tables S1–S3). AIC and BIC do indicate that higher order Markov models are better choices for longer genomic sequences, but are not able to account for variable sequence composition that has a significant impact on model order used to deconstruct the chimeric sequences, as was observed with our error analysis above. Overall, the model orders suggested by AIC or BIC do not result in lowest errors, and therefore, these criteria do not seem appropriate for chimeric genome analysis.
Our study provides insights into an important facet of Markov models that have frequently been used in biological data analysis, for example, in predicting genes in genomes (Besemer et al., 2001) or in identifying members of gene or protein families (Bateman et al., 2004). Advances in high-throughput technologies, including next-generation sequencing, have resulted in mountains of molecular data archived in different databases across the globe. Clearly, there is a need to revisit Markov models and adapt them to the current needs of modern data analysis.
Recent studies have shown the power of these models in addressing problems from emerging fields, such as metagenomics where millions of short DNA sequences (reads) representing a microbial community have to be analyzed simultaneously (Brady and Salzberg, 2009; Burks and Azad, 2020). Variants of Markov model have shown promising results in assigning metagenomic reads to their originating taxa (Burks and Azad, 2020); we expect that the study presented here will be a valuable addition to this knowledge base and will catalyze new developments in the field.
Conclusions
Our study provided insights into the model order appropriate for a given DNA sequence, and contrary to the expectation that higher orders should outperform lower orders for longer sequences, we observed that lower orders performed better in discriminating phylogenetically divergent sequence regardless of the sequence size. Together, this study suggests that the choice of Markov model order depends on both the sequence size and the composition. For longer chimeric sequences with segments arising from closely related organisms, one can safely use higher order Markov models, while for shorter chimeric sequences with segments arising from distantly related organisms, lower order Markov models could be more appropriate.
Footnotes

References
Supplementary Material
Please find the following supplemental material available below.
For Open Access articles published under a Creative Commons License, all supplemental material carries the same license as the article it is associated with.
For non-Open Access articles published, all supplemental material carries a non-exclusive license, and permission requests for re-use of supplemental material or any part of supplemental material shall be sent directly to the copyright owner as specified in the copyright notice associated with the article.
