




Abstract
Acute myeloid leukemia (AML) is a common, complex, and multifactorial malignancy of the hematopoietic system. AML diagnosis and treatment outcomes display marked heterogeneity and patient-to-patient variations. To date, AML-related biomarker discovery research has employed single omics inquiries. Multiomics analyses that reconcile and integrate the data streams from multiple levels of the cellular hierarchy, from genes to proteins to metabolites, offer much promise for innovation in AML diagnostics and therapeutics. We report, in this study, a systems medicine and multiomics approach to integrate the AML transcriptome data and reporter biomolecules at the RNA, protein, and metabolite levels using genome-scale biological networks. We utilized two independent transcriptome datasets (GSE5122, GSE8970) in the Gene Expression Omnibus database. We identified new multiomics molecular signatures of relevance to AML: miRNAs (e.g., mir-484 and miR-519d-3p), receptors (ACVR1 and PTPRG), transcription factors (PRDM14 and GATA3), and metabolites (in particular, amino acid derivatives). The differential expression profiles of all reporter biomolecules were crossvalidated in independent RNA-Seq and miRNA-Seq datasets. Notably, we found that PTPRG holds important prognostication potential as evaluated by Kaplan–Meier survival analyses. The multiomics relationships unraveled in this analysis point toward the genomic pathogenesis of AML. These multiomics molecular leads warrant further research and development as potential diagnostic and therapeutic targets.
Introduction
Acute myeloid leukemia (AML) is a hematologic malignancy of hematopoietic progenitor cells (“blasts”) (Yao et al, 2021). The prevalence of substantial heterogeneity and patient-to-patient variability in treatment outcomes, as well as a lack of comprehensive diagnostics that can foresee disease prognosis and the effects of therapy, impede rational AML treatment. AML is a heterogeneous cancer with many molecularly distinct subtypes. Most AML patients coexpress numerous mutations that evolve, making AML a dynamic disease that cannot be effectively categorized into a predefined homogeneity (Yu et al, 2020). Therefore, the current cytogenetics-based classification is limited.
Systems science-driven biomarker discovery and development for AML has been hitherto limited mostly to single omics inquiries. Analysis of the genomic and epigenomic landscape in AML led to the identification of genetic risk groups for AML, which in turn provided the release of the recommendations for risk stratification (Döhner et al, 2017). Molecular responses to therapeutics have been elucidated at the transcriptomic level, and gene expression signatures for responders and nonresponders have been identified (Raponi et al, 2008, 2007).
More recently, mathematical modeling and machine learning approaches came to the forefront to predict survival outcomes of AML patients (Hoffmann et al, 2020; Karami et al, 2021). On the other hand, multiomics techniques that reconcile and integrate data streams from different levels of the biological hierarchy, from genes to proteins to metabolites, offer promising potential for AML discoveries toward systems medicine.
We report, in this study, a systems medicine and multiomics approach to integrate the AML transcriptome data and reporter biomolecules at the RNA, protein, and metabolite levels using genome-scale biological networks. The aim of the present study was to harness the genome-scale biomolecular networks (metabolic, signaling, and transcriptional regulatory) to decipher the interconnected structure of signaling, regulatory, and metabolic processes within responder and nonresponder AML patients with long and short overall survival.
Materials and Methods
Transcriptome datasets and data preprocessing
This work does not include clinical trials. All the data is collected from GEO database.
The design of the present multiomics integrative analyses was directed at deciphering how patients display individual differences in response to treatment and progression of the disease. Datasets that are pertinent to these aims and those that include adult patient groups and at least 25 samples in each dataset were accepted as inclusion criteria.
To analyze gene expression profiles in AML, we screened datasets in Gene Expression Omnibus (GEO) (Barrett et al, 2012) and ArrayExpress (Athar et al, 2019). We used two independent transcriptome datasets from two consecutive studies, GSE5122 (Raponi et al, 2007) and GSE8970 (Raponi et al, 2008), in the GEO database.
The GSE8970 dataset contains both treatment response and overall patient survival data, whereas the GSE5122 dataset contains only treatment response data in addition to gene expression profiles. Therefore, both datasets were used in the comparative analysis of treatment response groups, that is, responders and nonresponders, to identify gene signatures associated with treatment response. On the other hand, the GSE8970 dataset was used to identify genes associated with overall survival. Considering patients with overall survival ±10% of the median of the dataset, patients were divided into two groups, that is, high survival and low survival, and analyzed comparatively.
The farnesyltransferase inhibitor, tipifarnib, was used to treat patients in both datasets. “Treatment response” was defined as patients who had an objective response (complete remission, complete remission with incomplete platelet recovery, or partial remission) or a hematologic response (decrease of >50% of leukemic blast cells in the bone marrow). “Stable disease” was defined as no hematologic response but no disease progression (Raponi et al, 2007). For the purpose of the study, patients with stable disease were considered neither responders nor nonresponders and were therefore not included in the analysis. GSE5122 comprises 58 patients, 5 of whom were removed according to our criteria for treatment response. GSE8970 consists of 34 patients, 8 of whom were removed based on their response status. After preprocessing the data in the GSE5122 and GSE8970 datasets, the male-to-female ratio was 26:27 and 18:8, respectively, and the mean age was 60 and 73, respectively.
Identification of differentially expressed genes
The differentially expressed genes (DEGs) were identified from the normalized expression values by using the Linear Models for Microarray Data (LIMMA) package (version 3.45) (Smyth, 2015) based on a preconstructed statistical analysis approach (Kori et al, 2016). Raw data in each dataset were standardized using the Robust Multi-Array Average expression measure (Bolstad et al, 2013) and Affy package (Gautier et al, 2004) as implemented in the R/Bioconductor (ver.3.6.3) (Gentleman et al, 2004).
To identify DEGs associated with treatment response, comparative analyses of treatment response groups, that is, responders and nonresponders, were performed on both datasets. Similarly, high-survival and low-survival patient groups in GSE8970 dataset were compared to identify DEGs associated with overall survival outcomes.
The Benjamini–Hochberg method was used to control the false discovery rate. Fold changes determined the down and upregulation pattern of each DEG, and at least log FC >1.5 (upregulation) or log FC < −1.5 (downregulation) and adjusted p-value <0.05 were accepted as significant. The information on gene products was obtained from GeneCards: The Human Gene Database (Safran et al, 2010).
Functional enrichment analysis
The functional annotation and enrichment analyses were performed using the ConsensusPathDB database to reveal the biological functions and processes associated with DEGs (Kamburov et al, 2011). Gene Ontology (GO) (The Gene Ontology Consortium, 2015) and the Kyoto Encyclopedia of Genes and Genomes (KEGG) (Kanehisa et al, 2014) were used as resources for molecular functions, biological processes, and pathways. p-Values were obtained through Fisher's Exact test. Benjamini–Hochberg's correction was used as the multiple testing correction technique, and enrichment results with adjusted p < 0.05 were considered statistically significant.
Identification of reporter metabolites associated with AML
The statistically significant changes in gene expression profiles in each dataset were mapped onto the Human Metabolic Reaction (HMR 2.0) (Mardinoglu et al, 2014) model using the reporter metabolites algorithm (Patil and Nielsen, 2005) implemented in the BioMet Toolbox (ver.2.0) (Garcia-Albornoz et al, 2014) to identify reporter metabolites. Benjamini–Hochberg's method was used for the correction of the p-values. Metabolites Biological Role (MBRole) database (ver.2.0) (López-Ibáñez et al, 2016) was used to determine the enrichment of reporter metabolites in metabolic pathways. Adjusted p < 0.05 was considered statistically significant.
Identification of reporter receptors, transcription factors, and miRNAs
The adapted version of the reporter features algorithm (Kori and Arga, 2018) was used to identify reporter receptors, transcription factors (TFs), and miRNAs. The combinatorial human transcriptional regulatory interaction network and Human Transcriptional Regulation Interactions database (HTRIdb) (Bovolenta et al, 2012) were used to obtain experimentally validated TF–target gene interactions, and to create a TF–target gene network.
Likewise, the experimentally confirmed miRNA–target gene interactions were acquired from our previous study (Gov and Arga, 2016; Kori and Arga, 2018) and miRTarbase (release 6.0) (Chou et al, 2016) to generate the miRNA–target gene network. To reconstruct a receptor–protein interaction network, the proteins with receptor activity (GO: 0004872) were screened in the PANTHER (Mi et al, 2019), DAVID (Huang et al, 2007), and GeneCodis (Tabas-Madrid et al, 2012) databases, and the physical protein interactions of these receptors were retrieved from the BIOGRID database (v.3.5.167) (Chatr-Aryamontri et al, 2017).
The p-values were converted to z-scores and integrated with the molecular interaction networks to determine a score for each biomolecule (receptor, transcription factor, or miRNA) based on the z-scores of its network neighbors using the inverse cumulative distribution. Then, the scores from a standard normal distribution were converted to p-values, and statistically significant features (p < 0.05) were designated as reporter biomolecules.
Crossvalidation of the reporter biomolecules
The prognostic power of reporter biomolecules (i.e., hubs, TFs, receptors, and miRNAs) was analyzed at the transcriptome level using an independent RNA-Seq and miRNA-Seq dataset from The Cancer Genome Atlas (TCGA). The TCGA-AML dataset consists of 149 samples with their clinical information (including overall survival data). Considering the expression profiles of the biomolecules of interest, patients were classified into low- and high-risk groups according to their prognostic indices.
Multivariate survival analyses and risk assessments were performed using the SurvExpress tool (Aguirre-Gamboa et al, 2013). Boxplots were used to show differences in expression levels between the risk groups. The t-test was used to estimate the statistical significance of the differences. Kaplan–Meier plots were used to determine the survival signatures of reporter biomolecules. As a cutoff, a log-rank p-value <0.05 was considered statistically significant in all analyses.
Results
The transcriptomic codes of AML
We retrieved gene expression profiles and associated clinical data of two datasets (GSE5122 and GSE8970) from the GEO database. AML patients were classified into two groups, responders and nonresponders, based on their response to tipifarnib treatment, and comparative analyzes were performed on both datasets to identify DEGs associated with treatment response. On the other hand, patients in the GSE8970 dataset were divided into high and low survival groups based on their overall survival, and comparative analyzes were performed to identify DEGs associated with overall survival. In both cases, upregulated and downregulated DEGs were identified.
As a result of comparative analyzes, we identified 1472 upregulated and 1135 downregulated DEGs associated with treatment response. In addition, 583 upregulated and 323 downregulated genes were found to be associated with overall survival of AML patients.
The up and downregulated genes were classified based on their activities and functions. The functional annotations of the upregulated DEGs associated with the treatment response were significantly enriched with cell cycle checkpoints, apelin signaling pathway, MAPK signaling pathway, RHOH GTPase cycle, and leukocyte activation. In contrast, genes associated with rheumatoid arthritis, glucose metabolism, hemostasis, and neutrophil degranulation were downregulated (Fig. 1). The enrichment analyses of upregulated DEGs associated with overall survival indicated signaling receptor binding, immune system development, response to the hormone, and hemoglobin binding. Enrichment of downregulated DEGs was carried out with the establishment of localization, enzyme binding, pancreatic adenocarcinoma pathway, response to wounding, and advanced glycation endproducts-receptor for advanced glycation endproducts (AGE–RAGE) pathway (Fig. 1).

Gene set enrichment analysis of the treatment response (GSE5122 and GSE8970) and survival (GSE 8970) datasets. The black bars represent upregulation of the pathway or process, whereas the gray bars represent downregulation.
The metabolic codes of AML
The genome-scale human metabolic network (HMR 2.0) was used to identify reporter metabolites with the integration of transcriptome data of each dataset. The pathway enrichment analyses were performed using MBROLE 2.0 to understand the metabolic activities of reporter metabolites better.
The most remarkable metabolic pathways were amino acid metabolisms such as alanine, asparagine, and glutamine metabolism; cysteine and methionine metabolism; valine, leucine, and isoleucine biosynthesis; and arginine and proline metabolism. Also, arachidonic acid metabolism was associated with several metabolites, such as 10,11-dihydro-20-dihydroxy-LTB4, 10,11-dihydro-20-trihydroxy-LTB4, 12(S)-HETE, 12-oxo-20-dihydroxy-LTB4, 12-oxo-20-hydroxy-LTB4, 12-oxo-20-trihydroxy-LTB4, 20-hydroxy-5S-HETE, 20-hydroxy-LTB5, 20-OH-10,11-dihydro-LTB4, 5(S)-HETE, leukotriene B4, and leukotriene B5 in enrichment analysis of reporter metabolites (Fig. 2).
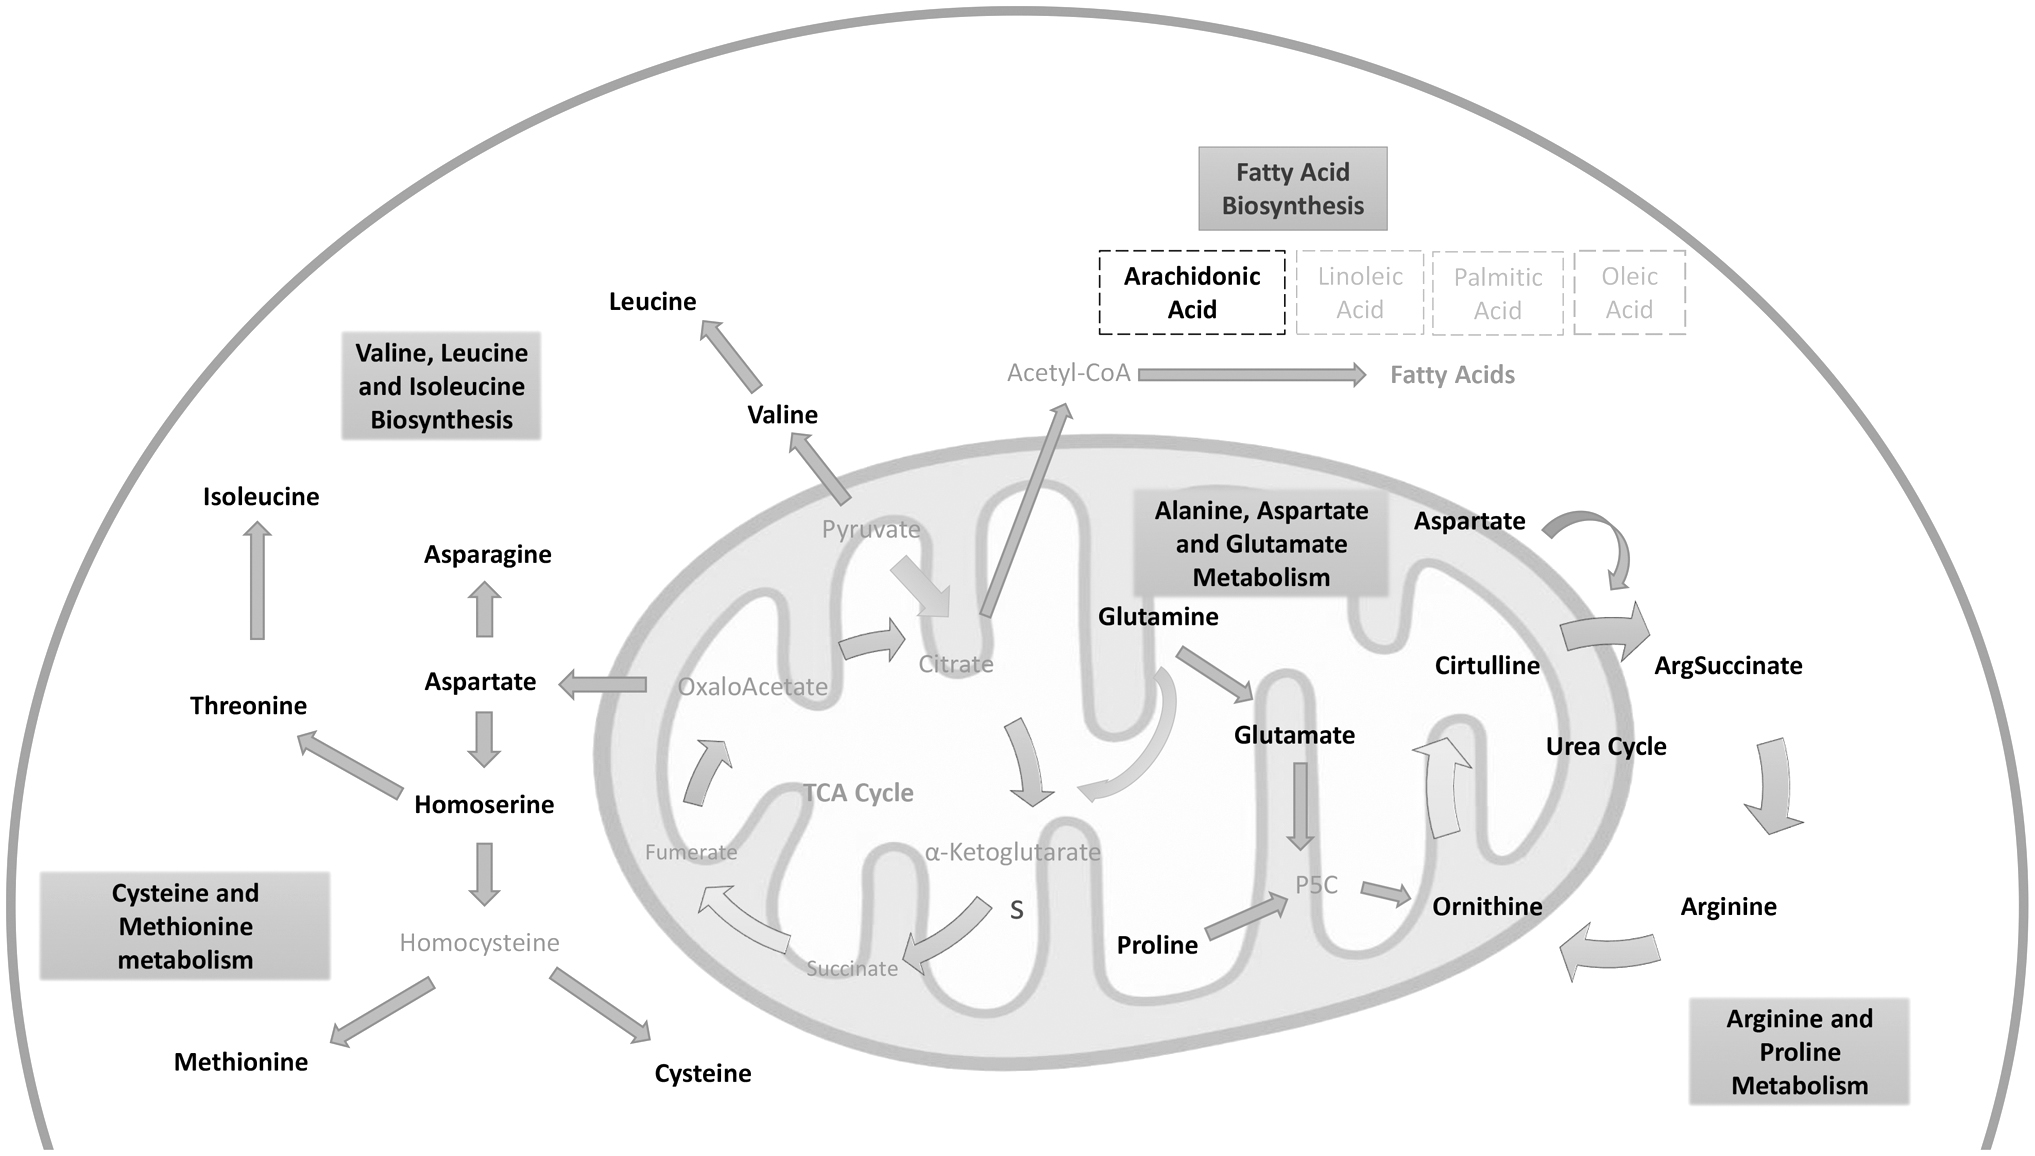
A conceptual summary of reporter metabolites highlighted as potential molecular signatures in AML. Black represents detected metabolites; gray indicates the metabolites which were not detected in the present study. AML, acute myeloid leukemia.
The receptor codes of AML
In reviewing the literature, no data were found on the reporter receptors of AML. It is crucial to identify reporter receptors that initiate transcriptional responses, providing valuable data on identifying effective biomarkers and drug targets. Differential expression patterns of their physically interacting partners were used to establish the relevance of receptors. The results showed that five reporter receptors (ACVR1, CSF3R, EGFR, PTPRC, PTPRG) (Table 1) were common in all datasets.
Reporter Receptors and Transcription Factors of Acute Myeloid Leukemia Datasets (p < 0.05)
ALL, acute lymphocytic leukemia; AML, acute myeloid leukemia.
The regulatory codes of AML
The TFs and miRNA, which are regulatory elements in transcriptional expression, are associated with the development and progression of various diseases and play vital roles in biological processes. Thus, it is necessary to understand the mechanism of those regulatory elements in different physiological and disease conditions. Regarding the study, we identified the reporter transcriptional regulators by utilizing the combinatorial human transcriptional regulatory interaction network. According to the results, the 12 TFs were detected in all datasets (Table 1). Additionally, the reporter miRNAs were examined, and the 16 miRNAs were common in all datasets (Table 2).
Reporter Micro-RNAs Associated with Acute Myeloid Leukemia Datasets (p < 0.05)
CLL, chronic lymphocytic leukemia.
Prognostic performance of the reporter biomolecules
The analysis of the prognostic power of reporter biomolecules using RNA-Seq or miRNA-Seq datasets obtained from independent studies resulted in the datasets' samples divided into low- and high-risk groups. The box plots were used to demonstrate the variations in gene expression levels between the risk groups. Evaluation of prognostic capabilities was performed using the log-rank test and Kaplan–Meier plots based on survival results. The differential expression profiles and valuable prognostic power of the reporter receptor CSF3R (p = 0.04, hazard ratio = 1.52), PTPRG (p = 0.01, hazard ratio = 2.57), and AR (p = 0.01, hazard ratio = 1.9), are shown in Figure 3.
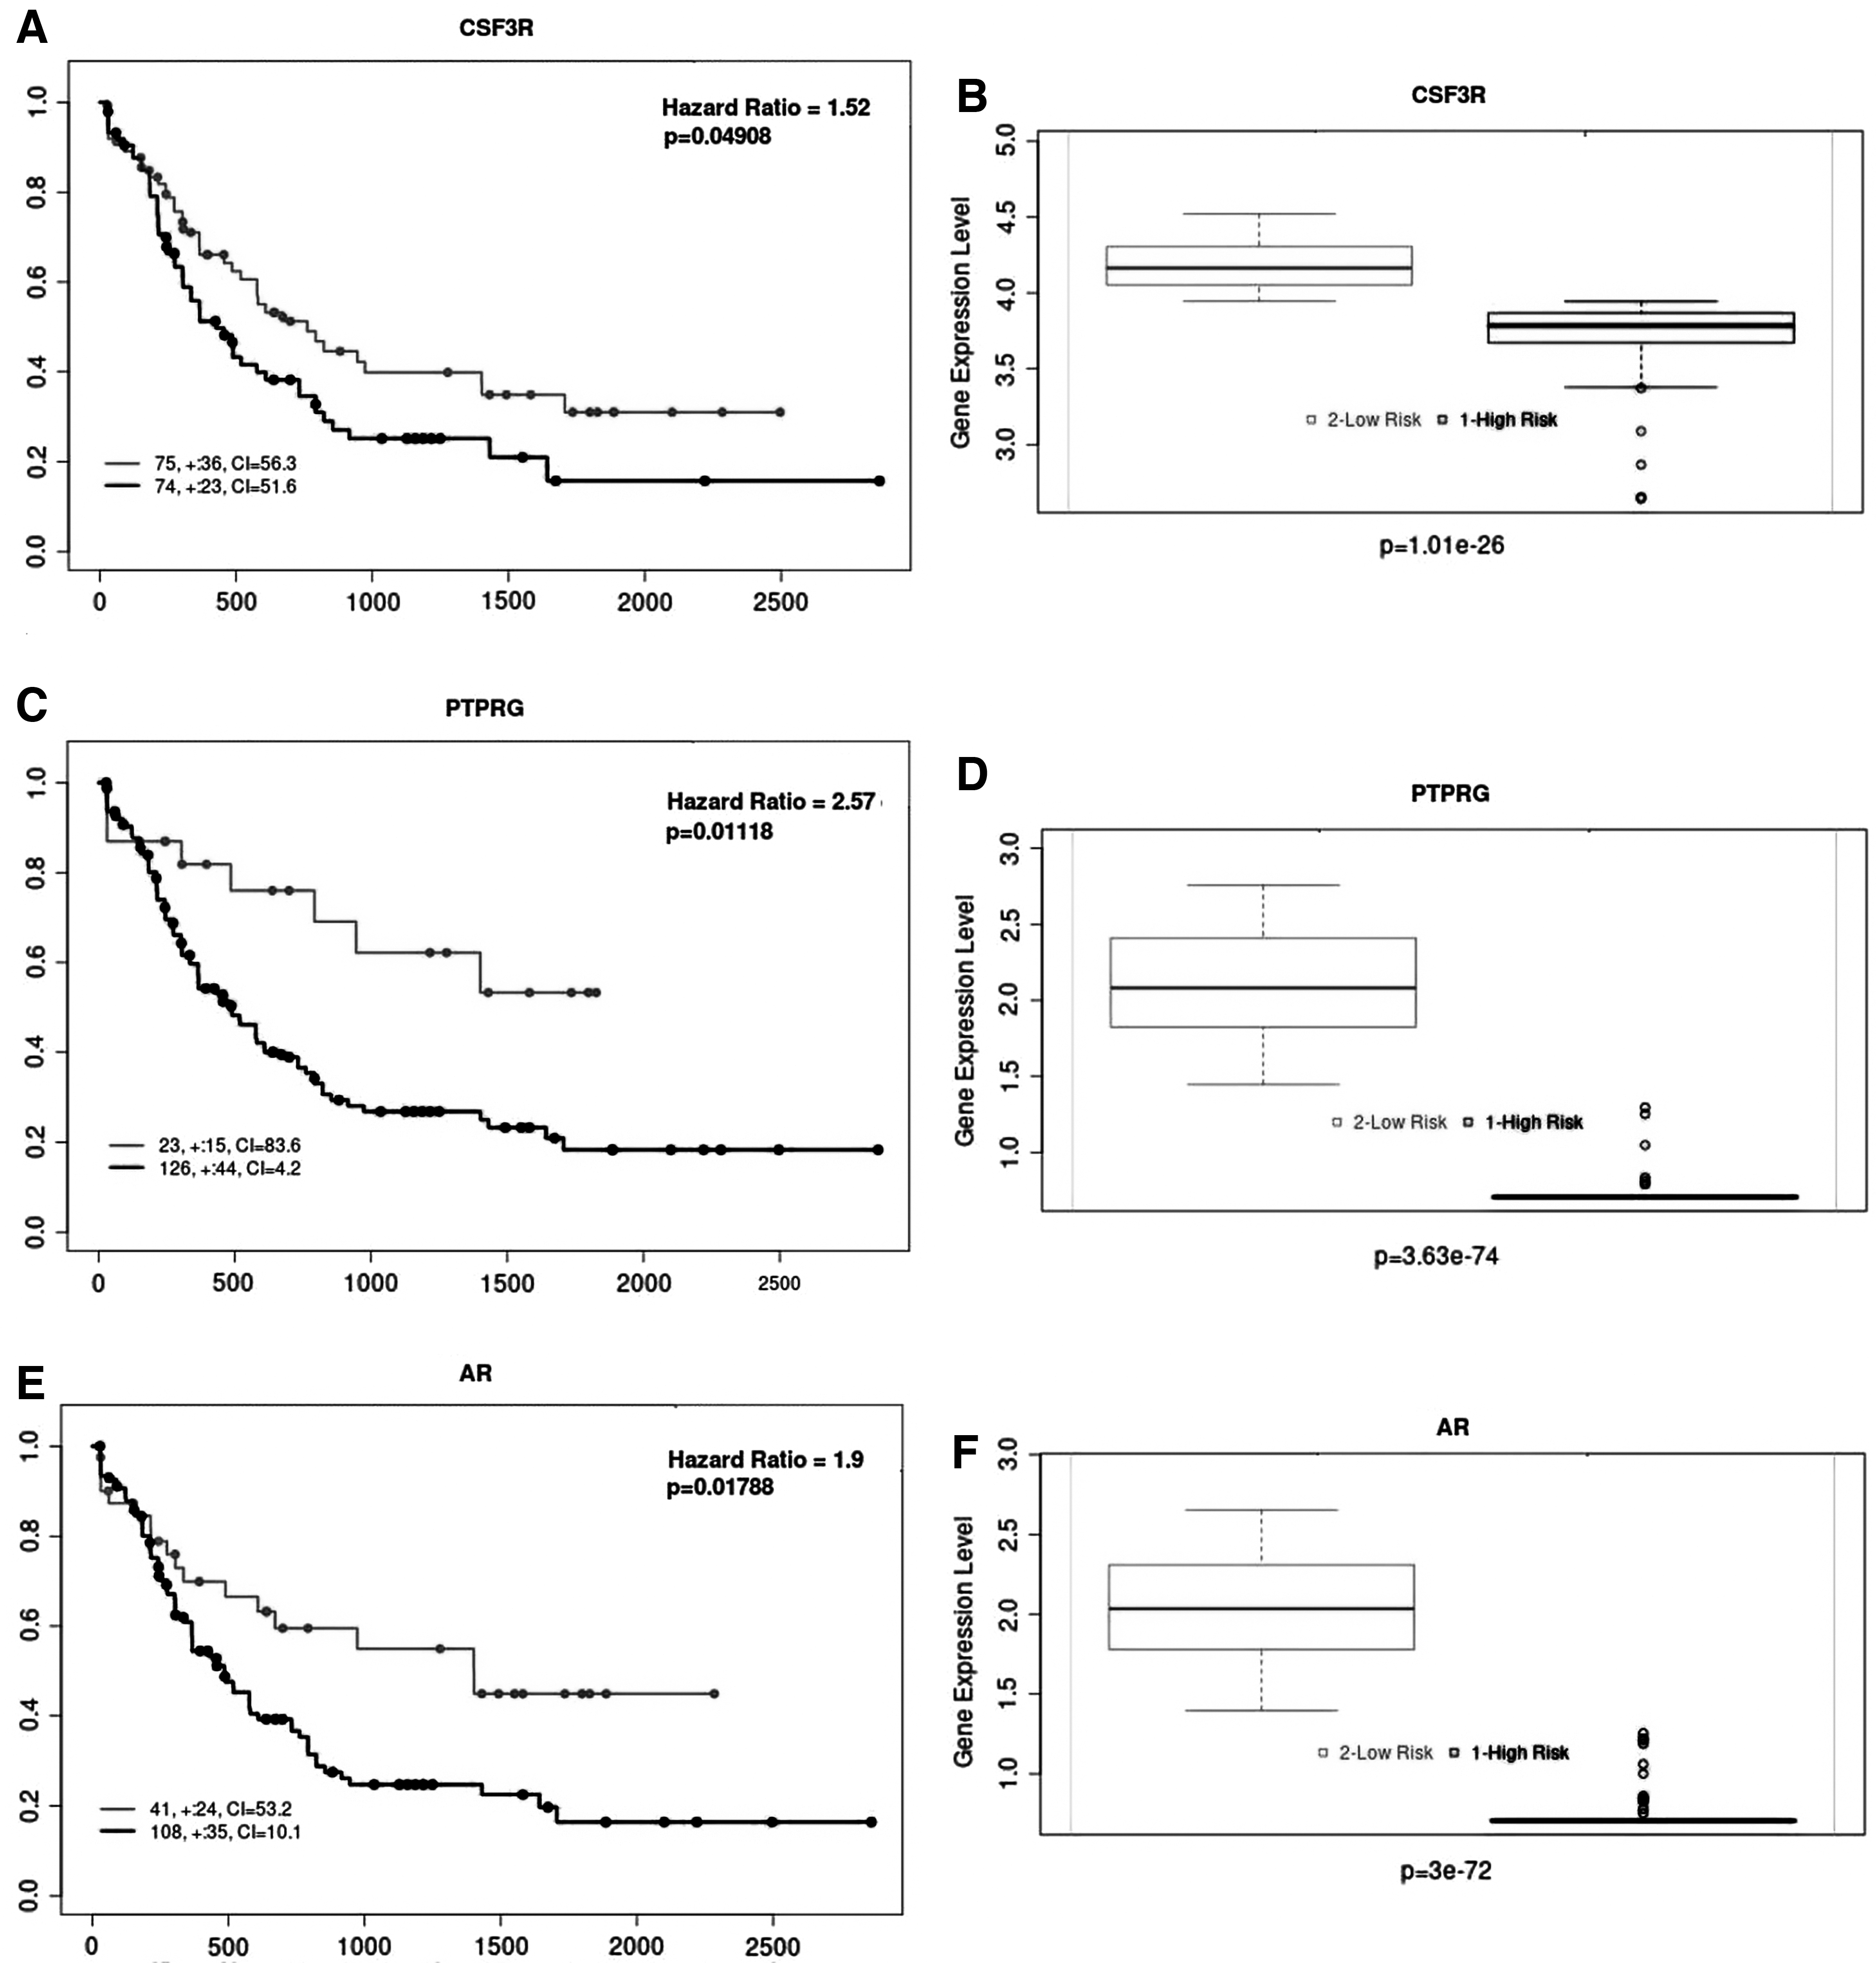
The crossvalidation results for reporter biomolecules. The Kaplan–Meier curves demonstrating the prognostic power of
Discussion
Recent progress in understanding AML pathogenesis has paved the way for developing novel targeted therapies that contribute to moving beyond the current standard treatment and promising effective antileukemic activity. Identifying efficient predictive biomarkers and therapeutic targets could improve the sensitivity and specificity of diagnostic/prognostic methods and develop novel therapeutics and effective drug repurposing strategies. Although there have been numerous studies using healthy control and patient dataset comparison to analyze the mechanism behind the disease, we used a different approach in this study. This research aims to evaluate the datasets from the treatment response perspective to understand better the complexity of drug response and the overall survival outcome of patients during the disease treatment in the scope of the multiomics approach.
Evaluation of response to treatment requires that the patient's condition can be scientifically assessed at baseline and after a specified treatment period. During therapy, treatment response and survival outcomes are significant unpredictable obstacles. Therefore, we have attempted in this study to make comparisons between groups of patients representing differences in either response to treatment or overall survival, rather than making comparisons between healthy individuals and patients. The samples from two datasets were collected from patients before tipifarnib treatment. Differences in expression level in samples taken from patients before treatment will allow us to detect biomarkers that may give us an essential clue in treatment and make more effective pinpointing of overall survival status during the treatment.
Separating patients who can respond from those who are unlikely to respond to rationally planned targeted therapies would help ensure that the correct patients receive the proper treatment, resulting in improved patient care and, in turn, higher response rates and survival rates. Furthermore, mechanisms of action or resistance could be elucidated, and potential new targets for antineoplastic therapy could be identified through the results of this research.
By individual analyses of each transcriptome dataset, hundreds of genes were statistically identified and further analyzed. The analysis indicated that 1472 DEGs were upregulated, and 1135 DEGs were downregulated in treatment response datasets. Furthermore, 582 upregulated DEGs and 346 downregulated DEGs were detected in the overall survival dataset. The upregulated genes of treatment response datasets were shown to encode proteins in various molecular functions such as cell cycle checkpoints, RHOH GTPase cycle, MAPK signaling pathway, apelin signaling pathway, and immune system. In contrast, downregulated genes of those datasets were observed to be associated with the generation of rheumatoid arthritis, glucose metabolism hemostasis, neutrophil degranulation, peptide hormone metabolism, and T-cell receptor (TCR) signaling.
The enrichment analyses demonstrated that most of the upregulated DEGs in the overall survival dataset were associated with signaling receptor binding, response to hormone, hemoglobin binding, heme biosynthesis, metabolism of porphyrins, glutamate binding, activation of AMPA receptors, synaptic plasticity, and calcium signaling pathway. Whereas, the downregulated DEGs were related to the pancreatic adenocarcinoma pathway, the AGE–RAGE pathway, signaling by neurotrophin tyrosine kinases (NTRKs), glioblastoma signaling pathways, and the TGF-β signaling pathway.
The reporter metabolites and substantially enriched metabolic pathways associated with the most critical transcriptional changes were discovered. Amino acid and arachidonic acid metabolism with several metabolites had come into prominence according to reporter metabolite analysis. Most hematologic malignancies have been linked to the metabolism of particular amino acids such as cysteine, glutamine, arginine, and branched-chain amino acids (Tabe et al, 2019).
The previous study showed that
Many kinds of research showed that an engineered human cyst(e)inase enzyme is highly effective in cysteine and cystine degradation in many cancers, such as AML, chronic lymphocytic leukemia (CLL), acute lymphocytic leukemia (ALL), and multiple myeloma (Konopleva et al, 2018). Phosphoglycerate dehydrogenase controls the serine biosynthesis pathway, and its inhibitor WQ-2101 sensitizes AML cells with FLT3 mutation to cytarabine (Bjelosevic et al, 2021). These findings disclose new perspectives into how FLT3 mutations reprogram metabolism in AML and a combination therapy strategy to improve AML treatment.
Certain lipids were shown to be lower in AML cells than in normal leukocytes in many studies. Recent experiments have discovered wide-ranging alterations in the plasma and bone marrow lipidomes of AML patients (Tabe et al, 2020). Sphingolipids, phosphocholines, triglycerides, and cholesterol esters in AML patients were declined in the plasma (Pabst et al, 2017). However, gamma-linolenic acid 18:3 n-6 and 8,11,14-eicosatrienoic acid 20:3 n-6 were increased, although many prostaglandins, such as PGE2 and 15-keto-PGF2α were decreased in the plasma analyses (Pabst et al, 2017).
The findings of this study figured out the importance of arachidonic acid metabolism highlighted with 12 metabolites following amino acid pathways. The plasma arachidonic acid and precursor's correlation with unfavorable prognostic risk was also observed. The importance of the arachidonic acid cascade in AML can be explained by the association of high arachidonic acid concentrations in AML plasma, especially with high BM blasts and high peripheral blasts. Moreover, PGF2α was found to be elevated in AML with low BM and peripheral blast and in the favorable prognostic risk patients (Pabst et al, 2017).
Due to their genetic heterogeneity, myeloblasts and leukemic stem cells may be highly dependent on specific metabolic pathways in AML diseases (Mesbahi et al, 2022). Metabolic alteration in AML cells has been spotlighted as a potential therapeutic target, and promising findings have been shown in preclinical leukemia models using reagents that target metabolic pathways. The activation and the significant roles of the amino acid and arachidonic acid pathway in AML carcinogenesis were demonstrated by many clinical studies, and these results confirm our findings in that perspective.
The reporter features algorithm was adapted to identify reporter molecules, such as receptors, transcription factors, and microRNAs. In this study, five proteins (namely, ACVR1, CSF3R, EGFR, PTPRC, and PTPRG) were identified as reporter receptors in AML. The previous studies reported frequent mutations of CSF3R associated with abnormalities of RUNX1, CBFB, CEBPA, and NPM1 genes in AML (Braun et al, 2019; Zhang et al, 2018). In addition, EGFR expression in AML patients has been associated with a poor prognosis (Nath et al, 2020); however, the exact mechanism of EGFR in AML progression is still unknown and has to be deeply investigated in further studies.
In AML and ALL, increased PTPRC expression is related to a poor prognosis (Ruela-de-Sousa et al, 2010) and elevated in cells expressing an oncogenic FLT3 mutant FLT3-ITD (Arora et al, 2012). PTPRG is frequently deleted in the lung (Galvan et al, 2015) and renal cell carcinoma (Kastury et al, 1996) and hypermethylated in breast cancer (Sherry et al, 2010), childhood ALL (Xiao et al, 2014), and cutaneous T cell lymphoma (van Doorn et al, 2005).
While the expression and function of PTPRG have been the focus of studies and well explained in CML (Drube et al, 2018), PTPRG functions in the AML were not studied. ACVR1/BMPR1 pathway was found to be preferentially engaged to induce MIXL1 in hematopoietic stem cells or progenitors but was not proposed as a prognostic marker for AML (Raymond et al, 2014). Moreover, in the same study, ACVR1/BMPR1 signaling is suggested to stimulate endogenous MIXL1 expression in KG1, OCI-ML2, ML3, and K562 cell lines, and LDN-193189, a ACVR1/BMPR1 inhibitor, is shown to target these cells.
However, MIXL1 expression was unaffected by LDN-193189 in U937 and HL60 cells, suggesting either a MIXL1-independent BMP induction or nonexistence of this pathway in HL60 and U937 cells that are resistant to LDN-193189 (Raymond et al, 2014).
Consequently, to our knowledge, the functional association of receptors, PTPRG and ACVR1, with AML is being proposed for the first time in this study, which needs in vitro or in vivo validation. The differential expression of ACVR1, EGFR, PTPRC, PTPRG, and CSF3R between high and low-risk groups was also crossvalidated here using an independent dataset (TCGA-AML), and the prognostic power of PTPRG and CSF3R was demonstrated (Fig. 3). We showed that the expression of PTPRG and CSF3R are associated with a low risk of AML. Therefore, PTPRG and CSF3R warrant further mechanistic and functional investigation and may have great potential for predicting both treatment response and long overall survival rate for AML patients.
Since transcriptional regulation plays such an essential role in cellular homeostasis, pathogenesis that can result from disturbances in transcriptional regulatory mechanisms is not a surprise. AR, E2F4, ESR1, ETS1, FOXA1, FOXP3, GATA1, GATA2, GATA3, PRDM14, TFAP2C, and YBX1 were common in all datasets, and these transcription factors may play an essential role in the regulation of AML.
High AR expression was reported to be associated with favorable overall survival of AML (Hu et al, 2020). E2F4 was found to be an essential modulator of AML proliferation (Feng et al, 2020). It was found that methylations of tumor suppressor genes and ESR1 constituted an independent outcome predictor in AML (Hess et al, 2008). Elevated levels of ETS1 were detected in AML, but the functional consequences of ETS1 overexpression in AML cells have not been observed (Lulli et al, 2010).
FOXA1 is often found to be abnormally expressed in AML patients with FLT3-TKD and NRAS-PM mutations (Neben et al, 2005). The decreased level of FOXP3 was found to delay the leukemia progression and prolong the survival of AML mice (Wang et al, 2020). The mechanisms in the deletion or deregulation of GATA1 (Drissen et al, 2010) and GATA2 (Menendez-Gonzalez et al, 2019) were found to be associated with the development of AML. However, GATA3 was found to involve multiple tumor-related pathways in B-ALL to impact leukemogenesis. Endothelial-specific knockout of GATA3 leads to impairment of hematopoietic stem cell generation; its role is not identified in AML (Hou et al, 2017).
PRDM14 acts in the maintenance of embryonic stem cells and the reacquisition of pluripotency in primordial germ cells (Tracey et al, 2019). PRDM14 was noticeably expressed and correlated with poor survival in breast cancer (Casamassimi et al, 2020) and can partner with CBFA2T3 on DNA and participate in T-ALL development (Tracey et al, 2019). Although PRDM14 has been widely studied in many cancers, such as lung (Zhang et al, 2013), breast (Taniguchi et al, 2017), and lymphoblastic leukemia (Dettman and Justice, 2008), the association of AML with PRDM14 was not specified. miR-10a is strongly overexpressed in AML cells and modulates TFAP2C by downregulating (Vu et al, 2020). The expression of YBX1 was found to be upregulated in myeloid leukemia cells, coupled with reduced proliferation and impaired leukemic capacity in AML cell lines (Feng et al, 2021).
Our study highlighted PRDM14 and GATA3 as potential effective biomarkers in a patient's treatment response and survival conditions during the disease and can be a therapeutic target in AML. Moreover, we performed survival analyses to test the prognostic capability of the reporter TFs through Kaplan–Meier curves, log-rank p-values, and hazard ratios. The prognostic power of AR was demonstrated in the RNA-Seq dataset obtained by an independent AML study (Fig. 2).
The results of reporter miRNA analysis represented various miRNAs; 16 reporter miRNAs were associated with treatment response. Previous studies have shown that most of the reporter miRNAs are associated with carcinogenesis and have altered expression levels in different cancers, including AML, CLL, ALL, gastric cancer, lung cancer, colorectal cancer, breast cancer, bladder cancer, and ovarian cancer. These include: let-7b (Johnson et al, 2021), miR-106b-5p (Verboon et al, 2016), miR-122-5p (Xu et al, 2018), miR-124-3p (Li et al, 2018b), miR-16-5p (Li et al, 2017), miR-17-5p (Marcucci et al, 2011), miR-181a-5p (Seipel et al, 2020), miR-192-5p (Zou et al, 2019), miR-20a-5p (Cheng et al, 2016), miR-20b-5p (Papageorgiou et al, 2018; Xia et al, 2020), miR-26a-5p (Miyamoto et al, 2016), miR-335-5p (Martin et al, 2017), miR-92a-3p (Gado et al, 2019), and miR-93-5p (Zhang et al, 2017).
Overexpression of miR-519d-3p inhibits breast cancer cell growth and motility and arrests those cells into the G0/G1 cell cycle. By targeting LIMK1, which is a serine/threonine kinase, it plays a crucial role in actin and microtubule dynamics (Li et al, 2018a). However, the association of miR-519d-3p in AML was not found. miR-484 has been implicated in diagnostic specificity for CLL (Brown et al, 2017), and its high expression was remarkably correlated with a favorable prognosis in ALL (Schotte et al, 2012). Besides, miR-484 has already been associated with various cancers, but the association of miR-484 was not identified in AML previously. As a result, the results indicated miR-519d-3p and miR-484 deserve more mechanistic and functional study and highlighted their potential as promising biomarkers for both therapy response and overall survival outcomes in AML.
Conclusions
AML is a complex disease resulting from recurrent cytogenetic and mutational changes in leukemic blasts and epigenetic alterations in progenitor cells. To understand disease progression, omics data must be analyzed at multiple levels in the context of systems biomedicine. In this study, we present molecular codes of AML at RNA (mRNA, miRNA), protein (receptor, TF, enzyme), and metabolite levels using an integrative multiomics approach. The applied methodology yielded significant evidence of novel molecular signatures in AML, such as PTPRG and ACVR1 as receptors, PRDM14 and GATA3 as TFs, miR-519d-3p and miR-484 as miRNAs, which require further validation studies in vitro and in vivo. The amino acid and arachidonic acid metabolisms were also identified as potential therapeutic targets.
In addition, the high prognostic performance of CSF3R, PTPRG, and AR was demonstrated. These biological molecules not only demonstrate the interaction of AML with specific biological processes, but they also have the potential to be used as system-level biomarkers for AML in the context of disease prognosis. Reliable biomarkers that can accurately predict the prognosis of patients with AML will be helpful for therapeutic outcomes. This multiomics study lays the foundation for future research into better therapeutic trials in the treatment of AML.
Footnotes
Author's Contributions
N.K.: Conceptualization, Formal analysis, Writing—Original draft preparation, Review and Editing, Visualization, Supervision. M.K.: Formal analysis, Writing—Original draft preparation. B.T.: Conceptualization, Formal analysis, Supervision. K.Y.A.: Conceptualization, Writing—Original draft preparation, Review and Editing, Supervision. B.K.Y.: Review and Editing, Supervision. O.A.D.: Conceptualization, Writing—Original draft preparation, Review and Editing, Supervision. All authors have read and agreed to the published version of the article.
Author Disclosure Statement
The authors declare they have no conflicting financial interests.
Funding Information
The present study was enabled by a research grant from the Health Institutes of Turkey (TUSEB) with grant number 2019-TA01-4065.