




Abstract
Obesity has reached epidemic proportions in the United States, but little is known about the mechanisms of weight gain and weight loss. Integration of omics data is becoming a popular tool to increase understanding in such complex phenotypes. Biomarkers come in abundance, but small sample size remains a serious limitation in clinical trials. In the present study, we developed a strategy to screen predictors from a multiomics, high-dimensional, and longitudinal dataset from a small cohort of 10 women with obesity who were provided an identical very-low calorie diet. Our proposal explores the combinatorial space of potential predictors from transcriptomics, microbiome, metabolome, fecal bile acids, and clinical data with the application of the first-order Spearman partial correlation coefficient. Two statistics are proposed for screening predictors, the partial association score, and the persistent significance. We applied our strategy to predict rates of weight loss in our sample of participants in a hospital metabolic facility. Our method reduced an initial set of 42,000 biomarker candidates to 61 robust predictors. The results show baseline fecal bile acids and regulation in RT-polymerase chain reaction as the most predictive data sources in forecasting the rate of weight-loss. In summary, the present study proposes a strategy based on nonparametric statistics for ranking and screening predictors of weight loss from a multiomics study. The proposed biomarker screening strategy warrants further translational clinical investigation in obesity and other complex clinical phenotypes.
Introduction
Obesity has reached epidemic proportions in the United States, with about two-thirds of adults who are classified as being overweight or obese (Hales et al, 2018). In obese subjects, gradual weight loss ameliorates adipose tissue inflammation and related systemic changes. Little is known about the simultaneous effects of rapid weight loss induced by a clinically relevant very-low-calorie diet (VLCD) on subcutaneous adipose tissue inflammation, the plasma metabolome, microbiome, and bile acids content. It is well known that weight loss and weight gain occur at differing rates in individuals, but the mechanisms responsible for it are still unclear (Bouchard et al, 1990; Leibel et al, 1995). A greater understanding of the factors contributing to an individual's enhanced rapid weight loss might significantly increase the development and efficacy of weight loss therapies.
This gap is being gradually filled with the development of omics and bioinformatics technologies and their ability to generate large amounts of data from complex biological systems. Recently, the integration of lipidomics, transcriptomics, proteomics, and metabolomics was used for deep phenotyping of glycemic responders upon clinical weight loss (Valsesia et al, 2020).
Despite the excitement and decreasing costs for these new technologies, small sample sizes are still an obstacle, and consequently, underpowered studies labeled as exploratory generate incipient insights for developing therapies. The combination of high dimensionality, small sample sizes, and heterogeneous data sources in multiomics pose a challenge for bioinformatics and statistical methods. Assumptions such as normality, linearity, and additive effects are hard to be assessed, and complex models cannot be fully validated. Type-I error is dramatically inflated when performing variable selection in small samples for multiomics datasets (Kirpich et al, 2018).
Until now, methods to handle multiomics data with small sample sizes lacked parsimonious and informative solutions to unravel disease mechanisms (McCabe et al, 2020).
The present study proposes a strategy based on nonparametric statistics for ranking and screening predictors of weight loss from a multiomics study with a small sample size. This strategy consists of (1) dimensionality reduction, (2) first-order partial Spearman correlation, (3) a scaled Shannon information (S-value) integrating the coefficient of correlation and its p-value, and (4) biological validation with inferred networks.
We applied the proposed strategy to a weight loss study (Alemán et al, 2017) performed in a group of 10 obese females fed an identical diet in a metabolic ward. Data were generated from six sources: clinical, transcriptomics (RNA-seq and RT-polymerase chain reaction [RT-PCR]), fecal metabolome, gut microbiome, and fecal bile acids.
Materials and Methods
Dataset
A single-center interventional study performed at The Rockefeller University Hospital between September 2012 and August 2013 studied 10 very obese (body mass index ≥35 kg/m2) postmenopausal women (defined by ≥2 years without menstrual periods). The participants consumed a VLCD until they lost ∼10% of the baseline weight. This diet provided ∼800 Kcal/d and consisted of a choice of shakes, soups, bars, and puddings. The study investigated clinical outcomes and systemic biomarkers of inflammation and metabolism at baseline and after VLCD-induced weight loss.
RNA was extracted from adipose tissue biopsies, and gene expression was assessed by bulk RNA-seq, and RT-PCR. Stool 16S rRNA sequencing and mass spectrometry were performed for fecal microbiota and fecal bile acids, respectively (Alemán et al, 2018; Alemán et al, 2017).
Ethics approval and consent to participate in the study were approved by the Institutional Review Boards at The Rockefeller University, Weil Cornell Medical College, and Memorial Sloan Kettering Cancer Center, and registered under ClinicalTrials.gov identifier NCT01699906. A written informed consent was obtained from all study participants.
Supplementary Table S1 shows the number of predictors within each data source, followed by the relative frequency. Any biomarker with more than 20% missing data was excluded from analyses.
The rate of weight loss (Eq. 1) is the daily average loss in kilograms observed in a study participant.
To account for potential confounding created by different levels of exercising in the patients, we adjusted the daily rate of weight loss by the total number of steps during the study period. Therefore, we use
Screening strategy
Our pipeline (Fig. 1) for screening predictors of weight loss accomplishes the following: (1) performing dimensionality reduction; (2) iterating the first-order partial Spearman correlation coefficient over the set of predictors and confounders; (3) ranking predictors based on the median partial correlation coefficient and robustness of statistical significance; (4) screening predictors among the top-ranked ones; and (5) representing the connection between data sources with a network.
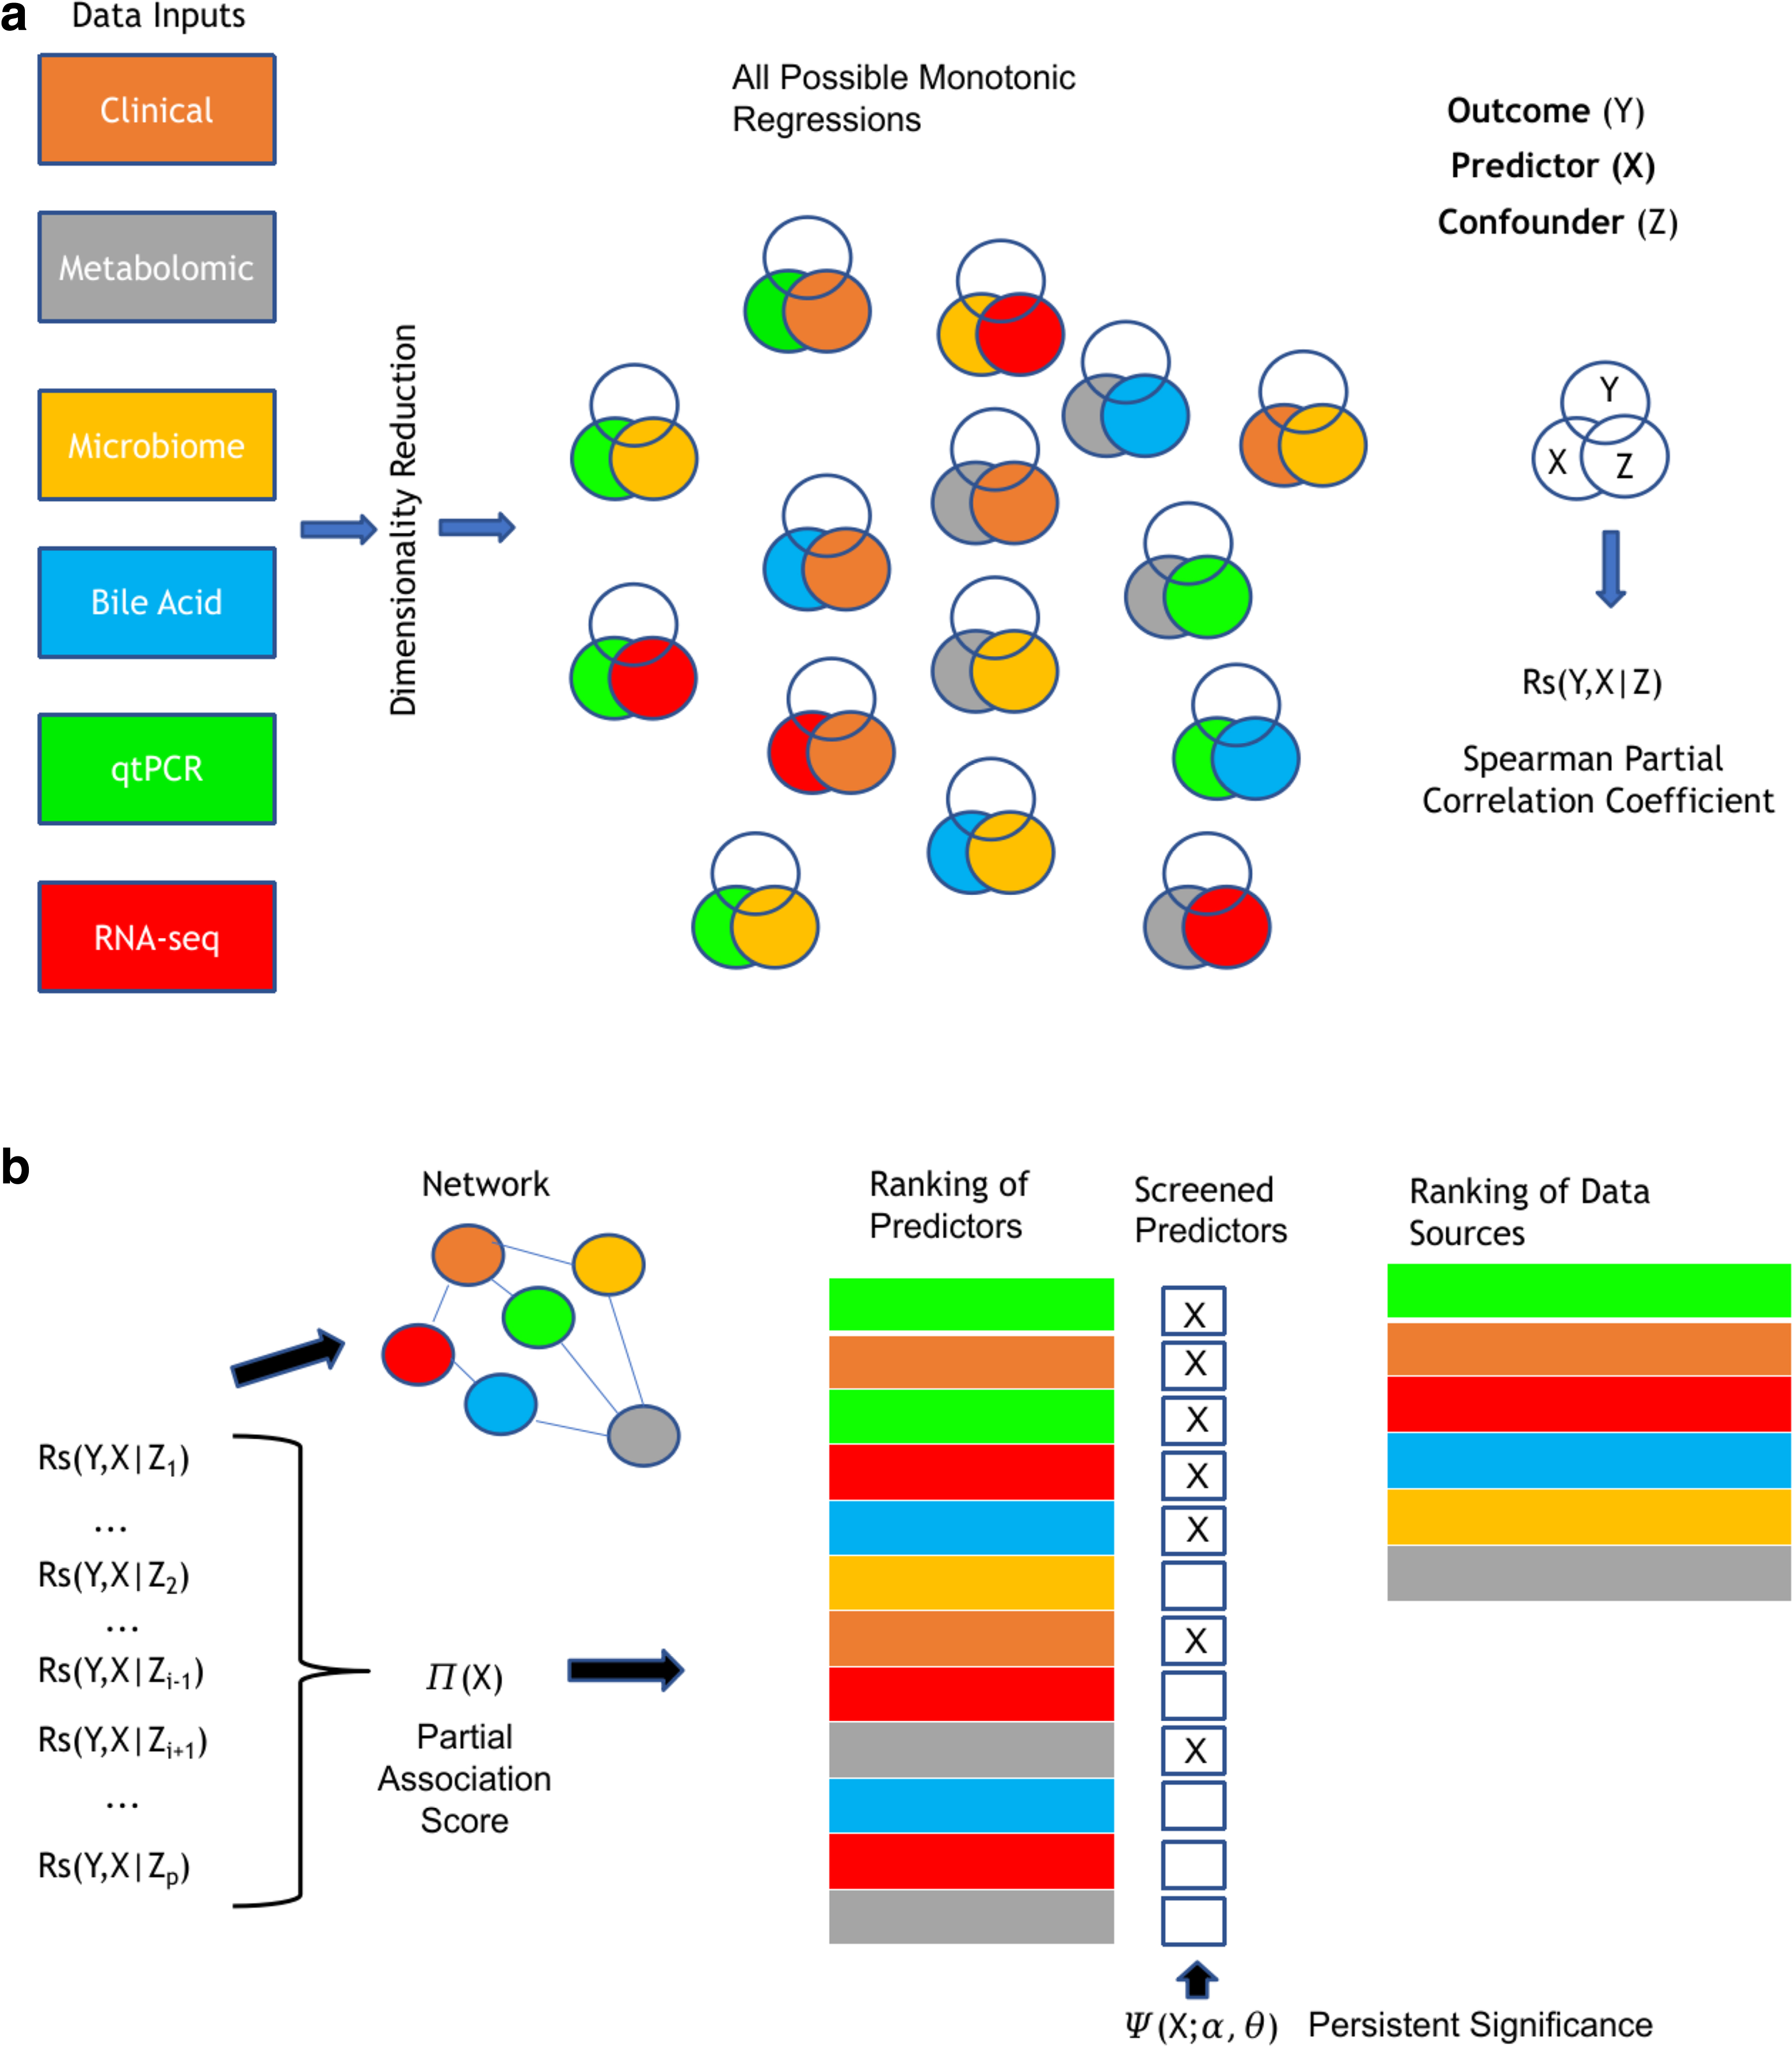
Schematic of multiomic pipeline for screening predictors of weight loss.
Dimensionality reduction
According to Supplementary Table S1, there is a significant imbalance in the number of predictors from different data sources, as the majority comes from mRNA expression levels derived from RNA-seq. To mitigate selection bias caused by overrepresentation of a specific data source, we reduced the dimensionality in adipose tissue RNA-seq analysis and plasma metabolites using Gene Set Variation Analysis (GSVA) (Hänzelmann et al, 2013). This technique mapped transcriptomic and metabolomics expression levels into pathway activity scores.
GSVA scores were computed for 4107 canonical pathways and 54 metabolic pathways for RNA-seq genes and metabolites, respectively. We further reduced RNA-seq data to 176 pathways that were differentially expressed when comparing post- versus pre-VLCD activity scores. Differential expression analysis was performed with mixed effect models implemented in the limma library, part of the R programming environment.
Spearman partial correlation coefficient
Spearman's coefficient of correlation
Given a sample of n observations from the pair
where n is the sample size and di is the difference between the ranks of yi and xi, i-th observed values from Y and X, respectively. The Spearman's correlation coefficient lies in the interval between
The second and most familiar representation (Eq. 3) is exactly the sample correlation used for estimating the Pearson correlation coefficient but observations y and x are replaced by their rankings, v and w, respectively.
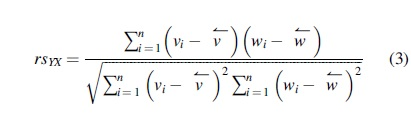
Our approach to screen predictors of weight loss relies heavily on the use of the first order Spearman partial correlation coefficient (Eq. 4).
The coefficient
We show in Eq. (5) a test statistic (Sheskin, 2003; Weatherburn, 1968) for the hypothesis
Partial association score
The use of the partial correlation coefficient for robust selection of features in high-dimensional data has been discussed in diverse applications (de la Fuente et al, 2004; Li et al, 2012; Raghuraj Rao and Lakshminarayanan, 2007). Consider Y a response variable, X a potential predictor, and
In Eq. (6),
Persistent significance
We propose an ad hoc threshold
Network analysis
We further explore the Spearman partial correlation to propose a metric for the strength of connection between two nodes of a weighted directed network. Consider X and Z, two potential predictors of Y, to be the vertices of a directed graph. We propose the edges of this graph to be represented according to Eq. (9).
The connectivity in this network characterizes how much the relationship between Y and X is affected by the confounder Z. Note that Eq. (9) represents the proportion of the coefficient of determination that is reduced (or increased) due to confounding. The farther
The network built on

Note that
We first evaluate
Results
Weight loss rates differ across individuals
The rates of weight loss characterized by their longitudinal trajectories and estimated slopes differ markedly between study participants (Fig. 2). In general, the participants showed a linear decay in weight at different speed rates. Adding a quadratic term to describe the weight loss trajectory had no statistical significance (data not shown).
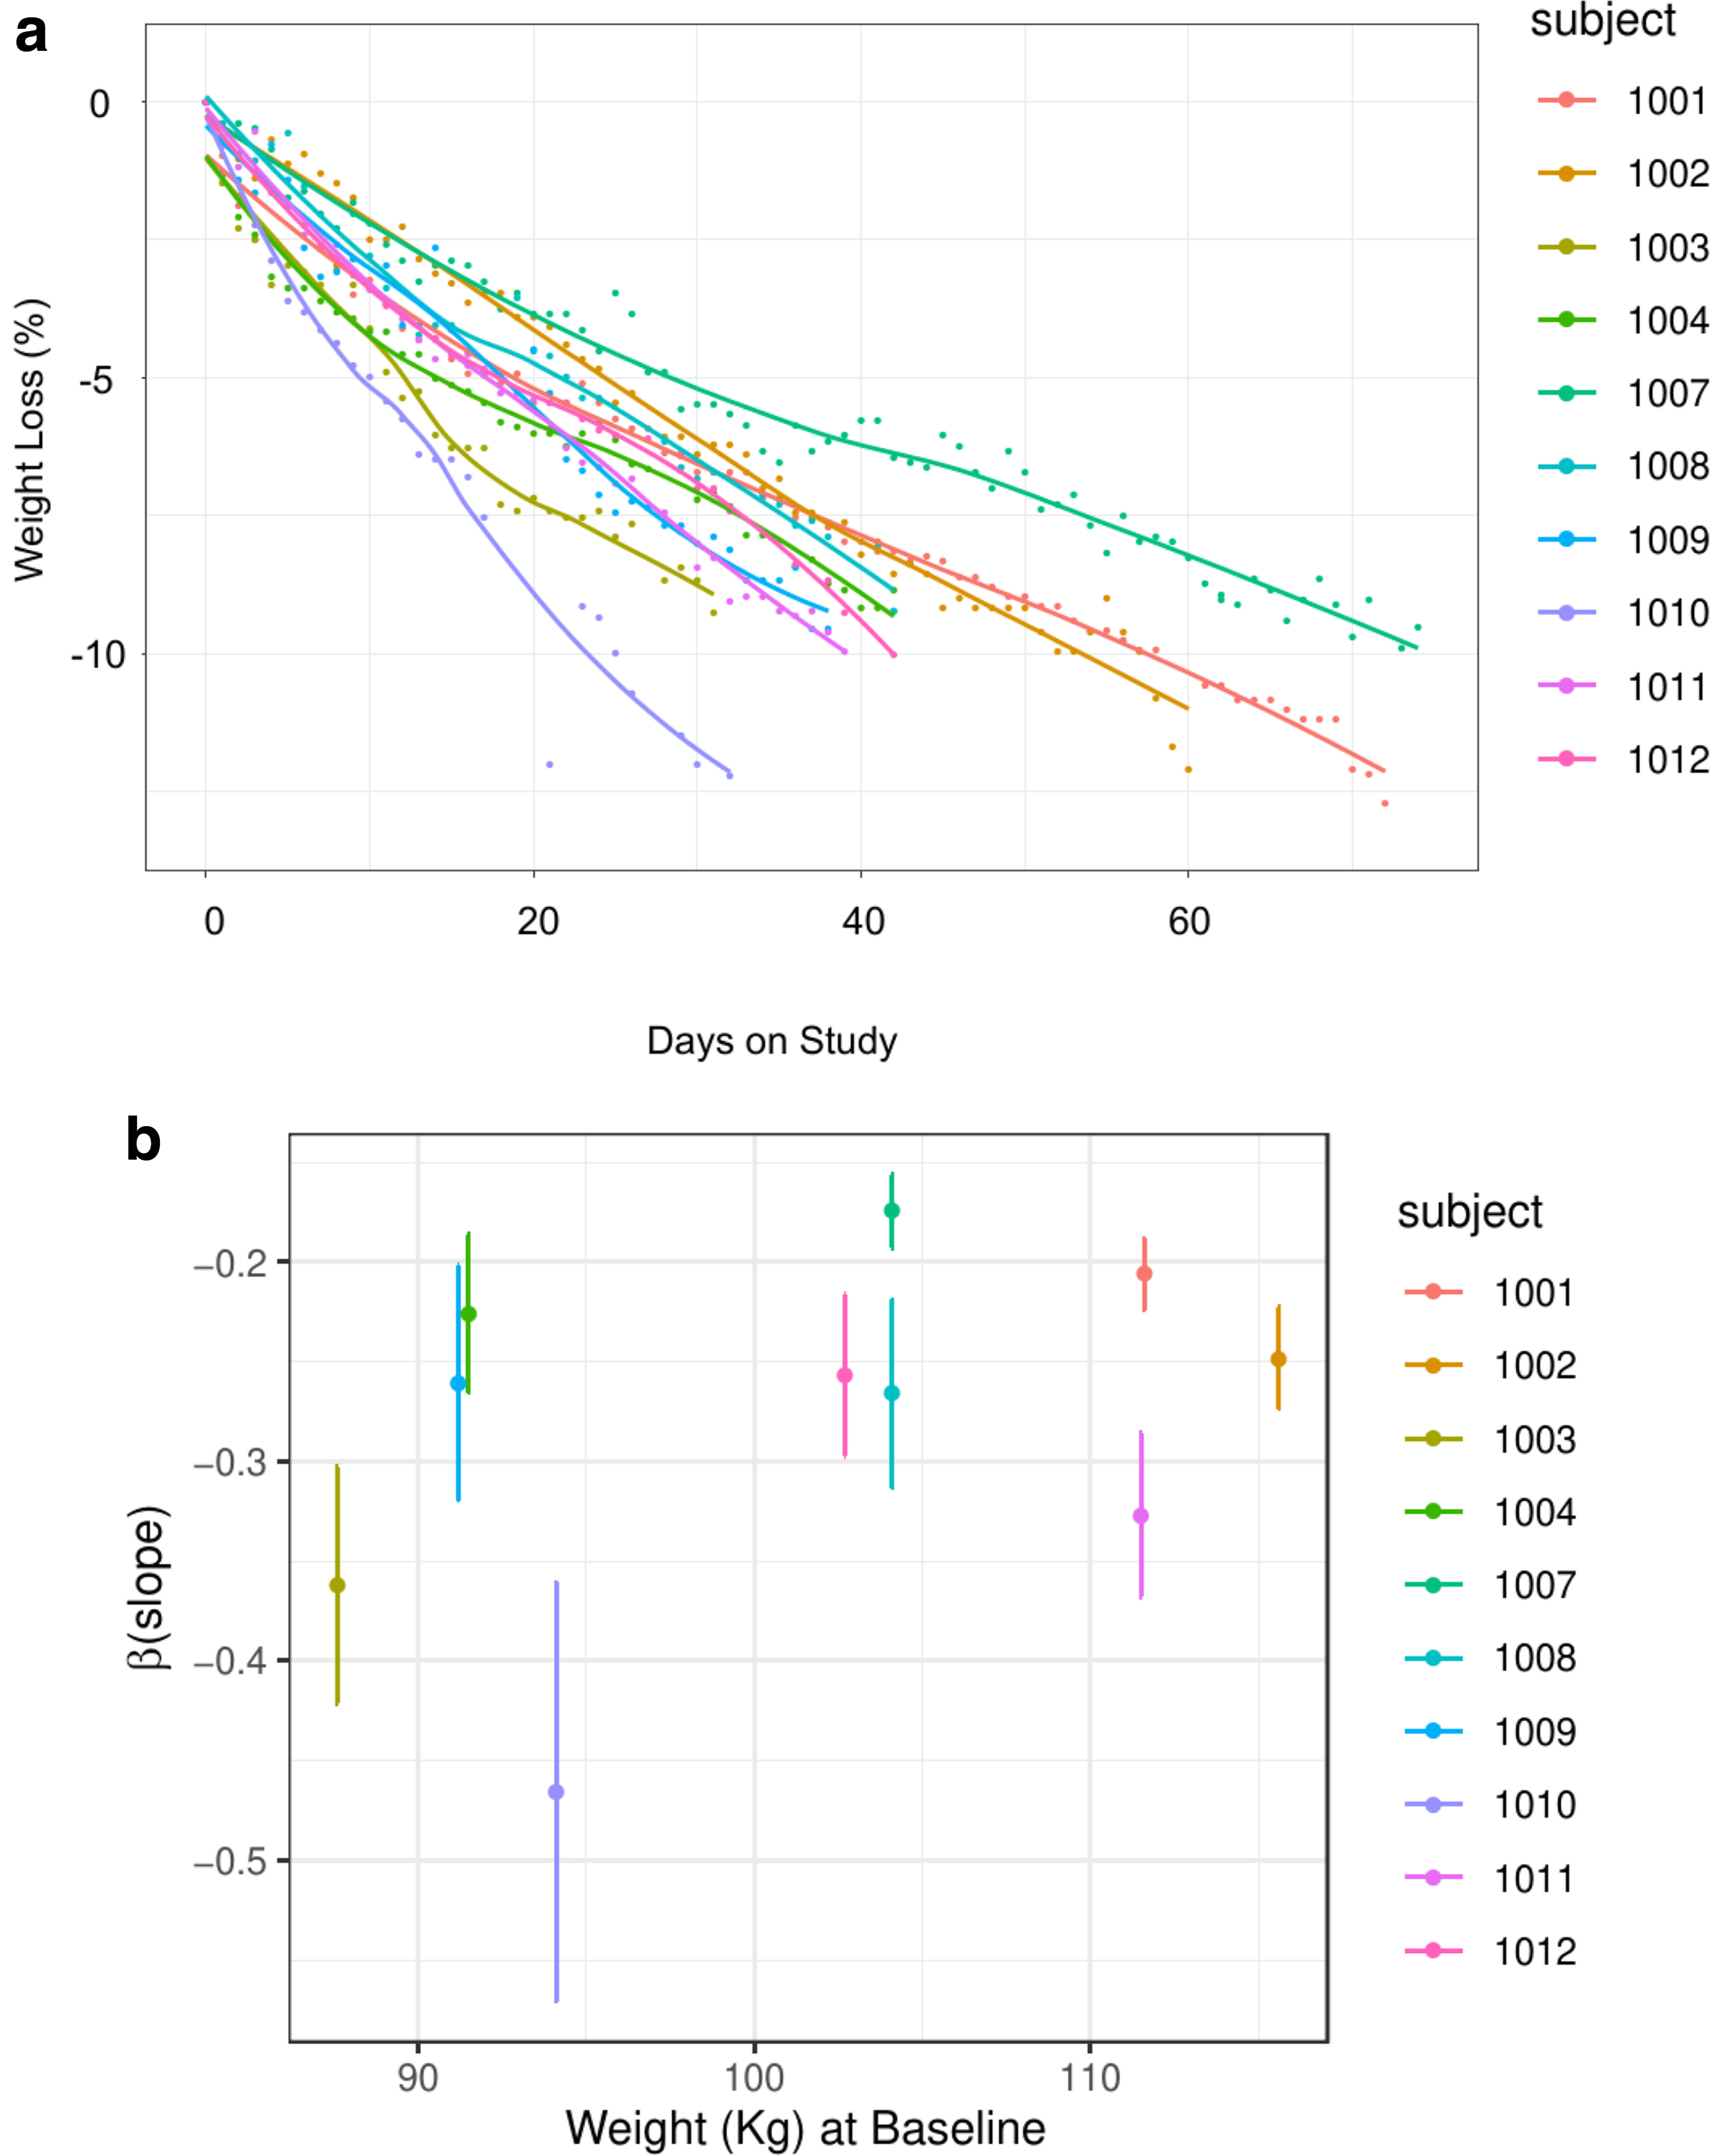
Rate of diet-induced weight loss is highly variable and not predicted by baseline weight.
The most straightforward predictor equation assuming each pound lost to be equivalent to a 3300-kcal deficit, did not predict individual rates. The slopes are different not only in their magnitude but also in the level of uncertainty estimated by the standard error. Although subjects were enrolled in different months over 1 year, there is no statistical evidence of seasonal components affecting the weight loss dynamics.
Omics heterogeneity
Omics profiles are heterogeneous and unstable, that is, they vary between subjects and fluctuate over time. In Supplementary Table S2, we show the median coefficient of variation, and interquartile range, across data sources. We used the recently developed Variance Partition method (Hoffman and Schadt, 2016), implemented in the variancePartition R package, to describe how much of the variance of each predictor can be explained by biological variability (within-subject) and effects of covariates (deterministic component). The residual component is related to random or nonexplained variance.
The method consists of fitting a linear model to each predictor, including fixed and random factors that are potential sources of variation. The method quantifies the proportion of total variation explained by each factor. In our data, after log transformation, we partitioned the variance in each predictor by fitting a mixed model with Time (pre-VLCD and post-VLCD) as a fixed effect and a random intercept for each subject. We show in Figure 3a how sources of variation are distributed within each omics.

Bile acids are the least correlated with VLCD and the most correlated with weight loss rate.
Overall, we see in Figure 3a that a large proportion of metabolites, bile acids, and microbiota exhibit high nonexplained variation, suggesting that the impact of VLCD on biomarkers originating from these omics is less predictable. On the contrary, variation in mRNA-based predictors from RT-PCR and RNA-seq demonstrated more considerable within-subject variation. For clinical data, as expected, the variation is less explained by VLCD compared to measurements at the molecular level. Another interesting finding is that VLCD could only explain a very small portion of the variation in bile acids. On the contrary, within-subject variation in some bile acids is higher than most of RNA-seq or RT-PCR biomarkers.
Spearman correlation between weight loss and predictors
Figure 3b illustrates the Spearman correlation coefficient between weight loss rate and predictors ranges across data sources and different time-points. In this figure, the blue horizontal line is placed at the null association level
Screening weight loss predictors based on partial association score and persistent significance
Our approach ranked and selected predictors of weight loss by setting up
Figure 4a and Supplementary Tables S3–S5 summarize the predictors screened from our strategy. Figure 4a shows a bar plot with the estimated partial association score for predictors screened in pre-VLCD (n = 26), post-VLCD (n = 27), and changes from pre-VLCD (n = 22). Our strategy screened 61 unique predictors over these three scenarios. The cholic acid and genus Alistipes were screened in all scenarios.

Metrics for screening predictors of weight loss rate.
At pre-VLCD, predictors from clinical data, metabolomics, and microbiota were equally represented, 23.1% in each of these data sources (Supplementary Table S3). The genera Butyricicoccus, Eggerthela, and Defluvitalea, oxygen binding, and primary bile acid metabolism were among the five top-ranked predictors. RNA-seq (33.3%) and bile acids (22.2%) were important data sources at post-VLCD. TCA, TCDCA, and cholic acid were at the top of the ranking, together with genus Alistipes and Response to DNA Damage Stimulus (Supplementary Table S4).
Among the 22 predictors screened for changes from pre-VLCD (Supplementary Table S5), the most represented data sources are RNA-seq (22.8%) and RT-PCR (22.8%), followed by bile acids (18.2%) and microbiota (18.2%). Insulin is the only predictor screened in the clinical data source. The allolithocholic acid showed the most significant partial association score (5.18) and persistent significance (0.99).
In Supplementary Figure S1, violin plots show the distribution of
Enrichment of data sources
The
RT-PCR and fecal bile acids as network hubs
Finally, we aimed to understand the connectivity between the examined predictors by network analysis. In Figure 5, we show two networks (pre-VLCD and changes from pre-VLCD) built with the connectivity measures described in Eqs. (9) and (10). The directed arrows in the network indicate how a data source in the origin node impacts the median association with weight loss on the data source in the descendant node. In Figure 5b, when analyzing changes from pre-VLCD, all data sources have a clear impact on RT-PCR, meaning that gene expression interacts heavily with other data sources to predict weight loss rate. A self-loop in RT-PCR is also expected since the selected genes for amplification are supposed to be jointly associated with weight loss mechanisms. This dynamic differs from the one in Figure 5a, where bile acids and clinical data sources interact widely with RNA-seq.

Network analysis of biomarker interactions for weight loss rate. Network analyses at pre-VLCD and changes from pre-VLCD show how data sources interact when predicting the weight loss rate. Nodes represent individual data sources, and the line thickness represents the strength of the interaction.
Discussion
We propose a method for ranking and screening predictors of weight loss in a high-dimensional study with a small sample size. A multiomics pipeline performs the data integration, feature selection, and explores the interconnection between omics. The strategy relies heavily on the use of the first-order partial correlation coefficient between the outcome and predictors, adjusting for any potential confounder. Two metrics; Partial Association Score
We applied the method to omics data collected in a small cohort of obese females provided a VLCD. We investigated the results in prestudy, poststudy, and changes from prestudy to poststudy. We evaluated heterogeneity in omics data sources and Spearman's correlation with the weight loss rate. We also investigated, within each data source, the empirical distribution of the Partial Association Score. The higher the entropy in the distribution, more important is the data source (Supplementary Fig. S1).
Clinical data and metabolites are more relevant predictors of weight loss at baseline (prestudy). This fact is verified in Figure 3b, where almost 25% of the predictors are in the region of moderate-to-large univariate correlation. GSEA results in Figure 4b show significant overrepresentation of these data sources in the predictors' ranking. Primary acid metabolism and high-density lipoprotein (HDL) are highly ranked in prestudy data (Supplementary Table S3).
A closer look at the top predictors revealed changes from baseline in abundance of the genus Alistipes, member of the Bacteroidetes phylum as the most important predictor within fecal microbiota (Supplementary Table S5) and three genera at the top-ranked predictors at prestudy, Butyricicoccus, Defluvitalea and Eggerthella (Supplementary Table S3). The impact of Bacteroidetes on host metabolism was recently demonstrated in (Gutiérrez-Repiso et al, 2022). The role of baseline gut microbiota in weight loss prediction has been discussed in recent literature (Diener et al, 2021).
Among the 22 biomarkers selected for changes from baseline, five came from the RT-PCR data source (Supplementary Table S5). These markers include LDLR and AKT1, which are part of the lipoprotein response pathway. Association between lipoprotein and weight loss has been extensively reported in several studies (Falkenhain et al, 2021; Ge et al, 2020; Rosenkilde et al, 2018). The importance of changes from prestudy in RT-PCR gene expression is also evident in univariate correlation with weight loss (Fig. 3b).
Subsets of fecal bile acids show large within-subjects variability and moderate correlation with the rate of weight loss (Figs. 3). Unlike omics heavily skewed toward small values of the Partial Association Score, bile acids are overrepresented in the upper tail of
Conjugated bile acids are synthesized from cholesterol in the liver (Quarfordt and Greenfield, 1973), pass into the small intestine by contraction of the gall bladder during a meal, and are extensively reabsorbed in the ileum. Although only about 5% of bile acids escape small intestinal absorption, the bile acid pool circulates up to six times per day, permitting a significant mass of these contents to enter the colon. In the colon and, to some extent, in the small intestine, microbiota first deconjugate the conjugated bile acids and then further metabolizes these to form numerous metabolites. Several bile acids have been shown to stimulate the production of gut peptides that have important metabolic consequences (Vítek and Haluzík, 2016). Whether these could influence the rate of weight loss is presently unknown.
Conclusion
This study integrated data from multiple sources to increase understanding of weight loss biological processes. Because of the small sample size, we developed a strategy based on nonparametric ranking statistics, namely the first-order partial correlation coefficient. Data originated from 10 obese postmenopausal women provided a VLCD in a metabolic facility in New York, USA. The small sample size is a limitation, therefore, we carried out a nonparametric approach, which explored parsimonious monotonic regressions.
Major variations in weight loss and weight gain rates have been observed in previous studies (Bouchard, 2021; Stunkard, 1996). Hypotheses about the determinants of weight loss rates in individual subjects have focused on genetic factors, differences in metabolic rates, energy expenditure, microbiota composition, and metabolites. Some individuals have been shown to have a “thrifty” phenotype with lower weight loss rates during caloric restrictions than those with a “spendthrift” phenotype who lost more weight (Reinhardt et al, 2015).
Our study provided elements to examine the relative importance of several omics used as predictors of weight loss rate. The top-ranked predictors include allolithocholic acid, taurocholic acid, microbiota abundance in genera Alistipes, Butyricicoccus, Defluvitalea, and Eggerthella, primary bile acid, and purine metabolisms. We also highlight that our method placed high predictive importance on RT-PCR gene expression. Screened predictors such as LDLR, DGAT2, AKT1, and PI3KCA have been associated with weight loss mechanisms.
A striking point was an overrepresentation of fecal bile acids on ranked predictors from prestudy and for changes from prestudy. Bile acids in the gut are now recognized as potent signaling molecules for receptors that act on systemic lipid and carbohydrate metabolism (Molinaro et al, 2018).
It must be pointed out that our data were derived only from postmenopausal women and therefore is limited to this population. However, we know of no data that suggests a gender difference in the variability in the weight loss rate. Furthermore, we studied only 10 subjects permitting us to develop a hypothesis about the important role of gut bile acids in determining the rate of weight loss. We hope our results will stimulate further studies on the biologic role of gut bile acids on this process.
Footnotes
Acknowledgment
We thank the participants of the original clinical study and the coauthors of prior publications from this research program.
Authors' Contributions
J.C.d.R., J.O.A., J.L.B., and P.R.H. conceived the study. J.C.d.R. and J.M. performed the statistical design and analyses. J.O.A. executed the clinical transcriptomic and RT-PCR analyses, and Y.L. executed bioinformatic analyses. J.C.d.R., J.O.A., J.L.B., and P.R.H. wrote the article with input from all coauthors.
Availability of Data and Materials
Clinical Trial design is reported at NCT01699906. Deidentified transcriptomic data are available at GEO Accession Number GSE106289.
Author Disclosure Statement
The authors declare they have no conflicting financial interests.
Funding Information
This work was supported by the National Center for Advancing Translational Sciences (grant no. UL1 TR000043), the National Institutes of Health Clinical and Translational Science Award Program to Rockefeller University, and The Rockefeller University Center for Basic and Translational Research on Disorders of the Digestive System.

Abbreviations Used
References
Supplementary Material
Please find the following supplemental material available below.
For Open Access articles published under a Creative Commons License, all supplemental material carries the same license as the article it is associated with.
For non-Open Access articles published, all supplemental material carries a non-exclusive license, and permission requests for re-use of supplemental material or any part of supplemental material shall be sent directly to the copyright owner as specified in the copyright notice associated with the article.
