




Abstract
Multiomics data integration is one of the leading frontiers of complex disease research and integrative biology. The advances in single-cell sequencing technologies offer yet another crucial dimension in multiomics research. The single-cell studies enable the study and integration of multiomics data simultaneously in the same cell. We report in this study multiomics data integration in single-cell resolution using Bayesian networks (BNs) in a case study of hepatocellular carcinoma (HCC). A BN encodes the conditional dependencies/independencies of variables using a graphical model with an accompanying joint probability. RNA-seq and Reduced Representation Bisulfite Sequencing data were analyzed separately, and copy number variations were estimated by the hidden Markov model method. Several BN models were constructed to reveal omics' causal and associational relationships. These methods were subjected to a validation study using an independent data set. We show the heterogeneity of the multiple cellular layers of HCC at single-cell omics resolution by identifying best-fitted BN models of 295 genes. We also provide novel insights into the multiomics mechanistic relationships in the human lymphocyte antigen class I genes in HCC. To the best of our knowledge, this is the first study to focus on integrating omics data using a machine learning algorithm, BNs, at the single-cell resolution using a case study of HCC.
Introduction
Understanding the complex human diseases demands unpacking their biology at different molecular levels. Multiomics integration studies can offer the advantage of deeper insights on the mechanisms of heterogeneity in complex diseases compared to single omics analysis (Hasin et al, 2017; Lin et al, 2022; Yan et al, 2018). Therefore, multiomics approach is essential to evaluate and decipher the pathological mechanisms in cancer research.
Cancer has many characteristics that can be studied through, including, but not limited to copy number variations (CNVs), gene expression dysregulation, and epigenetic aberration (Esteller, 2007; Hanahan and Weinberg, 2011). Many studies have shown that these characteristics play a major role in the tumoral biological processes such as cellular differentiation, migration, proliferation, and metastasis (Colagrande et al, 2016; Hanahan and Weinberg, 2011; Marrero et al, 2010). Previous studies focused on these features, mainly in bulk (Chen et al, 2021; Chen et al, 2020; Shen et al, 2021; Woo et al, 2017).
On the other hand, single-cell studies are preferred due to the heterogeneity between cells, and it is easier to discover mechanisms that are not seen when examining large numbers of cells (Dohmen et al, 2022; Liu et al, 2022; Song et al, 2022). Single-cell studies started to focus on other types of omics like genomic variation and epigenomics, besides transcriptomics (Heo et al, 2022; Ono et al, 2021; Song et al, 2022; Velazquez-Villarreal et al, 2020). At the same time, studying these omics individually makes it challenging to discover biomarkers for complex diseases like cancer. To elucidate this complex biological process, analysis of various omics-es together has only started in recent years (Chen et al, 2021; Gutierrez-Arcelus et al, 2013; Ono et al, 2021).
Since omics data are complex, integration at the level and scale of multiomics is quite challenging (Huang et al, 2017). Thus, many theoretical methods and novel algorithms were developed for multiomics data integration, including clustering (Dongfang Wang, 2016; Kiselev et al, 2017; Tini et al, 2019), feature selection (El-Manzalawy et al, 2018; Townes et al, 2019), cell type recognition (Cadwell et al, 2017; Xu and Su, 2015), the dissecting gene regulation networks (Petralia et al, 2015; Tong et al, 2022; Zarayeneh et al, 2017), and partial least square regression models (Drouard et al, 2022).
This study proposes Bayesian networks (BNs) as a multiomics integration method. BNs are graphical probabilistic models that represent the joint probability distribution in a factorized way (Neuberg, 2003; Pearl, 2000). BNs are directed acyclic graph (DAG) composed of nodes and edges where nodes represent variables and edges represent the direct dependency relationship between these variables (Pearl, 2000; Puga et al, 2005). DAGs encode a set of conditional independence assumptions between the variables (Neuberg, 2003; Pearl, 2000). The joint probability is decomposed as a product of local probabilities where the local probability of each variable is described by its conditional dependencies on its neighbors. The local probability distribution can take any form, but a multinomial distribution is usually used for discrete variables. The graphical structure of a BN can be learned from data by either inferring the most likely DAG or discovering the conditional dependencies in the data (Pearl, 2000).
Further to their simple and explainable graphical structures, BNs can be understood without deep mathematical knowledge. Besides, they have shown a good performance with small sample sizes (Pollino and Henderson, 2010). All these features make BNs a preferable machine learning model to be used with molecular data. It was first used in genetics when causation between plasma apoE levels and APOE gene single nucleotide polymorphisms (SNPs) was analyzed (Rodin and Boerwinkle, 2005). Also, one study used BNs to find the causal relationship between significant expression Quantitative Trait Loci, methylation Quantitative Trait Loci, and expression Quantitative Trait Methylation from different cell types at the bulk level (Gutierrez-Arcelus et al, 2013). Another study suggests that BNs can complement conventional Mendelian randomization using actual genome and simulation data (Howey et al, 2020). However, these studies did not focus on disease complexity, and the primary purpose was not the multiomics integration.
This study proposes a novel approach to using BNs for single-cell multiomics integration. For this aspect, a dataset from a published study of 25 hepatocellular carcinoma (HCC) single-cell sequencing data is retrieved (Hou et al, 2016). Gene expression quantifications, DNA methylation levels, and estimated CNVs were used for building three alternative BN models. Our results show the heterogeneity of these omics in cancer cells and highlight the molecular mechanisms that change from gene to gene. We dissect this heterogeneity by showing that different genes in the same pathway can follow different BN models. Our results reveal a picture of causality between omics of human lymphocyte antigen (HLA) class I genes HLA-A, HLA-B, and HLA-C in HCC.
Materials and Methods
Data source and workflow
A dataset of 25 HCC single-cell sequencing (Hou et al, 2016) was acquired from NCBI Gene Expression Omnibus under the accession number (GSE65364) using SRA Toolkit. The dataset consists of single-cell RNA-seq and single-cell reduced representation bisulfite sequencing (RRBS) reads for each sample. First, we analyzed each omic data of these cells on their own. Then, we constructed three alternative BN models of three-way association involving CNV states, gene expression quantifications, and DNA methylation levels. For model comparison, Akaike information criterion (AIC) and Bayesian information criterion (BIC) were used to choose the best model for each gene. Genes with verified BN model were further investigated using cBioportal platform (Fig. 1).

The research workflow. A flow chart illustrating the steps of the study. Starting with analyzing each omic by its own. Then, estimating CNVs from methylome data. After that, constructing three alternative BN models depending on the data from the three omics. These models were applied to all protein-coding genes and choosing the best model for each gene according to AIC and BIC scores. cBioportal platform was used for enrichment with validated BN models. AIC, Akaike information criterion; BIC, Bayesian information criterion; BN, Bayesian network; CNV, copy number variation.
Sequencing data pre-processing
The quality of raw sequencing data was checked using FastQC (Andrews, 2015). Then, low-quality reads (<20 phred score) and adaptor contaminations were trimmed. For RNA-seq data, Trimmomatic was used with PE SLIDINGWINDOW:5:20 ILLUMINACLIP:NEBNEXT-PE:2:30:10 LEADING:20 options (Bolger et al, 2014). For RRBS data, Trim-Galore with rrbs and paired options was used (Krueger et al, 2021).
Gene expression quantifications
Filtered RNA sequencing reads were aligned to the human reference genome (hg19) UCSC release using Tophat, and gene expression quantification was done using Cufflinks pipeline with default parameters (Trapnell et al, 2012). We only measured the gene expression level of protein-coding genes by using the Refseq gene list (20,203 genes) (Pruitt et al, 2012). Cufflinks pipeline reported gene expression levels in fragments per kilobase million (FPKM). FPKM values were then categorized into three categories: (0.2–10) low, (10–1000) moderate, and (>1000) high for downstream analysis.
Calculation of DNA methylation level
Filtered RRBS reads were aligned to the human reference genome (hg 19) UCSC release C-T (G-A), and cytosine methylation base calling was done by using Bismark with default parameters (Krueger and Andrews, 2011). The methylation level of each base was calculated using beta values, β = M/(M + U), where M and U denote the methylated and unmethylated signal intensities in each detected CpG site (Bibikova et al, 2009). We included only CpG sites with ≥3 of read depth in the downstream analysis (Hou et al, 2016). The methylation level of each gene was calculated by taking the mean of beta values from transcription start site to transcription end site of the corresponding gene. Methylation levels were then categorized into (<0.2) hypomethylated, (0.2–0.8) neutral, and (>0.8) hypermethylated to be used for downstream analysis.
CNV estimation from RRBS data
The CNV was estimated using HMMcopy R package at resolution of 500 kb (Lai et al, 2022). HMMcopy calculates the following: the read counts from the aligned reads (BAM), the GC content of the reference genome, and the mappability of the reference sequence to the aligner. Then, HMMcopy corrects GC content and mappability scores by eliminating the outlier bins and the bins with zero reads or zero GC content. Thereafter, it performs Hidden Markov Model on the normalized scores to predict the biological copy number in each segment. Finally, HMMcopy generates a table containing genomic segment, CNV state, and mean copy number. The CNV states are scores from 1 to 6: (1) homozygous deletion, (2) heterozygous deletion, (3) neutral, (4) increased copy number, (5) heterozygous duplication, and (6) homozygous duplication. The states values were used in the downstream analysis.
Causal BN analysis
FPKM scores, beta values, and CNV states of each gene through all samples were combined as a matrix to be used to construct BN models. In other words, we constructed a matrix for each gene composed of the three omics data from all samples. As the BN models cannot deal with constant features, we only selected the genes with a variance in all omics. We constructed three alternative BN models to explore the causal relationship between omics. “CEM” model assumes a serial connection when CNV affects gene expression, and gene expression affects DNA methylation (Fig. 2A). “CME” model assumes that CNV affects DNA methylation, and DNA methylation affects gene expression in a serial connection (Fig. 2B). “INDEP” model assumes that CNV affects DNA methylation and gene expression independently in a diverging connection (Fig. 2C).
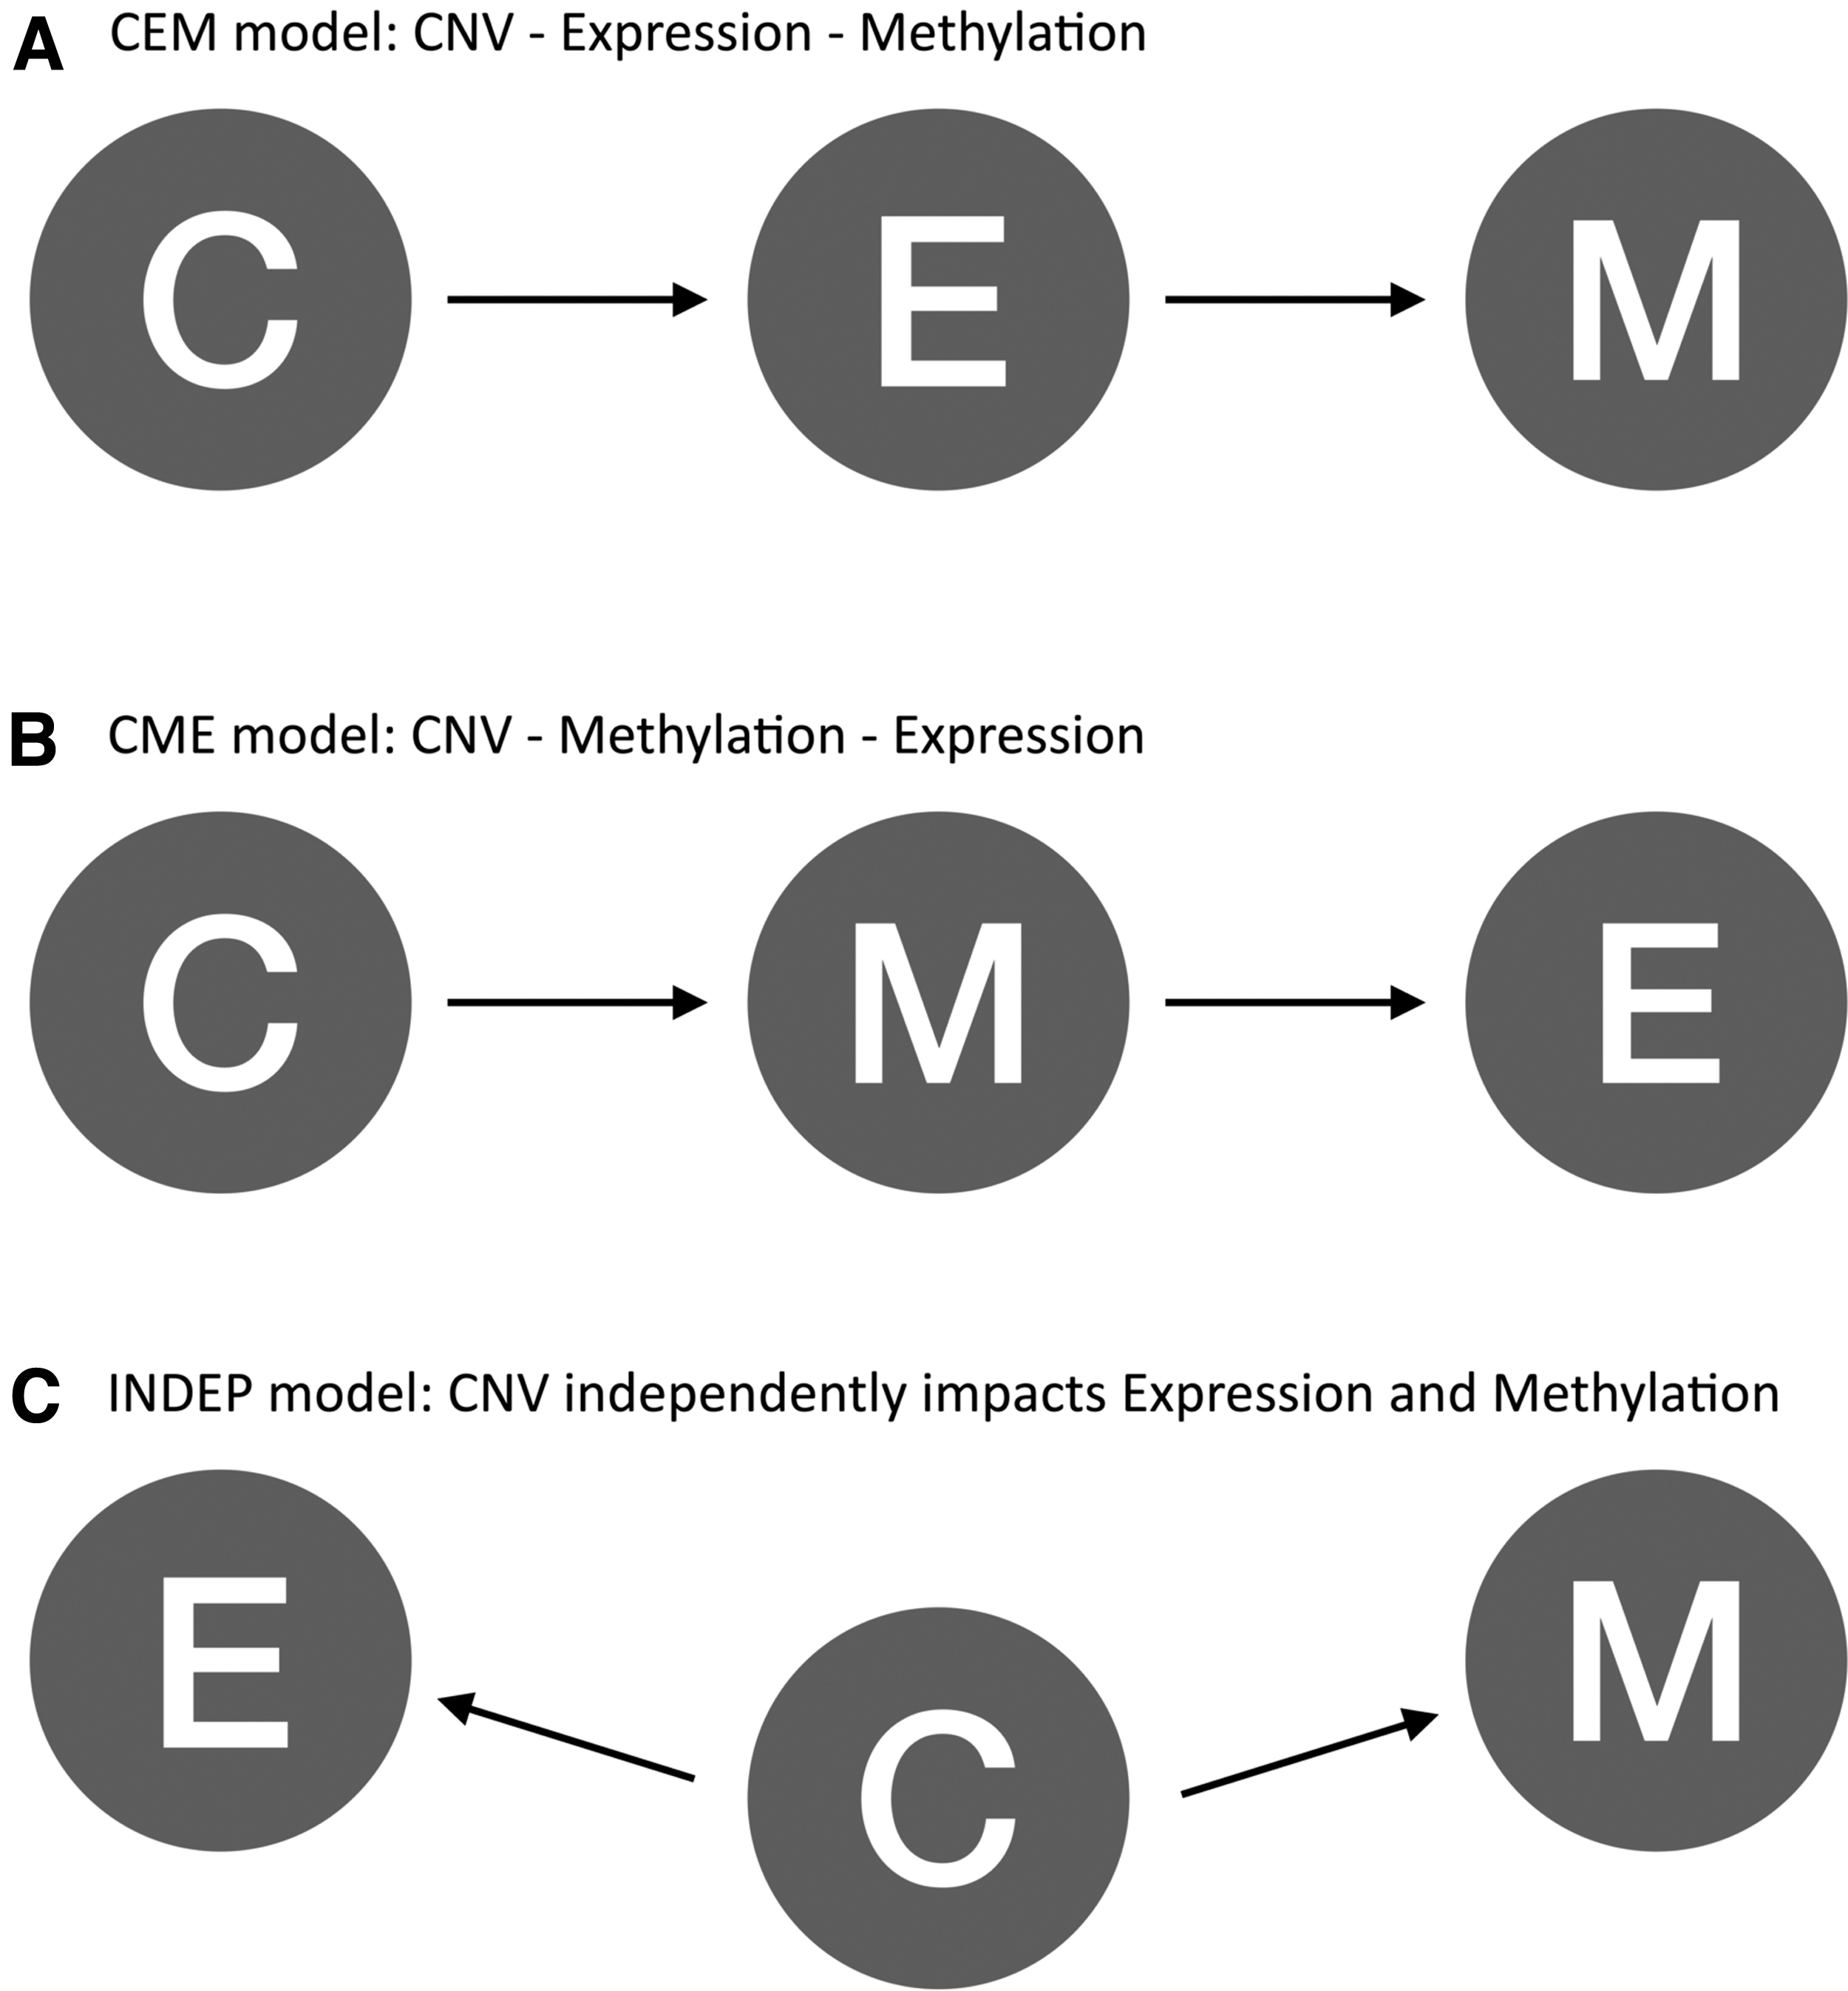
The three alternative BN models in the study.
BNlearn R package was used for constructing, fitting, and comparing BN models (Scutari, 2010). The parameters of models were fitted using maximum likelihood estimation (MLE). Up to this step, each gene had three models. We compared the three models using AIC and BIC scores to choose the best BN model for each gene. Using AIC score, we defined the genes to have a best-fitted model if only the best model is at least 10 times more likely to be than the second best model. This resulted in only 23 genes to have a best-fitted model.
On the other hand, using BIC scores, we defined the genes with a best-fitted model by its strength of evidence. The evidence strength adjusted according to the BIC difference (ΔBIC) between the best and second best model: 0–2: indicates weak evidence, 2–6: positive evidence, 6–10: strong evidence, and >10: very strong evidence (Lorah and Womack, 2019). We considered only the genes with positive evidence or higher (ΔBIC >2). This resulted in 295 genes.
Functional analysis
After defining the genes with best BN model, R package clusterProfiler (Yu et al, 2012) for gene ontology (GO) enrichment analysis was conducted. Then, we further investigate whether these genes have been reported in any HCC study before (Cerami et al, 2012). To explore these genes and their role in HCC, we used cBioportal platform, one of the most comprehensive platforms that includes different databases of cancer studies.
Validation
This method was subjected to a validation study using an independent set of HCC data archived in NCBI database (PRJNA762641). The data consists of 33 samples of bulk RNA-seq and whole genome bisulfite sequencing (WGBS) (Huang et al, 2021). Of the 33 samples, we chose 10 males with the most similar age to our primary HCC single-cell data.
Results
Omics data analysis
From RNA sequencing data, the gene expression values of 5851 genes were calculated (Supplementary Table S1). From RRBS data, DNA methylation of 13,165 genes were calculated (Supplementary Table S2). Sample 16 had the highest detected genes with 15,818 genes, while sample 17 had the least detected genes with 8226 genes. Sample 17 was discarded in the following analysis because of the low number of detected genes, which could affect the number of mutual genes in the downstream analysis (Supplementary Table S2). For CNV estimation, we used the state scores from the output of HMM. The states ranged from 1 to 6 and the meaning of each score is as follows: (1) homozygous deletion, (2) heterozygous deletion, (3) neutral, (4) increased copy number, (5) heterozygous duplication, and (6) homozygous duplication.
Across all samples, an amplification in chromosome 7 and q arm of chromosome 1 and a deletion in chromosome 8 were detected. All these CNVs were previously reported in different studies (Supplementary Fig. S1) (Guan et al, 2000; Xu et al, 2015; Zhou et al, 2017).
Global view of the modeling and causality analysis
BNs can be constructed in either way: after defining the variables (nodes), the relationship (nodes) between these variables can be learned from the data using constraint-based or score-based methods; or they can be built by defining the nodes and the direction of edges between the variables manually (DAGs) and then checking the viability of how much the DAG represents the data. In this study, we created three alternative models by manually defining each model's nodes and edges. As BN models show the causal relationship between the different variables, we thought neither DNA methylation nor transcriptomics could cause the variation in the genomic copy numbers. Thus, we defined the models in a way to be biologically logical by putting CNV as the first (starting) node in all models.
The three alternative models are as follows: “CEM” model represents a serial connection among CNV-gene expression-DNA methylation (Fig. 2A). “CME” model represents a serial connection among CNV-DNA methylation-gene expression (Fig. 2B). “INDEP” model independently represents a diverging connection between CNV-DNA methylation and CNV-gene expression (Fig. 2C).
The 3 alternative BN models were constructed and applied to 1900 protein-coding genes only. After fitting the models using MLE, we evaluated our models by two score-based criteria: AIC and BIC. Depending on AIC, we used the relative likelihood to compare the goodness of fit of a BN model with the lowest AIC to the second lowest model. Then, we chose the genes whose best model has ≥10 relative likelihood than the second-best model. Depending on BIC, we took the difference (ΔBIC) between the models with the lowest and second lowest BIC scores. The strength of the model was examined as mentioned in Materials and Methods section.
According to AIC scores, we detected 23 genes to follow different BN models: 17 CME, 5 CEM, and 1 INDEP (Table 1), whereas we detected 295 genes to follow different BN models: 199 CME, 62 CEM, and 34 INDEP, according to BIC scores (Supplementary Table S3).
Akaike Information Criterion Scores for the Genes (23 Genes) That Have Best Fitted to a Bayesian Network Model with Relative Likelihood ≥10 to the Second Best Model
Bold values are the best fitted BN models for each significant gene.
CEM, CNV-Expression-Methylation Model; CME, CNV-Methylation-Expression Model; INDEP, Independent Model.
For further analysis, we split the genes into two groups: Group 1 contains the genes that have best fitted to BN models according to AIC scores with relative likelihood ≥10 (23 genes), and group 2 includes the genes with a valid model according to BIC score (295 genes). cBioportal results reported that all significant genes in group 1 and 2 had been presented at least once in HCC studies (Supplementary cBioportal links). Furthermore, for group 2 genes, cBioPortal showed that the genes are previously reported, which matched significant signaling pathways in HCC (Table 3). The matched genes are ARRDC1 (CEM/ΔBIC = 2.497) to NOTCH pathway, AXIN2 (INDEP/ΔBIC = 2.381) and TLE2 (CME/ΔBIC = 2.401) to WNT pathway, MGA (CME/ΔBIC = 2.417) MYC (INDEP/ΔBIC = 3.648) to MYC pathway, and MAP2K1 (CME/ΔBIC = 2.316) to RTK-RAS signaling pathway (Supplementary Figs. S2, S3, S4 and S5).
Comparing the genes in each BN model, we observed that the DNA methylation rate in the gene body is higher for the genes in the INDEP model. Still, the methylation rate in the promoter region is the same in all models (Fig. 3A). Furthermore, the mean gene expression in each model differs from the others (Fig. 3B). Genes of each model were found to be located in regions with moderate CNV states: 2—heterozygous deletion, 3—neutral, and 4—increase copy number (Fig. 3C). Most of these genes are located on chromosomes 1, 12, 16, 19, and 20, whereas the results showed no gene from chromosomes 11, 14, 18, and X (Fig. 3D).
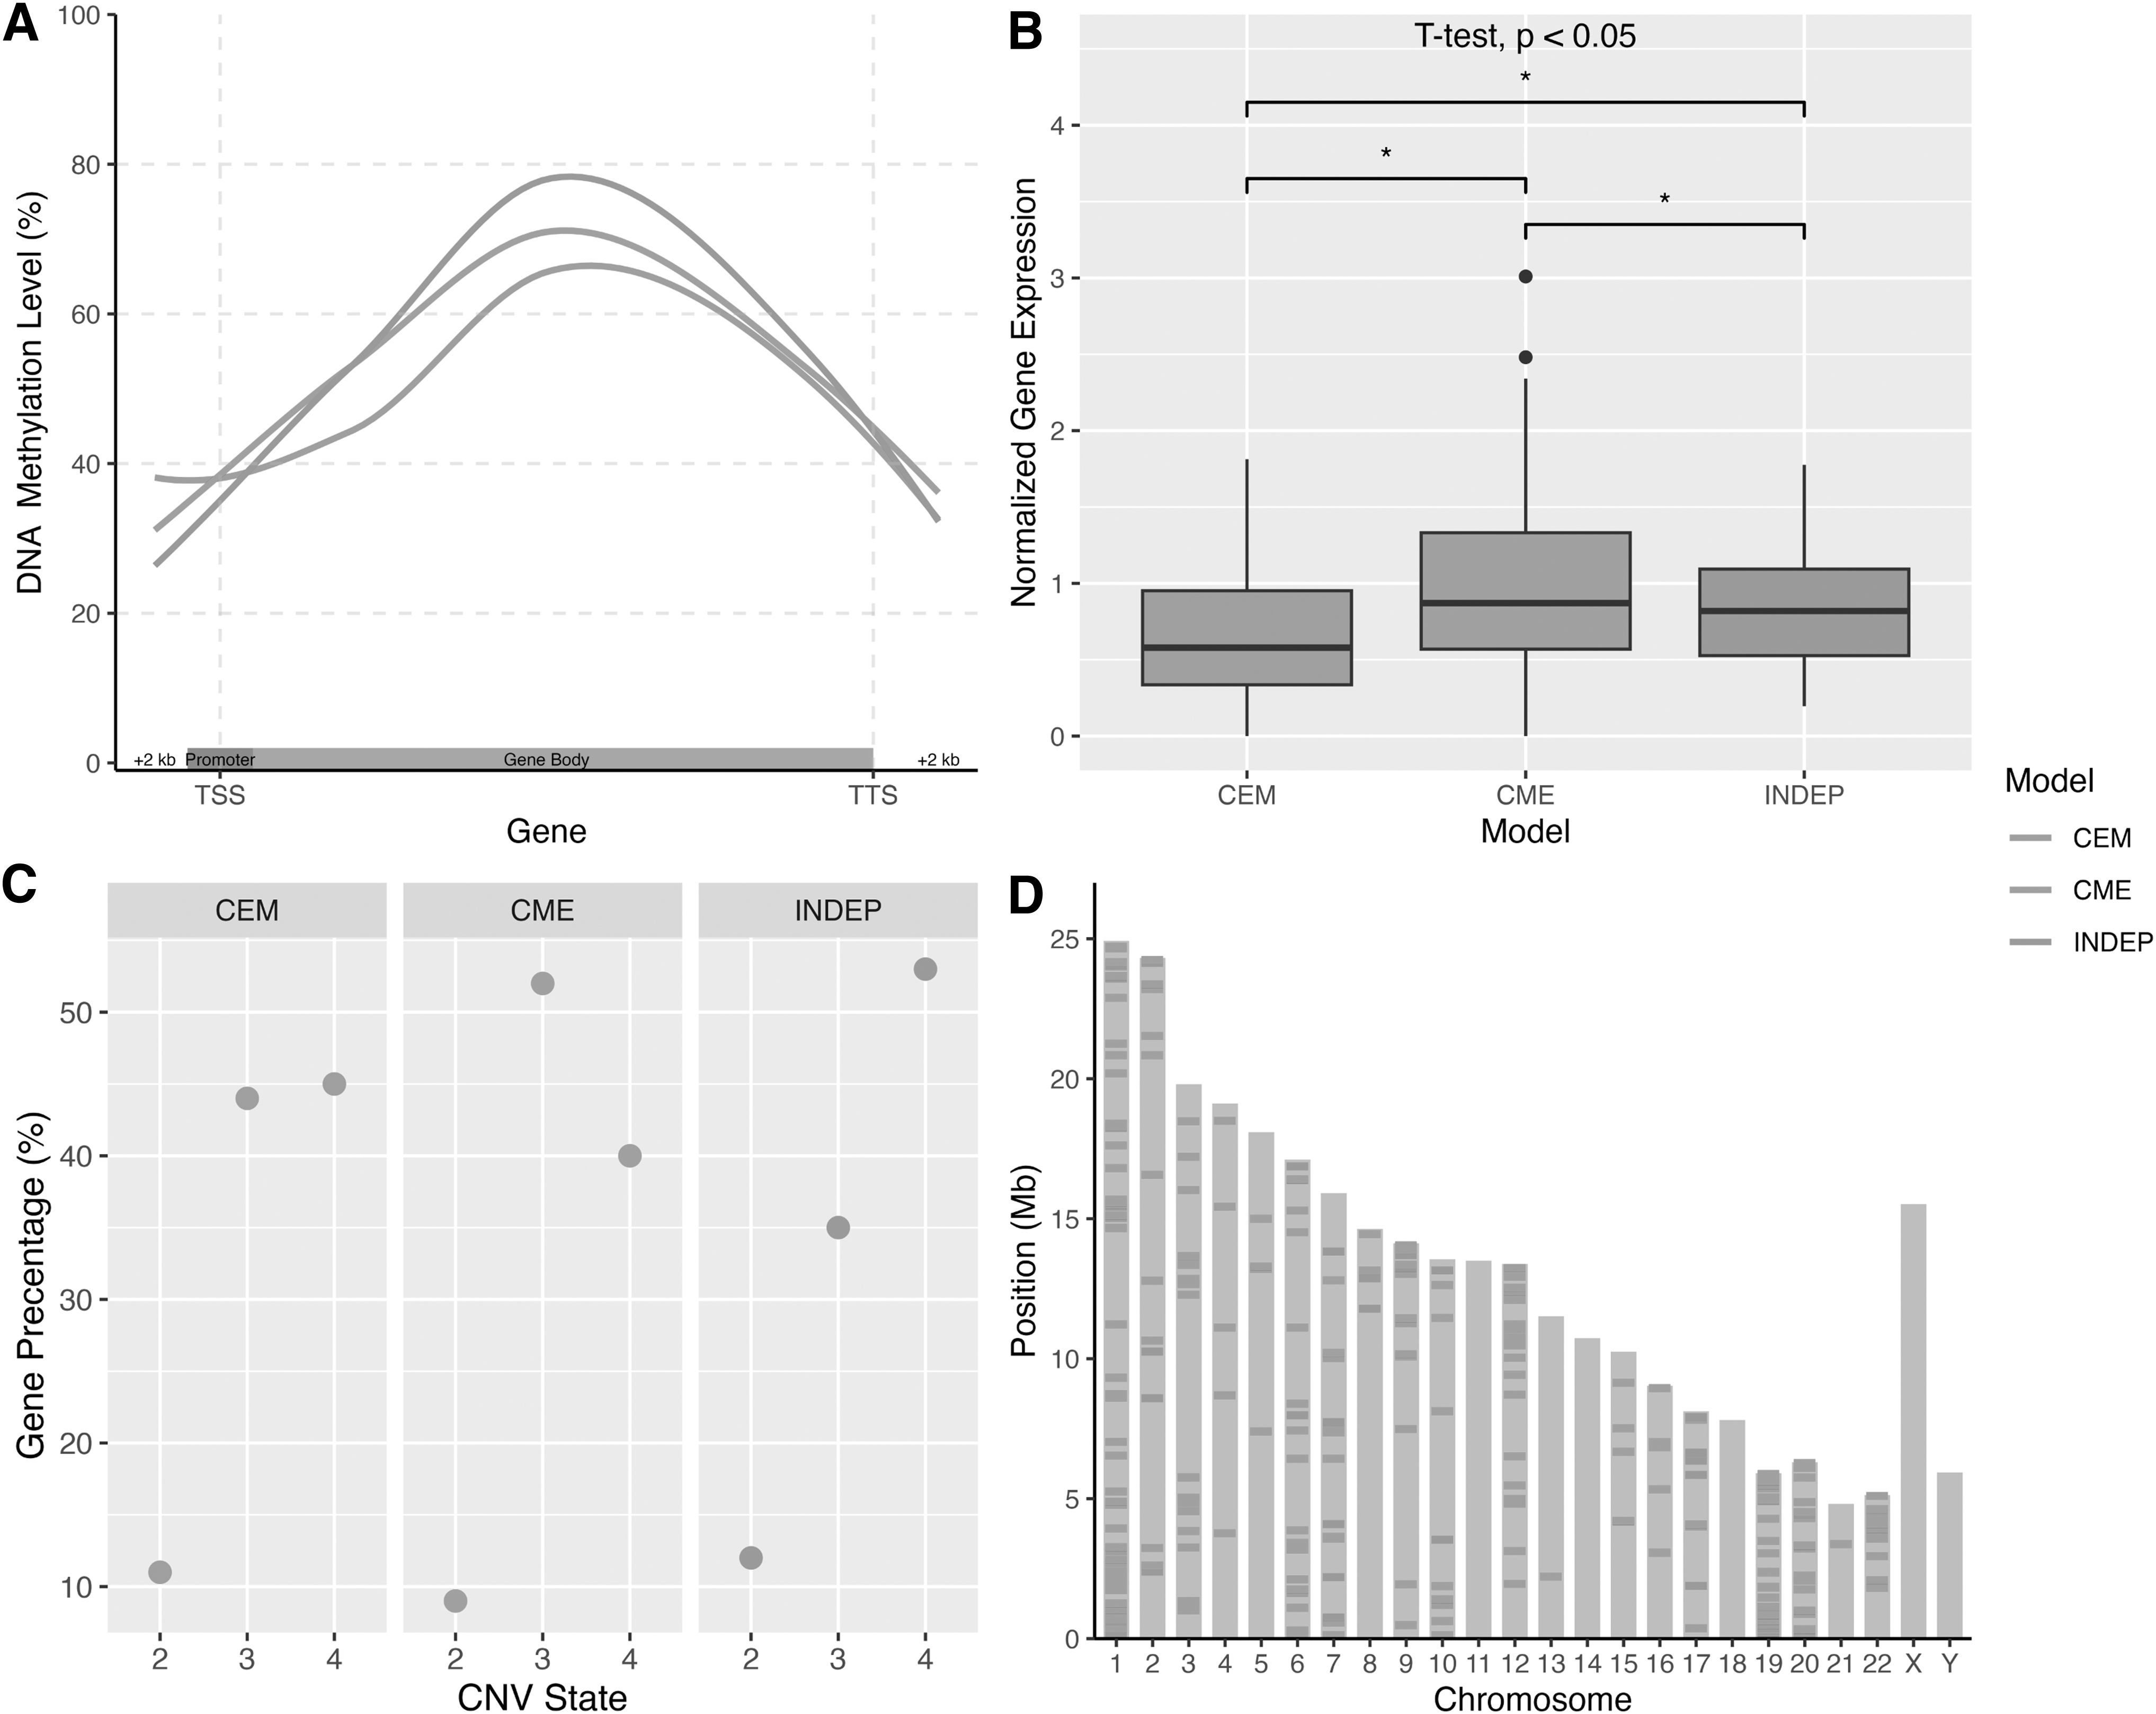
Genomic, epigenomic, and transcriptomic profile of genes in each model.
On the other hand, functional enrichment analysis showed that CME model genes were enriched in several GO terms, such as intrinsic and integral components of organelle membrane (p = 0.0211), regulation of protein catabolic process and vesicle fusions (p = 0.0158); CEM model genes were enriched in molecular adaptor activity (p = 0.0301), RNA polymerase complex and core enzyme binding (p = 0.0149); and INDEP model genes were enriched in sister chromatid adhesion and segregation (p = 0.0283) (Fig. 4). The dysfunction of sister chromatid segregation was shown to have a significant role in promoting the progression of HCC (Sun et al, 2018).

Bar plot of GO enrichment analysis of genes in each model.
Validation of the BN model
The data that we have used in the primary analysis generated by “scTrio-seq” method could simultaneously detect the transcriptome and DNA methylome of the same cell. Finding other data generated by the same method was challenging. Thus, we validated our analysis using another type of dataset. We used a dataset of bulk RNA-seq and WGBS for HCC patients. After following the same analysis, we could construct the same BN models for only 42 genes. From these, 20 of them (48%) follow the same model as ours, including the HLA-A gene with model CME (Supplementary Table S4). Due to the overlap of different platforms (bulk and single cell) and the differences between RRBS and WGBS data, the validated data analysis did not reveal the exact information to compute the models for all genes. Still, we detected a clear tendency toward some models.
Discussion
Multiomics data integration is one of the leading frontiers of complex disease research and integrative biology. Defining CNV, DNA methylation, and gene expression relationships in cancer cells can help improve the knowledge of how these different molecular layers contribute to the heterogeneity of this disease, which in turn can improve our understanding of the etiology of cancer (Kong et al, 2020). In this study, we use BNs as a multiomics machine learning method to explore the causal relationship between CNV, gene expression, and DNA methylation in HCC at the single-cell level.
We constructed three alternative BN models, assuming the genomic component (CNV) is driving the association with gene expression and DNA methylation. The relationship between gene expression and DNA methylation can be in either direction. The results showed that the CME model, in which CNV affects DNA methylation and DNA methylation in turn affects gene expression, is the most abundant model (best model for 199 genes), followed by CEM (CNV- model), in which CNV affects gene expression, and gene expression in turn affects DNA methylation (best model for 62 genes), and finally, the INDEP model, where CNV affects DNA methylation and gene expression independently (best model for 34 genes).
Gutierrez-Arcelus et al (2013) and Díez-Villanueva et al (2021) have used similar BN models to ours, but differ in using SNP instead of CNV as a genomic component of the models. Gutierrez-Arcelus et al (2013) also assumed that these BN models show the passive and active role of methylation on gene expression. Following their assumptions, we can say that CME model shows the active rol,e while CEM and INDEP models show the passive role of DNA methylation. Our results show that most genes' expressions are under the active impact of DNA methylation in HCC cells.
GO enrichment analysis showed that each model's genes had been enriched in different GO terms. GO terms that enriched for CME model genes were related to vesicle fusion, cristae formation, and component organelle membrane. For the CEM model, GO terms were related to a molecular activity that accompanies binding, bridging, and complex scaffold activity. For the INDEP model, GO terms were related to sister chromatid adhesion in the meiotic and meiosis cell cycle. GO enrichment analysis revealed that the genes of each model have a function in related GO terms that differ from other models. In turn, that can help us confer the molecular function of a gene from the BN model that it follows.
In addition, tumor cell heterogeneity influences cancer progression, metastasis, and mortality rates (Fidler, 2016; Lawson et al, 2018). Integrating these three omics has shown that different genes can follow different BN models in the same pathway, proving the heterogeneity. HCC is a highly metastatic type of cancer that is difficult to diagnose early and has high mortality rates (Liu et al, 2016; Waly Raphael et al, 2012). We have detected specific genes that have been matched to pathways that have significant roles in tumorigenesis, survival, and tumor progression, such as NOTCH, RTK-RAS signaling pathways (Supplementary Figs. S4 and S5) (Huang et al, 2019; Moon and Ro, 2021; Strazzabosco and Fabris, 2012; Yang and Liu, 2017).
NOTCH signaling pathway, one of the conserved pathways in mammals, is responsible for promoting proliferative signaling during neurogenesis and cell fate determination (Zhang et al, 2017; Zhu et al, 2021). NOTCH signaling pathway, despite its unclear effect, is found to be dysregulated in HCC (Huang et al, 2019; Strazzabosco and Fabris, 2012; Villanueva et al, 2012).
Moreover, different genes with different BN models AXIN2 (INDEP) and TLE2 (CME) have been matched in WNT signaling pathway (Supplementary Fig. S2). WNT signaling pathway controls multiple cellular processes that lead to the development, survival, differentiation, and metastasis of HCC (He and Tang, 2020; Liu et al, 2016; Shanbhogue et al, 2011). Also, MGA (CME/ΔBIC = 2.417) and MYC (INDEP/ΔBIC = 3.648) were matched to MYC pathway (Supplementary Fig. S3). MYC pathways, which regulate many cellular processes such as proliferation, differentiation, and apoptosis, have been related to the pathogenicity of HCC (Frau et al, 2010; Lin et al, 2010; Zimonjic and Popescu, 2012). As a result, these different genes with different BN models show how these different omics act on each other and how this effect is heterogenous in cancer cells by affecting major signaling pathways in HCC.
Most importantly, HLA class I genes have been shown to have the same BN models according to BIC score: HLA-A (ΔBIC = 2.357), HLA-B (ΔBIC = 7.943), and HLA-C (ΔBIC = 5.064) (Supplementary Table S1). HLA class I, which occurs on tumor cells' surfaces, is critically recognized by cytotoxic T lymphocytes. Investigating HLA class I helps to predict the danger of prognosing or developing cancer (Kaufman et al, 1995; Mizuki et al, 1997; Speetjens et al, 2008). Studies about HLA class I expression in cancer had contradictory conclusions. Some reported it with a bad prognosis, while others said it with worse or no association with cancer prognosis (Hanagiri et al, 2013; Kaneko et al, 2011; Madjd et al, 2005; Ramnath et al, 2006).
Our results offer a new perspective on how HLA class I might act in HCC by integrating different omics. The proposed BN method has the potential to provide a deeper understanding of heterogeneity in complex diseases as it reveals other connections for each scenario. The BN method we adopted for single-cell sequencing data did not overlap with some results from bulk validation data, but found some exciting hits such as HLA-A following the CME model. The sequencing technology differences between the primary and validation datasets might be why WGBS is used for methylome data. At the same time, we have RRBS data in the primary dataset.
To the best of our knowledge, this is the first study to focus on integrating omics using a machine learning algorithm, BNs, at the single-cell resolution, using a case study of HCC. With these findings that promise multiomics single-cell data integration, the BN approach could be one of the standard single-cell multiomics integration approaches in the future.
Limitations
We used single-cell data generated by one of the first technologies in single-cell sequencing. Our decision to use these data was to apply BN models on multiomics belonging to the same single cell and use this dataset accompanied by many limitations, such as the low quality of the data of some cells. Besides, it was difficult to validate it with another dataset because of lacking similar datasets generated in the same way. Similarly, our analysis was limited to protein-coding genes, observing DNA methylation in promoter and gene body regions and ignoring regulation regions such as enhancers. However, we showed promising results that make BN models eligible and can be used for integrating omics.
Footnotes
Acknowledgments
The computational calculations reported in this article were partially performed at TUBITAK ULAKBIM, High Performance and Grid Computing Centre (TRUBA resources). This work is not published previously, except for the master thesis of the first author (M.J.) completed at the Department of Bioinformatics, Hacettepe University, Turkey.
Code Availability

Authors' Contributions
I.Y. conducted this study and supervised this work. M.J. performed the analyses. All authors read and approved the final version of the article.
Author Disclosure Statement
The authors declare they have no conflicting financial interests.
Funding Information
This study has been funded by L'Oréal-UNESCO “For Women in Science,” national award received by Dr. İdil Yet in 2020.
Abbreviations Used
References
Supplementary Material
Please find the following supplemental material available below.
For Open Access articles published under a Creative Commons License, all supplemental material carries the same license as the article it is associated with.
For non-Open Access articles published, all supplemental material carries a non-exclusive license, and permission requests for re-use of supplemental material or any part of supplemental material shall be sent directly to the copyright owner as specified in the copyright notice associated with the article.
