




Abstract
Breast cancer (BC) is the second-most common type and among the leading causes of worldwide cancer-related deaths. There is marked person-to-person variability in susceptibility to, and phenotypic expression and prognosis of BC, a predicament that calls for personalized medicine and individually tailored therapeutics. In this study, we report new observations on prognostic hub genes and key pathways involved in BC. We used the data set GSE109169, comprising 25 pairs of BC and adjacent normal tissues. Using a high-throughput transcriptomic approach, we selected data on 293 differentially expressed genes to establish a weighted gene coexpression network. We identified three age-linked modules where the light-gray module strongly correlated with BC. Based on the gene significance and module membership features, peptidase inhibitor 15 (PI15) and KRT5 were identified as our hub genes from the light-gray module. These genes were further verified at transcriptional and translational levels across 25 pairs of BC and adjacent normal tissues. Their promoter methylation profiles were assessed based on various clinical parameters. In addition, these hub genes were used for Kaplan–Meier survival analysis, and their correlation with tumor-infiltrating immune cells was investigated. We found that PI15 and KRT5 may be potential biomarkers and potential drug targets. These findings call for future research in a larger sample size, which could inform diagnosis and clinical management of BC, thus paving the way toward personalized medicine.
Introduction
Breast cancer (BC) is a major planetary health burden. It is the second-most common type and among the leading causes of worldwide cancer-related deaths. Personalized/precision medicine is an approach to achieve individually tailored diagnostics and therapeutics in BC that consider person-to-person and population differences in tumor and host biology, host–environment interactions, and the varied societal, societal, and political dimensions in which clinical practice is situated. Personalized medicine is also essential for early diagnosis, which plays a vital role in BC optimal clinical care (Weigel and Dowsett, 2010).
Potential biomarkers and biomarker candidates have been identified in the context of personalized medicine and rational therapeutics over the past several decades (Ahmed, 2022; Lopes-Júnior and Veronez, 2023). The availability of multiomics technologies, data integration, and analyses opened up new avenues to innovation in personalized medicine for BC. The public availability of large-scale omics data is another notable advance in the field of personalized medicine for cancers.
In this study, we report new findings on prognostic hub genes and key pathways involved in BC. We used a weighted gene coexpression network (WGCN) construction followed by trait-linked hub module/gene detection. Our hub genes reported here, peptidase inhibitor 15 (PI15) and KRT5, were further validated via UALCAN and cBioPortal. The prognostic assessment of our hub genes was also performed, followed by tumor infiltration analysis and immunohistochemistry (IHC) validation using the Human Protein Atlas (HPA).
Materials and Methods
Data access and differential expression analysis
The present study used publicly available data using a bioinformatic approach. The research was conducted under the overall research ethics oversight of the authors' institution. We queried the National Center for Biotechnology Information (NCBI)-Gene Expression Omnibus (GEO) (Clough and Barrett, 2016) (https://www.ncbi.nlm.nih.gov/geo/) utilizing “Breast Cancer” as a suitable keyword for extracting BC-related mRNA expression profile.
All search results were trimmed down as per the following inclusion criteria: (1) the data set(s) must be “expression profiling by array” type with their samples belonging to “Homo Sapiens”; (2) raw and preprocessed files of the data set(s) must be available; (3) the submission date of data set(s) must be within the last 10 years (i.e., 2012–2022); (4) the data set(s) must comprise paired samples (i.e., tumor and adjacent normal tissues); and (5) the data set(s) must comprise more than 25 samples.
We excluded studies lacking controls (healthy) or nonhuman samples, abstracts, case reports, cell-line-based experimental study designs, and review-based articles. Sequential steps of batch correction, probe to gene mapping, duplicate gene removal, and official gene name cross-checking were performed as discussed previously (Gupta et al., 2022). The differentially expressed genes (DEGs) were screened corresponding to a Benjamini–Hochberg (BH)– p-value <0.05 and |log2 (fold change)| > 1.5 utilizing the limma R package (Ritchie et al., 2015).
Construction of WGCN and hub module/gene(s) selection
WGCN formation and module(s) selection were performed as discussed previously (Gupta et al., 2022; Jha et al., 2022). Module eigengene (ME) and ME dissimilarity were calculated. Correlation-based absolute module significance [gene significance (GS)] values were computed with the age of patient samples and module membership (MM) for every module. Correlations of MM versus GS and GS versus intramodular connectivity (k.in) were computed to identify hub module(s). The genes from our hub module having MM >0.8 and GS >0.2 were regarded as hub genes.
Validation of hub genes via cBioPortal and UALCAN
We queried the cBioPortal for Cancer Genomics (Cerami et al., 2012) (https://www.cbioportal.org/) for exploring the genomic alteration frequencies in our BC-specific hub genes. The breast adenocarcinoma (BRCA) data set (METABRIC, Nature 2012 & Nat Commun 2016) was chosen for our analysis. Lastly, the promoter methylation profile of BC-specific hub genes based on clinical parameters such as sample type, nodal metastasis status, and TP53 mutation status was presented utilizing the UALCAN web server (Chandrashekar et al., 2017) (http://ualcan.path.uab.edu/).
Kaplan–Meier survival analysis of hub genes
The Kaplan–Meier (KM) plots of hub genes showing their overall survival (OS) and relapse-free survival (RFS) across the microarray BC cohort were presented using a KM plotter (Lánczky and Győrffy, 2021) (https://kmplot.com/analysis/). Microarray BC patients were dichotomized into higher and lower expression groups based on the “autoselect the best cutoff” option. The redundant samples were removed in the quality control section, and biased arrays were excluded. The hub genes with log-rank p-value <0.05 between the two expression groups were considered statistically significant.
Tumor immune infiltration analysis
The correlations between the expression of BC-specific hub genes and tumor-infiltrating immune cells (such as B cells, neutrophils, and macrophages) across the Cancer Genome Atlas (TCGA)-BRCA patients were done utilizing TIMER (Li et al., 2020) (http://cistrome.org/TIMER/). Spearman correlation was used to evaluate the statistical significance. The gene expression levels were log2 RNA-Seq by Expectation-Maximization (RSEM) expressed.
Validation of hub genes using HPA
The protein expression pattern of the hub genes in tumor and normal tissues was validated using the HPA database (Sjöstedt et al., 2020; Thul et al., 2017; Uhlen et al., 2019; Uhlen et al., 2017; Uhlen et al., 2015) (https://www.proteinatlas.org/).
Results
BC mRNA expression profile selection and differential expression analysis
Based on the inclusion and exclusion criteria, we chose a BC-related mRNA expression profile with accession number GSE109169. It comprised 25 pairs of BC and adjacent normal tissues. Corresponding to a BH–p-value <0.05 and |log2 (fold change)| > 1.5, 293 DEGs (upregulated: 185 and downregulated: 108) were screened. Among the DEGs, 36.86% and 63.13% of genes were shown to be up- and downregulated, respectively. The volcano plot shows the distribution of upregulated and downregulated BC-specific DEGs and nonsignificant genes (17,030) (Fig. 1A). The log2 fold change (along the x-axis) of total genes varies with respect to the −log10BH–p-value (along the y-axis). CST1 [log2 = −3.52] and FABP4 [log2 = 5.60] reported the highest fold change values across downregulated and upregulated DEGs. Figure 1B shows the expression heatmap plot of down- and upregulated DEGs (top 10). The sex, cancer stage, and sample annotation bars are placed at the top of the heatmap. The mean age of normal and tumor samples was reported to be 46.52 years. The most frequent occurrence of age was 44 years across both normal and tumor samples (i.e., four samples each). Also, the most frequent occurrence of cancer stage was IIA across both normal and tumor samples (i.e., eight samples each). Principal component analysis (PCA) is a robust dimensionality reduction technique that simplifies high-dimensional data complexity. It does so by chunking the data into fewer dimensions and constructing linear combinations of gene expressions called principal components (PCs). These orthogonal PCs efficiently explain complex gene expression variations since they have a lower dimensionality.

(
The PCA plot in Figure 1C depicts the expression distribution of these DEGs across all samples. The expression variability of all DEGs was dimensionally reduced for the sample type, resulting in distinct cluster formations. The scree plot (Fig. 1D) shows the % of variances accounted for by the top five PCs.
WGCN construction and hub module/gene(s) selection
We primarily loaded 293 BC-specific DEGs' expression data and sample age information. Our WGCN did not follow the scale-free topology criterion for the selection of a suitable value of β corresponding to R2 > 0.8. Hence under the weighted gene coexpression network analysis (WGCNA) guidelines, β = 12 (for more than 40 samples) was preferred. As shown in Figure 2A, the clustering tree (hierarchical) and dynamic tree cut algorithm revealed three color-coded gene modules (gray, dark gray, and light gray). Figure 2B depicts a bar plot of GS (correlated with age) for each module. The GS values for all modules were gray = 0.14, dark gray = 0.04, and light gray = 0.06. We discarded the gray module for further investigation because it contained unassigned genes. A multidimensional scaling plot of all the modules across three scaling dimensions is shown in Supplementary Figure S1.

(
Supplementary Figure S2 depicts TOM among the dark-gray and light-gray module genes as a heatmap plot of the WGCN. The light-gray module (module significance = 0.06, GS vs. MM = −0.53, GS vs. k.in=−0.48) was chosen as our hub module based on the most significant correlations between MM versus GS and GS versus k.in, as shown in Supplementary Tables S1 and S2. Figure 2C represents a scatterplot of GS for age to MM in a light-gray module. Figure 2D shows a heatmap plot of light-gray module genes and their corresponding ME levels. Based on MM >0.8 and GS >0.2, we got PI15 and KRT5 as our hub genes from a light-gray module.
Validation of hub genes via cBioPortal and UALCAN
Supplementary Figure S3A depicts box-and-whisker plots of the relative expression distributions of PI15 and KRT5 across GSE109169 patient samples. Scatterplot showing significantly high Pearson correlation (R = 0.82, p-value = 3.4 × 10⁻¹³) between PI15 and KRT5 is shown in Supplementary Figure S3B. cBioPortal was utilized to validate the specific genetic modifications associated with PI15 and KRT5 across the BC data set (METABRIC, Nature 2012 & Nat Commun 2016) comprising 2509 primary breast tumors and 548 matched normal samples. The queried genes were altered in 15% (379/2509) of cases. PI15 showed maximum mutation frequency (17%) compared with KRT5 (0.7%). Supplementary Figure S4 shows the overall alteration frequency of these genes based on the cancer-type summary analysis.
We observed 19.22% (319/1660 cases), 16.67% (3/18 cases), 15.14% (33/218 cases), 10.53% (8/76 cases), 8.72% (15/172 cases), and 4% (1/25 case) amplification frequencies across breast invasive ductal carcinoma (ICD), breast, breast mixed ductal and lobular carcinoma, invasive breast carcinoma, breast invasive lobular carcinoma, breast invasive mixed mucinous carcinoma subtypes within chosen BRCA data set samples. The promoter methylation profiles of KRT5 and PI15 based on sample type, nodal metastasis status, and TP53 mutation status are shown by box-and-whisker plots in Figure 3. p-Value <0.05 was considered a statistically significant threshold.

KRT5 promoter methylation profile distribution across the TCGA-BRCA cohort represented by box-and-whisker plots based on (
KM survival analysis of hub genes
Utilizing the selected parameters mentioned in the “Materials and Methods” section, there were 1879 and 4929 patients for the OS and RFS analysis. The KM plots illustrating the OS and RFS of KRT5 and PI15 across the BC cohort are shown in Figure 4. The OS and RFS analysis revealed poor upper quartile survival across low-expression cohorts for PI15 and KRT5. The hazard ratio, log-rank value, 95% confidence interval, and upper quartile survival status to OS and RFS for both the hub genes are elaborated in Supplementary Table S3.

KM plots showing the OS of (
Tumor immune infiltration analysis
Correlations of PI15 and KRT5 mRNA expression levels with tumor purity and infiltrating levels of B cells, neutrophils, and macrophages across the TCGA-BRCA cohort are shown by scatterplots in Figure 5. PI15 (r = 0.12, p = 1.44 × 10⁻⁴) and KRT5 (r = 0.157, p = 6.22 × 10⁻⁷) displayed a significant positive correlation with infiltrating levels of neutrophils. Whereas PI15 and KRT5 displayed a significant negative correlation with infiltrating levels of B cells [PI15 (r = −0.244, p = 5.51 × 10⁻¹⁵) and KRT5 (r = −0.19, p = 1.47 × 10⁻⁹)] and macrophages [PI15 (r = −0.169, p = 7.65 × 10⁻⁸) and KRT5 (r = −0.138, p = 1.25 × 10⁻⁵)]. Both PI15 (r = −0.19, p = 1.52 × 10⁻⁹) and KRT5 (r = −0.373, p = 4.05 × 10⁻³⁴) had significant negative correlations with tumor purity across BRCA.
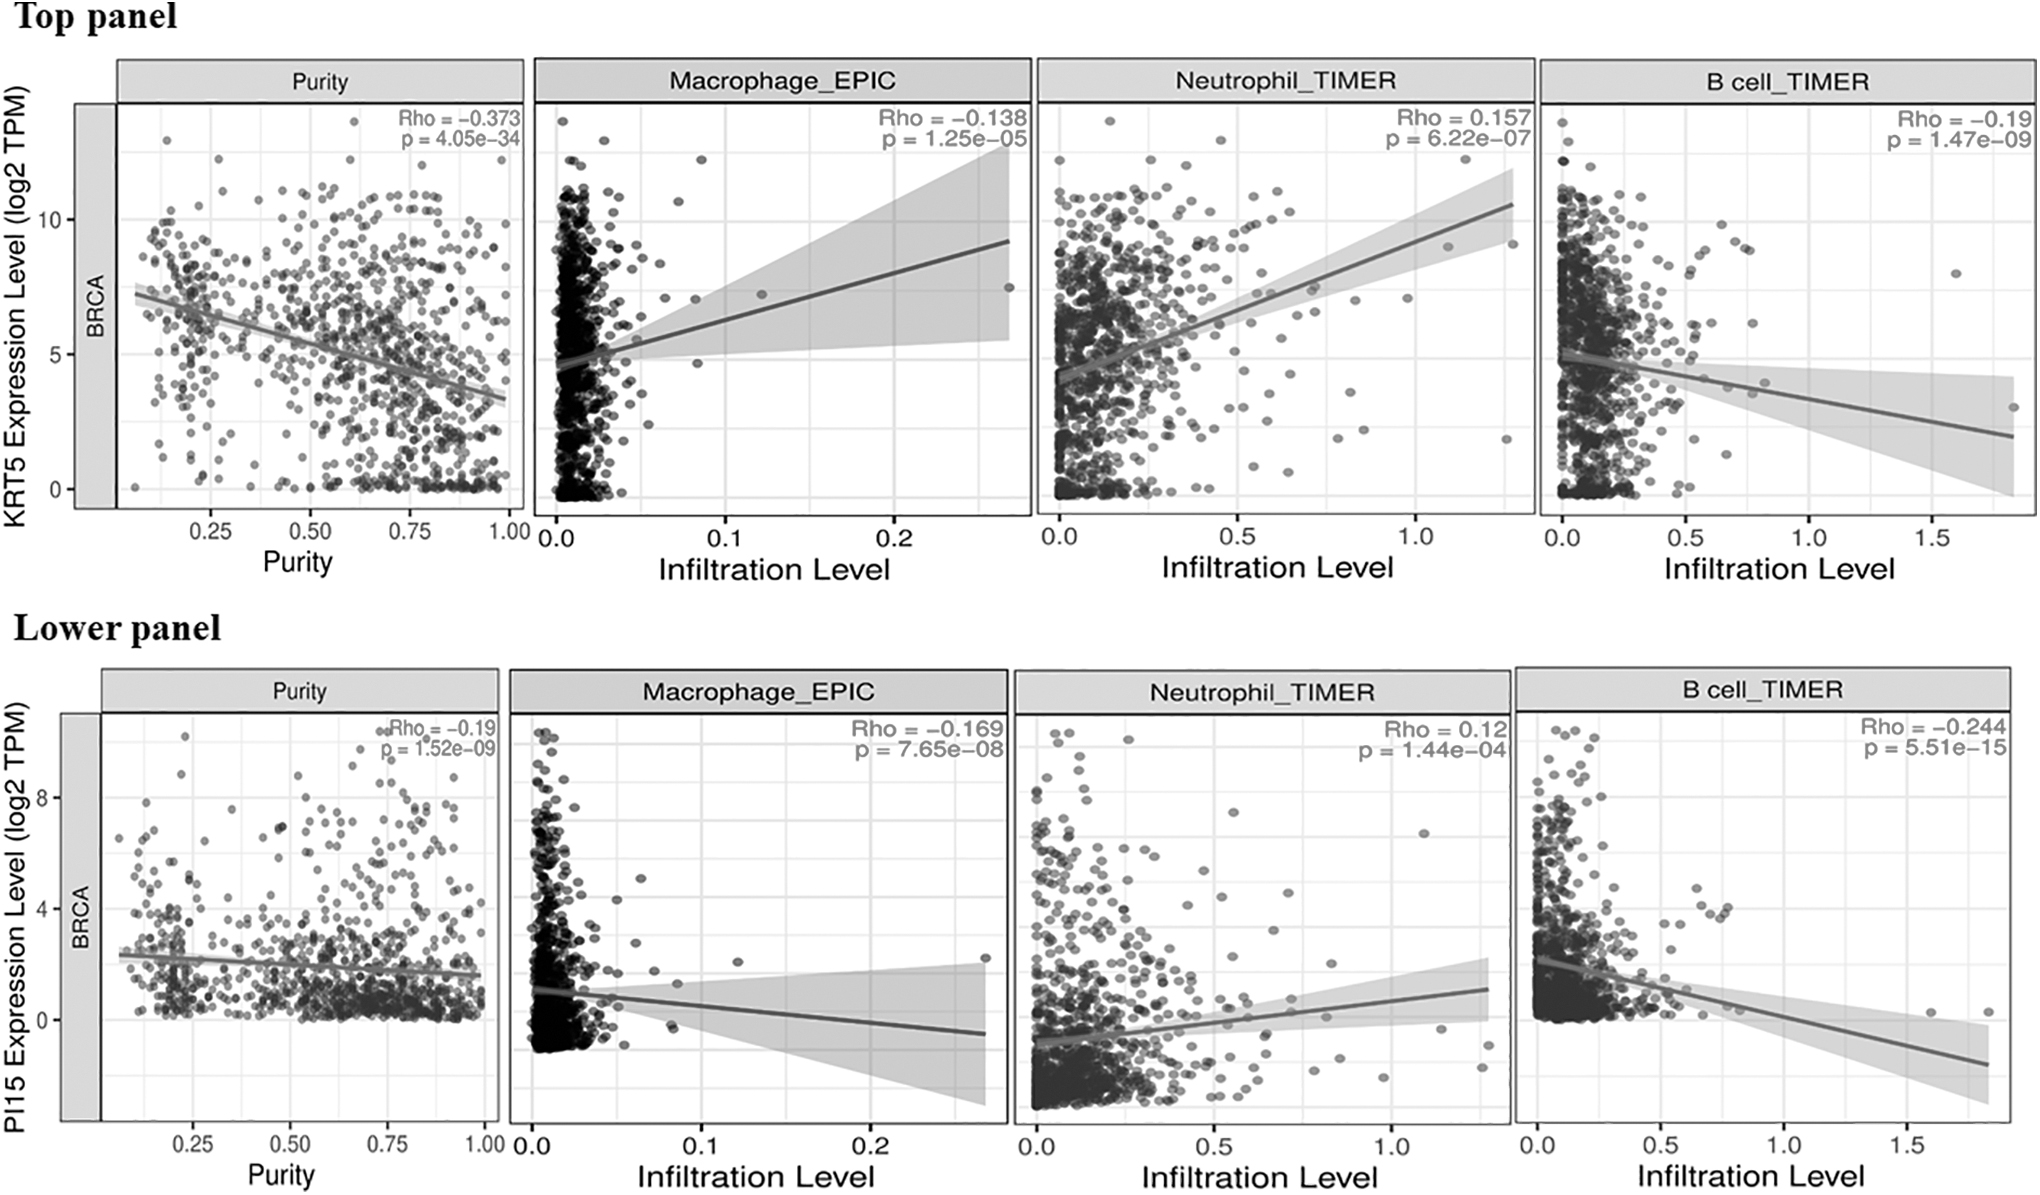
Scatterplots demonstrating significant correlations of KRT5 and PI15 with macrophage, neutrophil, and B cell infiltrating levels across the TCGA-BRCA cohort. In addition, the legends for each scatter plot included Spearman's correlation value and estimated statistical significance. In the TCGA-BRCA cohort, both PI15 and KRT5 showed significant negative correlations with tumor purity.
Hub gene validation using HPA
The protein expression patterns of PI15 and KRT5 in normal breast and breast carcinoma tissues using the HPA database are shown in Supplementary Figure S5. Medium immunoexpressions of PI15 were observed in normal breast tissues, while negative immunoexpressions of PI15 were observed in breast carcinoma tissues. However, medium and low protein expressions of KRT5 were found in normal and breast tumor tissues, respectively.
Discussion
The marked interindividual variability in BC pathophysiology and treatment outcomes calls for personalized/precision medicine approaches. Even though the laboratory tests for BC diagnosis have improved significantly in the last several decades, the clinical outcomes need improvement: the 5-year survival rates drop from 90% to 20% from stage II to stage IV cancer. Thus, it is pivotal to explore novel prognostic markers and gain deeper insights into the molecular mechanisms of the disease.
Developing high-throughput platforms such as next-generation sequencing and microarray technology has been widely implemented to study disease's molecular basis. Microarray investigations have been successfully utilized to reveal a disease's genetic aberrations, prognosis, and prediction of drug response. To this end, correlation networks are essential for assessing the correlation patterns in microarray samples and have been extensively used by bioinformaticians.
WGCNA uses soft-thresholding techniques to find clusters of genes that are highly correlated and summarizes them using ME. WGCNA is a powerful and effective algorithm for measuring the coexpression relationships among genes utilizing their expression correlation coefficients. It can be used to find clusters or modules of highly related genes, correlate modules, and correlate with external trait data to detect potential biomarkers or therapeutic targets (Chengcheng et al., 2022; Zhou et al., 2020).
This study presented an overview of nonsignificant versus significant genes across 25 pairs of BC and adjacent normal tissues. Among the DEGs, 36.86% and 63.13% of genes were up- and downregulated, respectively. In addition, we revealed that CST1 and FABP4 were the most down- and upregulated among all the DEGs. As we constructed WGCN by utilizing expression data of DEGs followed by identifying three age-linked modules, the light-gray module comprising 205 genes was chosen as our hub module based on high correlations between GS, MM, and k.in. The PI15 and KRT5 emerged as our hub genes based on MM >0.8 and GS >0.2 from the light-gray module.
We further analyzed the promoter methylation profiles of KRT5 and PI15 based on sample type, nodal metastasis status, and TP53 mutation status (Fig. 3). In the case of KRT5, normal versus tumor, normal versus TP53 mutant, normal versus TP53 nonmutant, normal versus N0, and normal versus N1 were highly significant. Whereas in the case of PI15, normal versus tumor, normal versus TP53 mutant, normal versus TP53 nonmutant, TP53 mutant versus TP53 nonmutant, normal versus N0, normal versus N1, normal versus N2, and normal versus N3 were highly significant. As TP53 has highly mutated in the case of triple-negative breast cancer at exon 4 and intron 3 positions, several drugs targeting TP53/p53 are currently being clinically tested (Duffy et al., 2018; Kaur et al., 2018).
PI15 belongs to a family of cysteine-rich secretory proteins. It is also a serine protease inhibitor (Koshikawa et al., 1996), mainly expressed in smooth muscles, prostate, and lymphoid tissue. Previous studies have reported that PI15 is predominantly expressed in many cancer cell lines, such as glioblastoma and neuroblastoma cell lines (Yamakawa et al., 1998). In addition, PI15 has also been identified as a marker for diagnosis in colorectal carcinoma, cholangiocarcinoma, and HER2-subtype BC (Jiang et al., 2019; Sun et al., 2021; Tuupanen et al., 2014). Another study also reported the downregulation of PI15 with tumor development in BC (Kothari et al., 2018). Interestingly, the role of PI15 in inhibiting trypsin falls in line with the anticarcinogenic effects of food products containing trypsin inhibitors. Thus, PI15 may function by inhibiting trypsin, which would otherwise be utilized by the cancer cells to disrupt the basement membrane.
The KRT5 gene, also known as cytokeratin 5, encodes a protein called keratin 5 which is primarily expressed by keratinocytes in the epidermis. Keratins are fibrous proteins that form the structural framework of skin, hair, and nail cells. KRT5 also interacts with melanocytes to produce skin pigmentation (Arin et al., 2010; Pfendner et al., 2005). Previous studies have shown that KRT5+ cells exhibit specific hallmarks of BC stem cells compared with the KRT5− cells (Axlund et al., 2013; Fettig et al., 2017). Knockdown or overexpression of KRT5 reduced or increased the tumorsphere formation ability of the ER+ BC cell line. Long-term estrogen withdrawal or increased progestin has been associated with an increased KRT5+ cell population. KRT5 interacts with β-catenin, a downstream protein from the Wnt signaling pathway, and translocates it to the cytosol, followed by loss of E-cadherin protein, thus remodeling cell morphology (McGinn et al., 2020).
In addition, KRT5+ cells have also been implicated in basal-like BC, an aggressive type of TNBC (Lim et al., 2009) (Lakhani et al., 2005; Nielsen et al., 2004) and KRT5 expression is lower in first/second grade cancer than in third grade cancer (Moriya et al., 2009; Tan et al., 2005). These studies collectively confirm that KRT5 may serve essential functions in various BCs and further studies can help to use it as a potential biomarker for disease prognosis.
Altogether, it is crucial to identify potential biomarkers that could help explain BC's pathogenesis. These insights could pave a roadmap to design targeted molecular therapies for personalized cancer treatment. The present work offers novelty by using paired samples for higher statistical power gain and an advanced batch-correction algorithm to identify highly robust and prognostic BC potential biomarkers. Identifying biomarker candidates such as PI15 and KRT5 is crucial as we search for stratified treatment options, thus moving forward toward personalized medicine and targeted therapies. Changes in the expression of specific potential biomarkers can help us predict the disease's progression or in early detection or assess which patients respond better to a particular drug.
Thus, if validated and clinically contextualized, potential biomarkers can help improve disease surveillance, enabling the most suitable therapeutic option for a patient presenting with a specific case. However, further validations are needed for this study to test their efficacy and effectiveness in large patient sets.
Conclusions
This study aimed to identify novel and effective potential biomarkers involved in BC using WGCNA. We thus identified three age-linked modules, out of which the light-gray module and two hub genes, PI15 and KRT5, showed the strongest correlation with BC. We validated our identified hub genes and further associated them with various clinical parameters of the disease, such as the sample type, nodal metastasis status, and TP53 mutation status, followed by survival analysis. In addition, we investigated their correlation with tumor-infiltrating immune cells such as B cells, neutrophils, and macrophages. In conclusion, both PI15 and KRT5 genes were significantly associated with BC in our analysis at both the transcriptional and translational levels.
These new observations call for future research in a larger sample size, which could inform BC diagnosis and clinical management, thus paving the way toward personalized medicine.
Data Availability Statement
The data that are the basis for this article are available in NCBI-GEO and can be accessed with GSE109169.
Footnotes
Acknowledgments
P.S. and A.R. would like to thank the Indian Council of Medical Research for awarding them Senior Research Fellowship [Grant Number: BMI/11(89)/2020 to P.S. and BMI/11(84)/2022 to A.R.].
Authors' Contributions
P.S.: Conceptualization, methodology, software, formal analysis, data curation, writing—original draft, and writing—review and editing. A.R.: Formal analysis, writing—original draft, and writing—review and editing. R.M.: Writing—original draft and writing—review and editing. A.S.: Methodology, investigation, visualization, validation, writing—original draft, and writing—review and editing. M.M.H.: Writing—review and editing. M.I.H.: Writing—review and editing. R.D.: Writing—review and editing, supervision, and project administration. All authors read and approved the final article.
Author Disclosure Statement
The authors declare they have no conflicting financial interests.
Funding Information
This work was supported by the National Medicinal Plants Board (NMPB), Ministry of AYUSH, Government of India [Z. 18017/187/CSS/R&D/DL-01/2019-20-NMPB-IVA].

Abbreviations Used
References
Supplementary Material
Please find the following supplemental material available below.
For Open Access articles published under a Creative Commons License, all supplemental material carries the same license as the article it is associated with.
For non-Open Access articles published, all supplemental material carries a non-exclusive license, and permission requests for re-use of supplemental material or any part of supplemental material shall be sent directly to the copyright owner as specified in the copyright notice associated with the article.
