




Abstract
Plectin, encoded by PLEC, is a cytoskeletal and scaffold protein with a number of unique isoforms that act on various cellular functions such as cell adhesion, signal transduction, cancer cell invasion, and migration. While plectin has been shown to display high expression and mislocalization in tumor cells, our knowledge of the biological significance of plectin and its isoforms in tumorigenesis remain limited. In this study, we first performed pathway enrichment analysis to identify cancer hallmark proteins associated with plectin. Then, a pan-cancer analysis was performed using RNA-seq data collected from the Cancer Genome Atlas (TCGA) to detect the mRNA expression levels of PLEC and its transcript isoforms, and the prognostic as well as diagnostic significance of the transcript isoforms was evaluated considering cancer stages. We show here that several tissue specific PLEC isoforms are dysregulated in different cancer types and stages but not the expression of PLEC. Among them, PLEC 1d and PLEC 1f are potential biomarker candidates and call for further translational and personalized medicine research. This study makes a contribution as a stride to unravel the molecular mechanisms underpinning plectin isoforms in cancer development and progression by revealing the potent plectin isoforms in different stages of cancer as potential early cancer detection biomarkers. Importantly, uncovering how plectin isoforms guide malignancy and particular cancer types by comprehensive functional studies might open new avenues toward novel cancer therapeutics.
Introduction
It has been reported that there are ∼150,000 transcript isoforms, most of which give rise to protein isoforms through various vital processes, such as alternative splicing (Pan et al., 2008; Wang et al., 2008). Isoforms arising from the same gene may have either closely related or opposing functions. However, several recent studies have emphasized that differential expression analysis at the gene level alone may not provide accurate data, and isoform studies even at the single cell level are needed to decipher the transition from normal physiology to pathology in humans (Liu et al., 2022; Pan et al., 2022; Ray et al., 2020). For this reason, it is critical to explore the specific functions of protein isoforms, their spatial and temporal distribution in the cell, and their interactors.
Plectin, a member of the plakin family, is one of the proteins in the human proteome with at least 14 isoforms encoded by the alternative first exons of the PLEC gene (https://www.ensembl.org/Homo_sapiens/Gene/Summary?db=core;g=ENSG00000178209;r=8:143915153-143976734; Fuchs et al., 1999). Exon 1 constitutes the N-terminal domain of the protein, whereas the central rod and C-terminal domains are encoded by the remaining exons (i.e., exons 2–32). Of the isoforms, 8 of 14 have a consensus coding sequence. These are, plectin 1 (PLEC 1), plectin 1a (PLEC 1a), plectin 1b (PLEC 1b), plectin 1c (PLEC 1c), plectin 1d (PLEC 1d), plectin 1e (PLEC 1e), plectin 1f (PLEC 1f), and plectin 1g (PLEC 1g). The variable short N-terminals of the plectin isoforms define their functions and cellular localizations (Castañón and Wiche, 2021; Fuchs et al., 1999).
Plectin generally acts as a linker between the cytoskeleton and intercellular junctions. It plays a critical role in maintaining cell architecture and mechanical integrity. Several studies have demonstrated that isoforms of plectin have variable expression profiles and distinct tissue-specific functions, for example, in basal keratinocytes, neuronal cells, muscles, and osteoclasts (Andrä et al., 2003; Castañón et al., 2013; Fuchs et al., 2009; Konieczny et al., 2008; Matsubara et al., 2019; Rezniczek et al., 2007; Staszewska et al., 2015; Winter et al., 2008). However, it has also been shown that plectin isoforms 1, 1d, 1e, 1f, and 1g were localized in podosomes, and are involved in motility in SW480 colon carcinoma cells (McInroy and Määttä, 2011). Podosomes are referred to invadopodia in cancer cells and they are actin-based protrusions involved in extracellular matrix (ECM) degradation to promote cell invasion and migration (Cao et al., 2020; Hoshino et al., 2013).
To date, mutations in the common exons of PLEC or in isoform-specific exon 1s have been associated with various types of diseases such as epidermolysis bullosa and muscular dystrophy (Deev et al., 2017; Gostyńska et al., 2015; Gundesli et al., 2010; Mroczek et al., 2020). However, several studies suggest that plectin has somatic mutations in malignant tumors and the expression profile of the protein is altered in several cancers (Cerami et al., 2012; Dasa et al., 2018; Dumas et al., 2000; Gao et al., 2013; Pawar et al., 2011; Shin et al., 2013). Plectin also functions as a scaffold that provides a binding site for proteins involved in signal transduction to regulate cell migration (Osmanagic-Myers and Wiche, 2004; Osmanagic-Myers et al., 2006).
There are also a number of reports implicating plectin as a regulator of cancer cell growth, invasion, and migration (Buckup et al., 2021; Katada et al., 2012; McInroy and Määttä, 2011; Puiffe et al., 2007; Shin et al., 2013). For example, in several pancreatic ductal adenocarcinoma cell lines, the expression of plectin was knocked down using shRNA, and proliferation was found to be significantly reduced (Shin et al., 2013). Moreover, mRNA expression levels of PLEC 1a and PLEC 1f were prominently elevated and these isoforms were found on pancreatic cancer cell surfaces (Shin et al., 2013). Similarly, these two isoforms were also upregulated in non-small cell lung cancer (NSCLC) (Raymond et al., 2019). Furthermore, suppression of plectin resulted in reduced cell growth, invasion, and migration in prostate cancer cell lines (Buckup et al., 2021; Burch et al., 2013).
These results collectively suggest that plectin could be a prognostic biomarker. However, it should be noted that there are several plectin isoforms with different functions and only the expression of PLEC in tumor tissues or cancer cell lines has been analyzed, but there is not much information about the expression level or the potential role of plectin isoforms in carcinogenesis. To our knowledge, no pan-cancer data have been reported in the form of diagnostic and prognostic performance analyses for plectin isoforms that would help determining the biomarker potential of these isoforms in each cancer type.
Herein, we aimed to focus on plectin and its transcript isoforms to discuss whether PLEC or its isoforms can be used as prognostic/diagnostic biomarkers or whether plectin isoforms have functional effects on cancer progression. To shed light on these dark spots, we first performed pathway enrichment analysis to determine the association of plectin with cancer-related processes. We then performed a pan-cancer expression analysis of gene and transcript isoforms by considering four cancer stages. Kaplan–Meier (KM) and Receiver Operating Characteristics (ROC) curve analyses of PLEC and its eight isoforms in 12 different cancers using TCGA data showed that several plectin isoforms could be potential diagnostic and/or prognostic biomarkers. In light of the outcomes of this recent work, new insights into the potential role of plectin isoforms in tumorigenesis were also presented.
Materials and Methods
Plectin isoforms
Eight plectin isoforms with consensus coding sequences, plectin 1, PLEC 1 (NM_201380.4); plectin 1a, PLEC 1a (NM_201384.3); plectin 1b, PLEC 1b (NM_201382.4); plectin 1c, PLEC 1c (NM_000445.5); plectin 1d, PLEC 1d (NM_201381.3); plectin 1e, PLEC 1e (NM_201379.3); plectin 1f, PLEC 1f (NM_201378.4); and plectin 1g, PLEC 1g (NM_201383.3) were analyzed to reveal their impact on 12 cancers (Table 1), including breast invasive carcinoma (BRCA), colon adenocarcinoma (COAD), head and neck squamous cell carcinoma (HNSC), kidney renal clear cell carcinoma (KIRC), kidney renal papillary cell carcinoma (KIRP), liver hepatocellular carcinoma (LIHC), lung adenocarcinoma (LUAD), lung squamous cell carcinoma (LUSC), prostate adenocarcinoma (PRAD), stomach adenocarcinoma (STAD), thyroid carcinoma (THCA), and uterine corpus endometrial carcinoma (UCEC).
Plectin Isoforms Analyzed in This Study
Protein–protein interaction data
Since biomolecules never function alone, it is important to evaluate the impact of a biomolecule on the development or progression of any disease by considering the interactions between biomolecules. To uncover potential influences of PLEC and its interactions on cancer development, the human protein interactome was derived from a previously published study (Cheng et al., 2019) that curated protein–protein interactions (PPIs) from a total of 15 databases. This interactome contains 243,603 experimentally confirmed PPIs among 16,677 unique proteins.
Cancer hallmark proteins
Since cancer hallmark proteins orchestrate and drive cancer development, we believe it is important to study these features to understand the relationship between PLEC and its interactions in cancer. To investigate the PLEC gene and its interactions with cancer, we examined proteins, associated with ten hallmarks of cancer, including: (I) activating invasion and metastasis, (ii) enabling replicative immortality, (iii) evading growth suppressors, (iv) evading immune destruction, (v) genome instability and mutation, (vi) inducing angiogenesis, (vii) reprogramming energy metabolism, (viii) resisting cell death, (ix) sustaining proliferative signaling, and (x) tumor-promoting inflammation (Hanahan, 2022) that were extracted from two publicly available biological repositories (as available on December 2022), namely the Cancer Hallmark Genes (CHG) database (Zhang et al., 2020) and the Catalog of Somatic Mutations in Cancer (COSMIC) database (v.95) (Tate et al., 2019). A total of 1906 different cancer hallmark proteins were collected for 10 hallmarks from two different repositories.
Gene and isoform expression data
In this study, because we want to find out whether PLEC isoforms can be used as biomarkers for specific cancers, TCGA database (Tomczak et al., 2015), one of the most comprehensive databases that allows researchers to understand the molecular basis of cancer and contains large sample sizes for different cancer types, was used. Among the more than 30 cancers in the database, we selected the cancers with at least 30 diseased samples or control samples for our analysis to avoid possible sample size bias, thus we considered the sample size when selecting the cancer types. In this study, the raw (count) gene expression data and RNA-seq by Expectation-Maximization (RSEM) normalized isoform expression data for 12 cancers were collected from TCGA (Tomczak et al., 2015). In total, gene expression data and isoform expression data were collected from 6239 tumor and 637 matched normal tissue samples (Fig. 1A) and 5630 tumor and 624 matched normal tissue samples (Fig. 1B), respectively. In addition, clinical stage data (Stages I − IV) of tumor samples from TCGA were used for further analysis (Fig. 1C).
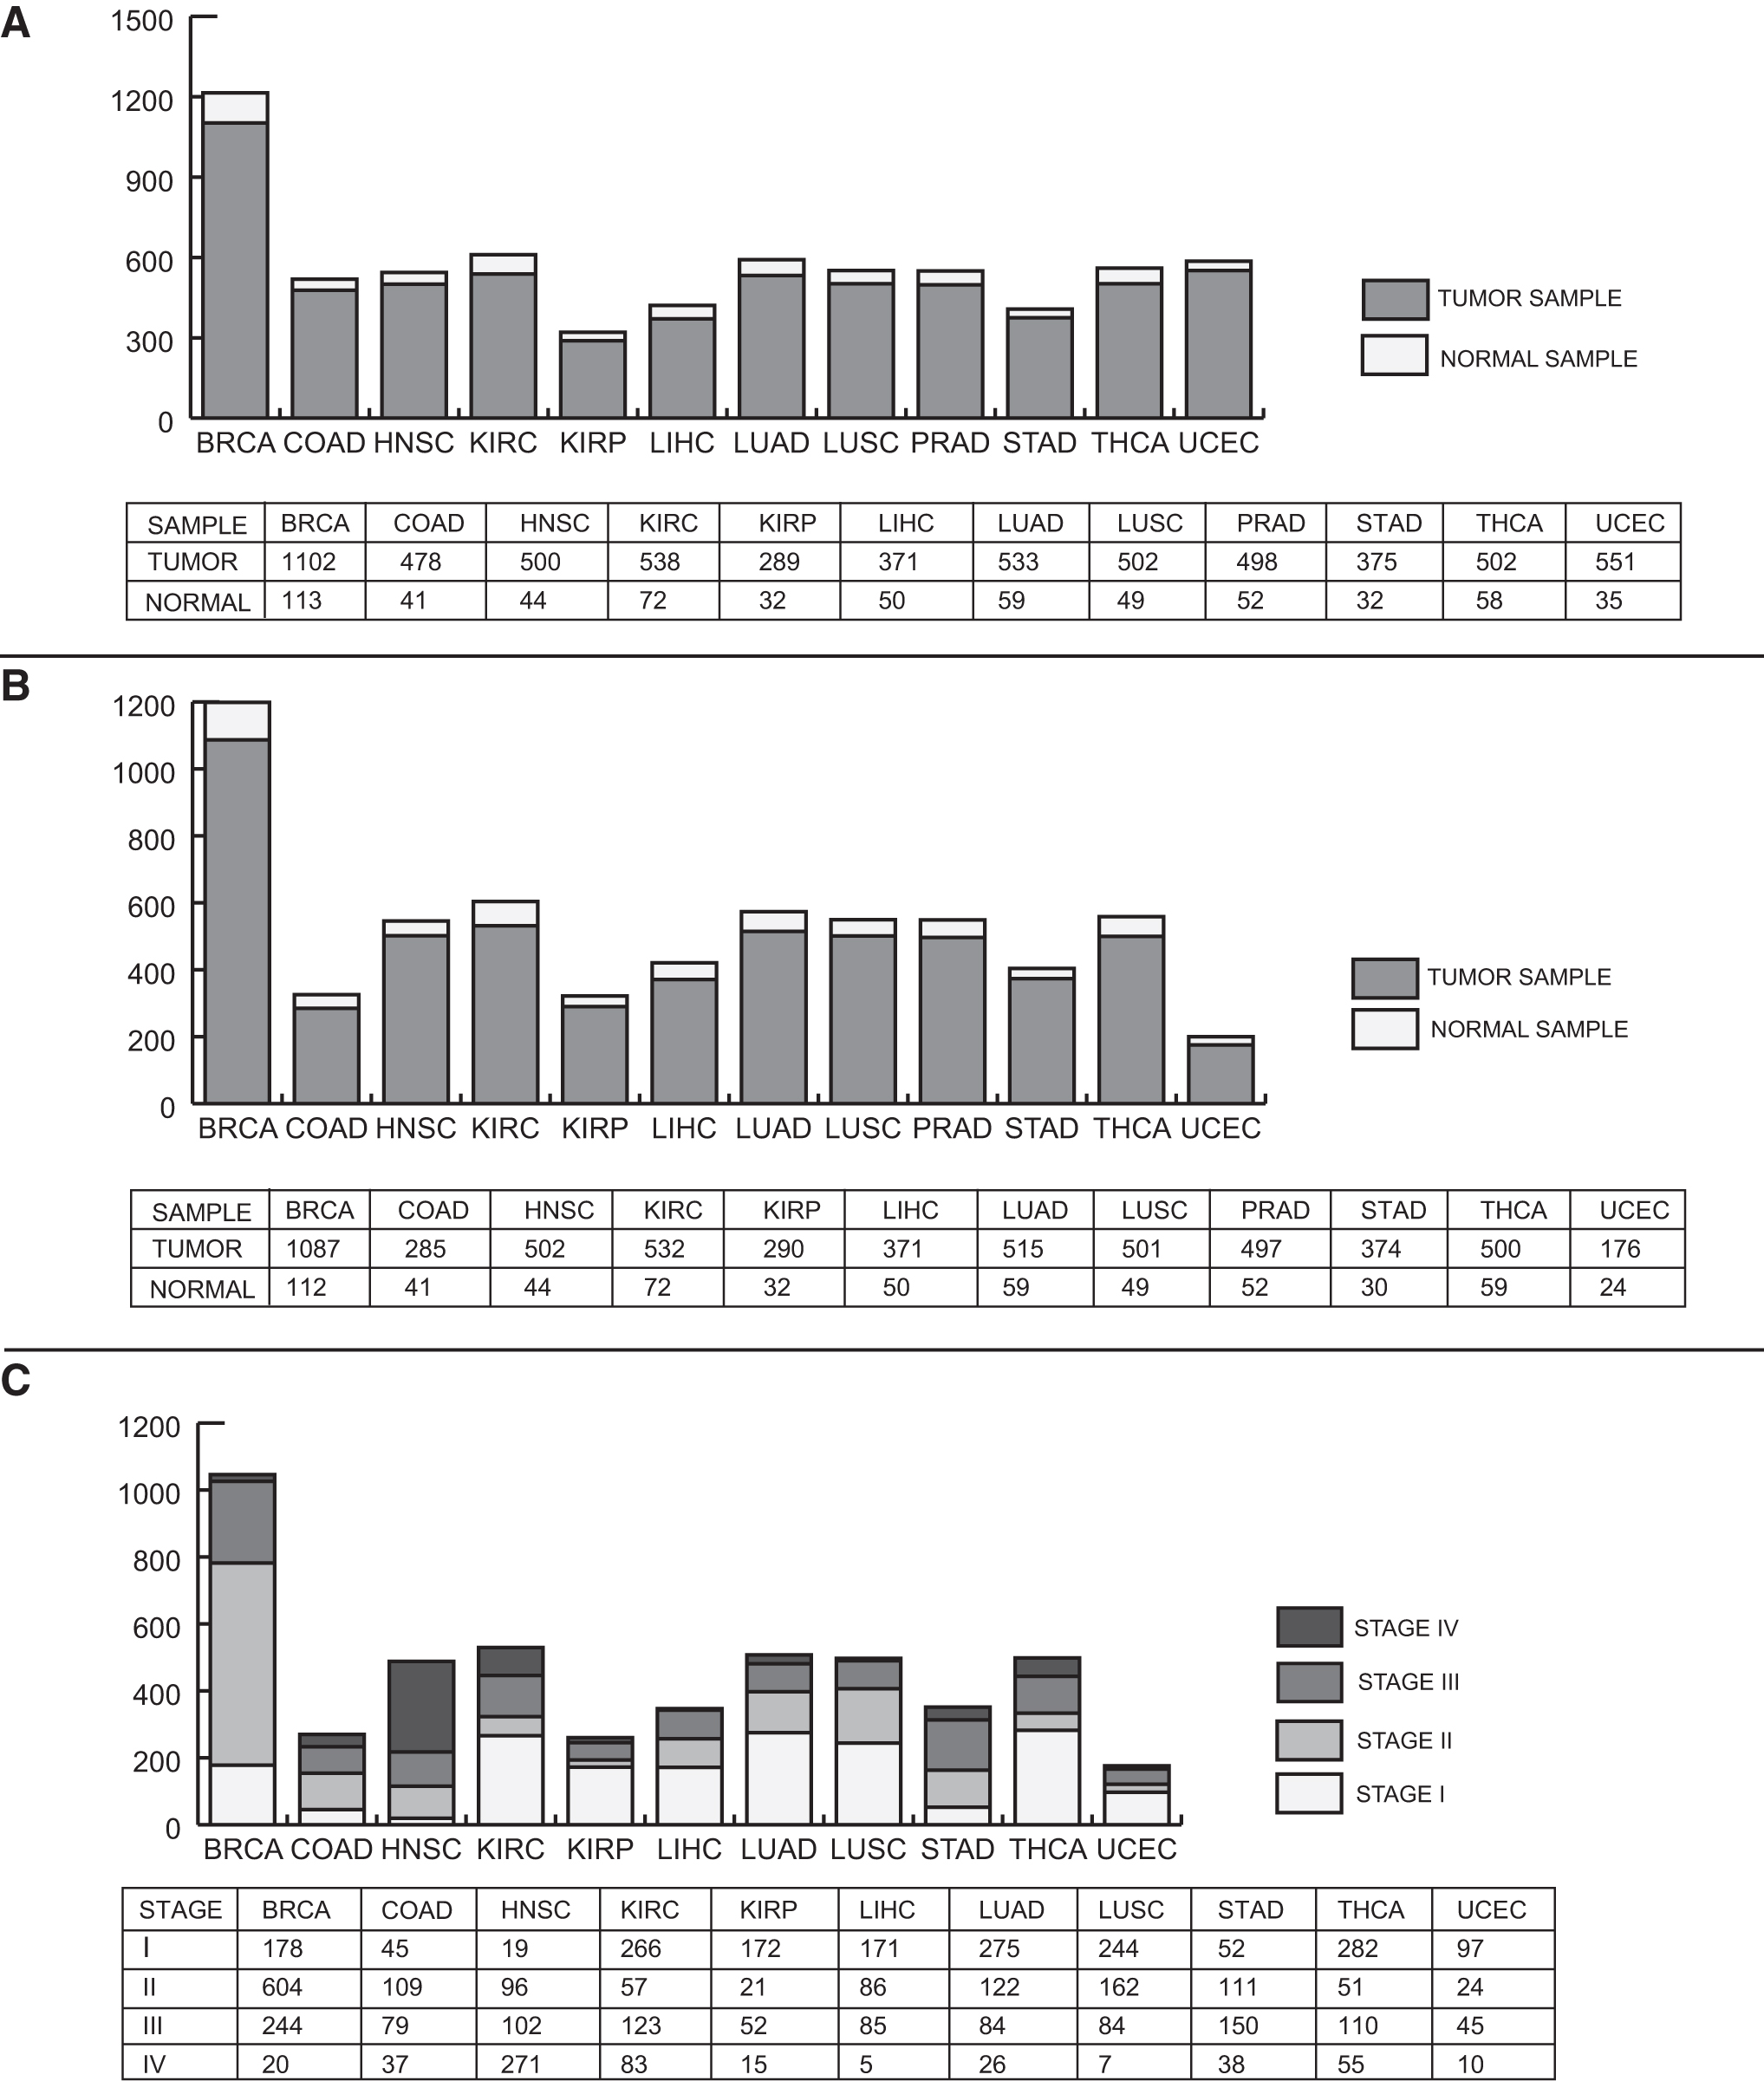
Sample numbers studied in 12 cancer types and stages.
Analysis of plectin–protein interaction characteristics
The PPI network was reconstructed for plectin with its first neighbors and visualized using Cytoscape (v3.5.0) (Shannon et al., 2003). To determine the association of plectin with and/or contribution to carcinogenesis, the interacting protein partners of the reconstructed interaction network of plectin were integrated with cancer hallmark proteins. In addition, overrepresentation analyses were performed using ConsensusPathDB (Kamburov et al., 2013) to determine the enriched Kyoto Encyclopedia of Genes and Genomes (KEGG) pathways of the interacting protein partners of plectin. The statistical significance (p-value) was determined using Fisher's exact test, and a false discovery rate (FDR) adjustment was applied on the p-values. An adjusted p-value <0.01 was considered statistically significant.
Differential expression analysis of PLEC and its isoforms
Raw (count) data were used to determine differential PLEC expression between the phenotypes using the DESeq2 package (Love et al., 2014) in R/Bioconductor (version 4.0.2) (Huber et al., 2015) for all 12 cancer cases studied. DESeq2 fits a generalized linear model of the negative binomial family and uses Wald test for testing the statistical significance. The Benjamini–Hochberg (BH) correction was used to control the FDR.
RSEM-normalized data were used to detect differential isoform expression between two phenotypes. Student's t-test was used to calculate the p-values of isoforms. The BH-adjusted p-value <0.01 was used as the cutoff value to determine statistical significance. Fold change was used to determine the regulatory pattern of differential PLEC and isoform expression (i.e., up- or downregulation), and at least a two-fold change was considered statistically significant. In addition, information about the stage of tumor samples was considered and evaluated individually according to their differential expression to detect the effect of stages.
Diagnostic performance analysis of PLEC and its isoforms
To evaluate the diagnostic performance of PLEC and its eight isoforms, the ROC curve approach was used, with the parameters of sensitivity and specificity to predict diagnostic ability. To determine the overall diagnostic accuracy, the area under the ROC curve (AUC) metric was calculated. A protein or isoform with an AUC value ≥70% was considered statistically significant (Mandrekar, 2010). In addition, information on the stage of tumor samples was considered and evaluated individually for diagnostic performance to identify the potential effect of stages.
Prognostic performance analysis of PLEC and its isoforms
To evaluate the prognostic performance of the PLEC and its eight isoforms, we collected clinical information (i.e., days to patient death, patient vital status, and days to last follow-up) of 12 cancers from TCGA. Prognostic abilities were evaluated by KM plots and the log-rank test. All analyses were performed using the Survival package in R/Bioconductor (version 4.0.2) (Huber et al., 2015). Samples were analyzed according to the prognostic index (PI), which is the linear component of the Cox model (PI = β1 × 1 + β2 × 2 +… + βpxp, where xi is the expression value of each gene, βi is the coefficient obtained from the Cox fit). The hazard ratio [HR = (O1/E1)/(O2/E2)] was calculated using the ratio between the relative mortality rate in group 1 and the relative mortality rate in group 2, where O and E are the observed and expected number of deaths, respectively. PLEC and its isoforms with a log-rank p-value <0.05 was considered statistically significant. In addition, information on the stage of tumor samples was considered and evaluated individually according to their prognostic performance to identify the potential effect of stages.
Results
Resolving the characteristics of plectin–protein interactions
The PPI analysis revealed that 108 proteins were categorized as cancer hallmarks (Fig. 2A). The associations of plectin-interacting proteins with cancer hallmarks were identified (Fig. 2B) and among them, large number of interactors (n = 23) were found to be associated with activating invasion and metastasis-related pathways (Fig. 2B, C). Pathways associated with cancer (cancer-related pathways and estrogen signaling in carcinogenesis) and four central biological processes, including regulation of actin cytoskeleton, transcriptional regulation, components of ECM, and mitophagy came into prominence in the enrichment analysis (Fig. 2D).
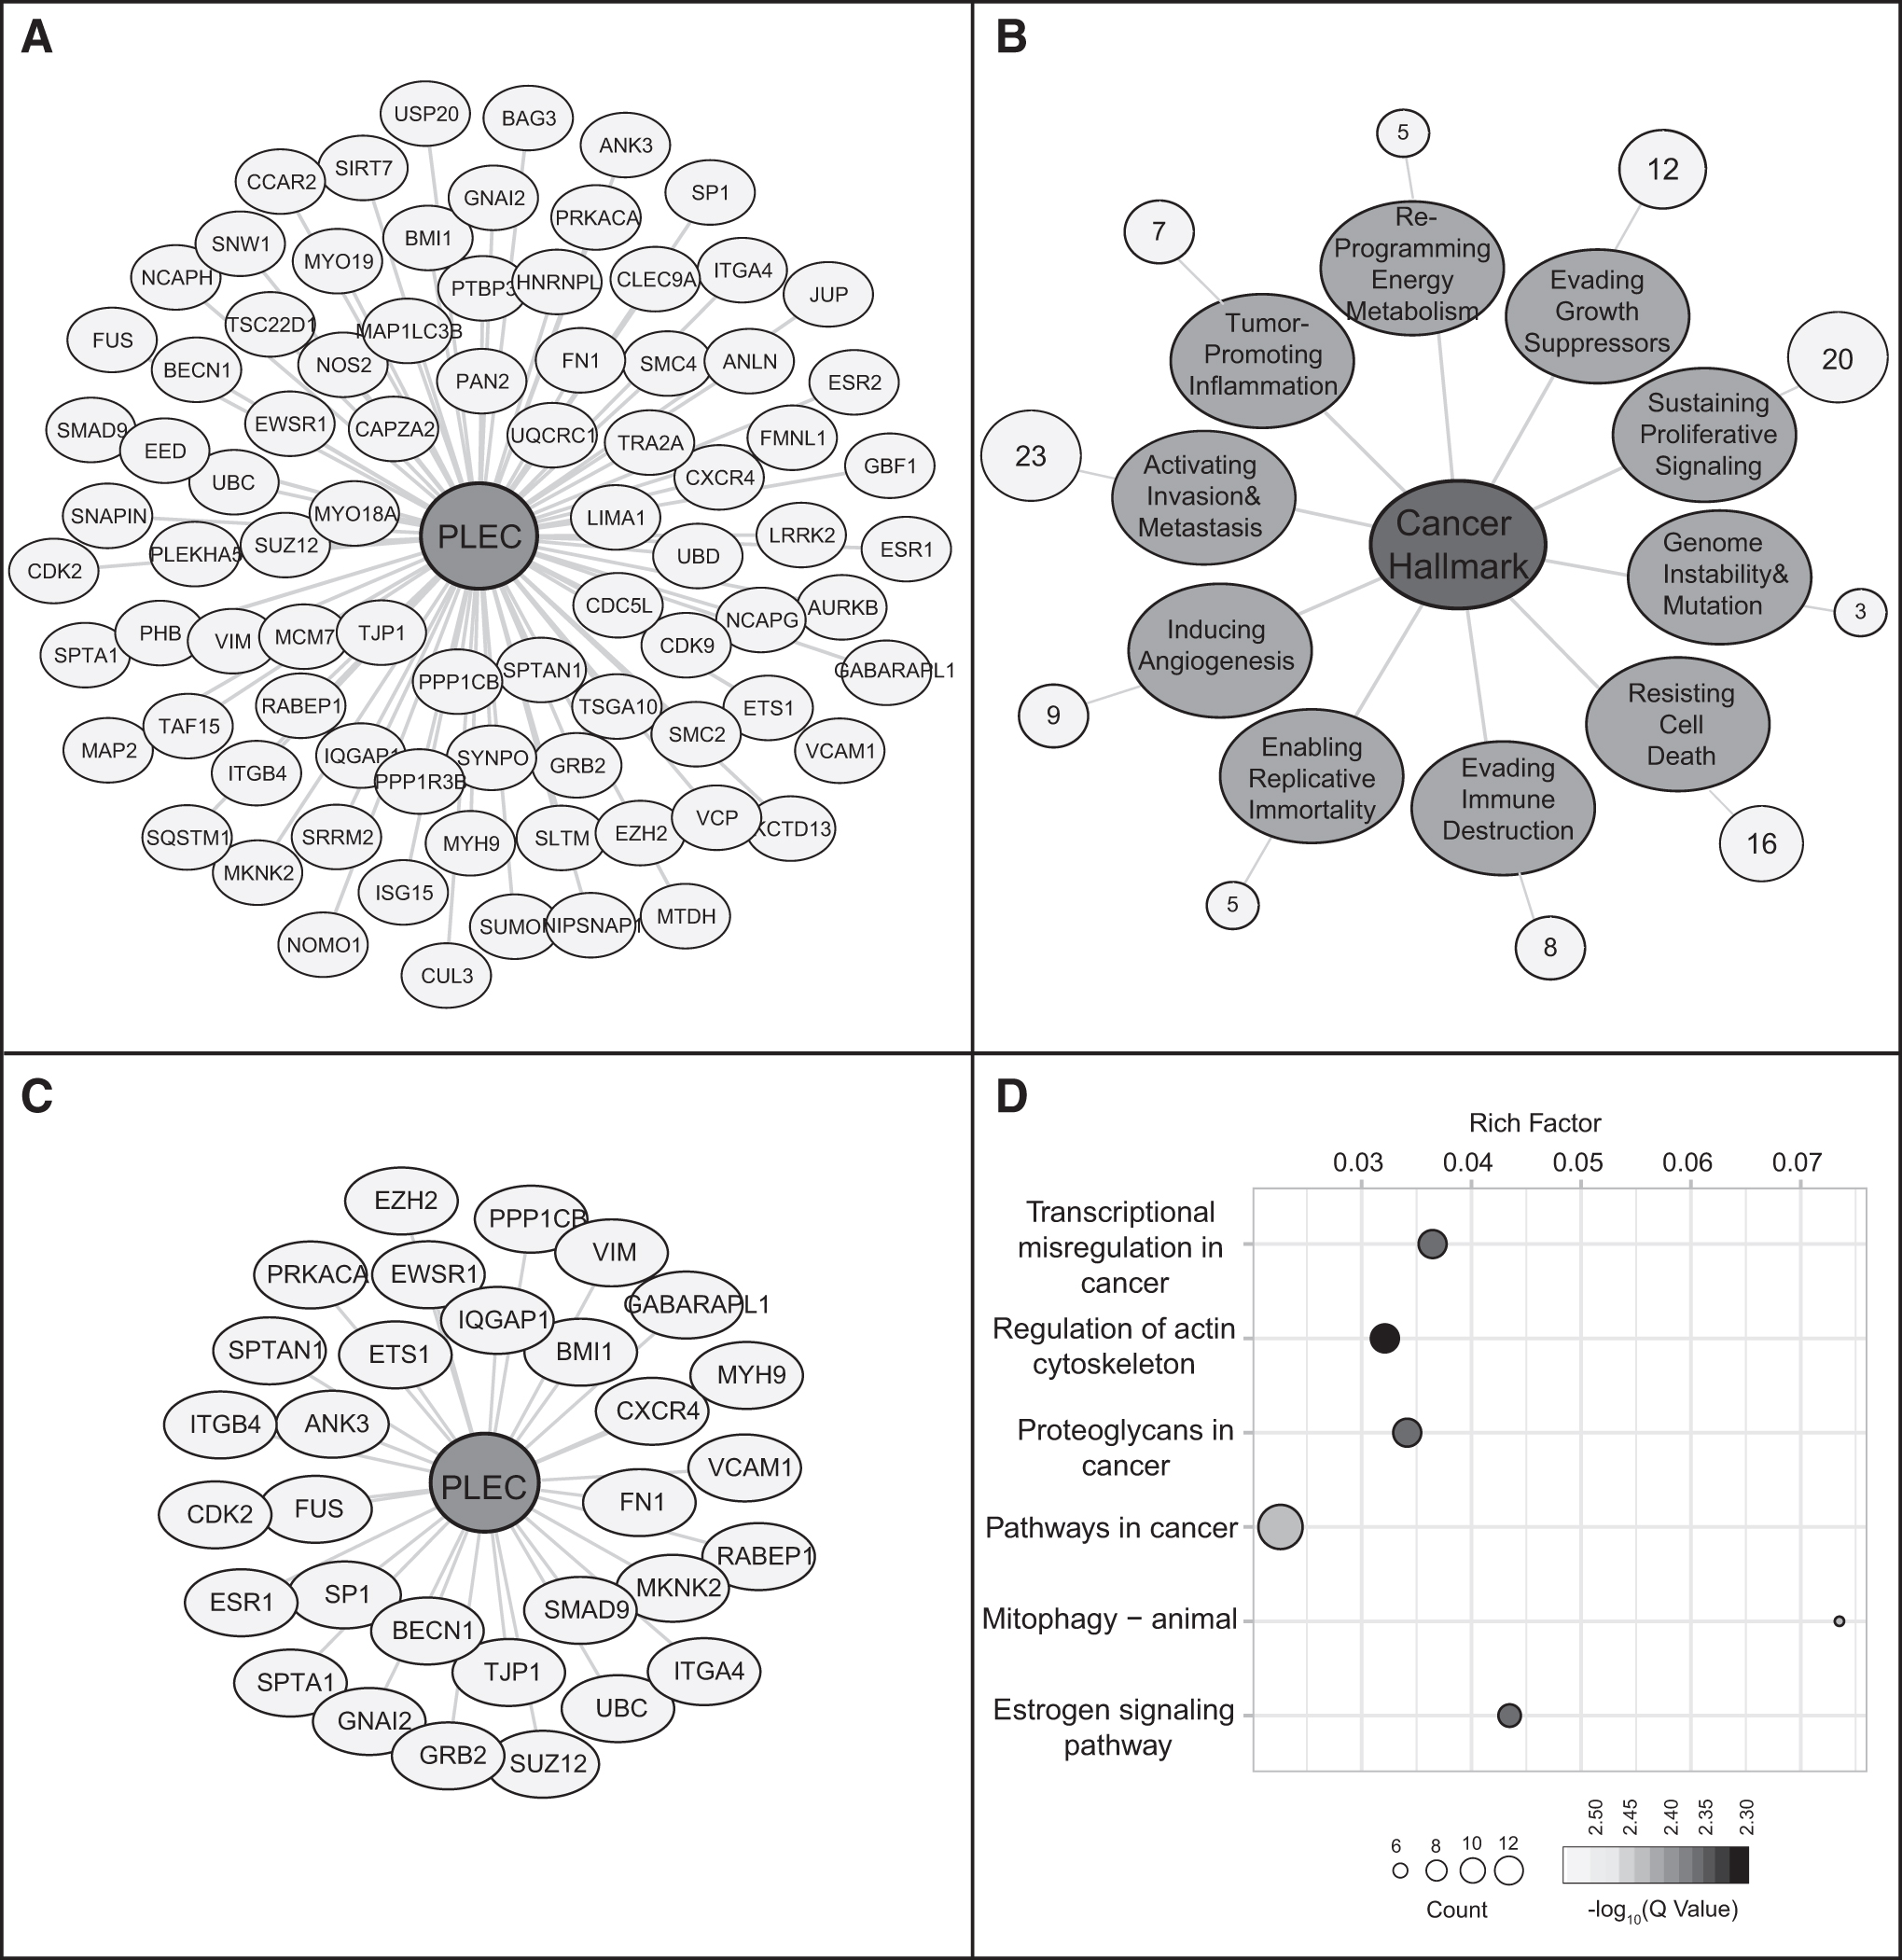
Functional enrichment analysis of plectin
Evaluation of the impact of PLEC and its transcript isoforms in human cancers with the aspect of expression, diagnosis, and prognosis
The present study focused on PLEC and its eight transcript isoforms in 12 cancer types and four cancer stages to evaluate whether PLEC and/or its transcript isoforms could be used as a biomarker or therapeutic agent to detect cancer initiation or the progression of tumor formation.
PLEC
Considering the mRNA expression levels of PLEC in 12 cancers, although statistically significant changes in PLEC expression were detected in some cancers, the level of change remained quite low, and none of the cancers was found to meet FC ≥2 criteria (Fig. 3A and Supplementary Table S1). In addition, the diagnostic performance of plectin was analyzed in terms of AUC metric; notable but limited diagnostic performance could be achieved in five of the cancers analyzed, that is, AUC values were ≥70% in BRCA, KIRC, LIHC, STAD, and THCA (Supplementary Table S2). Moreover, the OS analysis considering the PLEC gene expression demonstrated that plectin has a statistically significant (p < 0.05) prognostic performance in only COAD, HNSC, and KIRC patients with HR of 1.55, 1.34, and 1.53, respectively (Supplementary Table S3).
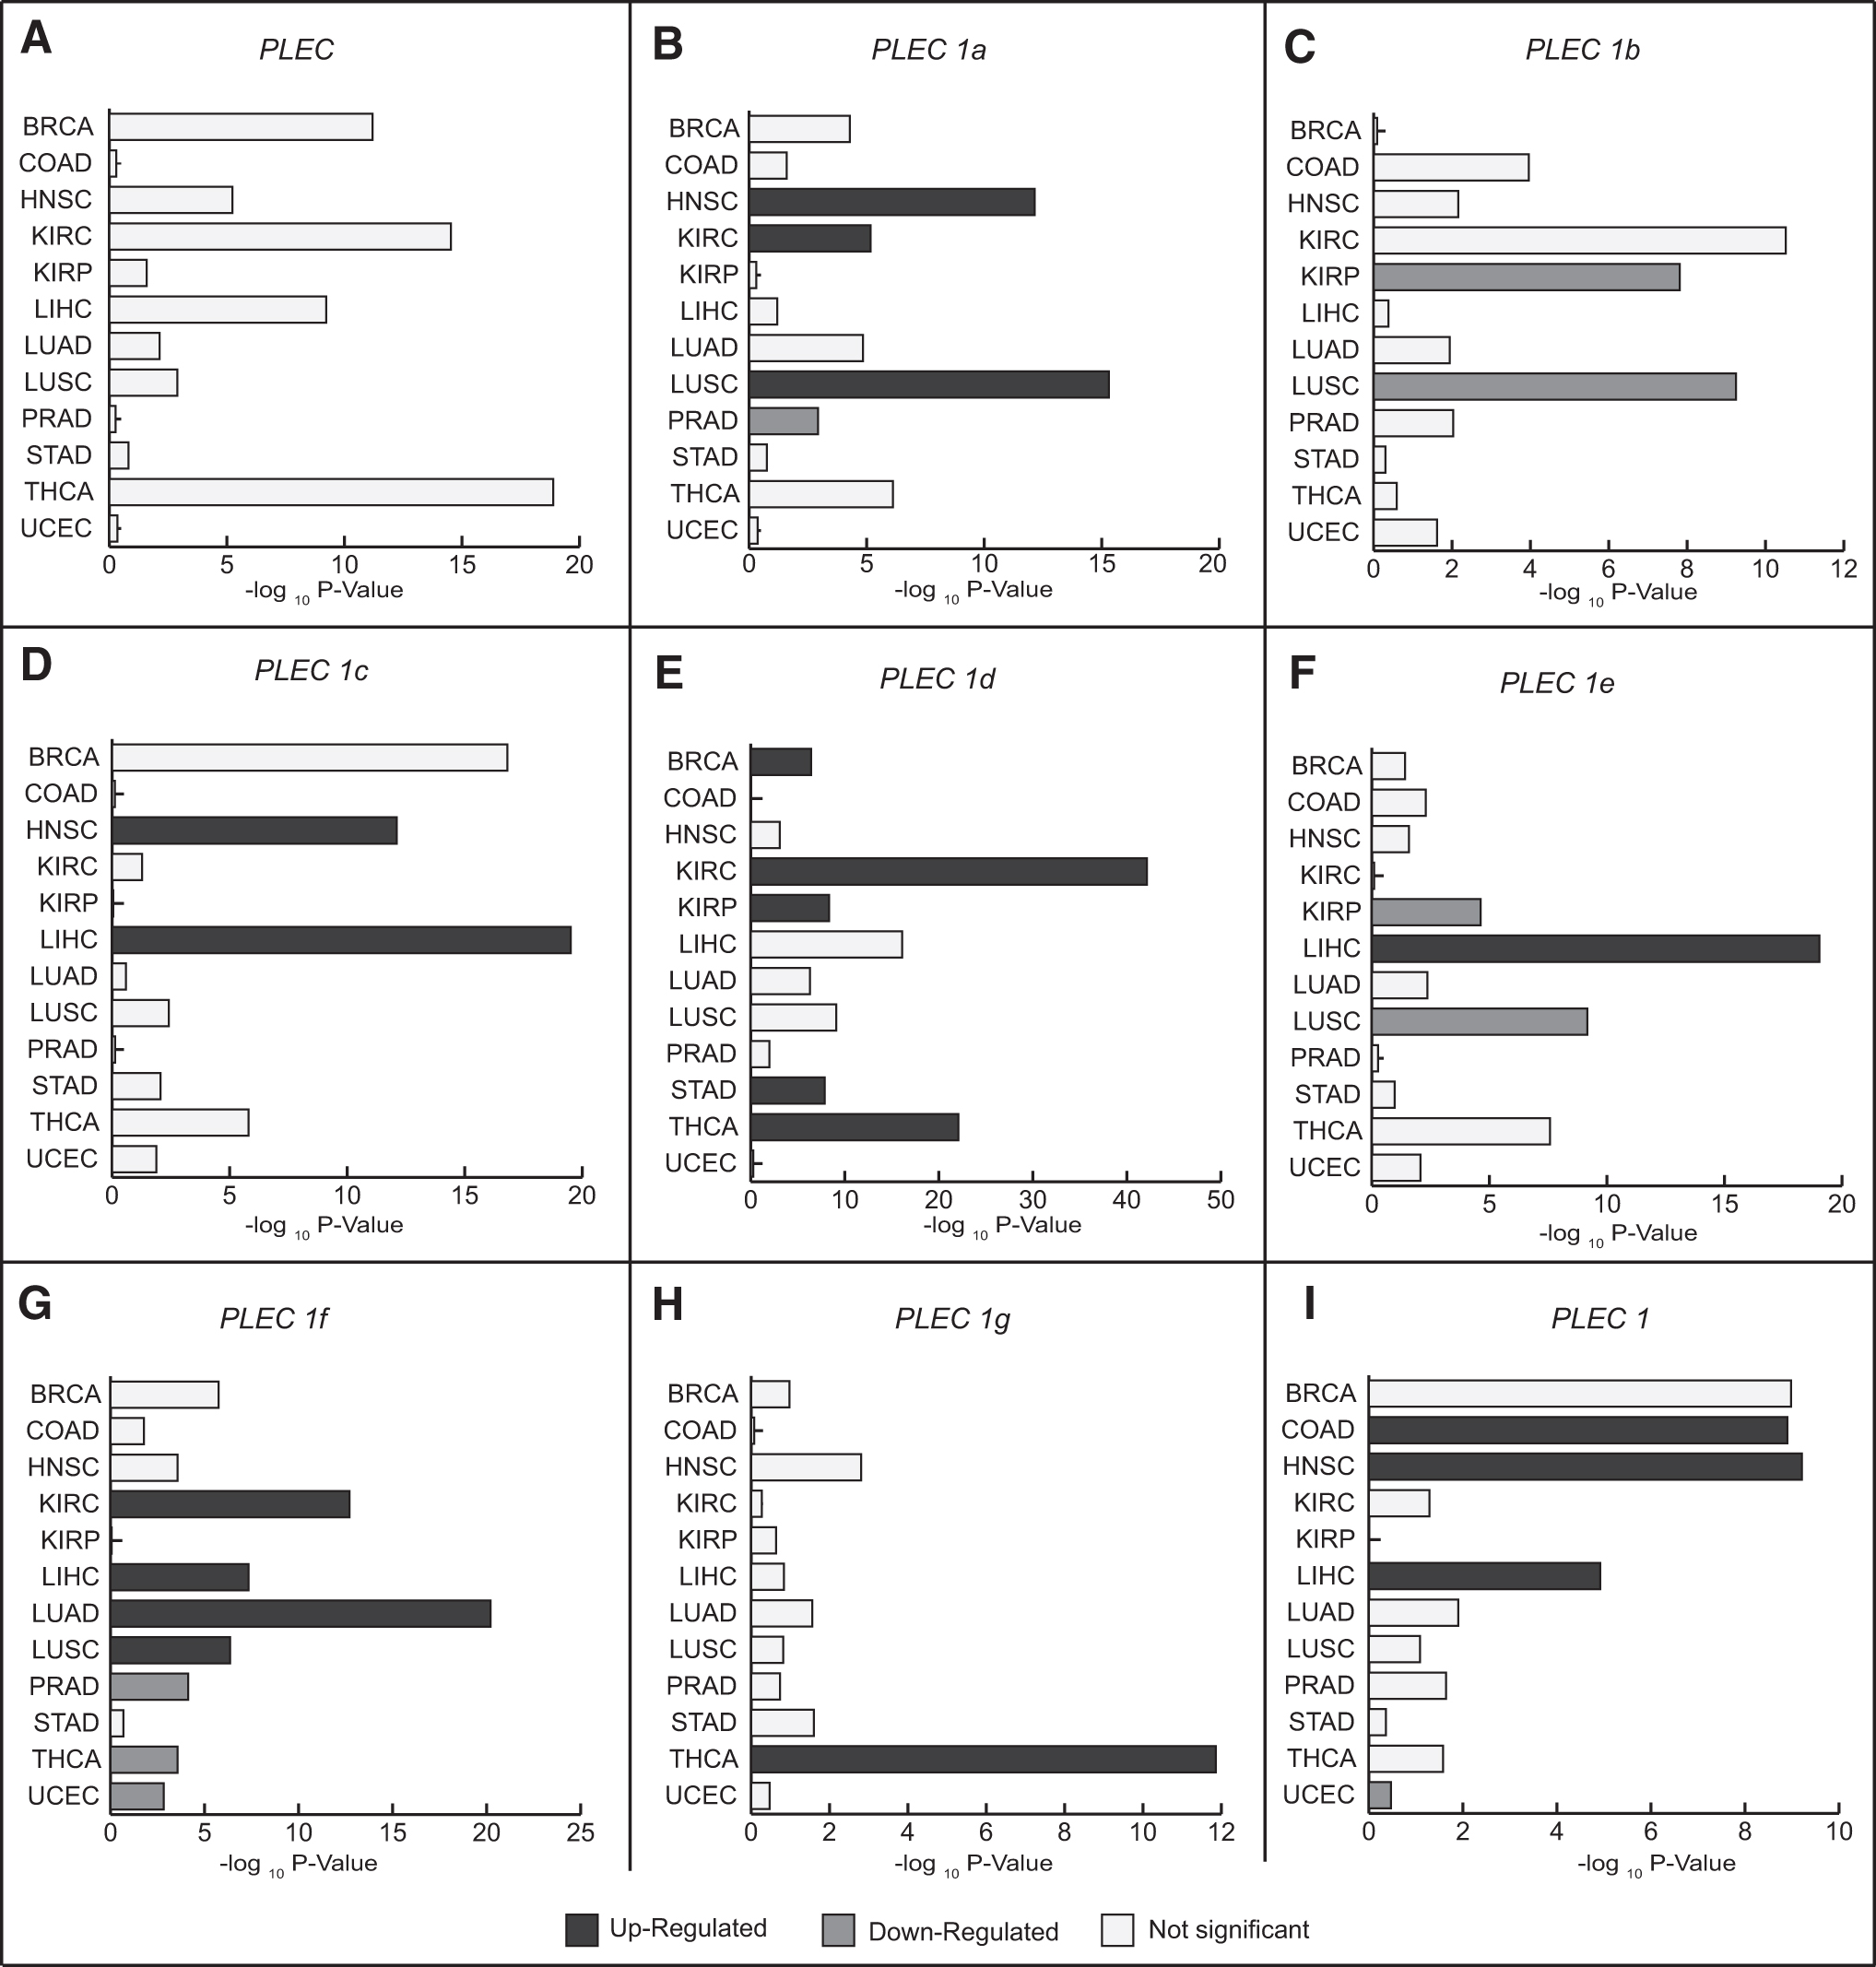
Differential mRNA expression levels of plectin isoforms
PLEC 1a
The mRNA expression level of PLEC 1a was increased in HNSC, KIRC, and LUSC patients compared with controls, but its expression was downregulated in PRAD (Fig. 3B). In addition, stage-wise comparisons showed that PLEC 1a was upregulated in HNSC with stages II, III, IV, in KIRC with stages I, IV, in LUSC with stages I, II, III, and in THCA with stages III and IV (Table 2). Furthermore, PLEC 1a was considered capable of distinguishing tumor samples from normal tissue only in HNSC patients with stage II (AUC = 0.747) and in KIRC patients with stage IV (AUC = 0.72) (Table 2 and Supplementary Table S2). Herein, it should also be noted that statistically significant diagnostic performance of PLEC 1a was observed only for LUSC (AUC = 0.769) when stage information was ignored (Fig. 4A). Prognostic analysis showed that PLEC 1a was associated with poor survival of BRCA patients with stage I (HR = 4.08, p = 0.017), COAD patients with stage II (HR = 4.73, p = 0.006), and LIHC patients with stage I (HR = 2.18, p = 0.015) (Supplementary Table S3).

Diagnostic impact of plectin isoforms with significant differential expression in patients compared with controls.
Significant Plectin Isoforms with Cancer Stage-Specific Expression and AUC Value
AUC, area under the ROC curve; HNSC, head and neck squamous cell carcinoma; KIRC, kidney renal clear cell carcinoma; LUSC, lung squamous cell carcinoma; THCA, thyroid carcinoma; COAD, colon adenocarcinoma; KIRP, kidney renal papillary cell carcinoma; BRCA, breast invasive carcinoma; LUAD, lung adenocarcinoma; LIHC, liver hepatocellular carcinoma; UCEC, uterine corpus endometrial carcinoma.
Moreover, KM plot analysis displayed that PLEC 1a was associated with overall survival of KIRP patients regardless of stage (HR = 1.92, p = 0.034) (Supplementary Table S3). On the other hand, there is no correlation between the expression level of PLEC 1a and OS of patients in these cancer types (Supplementary Tables S1 and S3).
PLEC 1b
Transcript isoform-specific mRNA expression level analysis displayed that PLEC 1b was significantly downregulated in KIRP and LUSC patients compared with controls (Fig. 3C). In addition, PLEC 1b expression was found to be decreased in COAD with stage II, in KIRC with stages III and IV, in KIRP with all four cancer stages, and in LUSC with stages I and III (Table 2). Furthermore, diagnostic performance analysis through ROC curves showed that PLEC 1b was capable of discriminating tumor samples from normal tissue in KIRP patients (AUC = 0.804) (Fig. 4B). Stage-wise analyses resulted in significant diagnostic performance in other cancers, including COAD with stage II (AUC = 0.765) and KIRC with stages III (AUC = 0.785) and IV (AUC = 0.798), as well as KIRP with all four stages (AUC = 0.79 to 0.841), and LUSC with stages I (AUC = 0.781) and III (AUC = 0.787) (Table 2).
In addition, PLEC 1b was associated with the OS of KIRC patients with all stages (HR = 1.564, p = 0.003) and stage I (HR = 1.959, p = 0.027), as well as BRCA patients with stage III (HR = 1.824, p = 0.048) (Supplementary Table S3). In contrast, PLEC 1b expression was not significant according to our evaluation criteria (FC ≥2 and p < 0.01) in KIRC and BRCA patients (Supplementary Tables S1 and S3).
PLEC 1c
Considering the TCGA cohort, PLEC 1c mRNA expression was upregulated in HNSC with stages II, III, and IV and in LIHC with stages I, II, and III (Fig. 3D and Table 2). Although considerable diagnostic power was detected only for LIHC (AUC = 0.70, Fig. 4C) regardless of stage information, stage-wise analyses demonstrated that it was limited to patients at stage III (AUC = 0.706) and considerable diagnostic performance was also detected for HNSC patients with stage II (AUC = 0.715) (Table 2 and Supplementary Table S2). PLEC 1c expression was associated with the overall survival of KIRC patients with all stages (HR = 2.109, p < 0.001), as well as with stage I (HR = 2.357, p = 0.007) and stage III (HR = 2.487, p = 0.002). In addition, significant prognostic associations were also observed in BRCA patients with stage I (HR = 3.704, p = 0.028) and in THCA patients with all stages (HR = 3.121, p = 0.038) (Supplementary Table S3). In contrast, mRNA expression level of PLEC 1c was not significant according to our evaluation criteria (FC ≥2 and p < 0.01) in BRCA, KIRC, and THCA patients (Supplementary Table S1).
PLEC 1d
mRNA expression level of PLEC 1d was increased in BRCA, KIRC, KIRP, STAD, and THCA patients compared with controls (Fig. 3E). Moreover, stage-wise expression analyses showed that PLEC 1d expression was significantly upregulated at all four stages of these cancers (Table 2 and Supplementary Table S1). PLEC 1d also showed considerable diagnostic performance (AUC >0.70) in discriminating cancer samples from normal tissues in KIRC, KIRP, STAD, and THCA regardless of stage (Fig. 4D–G) and at all stages (Table 2 and Supplementary Table S2). However, appropriate AUC value (AUC = 0.72) was obtained in BRCA patients only with stage IV. In addition, increased expression of PLEC 1d was found to be correlated with poor survival in KIRC patients (HR = 2.495, p < 0.001, Fig. 5A, B), especially those at stage III (HR = 2.734, p = 0.001, Fig. 6A, B) and stage IV (HR = 1.916, p = 0.007, Fig. 6C, D).

Prognostic impact of differentially expressed plectin isoforms.
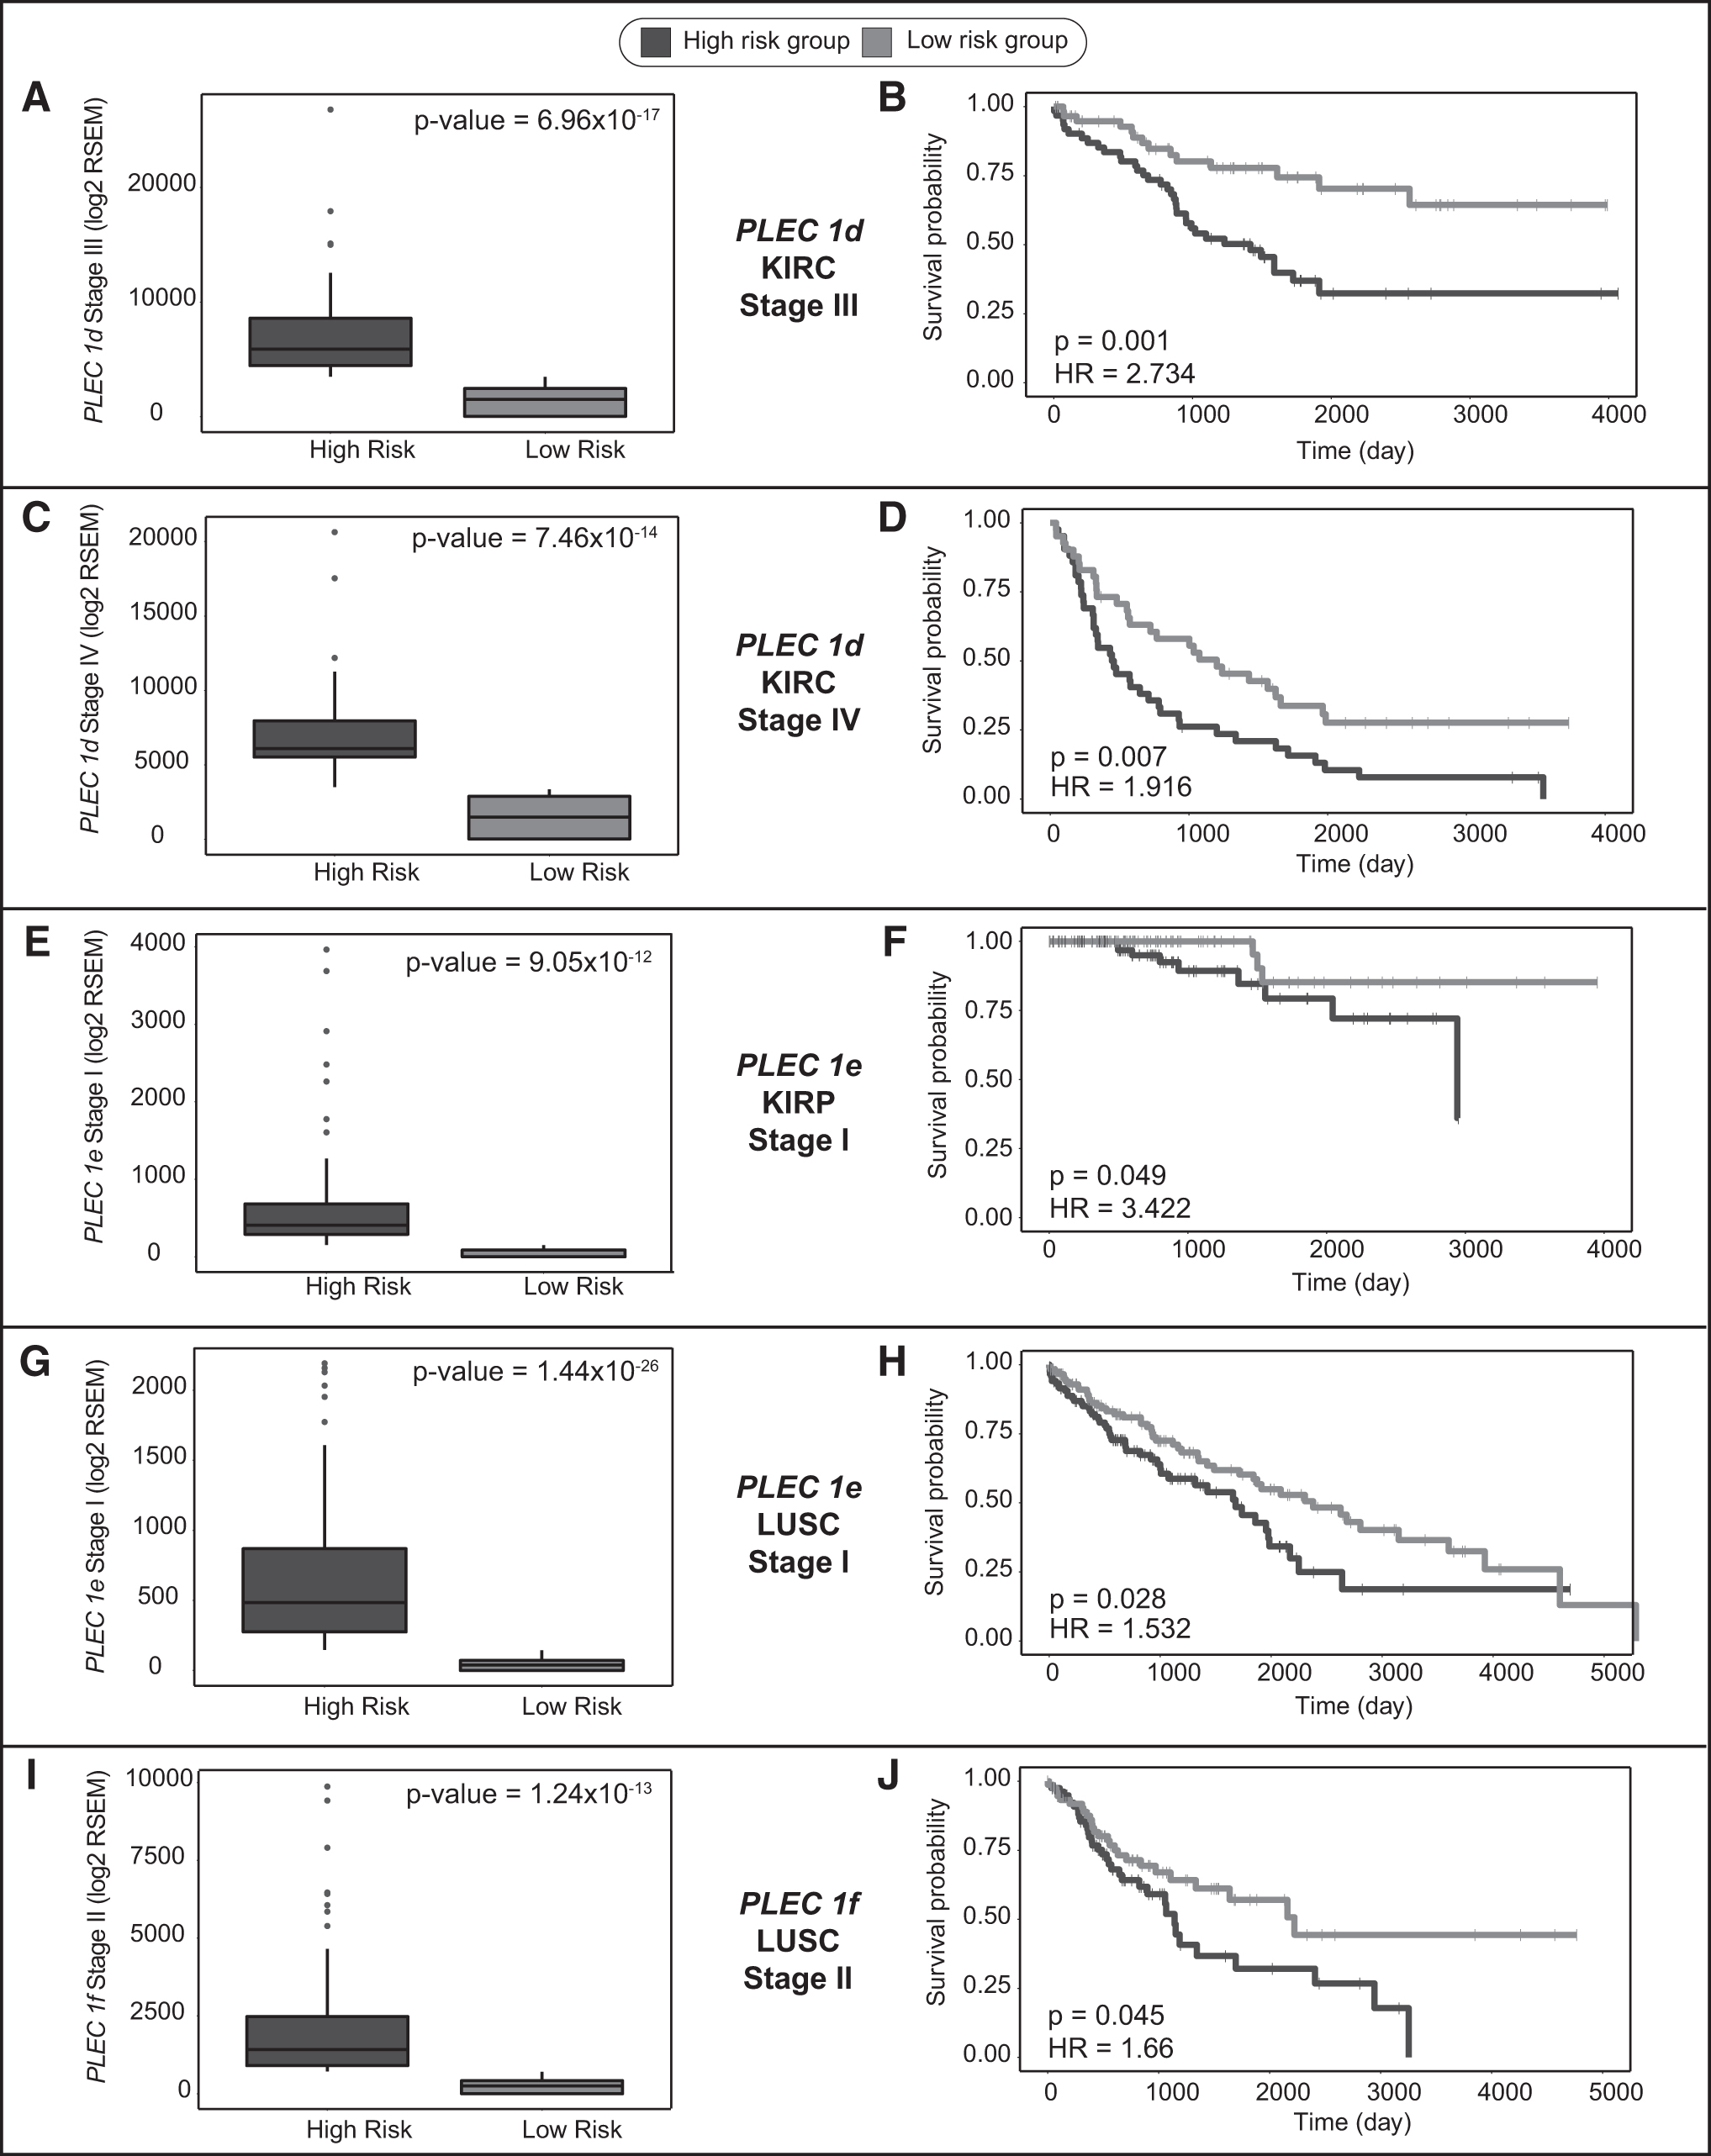
Cancer stage-specific prognostic impact of plectin isoforms.
PLEC 1e
Similar to PLEC 1b, expression of PLEC 1e was detected as downregulated in KIRP and LUSC; however, it was upregulated in LIHC patients compared with controls (Fig. 3F). Although diagnostic performance of PLEC 1e was very limited (AUC <0.70) when patients are included in the analysis without considering stage information (Supplementary Table S2), stage-wise analyses demonstrated considerable diagnostic performance in discriminating cancer samples from normal tissues in KIRP patients with stages I (AUC = 0.838) and II (AUC = 0.842), in LIHC patients with stage III (AUC = 0.727), in UCEC patients with stage III (AUC = 0.73), and in LUSC patients with all stages (Table 2). In addition, increased expression of PLEC 1e was found to be correlated with poor survival in LUSC patients regardless of stage (HR = 1.52, p = 0.002, Fig. 5C, D), as well as in KIRP and LUSC patients at stage I (HR = 3.422, p = 0.049, HR = 1.532, p = 0.028; Fig. 6E–H, respectively).
Moreover, statistically significant prognostic performance of PLEC 1e was also observed in KIRC patients with stage III, in HNSC patients with stage IV, and in BRCA patients with stage III (p < 0.05, Supplementary Table S3). In contrast, it should be noted that PLEC 1e expression was not considered as significant in these cancer types (Supplementary Table S1).
PLEC 1f
mRNA expression levels of PLEC 1f were significantly upregulated in KIRC, LIHC, LUAD, and LUSC, and were downregulated in PRAD, THCA, and UCEC patients compared with control group (Fig. 3G). However, stage-based expression analyses showed that expression of PLEC 1f was increased in KIRC with stages I, II, and IV; in LIHC with stages I, II, and III; in LUAD with stages I, II, and III; and in LUSC with stages II and III (Table 2). In contrast, PLEC 1f expression was found to be highly decreased in COAD patients with stage II, in THCA patients with stages I and III, and in UCEC patients with stages I, III, and IV (Table 2). PLEC 1f showed considerable diagnostic performance in discriminating cancer samples from normal tissues in LUAD, PRAD, and UCEC patients regardless of stage (Fig. 4H–J).
Moreover, stage-wise analyses demonstrated considerable diagnostic performance in UCEC patients with stages I (AUC = 0.832), III (AUC = 0.816), and IV (AUC = 0.881), in COAD patients with stage II (AUC = 0.747), in KIRC patients with stage IV (AUC = 0.723), in LUAD patients with stages II (AUC = 0.781) and III (AUC = 0.713), and in THCA patients with stage III (AUC = 0.702) (Table 2). Furthermore, increased expression of PLEC 1f was found to be correlated with poor survival in LUSC patients (HR = 1.381, p = 0.017, Fig. 5E, F), especially those at stage II (HR = 1.66, p = 0.045, Fig. 6I, J).
PLEC 1g
The transcript isoform PLEC 1g was significantly upregulated only in THCA patients compared with controls (Fig. 3H). Considering cancer stages, PLEC 1g was upregulated in THCA with stages I, III, and IV; however, it was remarkably downregulated in UCEC patients with metastatic stage IV (Table 2). On the other hand, no considerable diagnostic or prognostic performance was detected in THCA cohort in our analyses (Supplementary Tables S2 and S3). However, decreased PLEC 1g expression showed considerable diagnostic performance in only UCEC patients with stage IV (AUC = 0.748, Table 2).
PLEC 1
Transcript isoform-specific expression analysis showed that PLEC 1 was significantly upregulated in COAD, HNSC, and LIHC as well as downregulated in UCEC patients compared with controls (Fig. 3I). Moreover, stage-wise analyses revealed an increased PLEC 1 expression in COAD and HNSC patients with stages II, III, and IV, and in LIHC patients with stages I and II besides a decreased expression in UCEC patients with stage IV (Table 2). Diagnostic performance analyses through ROC curves demonstrated that expression level of PLEC 1 could be used as a diagnostic indicator in COAD (AUC = 0.734, Fig. 4K) and in UCEC (AUC = 0.74, Fig. 4L). Furthermore, stage-wise analyses showed that mRNA expression level of PLEC 1 with stages II, III, and IV in COAD patients as well as with stage IV in UCEC patients has considerable discriminative ability to differentiate normal and tumor tissues (AUC >0.70, Table 2). On the other hand, no considerable prognostic performance was detected in any cancer type (Supplementary Table S3).
Discussion
In the current study, a pan-cancer analysis was performed for the first time to demonstrate the differential expression levels of plectin isoforms besides the PLEC gene in various cancers, and the prognostic and diagnostic performances of the transcript isoforms were evaluated in four stages of different cancers. Overall, the data show that not the PLEC but its specific transcript isoforms demonstrate differential expression in various cancers, display high diagnostic and/or prognostic performance in specific cancer types, and have the potential as candidate biomarkers for carcinogenesis or cancer progression.
Plectin is a versatile protein with a number of isoforms encoded to function at various structures such as mitochondria, nucleus, Z-discs in muscle, hemidesmosomes, focal adhesions, and podosomes (Andrä et al., 2003; Castañón et al., 2013; Hoshino et al., 2013; Konieczny et al., 2008; McInroy and Määttä, 2011; Rezniczek et al., 2007; Staszewska et al., 2015; Winter et al., 2008). Thus, it plays a critical role in cell–cell interaction, cellular integrity, and cell migration. Inactivation of plectin has been shown to cause tissue degeneration and mortality in mice at 3 days after birth (Andrä et al., 1997). In contrast, upregulation of plectin has been associated with variable distinct types of cancer (Bausch et al., 2011; Buckup et al., 2021; Katada et al., 2012; Raymond et al., 2019) and has been linked to poor disease prognosis in lung and pancreatic cancers (Raymond et al., 2019; Shin et al., 2013). In addition, several studies indicated that plectin is mislocalized in ovarian, head and neck, prostate, and pancreatic cancer tissues (Bausch et al., 2009; Katada et al., 2012; Kelly et al., 2008; Reynolds et al., 2011; Shin et al., 2013).
There are also other findings suggesting that plectin plays a critical role in cancer cell migration and metastasis (McInroy and Määttä, 2011; Takkunen et al., 2010; Yoneyama et al., 2014). Yoneyama et al. (2014) demonstrated that the expressions of both vimentin intermediate filament and plectin were elevated in metastatic bladder cancer cell lines. In addition, knockdown of plectin in colon carcinoma cell lines disrupted the actin filament organization and arrested cell invasion, migration, and adhesion (McInroy and Määttä, 2011). Furthermore, cell invasion and migration were found to be inhibited in HNSC, breast cancer, NSCLC, and hepatocellular carcinoma (HCC) cell lines in which PLEC was knocked down (Boczonadi et al., 2007; Katada et al., 2012; Raymond et al., 2019; Xu et al., 2023). In contrast, transient suppression of plectin in Chang liver cells was resulted in increased cell migration, which is a controversial outcome in comparison to the report of Xu et al. (Chiung-Chi et al., 2015; Xu et al., 2023).
Although high plectin expression was correlated with poor survival in patients with lung adenocarcinoma and lung cancer in nonsmokers (Raymond et al., 2019), increased plectin levels were also associated with better survival in patients with lung squamous carcinoma (Raymond et al., 2019). All of these findings underscore that plectin has biological significance not only as a cytolinker but also as a regulator of tumorigenesis. However, how plectin and especially its unique isoforms are involved in carcinogenesis remains to be elucidated.
Perez et al. (2021) evaluated several studies to emphasize the role of plectin as a cancer hallmark. They underlined that not only intracellular but also cell surface plectin may guide malignancy, its increased expression level correlate with poor survival across distinct cancer types according to the data from TCGA repositories (Nagy et al., 2021) and how cancer-specific plectin can be a therapeutic target to impede tumorigenesis. However, this evaluation was restricted mainly to PLEC not the isoforms of the gene at all.
Our functional enrichment analysis precisely supported that plectin is involved in several cancer hallmarks, such as stimulation of invasion and metastasis, sustaining proliferative signaling, and resisting cell death, which promote tumorigenesis. In addition, plectin interacts with 23 proteins that act on invasion and metastasis. Previously, upregulation of vimentin and plectin in highly metastatic bladder cancer cells was found to promote cancer cell invasion by enabling invadopodia formation (Yoneyama et al., 2014). There are also other studies that support the involvement of plectin in the regulation of invasiveness (McInroy and Määttä, 2011; Shin et al., 2013).
One of the emerging topics to figure out the mechanism of cancer cell invasion and migration is mechanobiology. It focuses on the interaction between cells and their environment to understand the effect of forces on cellular functions such as differentiation, movement, and proliferation. Since plectin is an important mediator of cytoskeletal systems to establish a connection between the cell and the ECM, it maintains mechanical stability and thus tissue architecture. Several previous studies have shown that loss of plectin disrupts the organization of the keratin network, resulting in disruptions of cell–cell junctions (Krausova et al., 2021; Prechova et al., 2022; Walko et al., 2011). Thus, this type of abnormal physical rearrangements alters the physical properties of the tissue, create pathways for invasion and facilitate cell motility to promote cancer progression. For this reason, plectin and its functional isoforms are of great importance in understanding how cancer cells invade and migrate through tissues. Therefore, the question arises as to which plectin isoforms are involved in invasiveness and metastasis in different cancers.
In this situation, the elevated mRNA expression of PLEC 1d in BRCA is correlated with the AUC value only with stage IV, indicating that PLEC 1d may be a diagnostic marker in metastatic BRCA patients. In addition, considerable AUC values associated with increased PLEC 1d mRNA expression at all four stages of STAD and THCA may indicate the potential diagnostic significance of this isoform. As for KIRC patients, the significantly increased mRNA expression of PLEC 1d at all disease stages, correlation with OS especially at stages III and IV and having considerable AUC values suggest that PLEC 1d may play a role in cell migration and can be used as a metastatic biomarker for KIRC. However, this isoform may also be a diagnostic marker to discriminate tumor and normal tissues in KIRP patients with all four cancer stages.
Our comprehensive expression, OS and ROC curve analyses in COAD patients showed that elevated expression of PLEC 1 may be a diagnostic indicator to assess the progression of COAD. However, although studies on SW480 colon carcinoma cell lines indicate that plectin 1, 1d, and 1k (EST clone, BP315239) are mainly localized to podosome-like structures (McInroy and Määttä, 2011), we could not obtain any significant data for especially PLEC 1d in COAD to support that outcome. On the other hand, high expression of PLEC 1 in COAD patients with stages II, III, and IV reveals the potential impact of this isoform as a metastatic marker. In HNSC patients, the increased mRNA expression levels of PLEC 1a and PLEC 1c can be an indicator to distinguish tumor and normal tissues only with stage II, allowing progression to be followed and indicating the onset of metastasis. In addition, although there are contradictory reports to understand the effect of plectin on HCC (Chiung-Chi et al., 2015; Xu et al., 2023), high expression level of PLEC 1c and PLEC 1e and their association with appropriate AUC values suggest that these two isoforms may be potent diagnostic markers to predict metastatic progression of LIHC patients.
In LUAD patients, increased PLEC 1f expression was found to be correlated with appropriate AUC values with stage II and III suggesting that PLEC 1f may be a diagnostic but not a prognostic marker in the absence of data for OS analysis. Moreover, the upregulated mRNA expressions of PLEC 1a and PLEC 1f in different stages of LUSC patients compared with healthy controls do not show the ability to accurately distinguish tumor tissue from normal tissue. However, our data demonstrated that downregulated PLEC 1e and upregulated PLEC 1f negatively affect OS of LUSC patients. The significant correlation between the AUC values and diminished expression level of PLEC 1e and PLEC 1b in LUSC patients with distinct stages reveal the cancer stage-specific diagnostic impact of these two isoforms. In contrast, according to the KM plot analysis of LUSC patients, although PLEC 1e appears to be the major isoform for tracking disease progression and determining the presence of tumor tissue, there is a contradiction between PLEC 1e expression level in patients in the high-risk group compared with the low-risk group and in patients overall compared with the healthy controls. Thus, detailed experimental studies should be conducted to make an accurate interpretation.
As for PRAD patients, there are not many data to draw conclusions about the isoforms of plectin. However, extremely low mRNA expression levels of PLEC 1 and PLEC 1f in UCEC patients compared with healthy controls are associated with highly adequate AUC values, also suggesting that these isoforms may have diagnostic significance for UCEC.
Although we have gained some interesting findings to understand the involvement of plectin isoforms in cancer development, our research has some limitations. First, only transcript isoform-based expression analyses were performed, but no protein isoform-based data could be obtained to consolidate our results. Second, this study lacks in vitro and in vivo assays to confirm the findings. In our present data, the association between the reduced expression level of PLEC 1, PLEC 1e, and PLEC 1f in related cancer types and tumor formation suggests that these plectin isoforms should be considered as tumor suppressors, and further studies should be performed to investigate the involvement of these isoforms in tumorigenesis. As for PLEC 1d, which has been detected in podosome-like adhesion sites (McInroy and Määttä, 2011) and acts on cell migration, may be one of the peculiar protein isoforms that stimulates and maintains metastasis in various cancers, such as BRCA, KIRC, KIRP, STAD, and THCA. Consequently, dysregulation of all these plectin isoforms especially, PLEC 1d and PLEC 1f in KIRC and LUSC, respectively, need to be considered and further comprehensive experimental studies should be conducted.
Conclusions
Our findings highlight that transcript and protein isoform-based analyses, especially for the detection of prognostic and diagnostic markers, would be highly informative and avoid data leakage in any type of disease, including cancer. To obtain accurate, reliable, and pinpoint results, not only isoform-level differential expression, OS, and ROC curve analyses should be performed, but also isoform-level cancer stage-based studies should be considered. In this way, it will be easier to capture reliable and valid biomarkers for each type of cancer.
Plectin was identified as a cancer biomarker decades ago. Since then, there has been increasing curiosity about plectin and its isoforms to understand how they act on tumorigenesis. However, there were not sufficient data to expand our understanding of PLEC and its isoforms, and clarify their roles as cancer biomarkers, initiators, or promoters. To date, almost all data have been obtained from plectin rather than plectin isoforms to understand the involvement of this protein in the biological mechanisms of cancer. In this study, we have shown that there are dysregulated transcript isoforms of PLEC in various cancers, whereas the mRNA expression level of PLEC itself does not change significantly or is slightly upregulated. In addition, the data that we obtained from PLEC were not considerable in terms of our evaluation criteria. Thus, it was concluded that detecting the expression level of PLEC in different types of cancer was not sufficient to predict tumor tissue and its progression and might give false-positive/negative results. Therefore, comprehensive isoform-based analyses of PLEC are to be needed.
Footnotes
Authors' Contributions
H.G. conceived the study. H.G. and K.Y.A. supervised the study. M.K. acquired the data and performed data analysis. All authors wrote and approved the final version of the article.
Author Disclosure Statement
The authors declare that the research was conducted in the absence of any commercial or financial relationships that could be construed as a potential conflict of interest.
Funding Information
No funding was received for this article.

Abbreviations Used
References
Supplementary Material
Please find the following supplemental material available below.
For Open Access articles published under a Creative Commons License, all supplemental material carries the same license as the article it is associated with.
For non-Open Access articles published, all supplemental material carries a non-exclusive license, and permission requests for re-use of supplemental material or any part of supplemental material shall be sent directly to the copyright owner as specified in the copyright notice associated with the article.
