




Abstract
Tumor mutation burden (TMB) has profound implications for personalized cancer therapy, particularly immunotherapy. However, the size of the panel and the cutoff values for an accurate determination of TMB are still controversial. In this study, a pan-cancer analysis was performed on 22 cancer types from The Cancer Genome Atlas. The efficiency of gene panels of different sizes and the effect of cutoff values in accurate TMB determination was assessed on a large cohort using Whole Exome Sequencing data (n = 9929 patients) as the gold standard. Gene panels of four different sizes (i.e., 0.44–2.54 Mb) were selected for comparative analyses. The heterogeneity of TMB within and between cancer types is observed to be very high, and it becomes possible to obtain the exact TMB value as the size of the panel increases. In panels with limited size, it is particularly difficult to recognize patients with low TMB. In addition, the use of a general TMB cutoff can be quite misleading. The optimal cutoff value varies between 5 and 20, depending on the TMB distribution of the different tumor types. The use of comprehensive gene panels and the optimization of TMB cutoff values for different cancer types can make TMB a robust biomarker in precision oncology. Moreover, optimization of TMB can help accelerate translational medicine research, and by extension, delivery of personalized cancer care in the future.
Introduction
Cancer immunotherapy is one of the most important therapeutic options along with chemotherapy in cancer care. Immunotherapies, such as immune checkpoint blockade (ICB), activate the patient's immune cells and actually enable personalized treatments (Nakajima and Nakatsura, 2020). Cancer cells suppress immunity by using immune checkpoint inhibitor (ICI) receptors on the surface of T cells. By inactivating these receptors with ICB, T cells are induced to fight cancer cells (Shiravand et al., 2022). Notably, among the ICI receptors, nivolumab, pembrolizumab, and cemiplimab for programmed cell death protein 1 (PD-1); avelumab, durvalumab, atezolizumab for programmed cell death ligand 1 (PD-L1); ipilimumab for CTLA-4; and relatlimab for LAG-3, are currently Food and Drug Administration (FDA)-approved drugs for immunotherapy (Zhou et al., 2022). Advances in translational medicine and molecular biomarkers are essential, however, to move toward personalized cancer care and precision oncology (Fujiwara et al., 2024).
Tumor mutation burden (TMB) has emerged as a critical parameter in the field of molecular oncology and stands as a cornerstone in the landscape of precision oncology and translational medicine research. TMB is a measure of the total number of genetic mutations or alterations in the DNA of a cancerous tumor, thus providing a quantitative measure of the mutational load within a tumor and the genomic instability that is a hallmark of cancer and is responsible for the accumulation of mutations that drive tumor progression (Taylor et al., 2018). These mutations include various genetic changes, including single nucleotide substitutions, insertions, deletions, and structural variations that contribute to genomic diversity within the tumor. This genomic metric plays a critical role in cancer therapy by providing a comprehensive view of a tumor's genomic complexity and instability, supporting treatment decisions, predicting response to immunotherapy, and optimizing therapeutic strategies, especially in the era of precision medicine and immunotherapy. Hence, TMB has profound implications for personalized cancer therapy, particularly immunotherapy.
TMB is defined as the calculation of somatic mutations that alter protein sequences per megabase (Mb) of the genome (Chu and Wei, 2019; Tang et al., 2020) and is classified as low, intermediate, or high so as to clinically compare the mutation burden of patients. However, there is no universal consensus on a specific cutoff value for TMB in all cancer types and clinical scenarios. TMB cutoff values often vary depending on the specific research or clinical context. To date, a TMB low of <5 mut/Mb and a TMB high of ≥10 mut/Mb have mostly been used for solid cancers (Goodman et al., 2017; Mo et al., 2023). On the other hand, several studies and clinical trials have used a cutoff value of 20 mut/Mb (Chalmers et al., 2017) or 50 mut/Mb (Rizvi et al., 2015) for TMB-high phenotype. In addition, the need for adaptive TMB cutoffs that take into account the specific cancer type and clinical scenario has also been suggested (Samstein et al., 2019).
A central driver for the interest in TMB is its role in predicting the response to immunotherapy, particularly ICIs. Somatic mutations in cancer cells lead to the production of tumor cell-specific antigens, known as neoantigens, which allow T cells to be activated and to recognize cancer cells (Zhang et al., 2021). There is a positive correlation between TMB and the number of neoantigens (Chan et al., 2019). A high TMB indicates a tumor with a higher mutational burden, leading to the formation of neoantigens. These neoantigens can trigger a strong immune response, making it easier for the patient's immune system to recognize and fight the tumor. Several clinical studies have shown that cancer patients with elevated TMB are more likely to respond positively to ICB, establishing TMB as a potential biomarker of response to immunotherapy (Marcus et al., 2021; Rizvi et al., 2015).
The TMB also plays a pivotal role in identifying patients who might benefit from targeted therapies and in selecting combination therapies. Specific gene mutations in tumors can be targeted by precision therapies. Understanding the mutational landscape, in addition to TMB, allows oncologists to select the most appropriate targeted therapy. For example, tumors with low TMB may not respond well to single-agent immunotherapy but could benefit from combination approaches that boost the immune response against the tumor. Conversely, tumors with high TMB may respond to immunotherapy alone and may not require additional treatments (Hugo et al., 2016).
TMB has also become an important inclusion criterion in clinical trials testing new cancer therapies. In clinical trials, patients are often stratified by TMB to investigate the efficacy of experimental treatments in different TMB subgroups. For example, in the CheckMate 227 trial, TMB was used as a stratification factor to evaluate the efficacy of nivolumab and ipilimumab in lung cancer (Brahmer et al., 2023).
Beyond its predictive utility, TMB can also serve as a prognostic indicator. The prognostic role of TMB has been investigated in numerous cancer types as well as in pan-cancer studies, and high TMB has been associated with improved overall survival, particularly in the context of immunotherapy in various cancers such as non-small-cell lung cancer, melanoma, and renal cell carcinoma treated with anti-PD1-PDL1 and/or anti-CTLA4 (Samstein et al., 2019).
Whole-exome sequencing (WES) is considered the standard method for calculating TMB (Allgäuer et al., 2018). Comprehensive coverage allows detection of a wide range of mutations and provides a more detailed view of the genomic landscape. WES typically focuses on nonsynonymous mutations (including missense, nonsense, and frameshift mutations) that are more likely to have functional effects and contribute to TMB. In addition, WES can detect rare mutations with relatively high sensitivity, making it suitable for identifying low-frequency variants that may contribute to TMB. However, WES is time-consuming and generates a considerable amount of data (30–50 Mb), and the cost of sequencing is higher compared with more targeted gene panels (with a size of about 1–2 Mb).
Gene panels with only a few hundred genes can measure at great depth and are better at detecting mutations than WES (Li and Luo, 2021; Meléndez et al., 2018). Furthermore, while WES is sensitive, it can also lead to a higher number of detected variants, including passenger mutations. This may lead to a higher false discovery rate, which could affect the accuracy of TMB. In the clinical context, not all mutations detected by WES may have proven clinical significance or therapeutic relevance. Therefore, it is important to balance clinical utility with the comprehensive nature of WES. Tumor heterogeneity, that is, the presence of subclones with different mutation profiles, may affect the interpretation of WES data. Decisions about which regions to sample may influence the TMB measurement.
In all, TMB has made significant progress in recent years, including its inclusion in clinical guidelines. Efforts are underway to develop standardized methods for TMB measurement, such as cost-effective gene panels that both provide accurate results for TMB and are able to match therapies to patients, and to establish optimal cutoff values for stratifying patients and extending its utility to different cancer types.
Given the uncertainties regarding the required panel size for accurate TMB determination, in this study, we report (1) development of a new pan-cancer gene panel for accurate targeting/matching of patients with therapies, (2) a pan-cancer analysis on a large cohort, and evaluated the efficiency of gene panels of different sizes compared with data from WES as the gold standard, and (3) sought after an answer to the question of whether different TMB cutoffs should be used for different cancer types.
Materials and Methods
Data availability and statement of informed consent
Publicly available datasets were analyzed in this study. The datasets are available in The Genome Cancer Atlas (https://portal.gdc.cancer.gov/) and the list of genes covered in panels is available in the Supplementary Data. This study did not require research ethics review or informed consent since publicly available datasets are used.
Genome profiling data
Twenty-two cancer types with genome profiling data for more than one hundred patients were selected from The Cancer Genome Atlas (TCGA) (cancer.gov/tcga) and WES data (n = 9929 patients) from 22 cancer types were used to determine TMB (Table 1). Patients were categorized into three groups: TMB-low (TMB <5 mut/Mb), TMB-intermediate (TMB ≥5 or <10 mut/Mb), and TMB-high (TMB ≥10 mut/Mb).
List of Cancer Types with a Sample Size >100 in The Cancer Genome Atlas, Their Sample Sizes, and Distribution of Tumor Mutation Burden Status
TMB-low: <5 mut/Mb; TMB-intermediate: ≥5 and <10 mut/Mb; TMB-high: ≥10 mut/Mb.
TCGA, The Cancer Genome Atlas; TMB, tumor mutation burden.
Gene panels and pan-cancer panel design
Four gene panels of different sizes were selected for comparative analyses (Supplementary Table S1–S4). These include a narrow panel of 69 genes (0.44 Mb) (19), two commercial panels of 185 genes (1.08 Mb) and 389 genes (2.07 Mb), and a pan-cancer panel of 502 genes (2.54 Mb) developed in this study.
In developing the pan-cancer panel to identify potential treatment options, the primary question was whether the mutated gene observed in a cancer type would be captured by a drug approved by the FDA for that cancer type. Therefore, two comprehensive databases containing somatic mutations of cancers, namely the Catalogue of Somatic Mutations in Cancer (COSMIC, v95) (cancer.sanger.ac.uk) and the Database of Curated Mutations (DoCM, v3.2) (docm.info/), were searched for mutations associated with 22 cancers. Mutations (n = 98,002 associated with 9671 genes) were filtered by carcinoma and biopsy specimens. All mutated genes in each cancer type were identified and the drug-targeting potential of these genes was analyzed. The Drug–Gene Interaction Database (DGIdb, v4.2.0) (dgidb.org/) was used as a pharmacogenomic data source to obtain gene–drug interactions (n = 46,893 interactions between 3228 genes and 10,691 drugs). Diagnostic and treatment protocols were obtained from the National Comprehensive Cancer Network (nccn.org/), which provides comprehensive protocols for 64 different cancer types.
FDA-approved biomarkers for systematic and adjuvant therapies were identified for each cancer type. Then, a pan-cancer panel (n = 502) was developed with a union of 22 cancer-specific gene panels consisting of genes targeted by a drug and whose mutations were observed in one of the 22 cancer types.
TMB calculation
TMB is defined as the number of nonsynonymous somatic mutations per Mb sequencing region. TMBs of 9929 tumor samples associated with 22 cancer types were calculated using WES data from TCGA. The size of the coding region was taken as 50.39 Mb, taking into account the platform used (SureSelect Human All Exon v5). These TMB values determined from WES data were used as the gold standard for further analyses.
In the TMB calculation with gene panels of different sizes, we considered all exons of the panel genes to estimate the effect of panel size on TMB accuracy, although we are aware of the fact that commercial panels actually cover certain regions rather than all exons.
Samples with a TMB value of <5 mut/Mb were classified as TMB-low, samples with a TMB value of ≥5 and <10 mut/Mb were classified as TMB-intermediate, and samples with a TMB value of ≥10 mut/Mb were classified as TMB-high.
Statistical analyses
In the performance tests, the TMB values were classified as binary. While a TMB value of less than 5 mut/Mb was accepted as TMB-low, a TMB value of 5 mut/Mb or higher was accepted as TMB-high. The true positive was designated as TMB-high, whereas the true negative was designated as TMB-low. Sensitivity, specificity, and accuracy metrics were determined and analyzed comparatively within and between cancer groups. The Mann–Whitney U test was used for the comparisons and results with a p value <0.05 were considered statistically significant. To determine the optimal TMB cutoffs, the receiver operating characteristic (ROC) curves for each cancer type were constructed with different cutoffs ranging from 5 to 20 mut/Mb. The area under the curve (AUC) metric was calculated and evaluated in performance analyses.
All calculations and visualizations were performed under the R platform (Rx64 4.3.0) using the packages ggplot2 (v.3.4.2) and pROC (v.1.18.4).
Results
Heterogeneity of TMB within and between tumor types
The calculation of the TMB values of 9929 patients using WES data from TCGA showed that the TMB values vary greatly between the different types of cancers (Fig. 1A). The cancer types with the highest median TMB were skin cutaneous melanoma (SKCM) (

Heterogeneity of TMB within and between tumor types.
The effect of panel size on TMB calculation
The WES is generally accepted as the standard method for calculating TMB. However, due to the high measurement depth and low cost, gene panels have come to the fore for use in routine testing. In this study, four different panels were used to analyze the effect of panel size on the determination of TMB. In addition, the correlation between the TMB results of the panels and those of the WES within the TMB-low, TMB-intermediate, and TMB-high cohorts was comparatively analyzed (Fig. 2). Two patients with extreme TMB values were considered outliers and excluded from the correlation analyses.
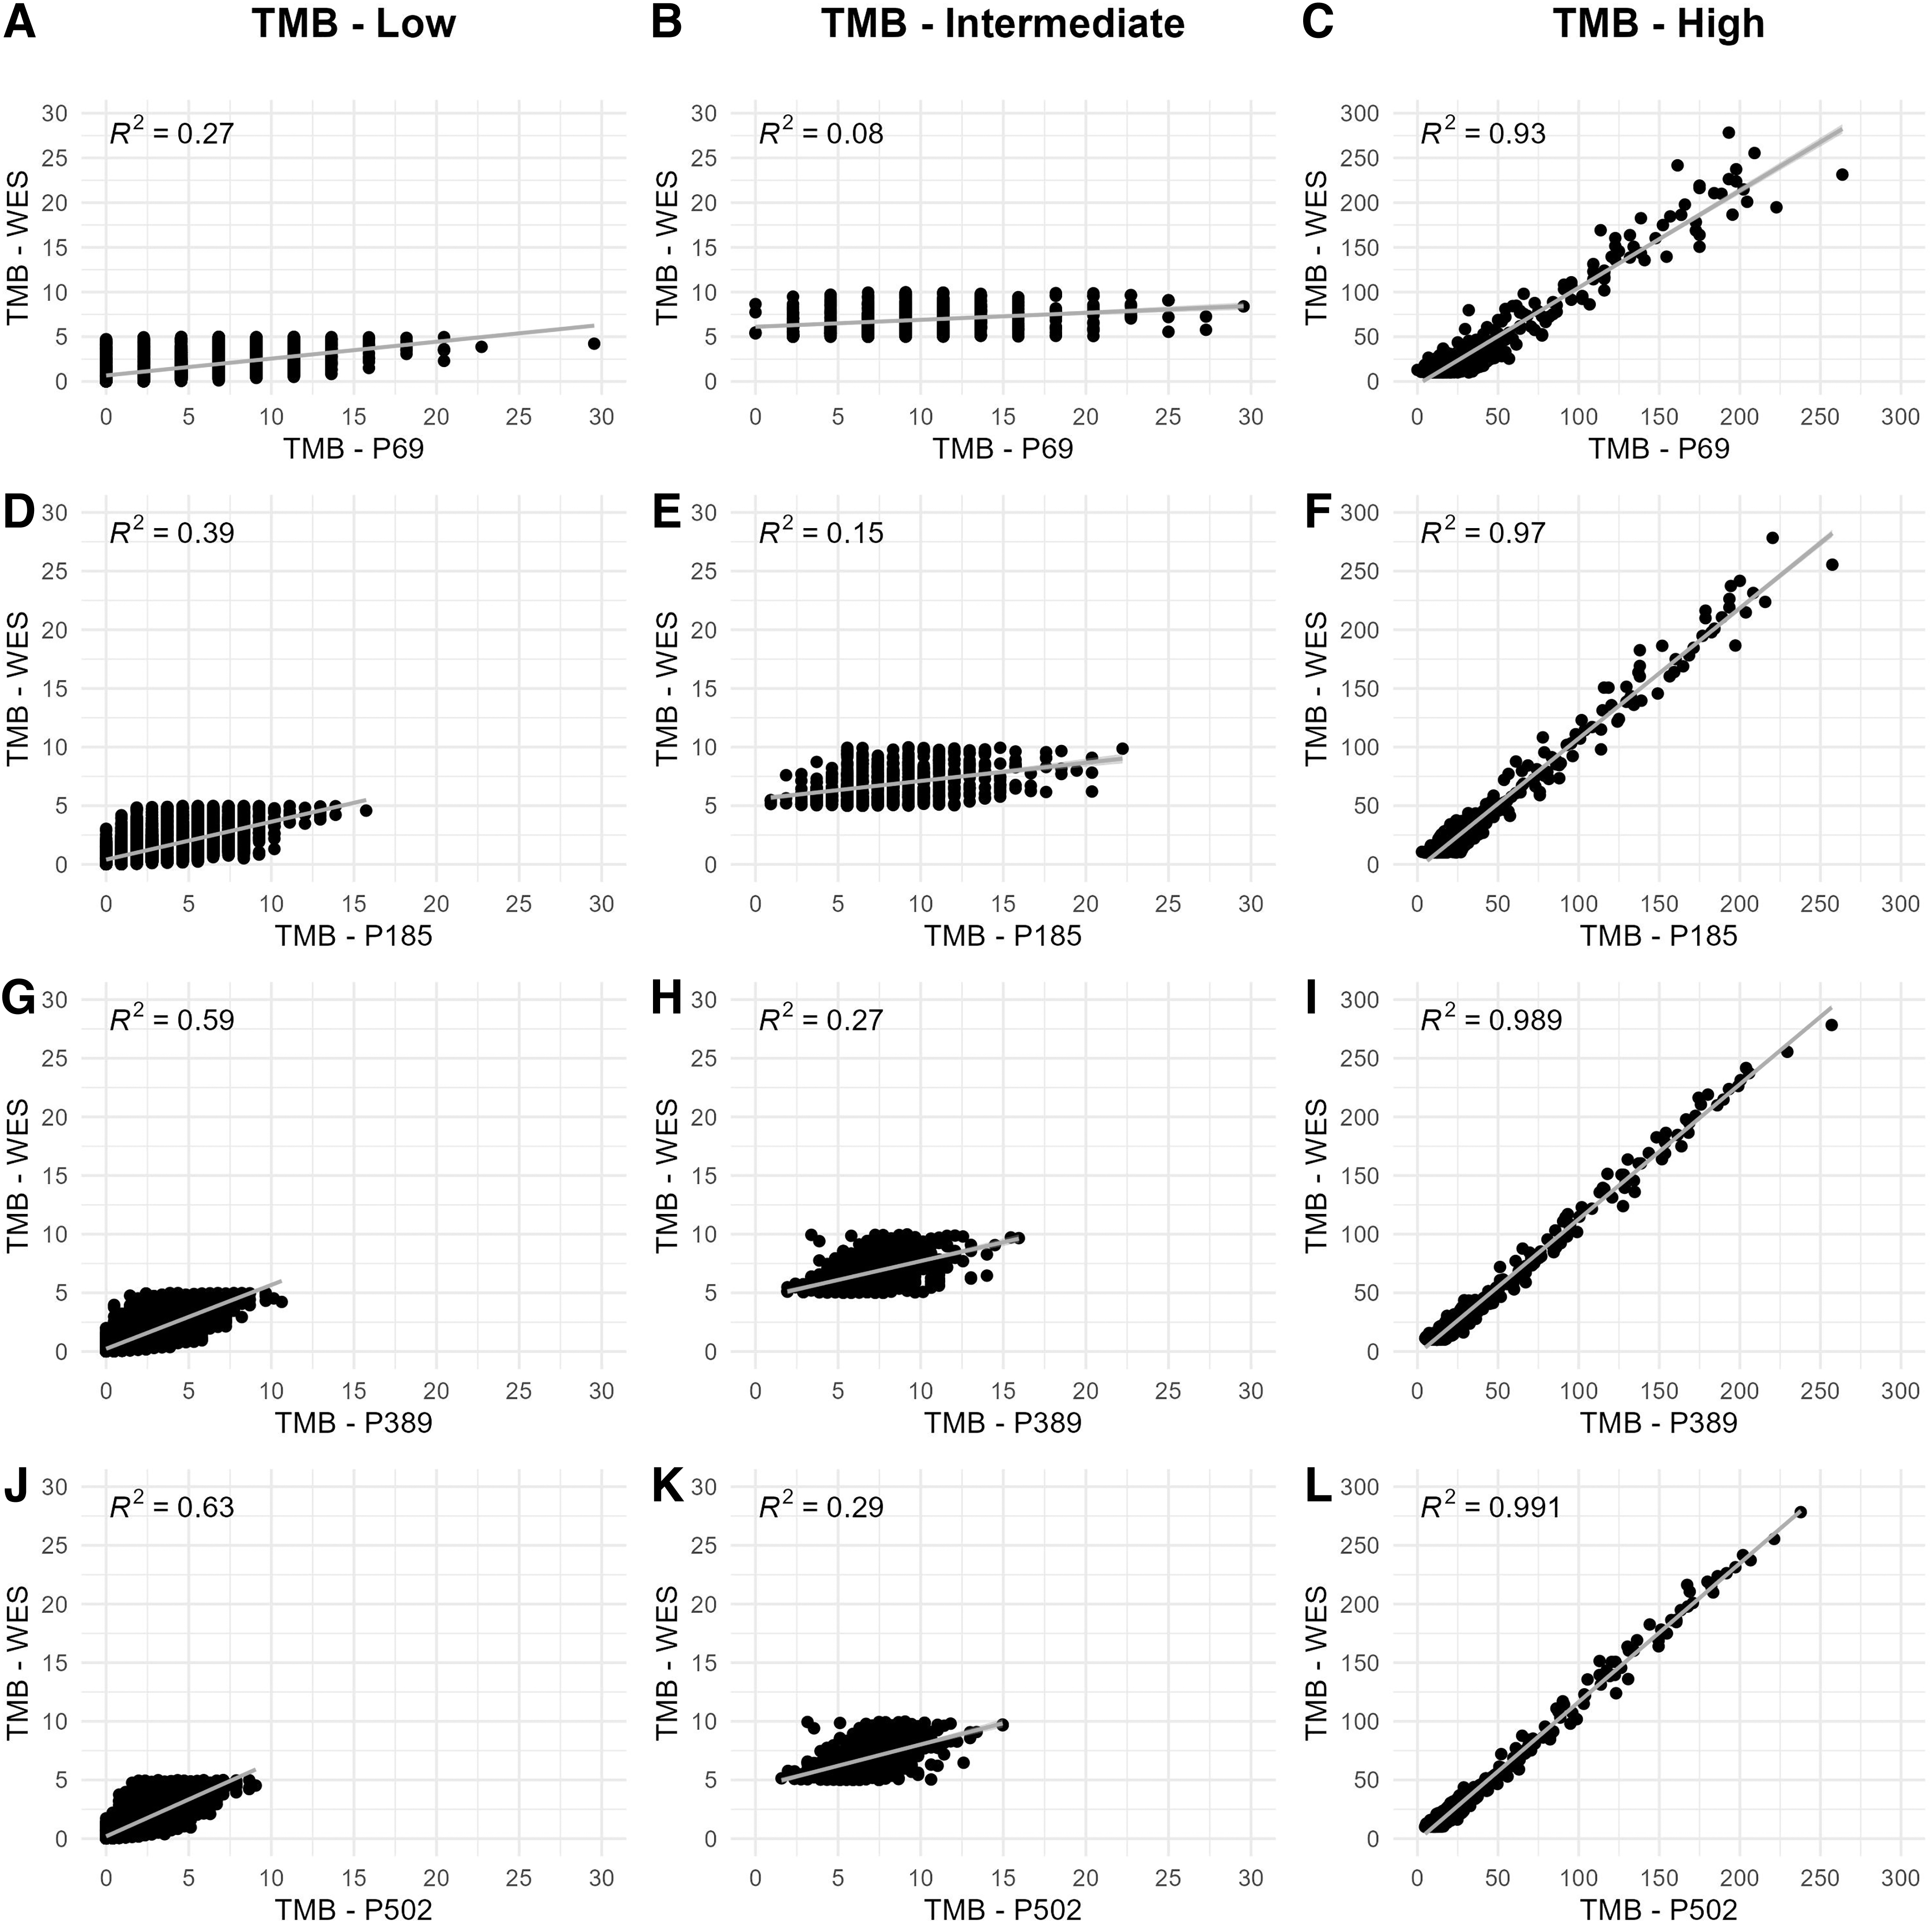
Comparative analysis of WES and panel 69 for
In the TMB-low and TMB-intermediate cohorts, the predictions of panel 69 and panel 185 were rather misleading, as the majority of patients were categorized as TMB-high with TMB values up to 30. Therefore, the correlations of the predictions of these panels with those of the WES for TMB-low and TMB-intermediate patients remained quite weak (R2 < 0.4). On the other hand, despite their small size, these panels proved to be quite successful in predicting TMB-high patients (R2 values of 0.93 and 0.97, respectively) compared with the WES (Fig. 2A–F).
Panels with larger size, that is, panel 389 and panel 502, provided better predictions for TMB-low and TMB-intermediate cohorts. However, the correlations with the WES predictions for these cohorts remained below the acceptable level (R2 < 0.7). For the TMB-high cohort, on the other hand, the predictions of both panels were quite successful and provided very similar predictions to WES: panel 502 (R2 = 0.991) showed the highest correlation, followed by panel 389 (R2 = 0.989) (Fig. 2G–L).
These analyses collectively showed that the predictions of all panels in the cohort with high TMB correlated highly with those of WES. However, panels of small size (i.e., panel 69 and panel 185) have a high tendency to provide a high TMB profile and were insufficient to predict TMB-low and TMB-intermediate cases, which may lead to misleading results, especially for immunotherapy eligibility tests.
When we analyzed the performance of the panel predictions in terms of accuracy, sensitivity, and specificity, the superiority of the large panels became clearer.
From a pan-cancer perspective, the accuracy of the predictions of panel 69 and panel 185 showed a high variability with values between 0.6 and 1.0 (median of 0.89 and 0.94, respectively). On the other hand, the accuracy values for all cancer types remained at an acceptable level and ranged between 0.9 and 1.0 in panel 502 and panel 389 (with a median of 0.98 and 0.99, respectively) (Fig. 3A). While there was no statistically significant difference between the TMB prediction profiles of panel 502 and panel 389 (p = 0.69), there was a significant difference between the accuracy predictions of panel 502 with panel 185 (p = 0.022) or panel 69 (p = 0.0011) and between panel 389 with panel 185 (p = 0.044) or panel 69 (p = 0.0018).
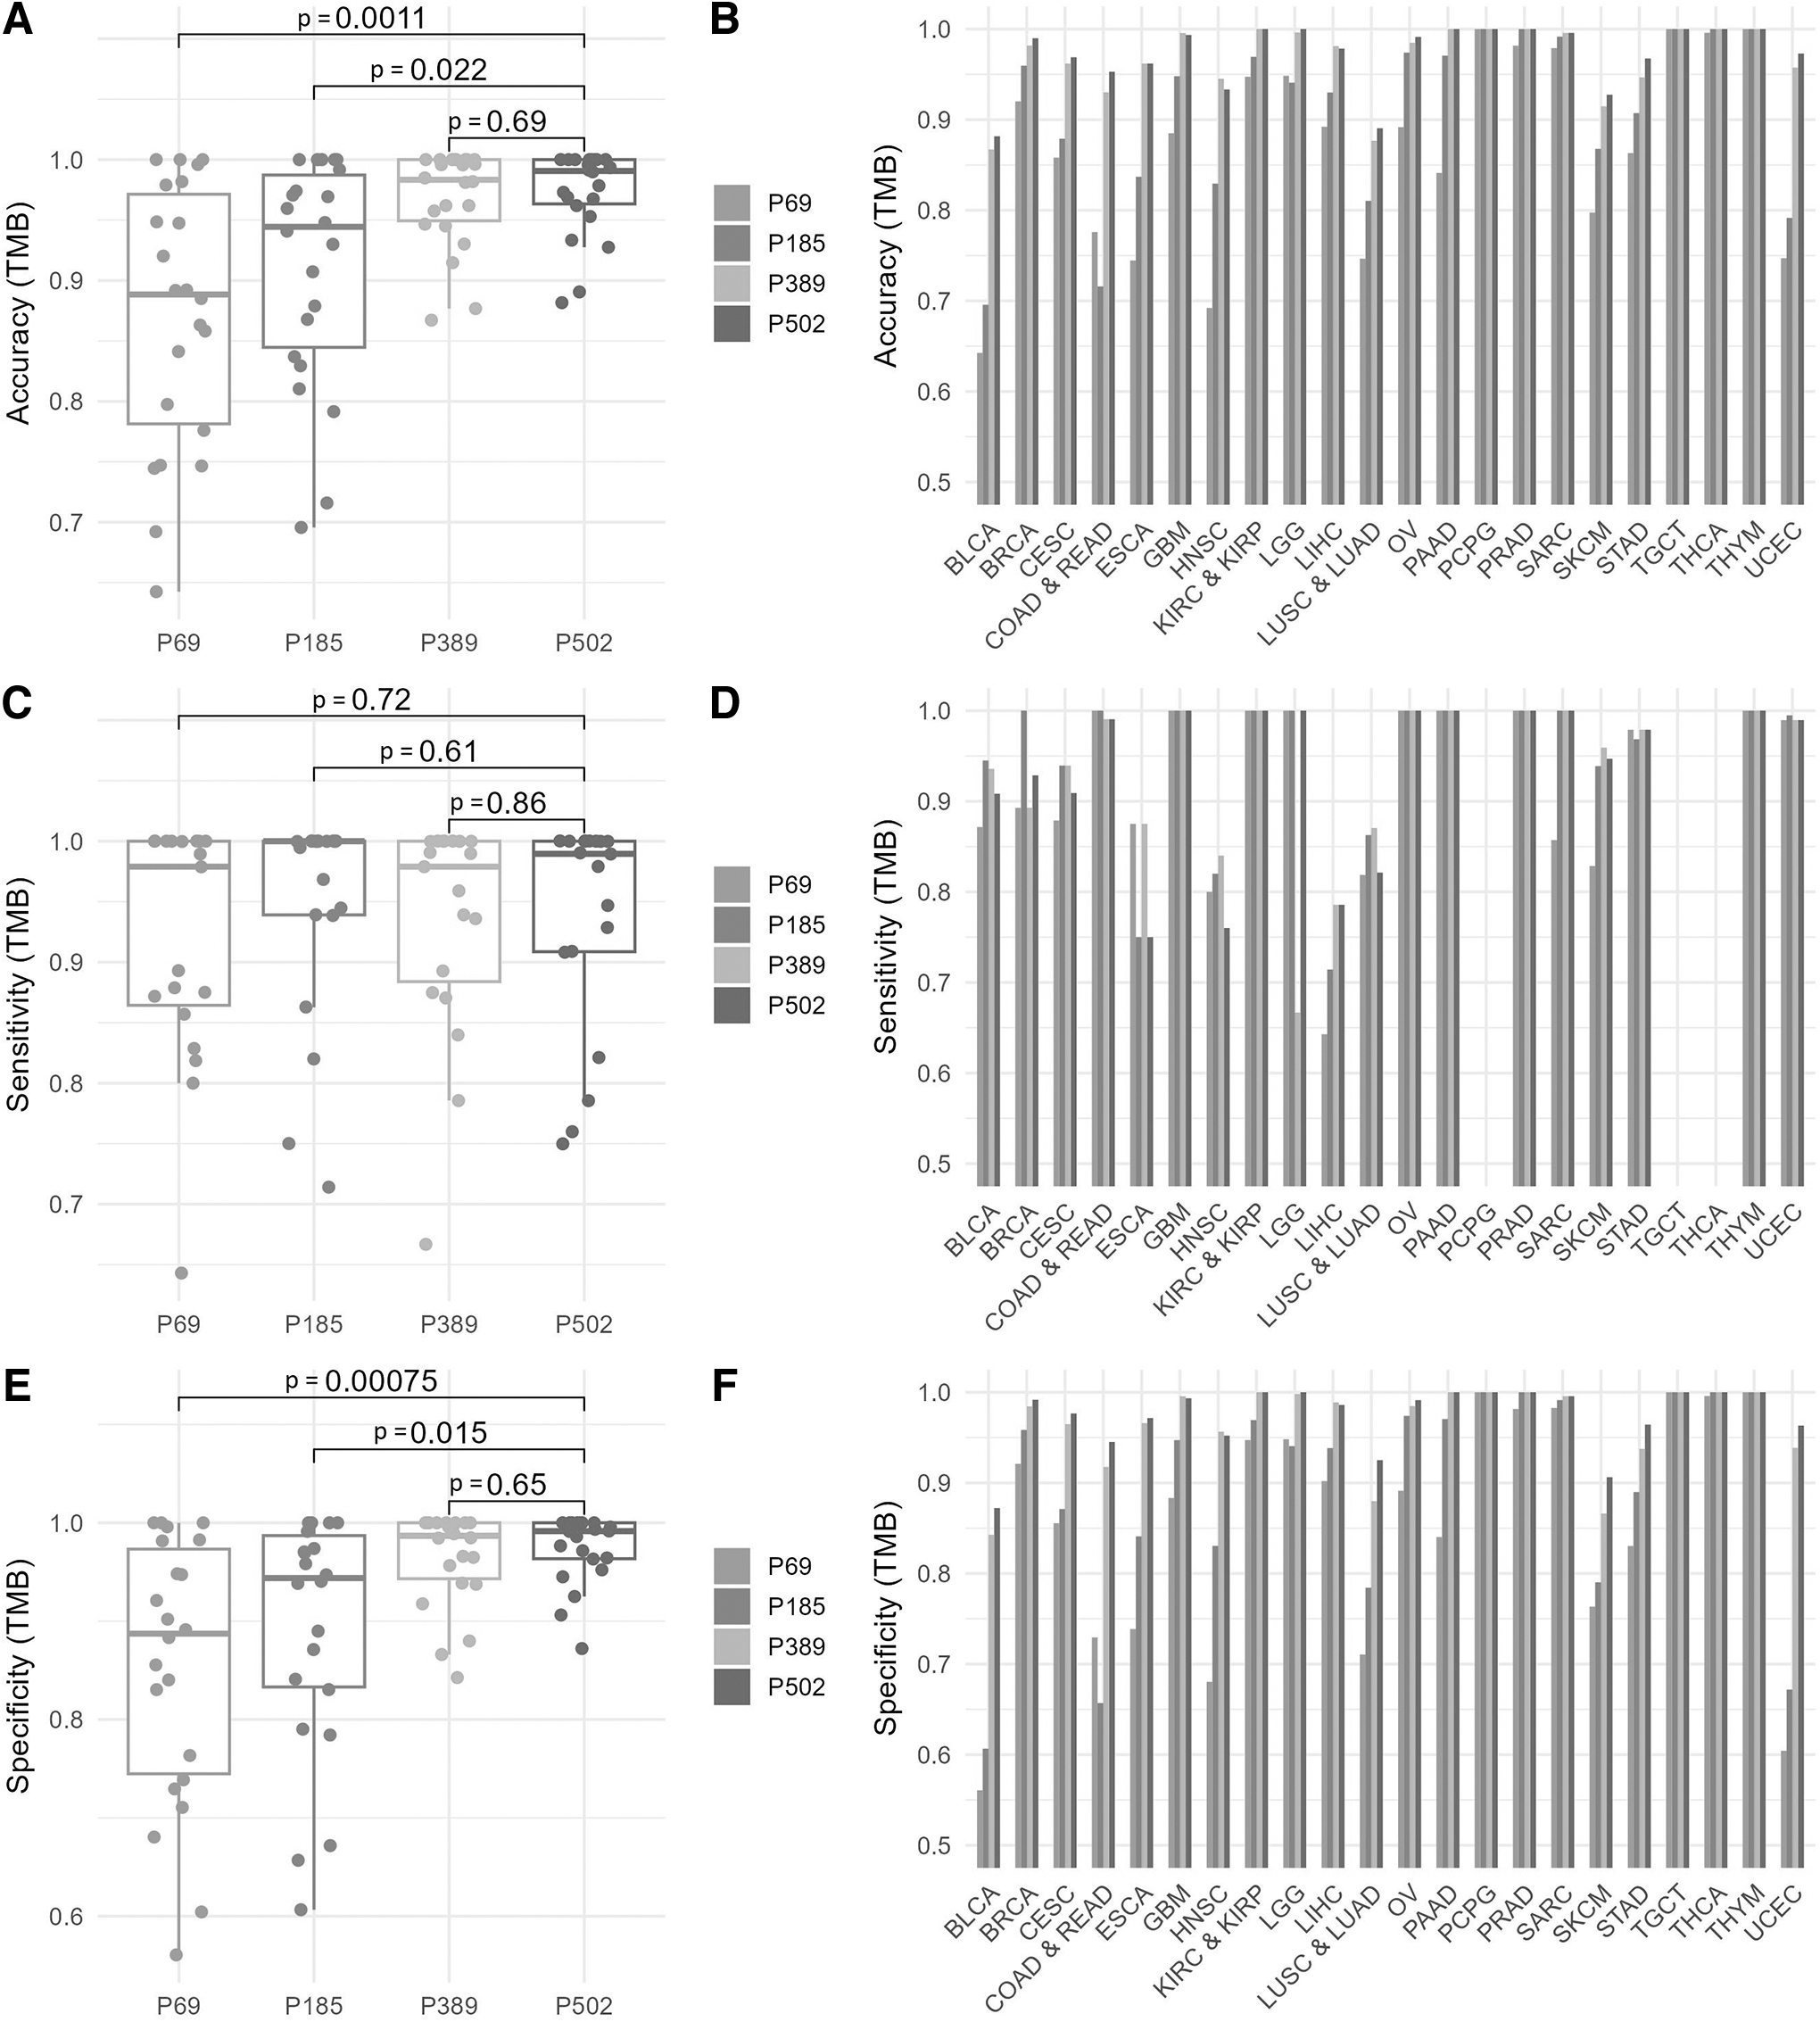
Pan-cancer performance comparisons.
Moreover, it was observed that the accuracy of predictions increased with the size of the panel for almost all cancer types, especially for those with high TMB rates (such as UCEC, SKCM, COAD and READ, BLCA) (Fig. 3B). This confirms our observation that narrow panels are good at predicting patients with high TMB levels but are unable to predict patients with low or intermediate TMB levels. This situation can be better recognized by comparing sensitivity and specificity (Fig. 3C–F).
High sensitivity values (median values between 0.98 and 1.0) were found for all panels, whereby the estimates of the panels did not differ statistically significantly from each other in terms of sensitivity, indicating the high efficiency of all panels in detecting patients with high TMB (Fig. 3C). Furthermore, there is no significant correlation between the predicted sensitivity and the size of the panel (Fig. 3D).
However, in terms of specificity (i.e., predicting TMB-low cases), the predictions for all cancer types remained at an acceptable level and ranged between 0.84 and 1.0 in panel 502 and panel 389 (with a median of 0.99). The specificity of the predictions of panel 69 and panel 185 showed a high variability with values between 0.56 and 1.0, with medians of 0.89 and 0.94, respectively (Fig. 3E). Moreover, it was observed that the specificity of predictions increased with the size of the panel for almost all cancer types (Fig. 3F).
Testing different TMB cutoffs on cancer types
Although there is no definitive standard cutoff in the literature, 5 or 10 mut/Mb are generally used as thresholds for TMB-high status (Ke et al., 2022; Mo et al., 2023). However, as shown in Figure 1, there is high variability in TMB levels across cancer types and the median TMB of patients (based on WES predictions) ranged from 0.1 to 5.3, suggesting the hypothesis that these cutoffs may not be representative of all cancer types. Therefore, we analyzed the efficacy of different cutoff values (i.e., 5, 10, 15, and 20 mut/Mb) on panel 502 using a ROC curve analysis and AUC value as the performance metric.
Our results revealed optimal cutoff values that can range from 5 to 20 for different cancer types (Table 2), showing that commonly used cutoff values do not have optimal profiles for many cancer types, such as BLCA (optimal cutoff value: 20, AUC: 99.97%), head and neck squamous cell carcinoma (optimal cutoff value: 15, AUC: 100%), LUSC and LUAD (optimal cutoff value: 15, AUC: 99.51%), and SKCM (optimal cutoff value: 20, AUC: 99.78%) (Fig. 4). We observed that for cancers with a high mutational burden tendency, such as SKCM, STAD, and UCEC, optimal cutoff values are above 10 mut/Mb. However, for cancers with a lower mutational burden tendency, such as GBM, LGG, PAAD, and PRAD, a cutoff value of 5 mut/Mb can be applied.
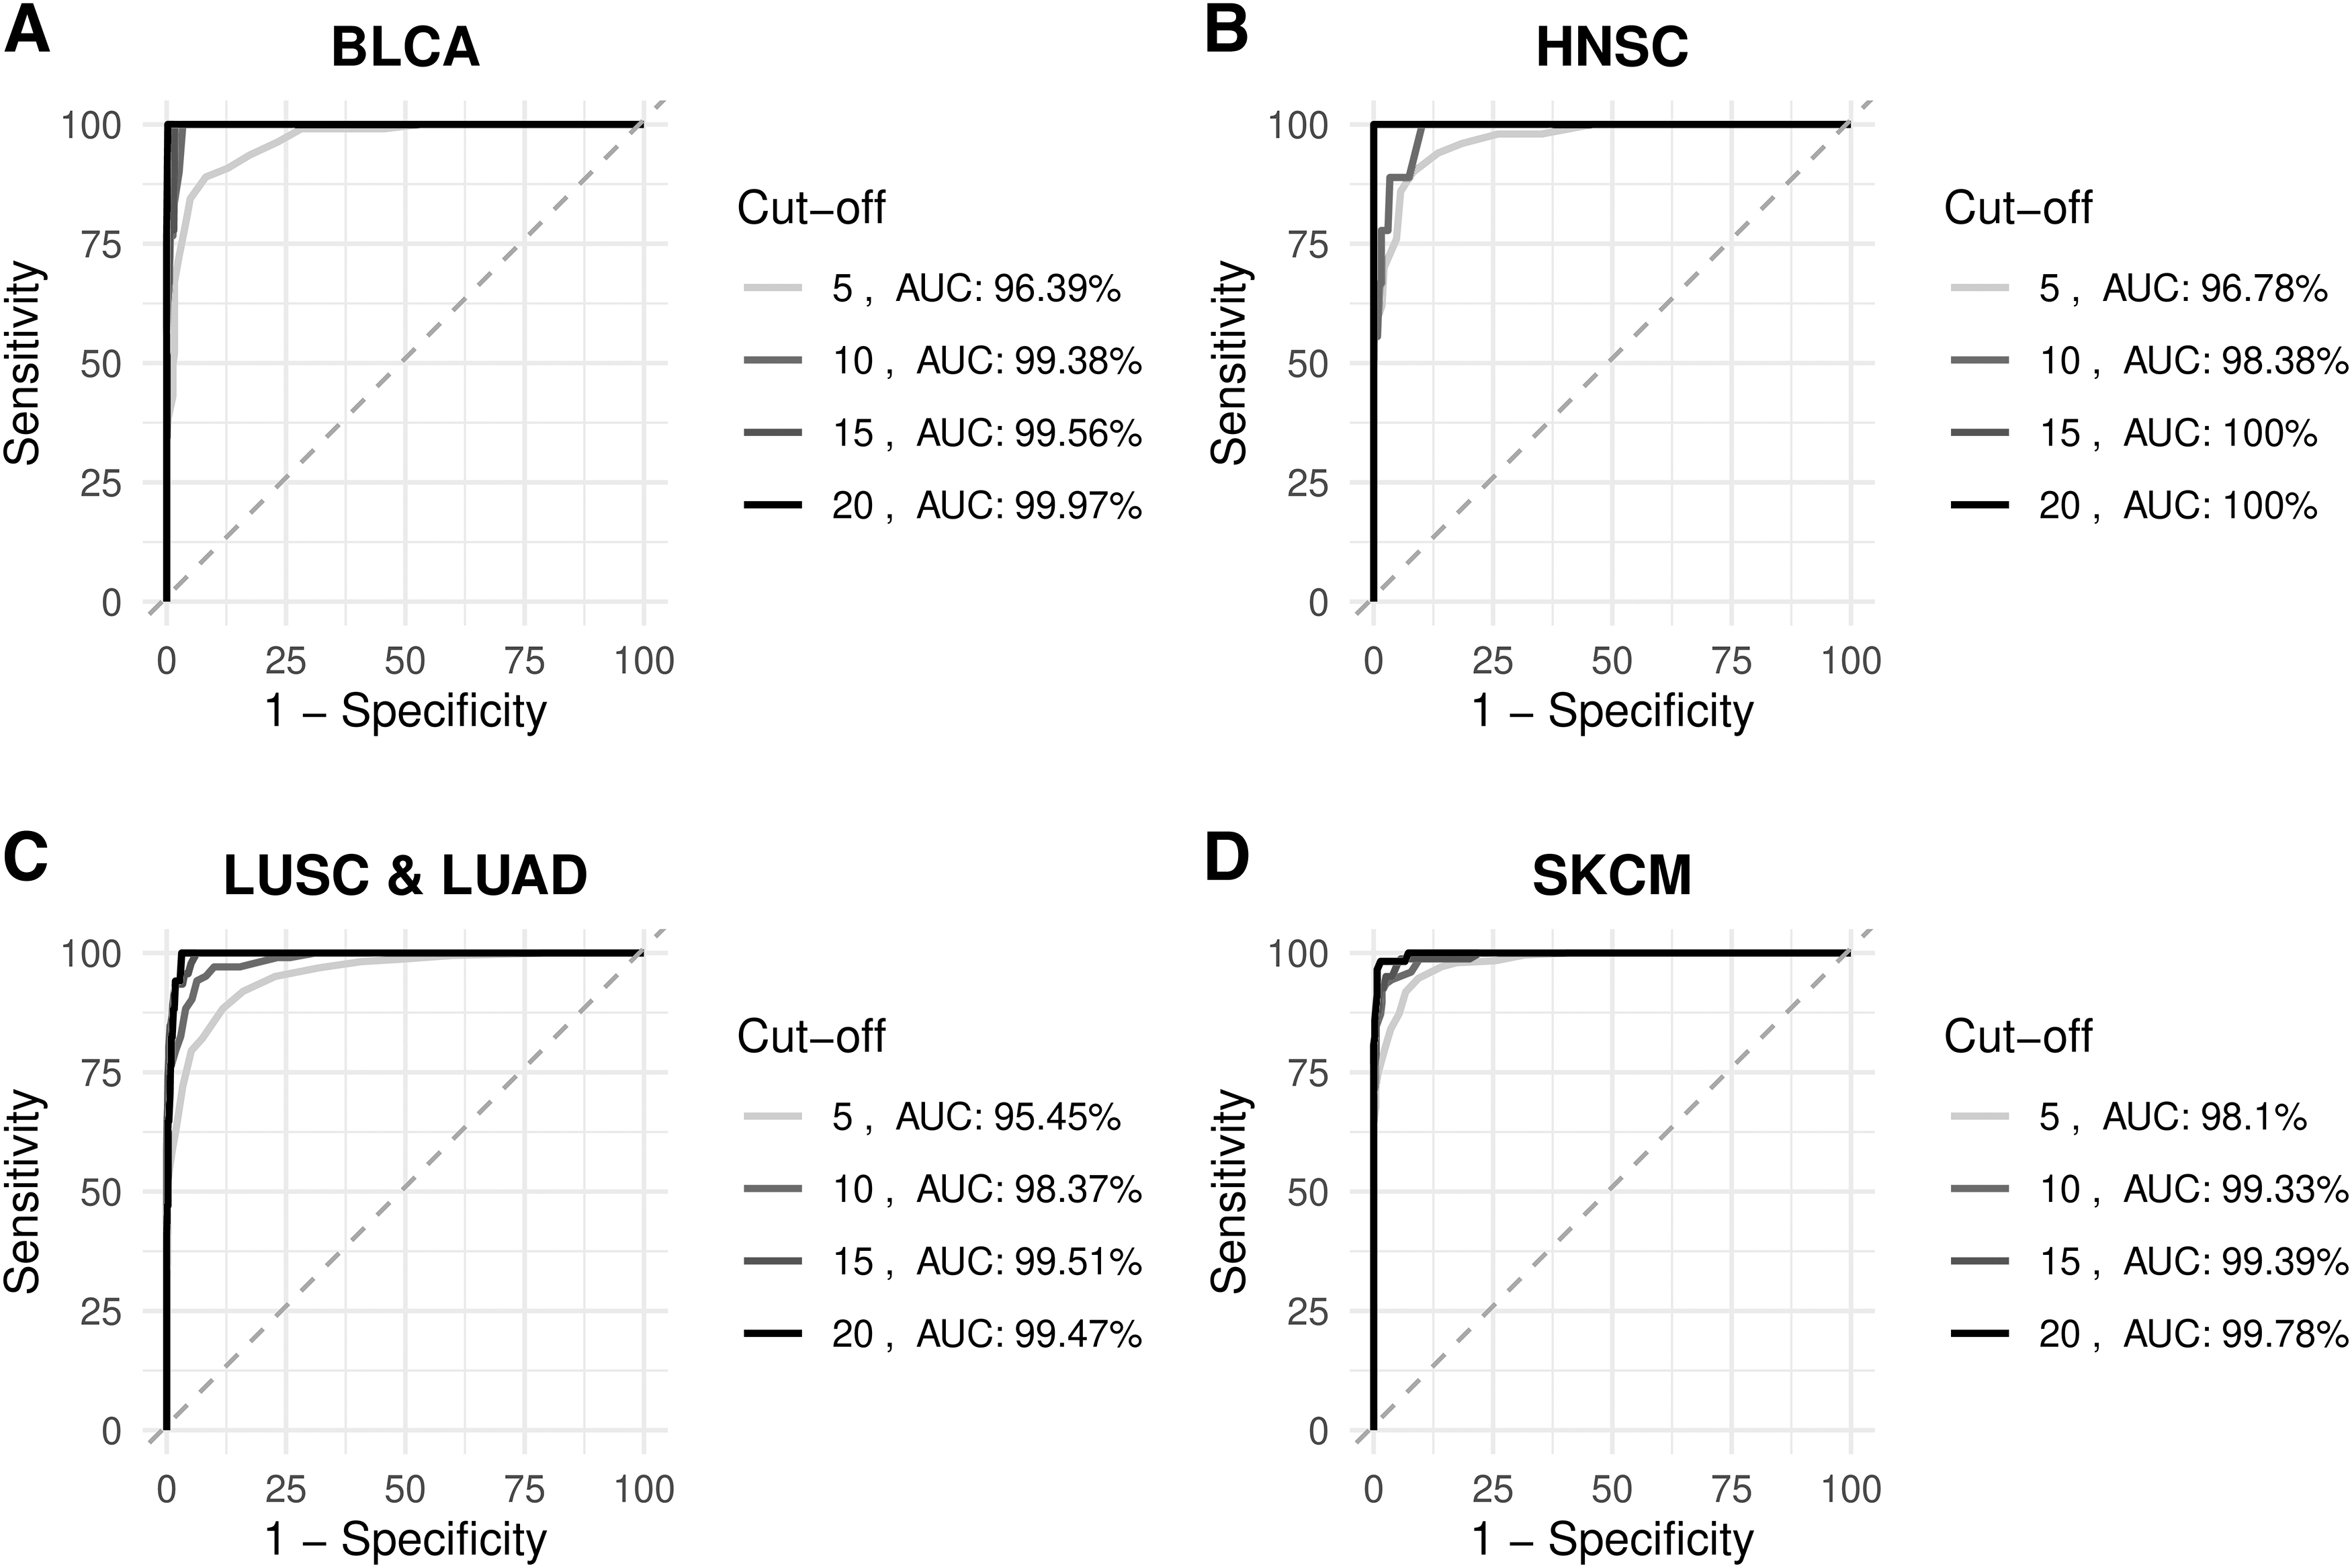
The receiver operating characteristics curve analysis for
Optimal Tumor Mutation Burden Cutoffs Predicted for Each Cancer Type
AUC, area under the curve; NP, not predicted.
Discussion
The importance of TMB in precision oncology lies in its potential as a biomarker for predicting the response of tumors to certain cancer treatments, particularly immunotherapies. Tumors with higher TMB tend to have more neoantigens that can serve as targets for the immune system, making the tumor more susceptible to immunotherapy (Chan et al., 2019).
TMB can be calculated using different methods, and the choice of method often depends on the resources available, the specific goals of the analysis, and the clinical or research context. While WES is one approach, it is more resource intensive than commercially available comprehensive genomic profiling assays, which utilize targeted gene panels that focus on a specific set of frequently mutated genes in cancer. These targeted gene panels are more cost effective and faster than WES. However, the content, design and size of the panel are critical to the accurate determination of TMB.
In this study, using WES data from 22 cancer types obtained from TCGA, we first demonstrated the large heterogeneity of TMB within and between tumor types. The mutational burden in cancers such as melanoma and bladder was higher as previously reported (Chalmers et al., 2017); the mutational burden in some cancers is much lower (Fig. 1).
Second, we proposed a pan-cancer TMB panel of 502 genes, and using the WES data as a gold standard, we comparatively analyzed the TMB values of four NGS panels with different panel designs and sizes. As the usefulness of panel sequencing for routine cancer screening came to the fore, we were faced with the question of how large the panel should be to obtain a TMB that is closest to reality. We found that the panel of 502 genes was able to detect TMB with a negligible bias and the commercial panel of 389 genes was also successful in calculating TMB with a small margin at an acceptable level. The relative failure of other smaller panels proves that the panel size should consist of at least 350 to 500 genes for accurate TMB determination. We also reiterated the observation that the small panels are inadequate for screening patients, especially those with low TMB (Tang et al., 2020).
As a limitation of the study, we should emphasize that when calculating TMB with gene panels of different sizes, we considered all exons of the panel genes to estimate the effect of panel size on TMB accuracy, although we are aware of the fact that commercial panels actually cover certain regions and not all exons. Therefore, the accuracy values might be overestimated. However, this would not change the conclusions resulting from the present analyses.
It was observed that cancers with high TMB responded favorably to ICB treatment, but the response of cancers with low TMB to treatment varied with different cutoffs (Zheng, 2022). This raises a question mark over the use of a universal TMB cutoff. Therefore, we also assessed the critical role of TMB cutoffs and highlighted the need for cancer-specific cutoffs and suggested that population-based clinical data studies should be conducted to determine cancer-specific TMB cutoffs. We believe that this is an accurate and useful approach to inform clinical decisions as to whether immunotherapy can be recommended to cancer patients or not.
It is important to distinguish TMB from other genomic parameters such as microsatellite instability (MSI) or specific gene mutations (e.g., EGFR mutations). TMB provides a broader overview of the mutational landscape across the genome, while MSI focuses on a specific type of genetic alteration and specific gene mutations refer to alterations in certain oncogenes or tumor suppressor genes. The integration of TMB into clinical practice represents a significant advance in precision oncology that will ultimately improve patient outcomes and broaden our understanding of cancer biology.
Although TMB is a valuable biomarker in precision oncology, it is not without its challenges and limitations. The accuracy of TMB measurement is influenced by several fundamental factors that together determine the reliability and consistency of TMB values obtained from genomic sequencing data. To obtain accurate TMB measurements, it is critical to understand and account for these factors. As shown in this study, both the accuracy of the TMB measurement and the TMB cutoff value used to classify tumors as high or low is highly dependent on the size and design of the gene panel used.
Smaller panels focusing on hotspot genes may overestimate TMB values. Larger gene panels provide a more comprehensive assessment of the mutational landscape in a tumor, which can be advantageous as a broader range of potential mutations are captured. However, it is important to balance this with clinical relevance and practicality, as not all mutations detected have a known therapeutic or prognostic significance. The clinical relevance of mutations detected by a larger panel must be carefully assessed. Not all mutations have proven clinical significance, and their inclusion may not add value to the patient's treatment. In addition, larger panels may also increase the likelihood of detecting low-frequency, subclonal mutations that may not contribute significantly to TMB or affect patient outcomes. These low-frequency mutations can cause noise and reduce the specificity of the TMB measurement, which can lead to false-positive results. Therefore, targeted panels can provide more accurate TMB measurements for specific clinical applications.
Considering that different sequencing platforms have different error rates and sensitivities, sequencing depth (i.e., the number of reads covering a given region) becomes an important parameter influencing accuracy. A higher sequencing depth (e.g., 500 × coverage) should be favored to reduce the risk of false negatives and positives.
In addition, the choice of mutational context considered in the TMB calculation can also influence the accuracy. It should also be kept in mind that current TMB calculations consider all types of mutations without taking into account their functional impact (e.g., synonymous vs. nonsynonymous mutations). Furthermore, the accuracy of TMB calculations depends on the quality of the bioinformatics pipelines and the reference genomes and databases used for data analysis. The choice of alignment algorithms, variant calling tools and filtering criteria can influence the TMB measurement. The lack of standardized and validated protocols for TMB assessment poses a challenge.
TMB cutoff values that classify tumors as high or low TMB are not universally defined. The lack of consensus on TMB cutoff values can lead to inconsistent clinical decisions. Defining a specific TMB threshold to classify tumors as high or low remains a challenge. For example, there is no consensus on the optimal cutoff for distinguishing responders from nonresponders to immunotherapy (Wan et al., 2020). In addition, the TMB cutoff value used to classify tumors as high or low may be influenced by panel size. Larger panels, which may recognize more mutations, can lead to higher absolute TMB values. Therefore, different panels may require different TMB cutoff values to classify tumors consistently, making the interpretation of TMB more complex. Different studies or clinical settings may use different cutoff values, which may lead to variations in TMB classification. The choice of cutoff values should be based on the specific clinical or research objectives.
While TMB has shown promise in some cancer types, its clinical utility is not as well established in others (Ke et al., 2022; McGrail et al., 2021; Ota et al., 2022). The predictive and prognostic value of TMB varies across different tumor types (Ding et al., 2018; Wu et al., 2019). Not all tumors with high TMB respond to immunotherapy, and conversely some tumors with low TMB respond (McGrail et al., 2021). In addition, the predictive value of TMB may change over time as therapies and clinical guidelines evolve (Klempner et al., 2020). These observations suggest that TMB alone does not explain all of the variability in patient response and should not be considered as an isolated tumor biomarker. There is a need for complementary biomarkers, including the tumor microenvironment, the expression of immune checkpoint markers such as PD-L1, and the presence of certain driver mutations, to improve predictive accuracy. Understanding the interplay between TMB and these factors is crucial for accurate predictions. It is likely that additional predictive factors and markers remain to be discovered. This emphasizes the need for ongoing research to refine predictive models and improve patient stratification.
Although tumors often consist of a heterogeneous mixture of cancer cells with different mutation profiles, this intratumor heterogeneity is often neglected. The TMB measured from a single biopsy may not accurately represent the mutational burden of the entire tumor. Assessing TMB from multiple tumor regions or by liquid biopsies can provide a more comprehensive picture but involves additional complexity.
Conclusions
In all, TMB has a heterogeneous distribution among cancer types and the size of the gene panel and the cancer-specific cutoff values are crucial for the use of TMB in precision oncology. We recommend routinely using a comprehensive gene panel of about 500 genes in the clinic to increase the sensitivity and especially the specificity of TMB to an acceptable level. Furthermore, optimization of TMB cutoffs for each cancer type will inform and help discern the value of TMB in the clinic, and with an eye to precision oncology and individually tailored cancer care.
Footnotes
Acknowledgment
The scholarship under the TUBITAK BIDEB 2210-A National MSc Scholarship Program provided to Betül Budak is greatly acknowledged.
Authors' Contributions
B.B.: Conceptualization (equal), formal analysis (lead), methodology (equal), visualization (equal), and writing–original draft (lead). K.Y.A.: Conceptualization (lead), methodology (equal), supervision (lead), and writing–review and editing (lead). All authors have read and approved the article for publication.
Author Disclosure Statement
The authors declare they have no conflicting financial interests.
Funding Information
This work was supported by Marmara University Scientific Research Projects Committee through grant number FYL-2022-10758.

Abbreviations Used
References
Supplementary Material
Please find the following supplemental material available below.
For Open Access articles published under a Creative Commons License, all supplemental material carries the same license as the article it is associated with.
For non-Open Access articles published, all supplemental material carries a non-exclusive license, and permission requests for re-use of supplemental material or any part of supplemental material shall be sent directly to the copyright owner as specified in the copyright notice associated with the article.
