
Abstract
The current decade 2021–2030 was designated by the United Nations as the decade of healthy aging, which underlines the need for public health innovation for arthritis clinical care. The triglyceride-glucose (TyG) index is a novel and emerging parameter closely associated with diabetes and cardiovascular diseases and has been suggested to indicate the risk of arthritis. This study examined the longitudinal changes of TyG levels in relation to arthritis among a nationwide cohort of older Chinese adults. We recruited 1257 participants from a national cohort of older Chinese adults, the Chinese Longitudinal Healthy Longevity Survey. On the basis of the longitudinal changes in TyG between 2012 and 2014, we performed a k-means clustering analysis to classify the participants into four TyG groups: Class 1 with moderate and stable levels of TyG; Class 2 with low but rising level of TyG; Class 3 with consistently high TyG; and Class 4 with high and TyG-level rise compared with the baseline. After a 2-year follow-up, logistic regression was used to identify the association between TyG and the onset of arthritis. Compared with individuals in Class 1, those in Class 3 and Class 4 experienced a higher risk of arthritis, with an odds ratio (OR) of 2.823 (95% confidence interval [CI]: 1.113–7.160) and 2.848 (95% CI: 1.299–6.246), respectively. To the best of our knowledge, this is the first study exploring the association between dynamic longitudinal changes in TyG and arthritis. Further studies on world populations are called for.
Introduction
Public health systems are in need of novel approaches to prevent and monitor common chronic diseases such as arthritis. Arthritis is a series of aging-related disorders characterized by inflammation and stiffness in one or more joints of the body, ranked among the most prevalent chronic conditions in older adults (GBD 2021 Osteoarthritis Collaborators, 2023; Senthelal et al., 2024). Individuals with arthritis commonly experience declines in vitality, physiological function, and low capacity for adaptation, contributing to a higher incidence of chronic diseases (Park et al., 2018). Arthritis is associated with the development of diabetes mellitus and coronary heart disease (Ton et al., 2021; Veronese et al., 2019). Other than its direct medical costs, arthritis also leads to additional non-medical expenses and low quality of life (Schofield et al., 2018; Spel and Martinon, 2020).
As a global public health concern, arthritis is estimated to impose considerable economic costs and health care burdens (Safiri et al., 2019). Given the rise in the incidence of arthritis and forecasting numbers of people affected, early screening for high-risk individuals, public health monitoring, and targeted interventions is vital for diminishing the burdens.
Insulin resistance (IR), characterized by a reduced biological response to the physiological effects of insulin, is widely recognized for its importance in inflammatory reactions (Matulewicz and Karczewska-Kupczewska, 2016; Shoelson et al., 2006). As a central feature of metabolic syndrome (MetS), IR has been increasingly identified as one of the determinants for the onset of arthritis via the following mechanisms (Tripolino et al., 2021). Through the accumulation of adipose tissue, the production of cytokines, chemokines, and adipokines are modulated, which serve as key mediators in this process (Ahmed et al., 2021; Wang and He, 2018). Besides, IR plays a role in the development of oxidative stress and the production of reactive oxygen species (ROS), both of which are significant determinants of arthritis (Hu et al., 2019). Additionally, IR is also associated with other chronic disease, which maybe risk factors for arthritis (Courties and Sellam, 2016; Janssen and Mark, 2006; Liang et al., 2022).
Triglyceride-glucose (TyG), an index combining fasting blood glucose (FBG) and triglycerides (TG), has been suggested as an alternative indicator for somatic disorders, such as metabolic abnormalities (Tao et al., 2022; Unger et al., 2014). Studies have hinted that TyG performed similarly to the homeostatic model assessment of insulin resistance (HOMA-IR) in evaluating insulin resistance (IR) compared with the hyper insulinemic-euglycemic clamp, while TyG has higher accuracy than HOMA-IR in the measurement of MetS (Khan et al., 2018; Tahapary et al., 2022). TyG has increasingly drawn attention as an emerging and alternative biomarker of IR and an independent predictor of cardiovascular outcomes and is also associated with risk factors for cardiovascular diseases (CVDs), such as hypertension and arterial stiffness (Jin et al., 2018; Won et al., 2020; Wu et al., 2021).
Recently, a novel association between elevated TyG level and the incidence of arthritis has been observed among American adults aged <60 years and Chinese persons aged >45 years (Liu et al., 2024; Yan et al., 2023). However, the underlying mechanisms driving the association between TyG level and the development of arthritis remain unclear, and the association between dynamic and longitudinal TyG and arthritis has not been elucidated. To address this gap, we aimed to explore the role and predictive value of longitudinal changes in TyG for monitoring the risk of arthritis in a nationwide cohort of Chinese older adults.
Materials and Methods
Study population
The Chinese Longitudinal Healthy Longevity Survey (CLHLS) recruited older adults from 22 provinces in China and followed them up since 1998. To date, the nationwide cohort has been followed for eight waves over a time period of more than 20 years. Blood samples were also collected in Wave 5 (2009), Wave 6 (2012), and Wave 7 (2014) (Zeng et al., 2017). In order to explore the relationship between TyG and arthritis, we analyzed the dataset of respondents who completed data collection in both Waves 6 and 7 (Fig. 1). As our follow-up period was from Wave 6 to Wave 7, the participants were excluded if they had been diagnosed with arthritis before Wave 6 (2012).
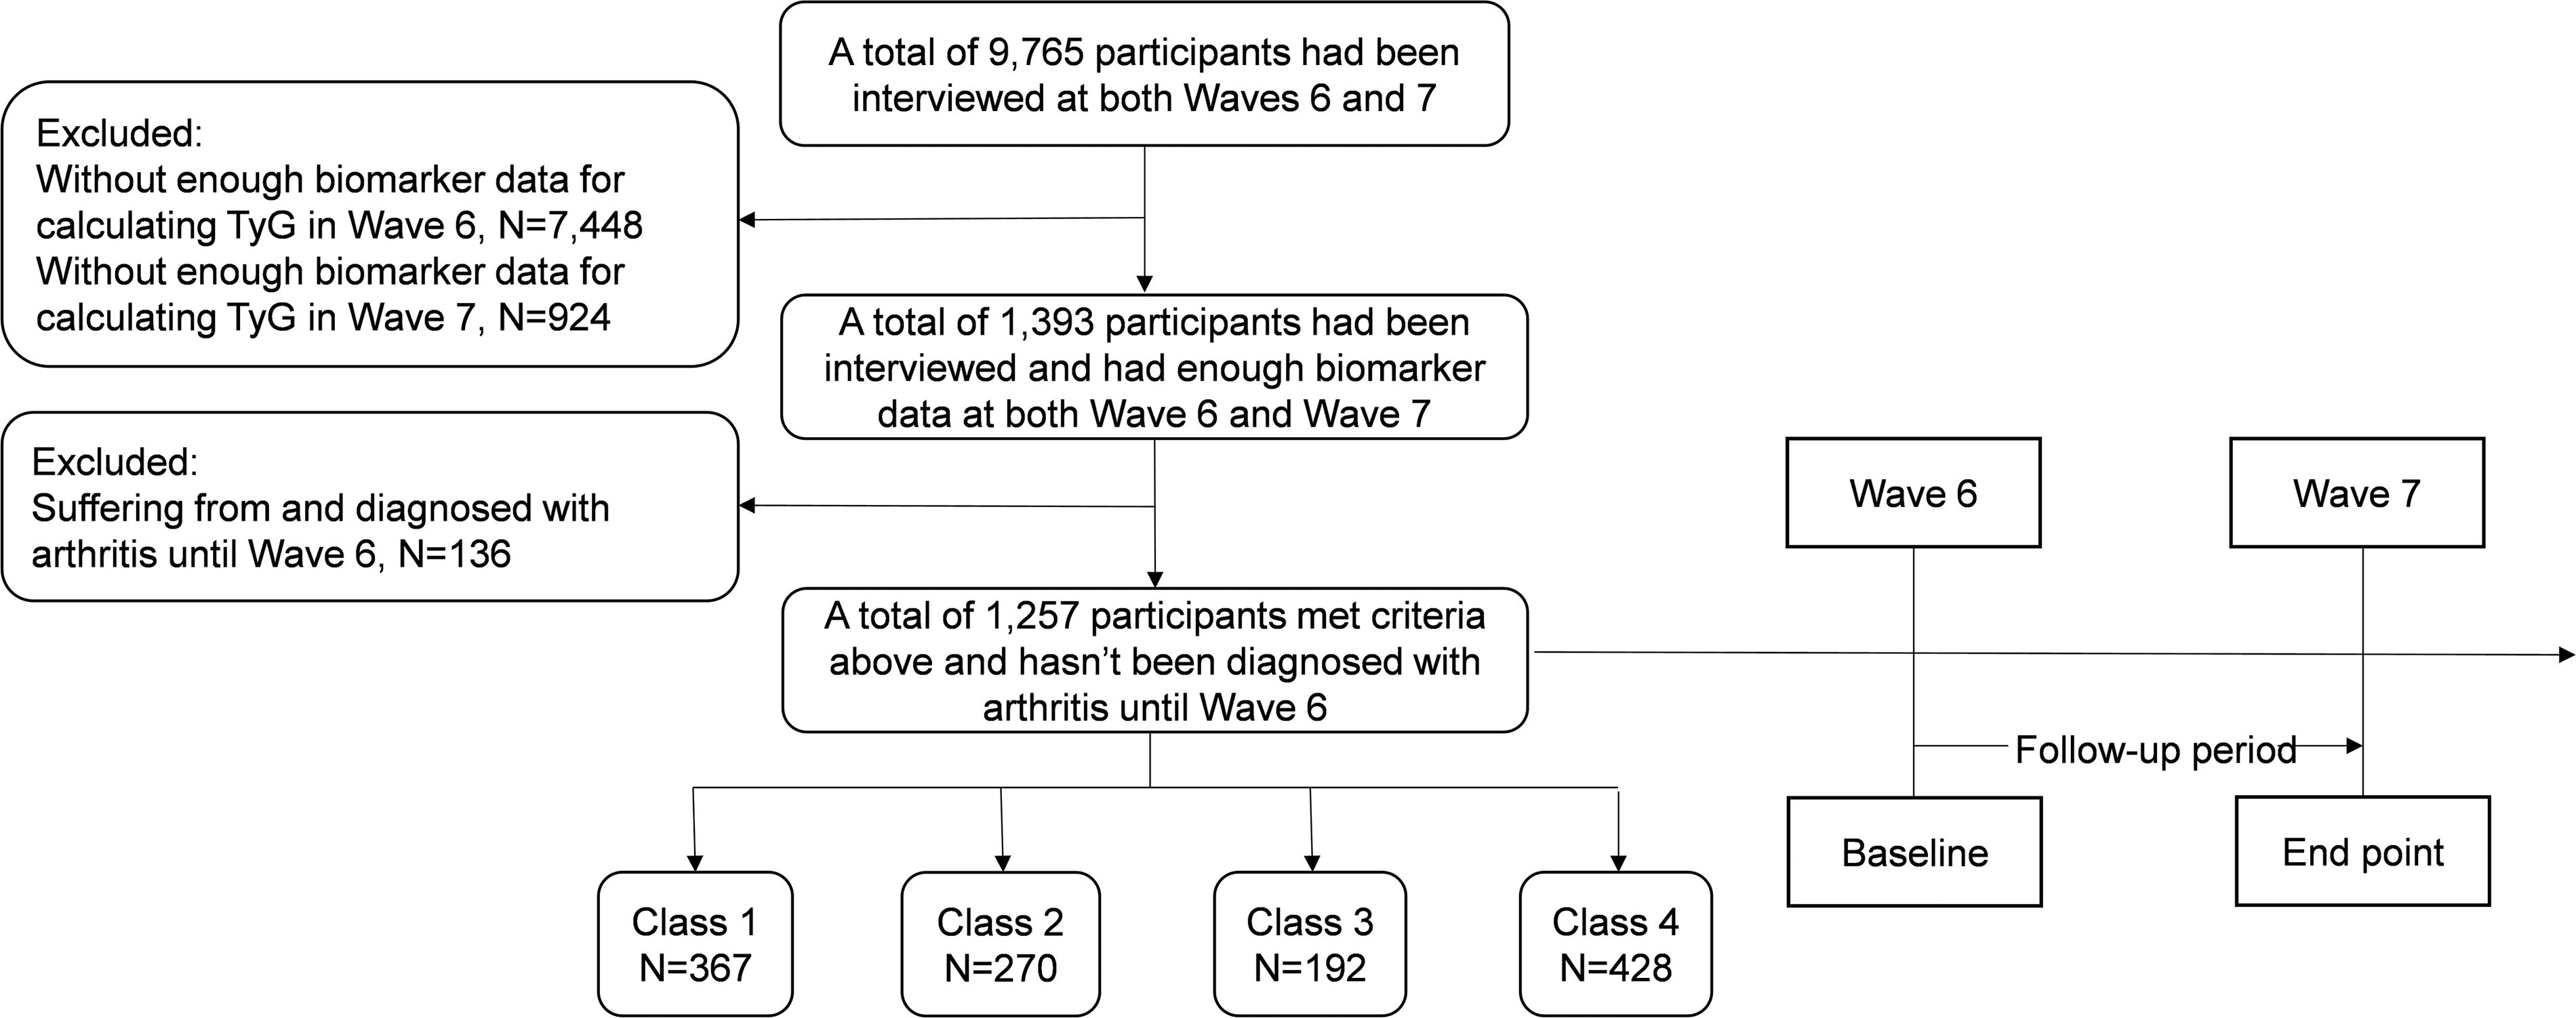
Flowchart of the study population. The participants were classified into four groups by k-means analysis: Class 1, moderate and stable TyG levels; Class 2, low but rising TyG levels; Class 3, consistently high TyG levels; and Class 4, high TyG levels with a sharp rise compared with baseline. TyG, triglyceride-glucose.
The CLHLS study obtained approval from the Peking University Research Ethics Committee (IRB00001052-13074). All participants signed written informed consent and the present study was conducted under the overall research ethics oversight of the authors’ institutions.
Data collection
The face-to-face interview was performed by the interviewers who had a bachelor’s degree and were trained in accordance with the study protocol. The major outcome of this study was the onset of arthritis. Individuals who were suffering from arthritis and diagnosed with arthritis were regarded as patients with arthritis.
The change in the TyG index was determined to be between Waves 6 and 7. The TyG indices were determined as follows:
(Simental-Mendía et al., 2008);
Sociodemographic characteristics and lifestyle behaviors were collected by self-reported questionnaire. Lifestyle behaviors encompassed diet patterns (i.e., consumption of fresh fruit, salt-preserved vegetables, and type of grease for cooking). Present health conditions comprised comorbid hypertension, diabetes, heart disease, and stroke. In addition, FBG, TG, systolic blood pressure (SBP) and diastolic blood pressure (DBP), body weight, and height were measured (Zhu et al., 2022). We applied the multiple imputation method for addressing missing covariates to maintain the largest possible sample size despite the small proportion of missing data (Noghrehchi et al., 2021).
Statistical analysis
Continuous variables were presented as means and standard deviations when they were normally distributed. Otherwise, median (M) and upper and lower quartiles (first quartile, third quartile) were applied. The Student’s t-test was performed to compare the normally distributed data, while regarding non-normally distributed data, Kruskal–Wallis test was used. The chi-squared tests or Fisher’s exact tests were carried out to compare categorical data.
As a dynamic parameter, the change of TyG levels in a 2-year follow-up was analyzed using k-means clustering, by which the participants were classified into n groups. Each observation of TyG was assigned to the cluster with the closest mean value, which served as the prototype of the cluster. The maximum number of classifications was five, with each group containing no less than two observations. The k-means clustering was acceptable when the number of clusters was four, by which the participants were classified into four groups: Class 1 with moderate and stable levels of TyG; Class 2 with low but rising level of TyG; Class 3 with consistently high TyG; and Class 4 with high and sharp TyG-level rise compared with the baseline.
After a 2-year follow-up, due to the absence of recorded time of arthritis occurrence, the logistic regression analysis was performed to evaluate the association between the change of TyG and the onset of arthritis. To evaluate the goodness of fit of models, we employed the Hosmer–Lemeshow (HL) goodness-of-fit test. The restricted cubic spline model was then conducted to examine the dose–response relationship of time-weighted cumulative TyG and arthritis risk. Akaike information criterion was then applied to identify the performance of different models.
Furthermore, subgroup and interaction analyses were applied to detect potential effect modifiers. The relative excess risk due to interaction (RERI), the attributable proportion due to interaction, and the synergy index were calculated to assess additive interactions (Knol et al., 2011; Zhang et al., 2021). The effects of the interaction analysis between TyG and covariates were evaluated with odds ratio (OR) and its 95% confidence interval (CI). All analyses were conducted with SPSS 26.0 (IBM Corporation, New York, USA) and R 4.3.2 (R Core Team, Vienna, Austria). A two-tailed p < 0.05 was considered statistically significant.
Results
Baseline characteristics of study participants
This study included 1257 participants (M age 82.0, 618 men and 639 women). As shown in Table 1, 1040 (82.7%) participants were recruited from rural areas, and 217 (17.3%) were from urban areas. The median value of TyG was 7.95 in 2012 and 8.36 in 2014, and the time-weighted cumulative TyG was 8.17. The numbers of participants comorbid with hypertension, diabetes, heart disease, and stroke were 333 (26.5%), 31 (2.5%), 107 (8.5%), and 92 (7.3%), respectively.
Baseline Characteristics According to the Change of TyG Index
The participants were classified into four groups by k-means analysis in accordance with the TyG index: Class 1, moderate and stable TyG levels; Class 2, low but rising TyG levels; Class 3, consistently high TyG levels; and Class 4, high TyG levels with a sharp rise compared with baseline.
DBP, diastolic blood pressure; M, median; Q1, first quartile; Q3, third quartile; SBP, systolic blood pressure; TyG, triglyceride-glucose.
Association between TyG and arthritis
We performed the k-means clustering analysis and classified the participants into four groups:
Class 1: TyG value was from 8.01 in 2012 to 7.95 in 2014, representing participants who had a consistently low TyG level; Class 2: TyG value was from 7.14 in 2012 to 7.99 in 2014, representing low TyG but rising during follow-up; Class 3: TyG value was from 9.08 in 2012 to 9.21 in 2014, representing a consistently high TyG; Class 4: TyG value was from 8.05 in 2012 to 8.71 in 2014, representing a high level of TyG and a rise during follow-up (Fig. 2).

The TyG index clustering by k-means clustering. The participants were classified into four groups by k-means analysis: Class 1, moderate and stable TyG levels; Class 2, low but rising TyG levels; Class 3, consistently high TyG levels; and Class 4, high TyG levels with a sharp rise compared with baseline. TyG, triglyceride-glucose.
At the end of the 2-year follow-up, 57 participants (4.5%) were diagnosed with arthritis. As shown in Table 2, compared with the participants in Class 1, those in Class 4 experienced a higher risk of arthritis, with an OR of 2.678 (95% CI: 1.243–5.771). After adjusting for potential confounders (i.e., sex, residence, eating habits, SBP, DBP, hypertension, diabetes, heart disease, and stroke), individuals in Class 3 (OR = 2.823; 95% CI: 1.113–7.160) and Class 4 (OR = 2.848; 95% CI: 1.299–6.246) had a significantly increased risk of arthritis compared with Class 1. p Value of HL test was 0.925, suggesting that the adjusted model fitted well.
Logistic Regression Analysis for the Association Between Groups and Arthritis
The participants were classified into four groups by k-means analysis in accordance with the TyG index: Class 1, moderate and stable TyG levels; Class 2, low but rising TyG levels; Class 3, consistently high TyG levels; and Class 4, high TyG levels with a sharp rise compared with baseline. Model 1, adjusted for sex, age, residence, and eating habits; Model 2, adjusted for covariates in model 1 and history of hypertension, diabetes, heart disease, stroke; Model 3, adjusted for covariates in model 2 and SBP and DBP.
CI, confidence interval; DBP, diastolic blood pressure; OR, odds ratio; SBP, systolic blood pressure; TyG, triglyceride-glucose.
Dose–response analysis between TyG and arthritis
As shown in Supplementary Figure 1A, restricted cubic spline models revealed that the dose–response relationship between time-weighted cumulative TyG index and arthritis was not significant (poverall = 0.132, pnon-linear = 0.803). Besides, the baseline TyG in 2012 was not associated with arthritis in a dose–response manner (poverall = 0.221, pnon-linear = 0.349) (Supplementary Fig. 1B).
Subgroup analyses
We performed subgroup analyses to stratify the relevance between the change of TyG and the onset of arthritis and explored the interaction between each covariate and the change of TyG on the onset of arthritis. Younger participants, those who frequently consumed vegetable grease, and those with higher SBP were at a higher risk of arthritis when their TyG levels were high. As shown in Table 3, we did not find any statistically significant interactions between the covariates and the change of TyG. In addition, we developed the additive models to analyze the interactions; nevertheless, no additive interaction was found between the change of TyG and covariates (Supplementary Table S1).
Subgroup Analysis of Association Between Risk Classes and Arthritis
The participants were classified into four groups by k-means analysis in accordance with the TyG: Class 1, moderate and stable TyG levels; Class 2, low but rising TyG levels; Class 3, consistently high TyG levels; and Class 4, high TyG levels with a sharp rise compared with baseline.
CI, confidence interval; DBP, diastolic blood pressure; OR, odds ratio; Ref, reference; SBP, systolic blood pressure; TyG, triglyceride-glucose.
Discussion
With an aging population, many countries and public health systems are in need of novel approaches to the prevention and monitoring of common chronic diseases such as arthritis and technologies that can help better understand the determinants of health (GBD 2021 Osteoarthritis Collaborators, 2023; Muniz-Santos et al., 2023). The current decade 2021–2030 was designated by the United Nations as the decade of healthy aging, which by extension underlines the need for public health innovation for arthritis clinical care.
TyG index is a novel and emerging parameter closely associated with diabetes and CVDs and has been suggested to indicate the risk of arthritis. The present study provides new evidence that older adults who had a consistently high level of TyG and those with a sharp increase of TyG over time from 2012 to 2014 in our study sample might have faced a higher risk of arthritis. These data inform new approaches and public health innovation for monitoring arthritis, and call for future research to identify dose–response relationships between TyG indices, that is, baseline TyG, and time-weighted cumulative TyG and arthritis. In all, TyG may serve as a valuable predictor for arthritis, which could contribute to early identification and prevention of this common health problem with broad public health significance.
As an emerging predictive factor for disease incidence, TyG was reportedly associated with a variety of diseases, including diabetes (Kuang et al., 2023; Park et al., 2021), stroke (Huo et al., 2024), nephrolithiasis (Qin et al., 2021), erectile dysfunction (Yilmaz et al., 2021), gastric cancer (Kim et al., 2022), low skeletal muscle mass index (Ahn et al., 2020). In terms of mental health, it was reported that TyG is associated with depression among American adults (Shi et al., 2021). TyG was also found to be associated with poor function in multiple cognitive domains based on the Multimodal Interventions to Delay Dementia and Disability in Rural China cohort (Tian et al., 2024). Additionally, TyG is associated with poor outcomes of COVID-19 infection (Ren et al., 2020).
A cross-sectional study published in 2023 found that TyG is independently correlated with arthritis in the general population in the United States (Yan et al., 2023). A cohort analysis based on the China Health and Retirement Longitudinal Study also demonstrated the clinical value of baseline TyG for predicting the onset of arthritis, suggesting TyG as one of the independent indicators of arthritis among individuals aged 45 years or older (Liu et al., 2024). In addition, the National Health and Nutrition Examination Survey highlighted that persons with increased TyG levels have a higher likelihood of osteoarthritis prevalence (Huang et al., 2024). However, these studies focus on the relationship between TyG level at a single point in time and arthritis, limiting the robustness of the findings in causal relationship inferences. Our study explored the role of the longitudinal change of TyG levels in predicting arthritis among older Chinese adults. We found that individuals with a higher level of TyG, including consistently higher and longitudinally rising TyG, had an elevated risk of arthritis.
Subgroup analyses indicated that when the TyG level was higher, younger individuals were exposed to a higher risk of developing arthritis. Contrary to the findings of previous research (Liu et al., 2024). This may be attributed to a form of survivor bias, as older adults are generally more health-conscious and likely to engage in preventive behaviors compared with younger individuals. Additionally, for participants with a history of other chronic diseases, the change of TyG has no significant association with arthritis. This might be attributed to the influence of treatment regimens and medications, which could interfere with the indicators affecting TyG levels and arthritis (Wu et al., 2023). However, based on the adjusted logistic regression model, maintaining good control of TyG levels may reduce arthritis risk. Therefore, researchers can acquire invaluable insights into an individual’s susceptibility to arthritis by monitoring the long-term changes in TyG, which enables the implementation of early intervention and prevention strategies for arthritis-related disability.
The underlying mechanisms linking TyG with arthritis have not been fully elucidated. The association may be interpreted through IR and its related pathways (Li et al., 2023; Xiao et al., 2023). Insulin resistance is closely associated with obesity, with adipose tissue playing a critical role in the mechanisms linking IR to arthritis (Ahmed et al., 2021). It serves as the primary source of cytokines, chemokines, and adipokines, which act as key mediators in this process(Wang and He, 2018).
Inflammatory cytokines can inhibit insulin signaling, which induces chondrocyte injury and contributes to the development of arthritis (Li et al., 2022a; Phornphutkul et al., 2006; Rosa et al., 2011). Since glucose metabolism is crucial for immune cell function, IR indirectly influences immune responses, which may also contribute to the occurrence of arthritis (Tripolino et al., 2021). Additionally, certain adipokines (e.g., leptin and adiponectin) are associated with IR and contribute to systemic low-grade inflammation (Francisco et al., 2022; Han et al., 2024). It has been suggested that systemic low-grade inflammation response plays a crucial role in the development of arthritis, leading to structural joint damage (Berenbaum, 2013; Gregor and Hotamisligil, 2011).
Moreover, IR plays a role in the development of oxidative stress and the production of ROS, both of which are significant determinants of arthritis (Hu et al., 2019). ROS may disrupt cellular redox pathways and then cause direct oxidative damage to chondrocytes (Bolduc et al., 2019). Furthermore, it is plausible that individuals with IR are more likely to suffer from other chronic diseases, such as hypertension and MetS, all of which are well-established risk factors for arthritis (Courties and Sellam, 2016; Janssen and Mark, 2006; Liang et al., 2022).
Multi-omics tools, including genomics, transcriptomics, proteomics, metabolomics, and microbiomics, have been introduced to the research of TyG and diseases (Jiang et al., 2024; Kityo and Lee, 2023; Li et al., 2022b). However, the relationship between TyG and arthritis remains to be further investigated. For instance, while arthritis is known to have a strong genetic component, there is a lack of genomics-based research, such as Mendelian randomization, to elucidate the relationship between TyG and arthritis (Aubourg et al., 2022; Boer et al., 2021; Padyukov, 2022). Future researches employing advanced omics methodologies could provide valuable insights into the mechanisms underlying the TyG-arthritis association.
To the best of our knowledge, this is the first study exploring the association between dynamic longitudinal changes in TyG and arthritis. Our study had several limitations that commonly exist in observational studies. First, although the association between dynamic TyG index and arthritis was evident in this cohort study, we did not reveal the mechanism in detail. Second, the follow-up period of our analysis was relatively short. Third, the CLHLS cohort did not classify arthritis into the detailed forms of the disease. Fourth, in the current cohort, the Cox proportional hazards model cannot be employed due to the lack of recorded time of arthritis occurrence. Fifth, a lower sample size limited the representativeness of the findings. The participants were predominantly from rural areas, which may introduce selection bias, limiting the generalizability of our findings. Therefore, it is necessary to verify this hypothesis in multicenter studies and to use cohort studies or Mendelian randomization studies to explore the causal association between TyG and arthritis.
Conclusion
Older adults with higher levels of TyG indices, including consistently higher and longitudinally rising TyG, might experience a higher risk of arthritis. These findings open up new avenues for public health monitoring of arthritis among older adults. Further studies on world populations are called for.
Footnotes
Authors’ Contributions
J.L.: Formal analysis (equal), investigation (equal), validation (supporting), writing—original draft (equal). J.W.: Formal analysis (equal), investigation (equal), validation (supporting), writing—original draft (equal). Y.Z.: Investigation (equal), data curation (equal). X.J.: Investigation (equal), data curation (equal). H.D.: Project administration (equal), writing—review and editing (equal). L.Z.: Methodology (equal), resources (equal). J.H.: Methodology (equal), resources (equal). X.P.: Resources (equal), validation (lead). S.T.: Conceptualization (equal), project administration (equal), supervision (supporting), writing—review and editing (equal). H.H.: Conceptualization (equal), funding acquisition, supervision (lead), writing—review and editing (equal).
Author Disclosure Statement
No potential conflict of interest relevant to this article was reported.
Funding Information
This work was supported by the Shandong Provincial Medical and Health Science and Technology Development Project (
Abbreviations Used
References
Supplementary Material
Please find the following supplemental material available below.
For Open Access articles published under a Creative Commons License, all supplemental material carries the same license as the article it is associated with.
For non-Open Access articles published, all supplemental material carries a non-exclusive license, and permission requests for re-use of supplemental material or any part of supplemental material shall be sent directly to the copyright owner as specified in the copyright notice associated with the article.