




Abstract
Amyloid deposits formed by misfolding and aggregation of human islet amyloid polypeptide (hIAPP) are one of the key pathophysiological features of type 2 diabetes mellitus (T2DM) and have been associated with the loss of function and viability of the pancreatic β-cells. The molecular processes by which hIAPP induces cytotoxicity in these cells are not well understood. To the best of our knowledge, this is the first report describing findings from the combined analysis of Affymetrix microarray and high-throughput sequencing (HTS) Gene Expression Omnibus (GEO) datasets of hIAPP-transgenic (Tg) mice islets. In brief, using GEO data, we compared in silico the pancreatic islets obtained from hIAPP-Tg and wild-type mice. Affymetrix microarray datasets (GSE84423, GSE85380, and GSE94672) and HTS datasets (GSE135276 and GSE148809) were chosen. Weighted gene coexpression network analysis was performed using GSE135276 to identify the coexpressed gene networks and establish a correlation pattern between gene modules and hIAPP overexpression under hyperglycemic conditions. Subsequently, we analyzed differential gene expression with the remaining datasets. Network analysis was performed to identify hub genes and the associated pathways using Cytoscape. Key findings from the present study include identification of seven hub genes, namely, Ins2, Agt, Jun, Fos, CD44, Igf1, and Ppar-γ, significantly involved in the process(es) of insulin synthesis and secretion, development of insulin resistance, oxidative stress, inflammation, mitophagy, and apoptosis. In conclusion, we propose that these hub genes can help explain T2DM pathogenesis and can be potentially utilized to develop therapeutic interventions targeting hIAPP for clinical management of T2DM.
Introduction
In response to glucose and other secretagogues, the pancreatic β-cells synthesize and secrete a 37-amino-acid-long neuroendocrine peptide hormone called human islet amyloid polypeptide (hIAPP, also called amylin) (Westermark et al., 2011). Under normal conditions, hIAPP exerts anorexigenic effects and contributes toward promoting β-cell proliferation and signaling via an autocrine mechanism, thus playing a major role in maintaining glucose homeostasis (Visa et al., 2015; Zhang et al., 2016). However, under metabolically stressed conditions (glucotoxicity, lipotoxicity, and inflammatory cytokines), hIAPP tends to misfold, leading to the formation of oligomers and fibrils. This subsequently leads to the accumulation of insoluble hIAPP aggregates, which have been associated with the reduced functionality and cytotoxicity observed in pancreatic β-cells in type 2 diabetes mellitus (T2DM) (Bishoyi et al., 2021; Khin et al., 2023). These deposits have also been detected in other tissues such as the kidney, heart, and brain of patients with T2DM (Alrouji et al., 2023; Hassan et al., 2022).
Unlike the human variant of IAPP, the rodent and murine forms of IAPP do not aggregate, a difference attributed to the presence of proline residues in the IAPP sequence of these species (Roham et al., 2022; Westermark et al., 2011). Due to this feature, different model systems, including in vitro cultured cells exposed to synthetic hIAPP (Dubey et al., 2021; Pilkington et al., 2016); hIAPP-transgenic (Tg) animal cells (Hernandez et al., 2018; Yoo and Joo, 2021); hIAPP-Tg animal models (Franko et al., 2018; Hogan et al., 2019); and ex vivo cultured human islets (Bortoletto et al., 2022; Potter et al., 2015), have been extensively used to gain a deeper understanding of the mechanisms that underpin hIAPP amyloid formation, inhibition of amyloid formation, and its implications in T2DM. Research utilizing these models has demonstrated that hIAPP overexpression in β-cells is associated with multiple pathophysiologies that include mitochondrial dysfunction, high levels of reactive oxygen species, stimulation of endoplasmic reticulum stress, production of proinflammatory cytokines, inhibition of autophagy, and disruption of cell membrane structure and function—mechanisms implicated in the causation of T2DM (Alrouji et al., 2023; Bishoyi et al., 2021; Li and Zhang, 2025).
At present, it is not clear which factors contribute to hIAPP misfolding and aggregation in the pancreatic islets in T2DM. The existing T2DM treatment modalities do not effectively target hIAPP aggregation, and there are no clinically approved screening methods available for the detection of hIAPP aggregates (Bortoletto et al., 2022). Therefore, gaining deeper insights into the signaling pathways involved in the same is crucial for deducing hIAPP’s role in T2DM. This would further aid in the development of hIAPP-targeted therapeutic interventions for the effective management of T2DM.
The current study is a step in this direction, wherein we aimed to identify the signaling pathways and transcriptomic signatures involved in pancreatic β-cell dysfunction mediated by hIAPP overexpression. The transcriptomic profiles of pancreatic islets obtained from hIAPP-transgenic (Tg) mice and wild-type (WT) mice reported in the publicly available Gene Expression Omnibus (GEO) datasets were compared to identify the differentially expressed genes (DEGs) under hyperglycemic conditions. The study identified seven hub genes and their related signaling pathways involved in hIAPP-mediated cytotoxicity in T2DM.
Materials and Methods
Overview of the study design and workflow
GEO profiles of pancreatic islets from hIAPP-Tg mice and WT mice obtained by Affymetrix microarray and high-throughput sequencing (HTS) were used. The coexpressed gene networks were identified using weighted gene coexpression network analysis (WGCNA) (Langfelder and Horvath, 2008), and a correlation pattern between different gene modules and the experimental conditions was established. This was followed by differential gene expression analysis. The overlapping genes were then identified, and further analysis was performed using different bioinformatic tools (Fig. 1).
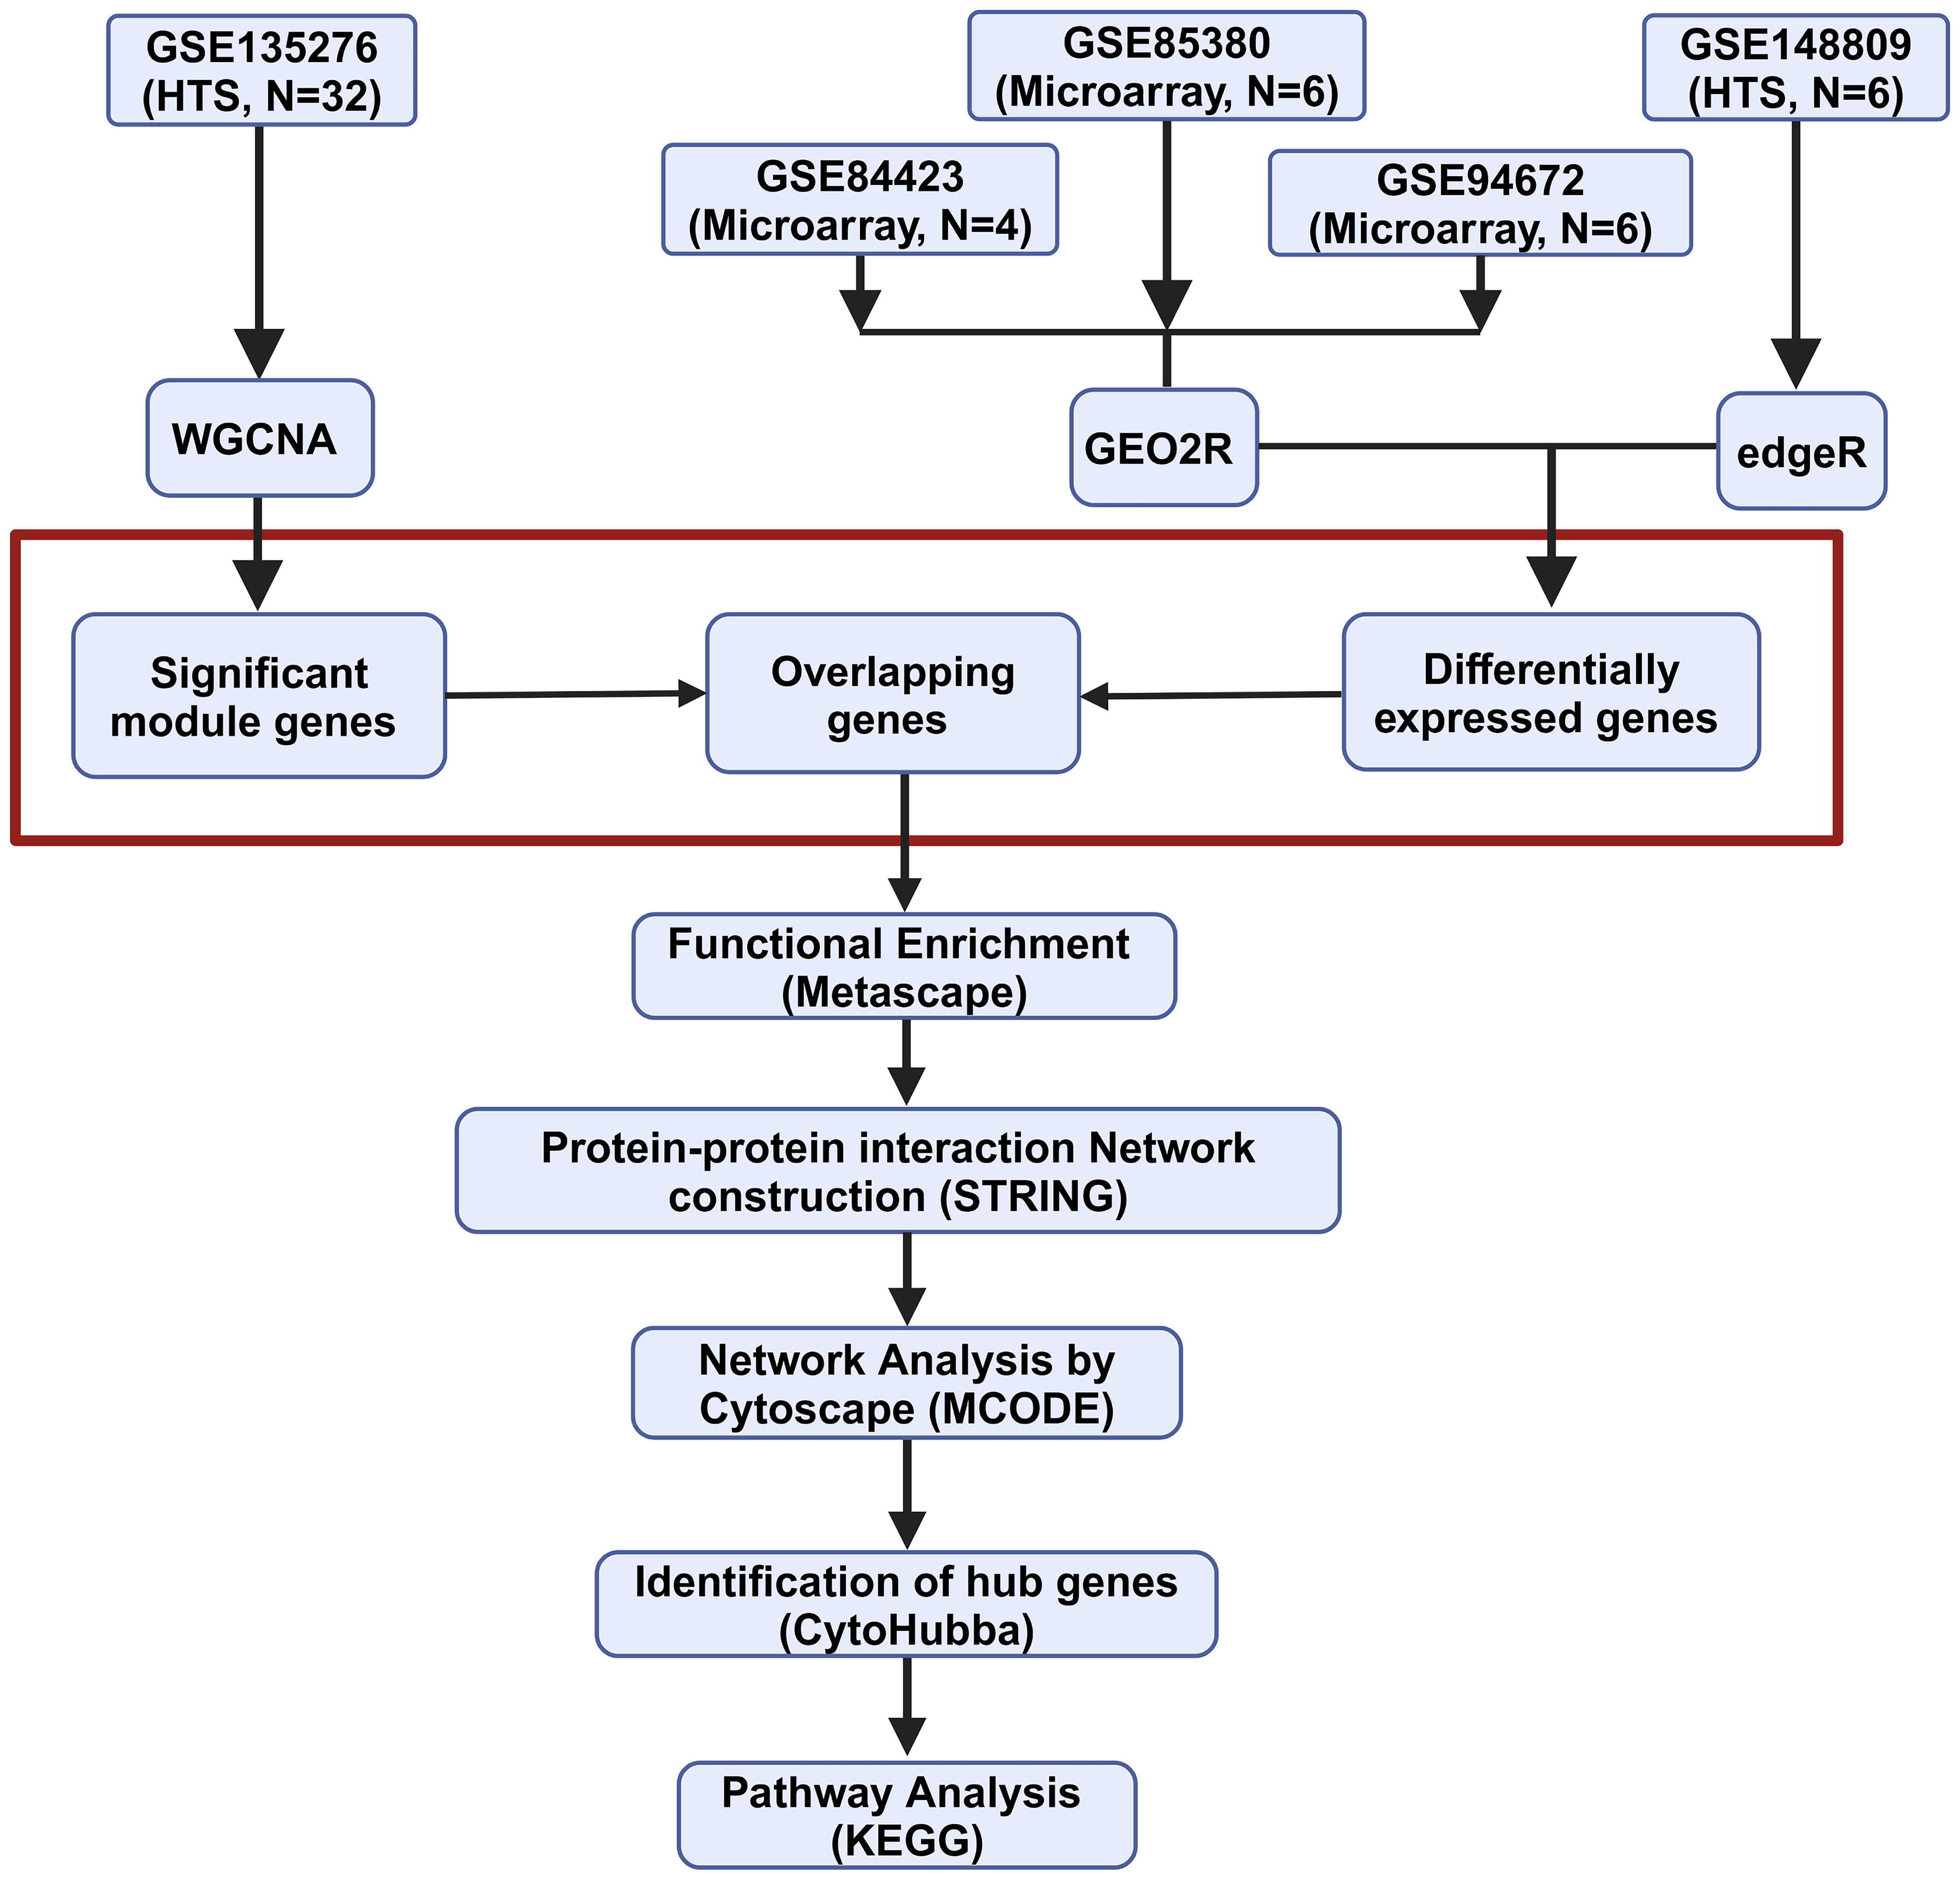
Schematic representation of the workflow of the study. edgeR, empirical analysis of digital gene expression data in R; GEO2R, Gene Expression Omnibus R-based tool; HTS, high-throughput sequencing; KEGG, Kyoto Encyclopedia of Genes and Genomes; MCODE, molecular complex detection; STRING, Search Tool for the Retrieval of Interacting Genes; WGCNA, weighted gene coexpression network analysis.
The study utilized publicly available data and, thus, did not require informed consent or approval from a research ethics committee. The study was conducted under the overall research ethics oversight of the authors’ institutions.
Data curation
GEO datasets is an open-access repository available at the National Center of Biotechnology Information (NCBI) (https://www.ncbi.nlm.nih.gov/gds/?term=). The transcriptomic profiles of pancreatic islets from hIAPP-Tg mice were searched using the keyword—“hIAPP-Transgenic mice islets”; filters: organism—Mus musculus; and type—“Expression profiling by array” and “high-throughput sequencing.” Five datasets were obtained (till June 30, 2024), out of which three datasets, namely, GSE84423, GSE85380, and GSE94672, were recorded on the Affymetrix microarray platform, while the other two datasets, namely, GSE135276 and GSE148809, were HTS datasets. The datasets GSE84423 and GSE94672 have been based on the GPL11180 [HT_MG-430_PM] (Affymetrix HT MG-430 PM Array Plate) platform; GSE85380 is based on the GPL1261 [Mouse430_2] Affymetrix Mouse Genome 430 2.0 Array platform; and the datasets GSE135276 and GSE148809 were based on the GPL17021 Illumina HiSeq 2500 (Mus musculus) platform. From these datasets, the expression profiles of the pancreatic islets obtained from WT and hIAPP-Tg mice were selected for the final analysis (Supplementary Table S1). To minimize the platform-specific bias, the differential expression analysis was conducted independently for each dataset, and then common DEGs were determined, which were used for further analysis.
Weighted gene coexpression network analysis
Four of the datasets selected for the analysis, namely, GSE84423, GSE85380, GSE94672, and GSE148809, report the expression profiles of pancreatic islets isolated from WT and hIAPP-Tg mice. These islets were not cultured ex vivo and were used directly for the transcriptomic analysis. On the contrary, the data reported from the dataset GSE135276 are from pancreatic islets obtained from WT and hIAPP-Tg mice, which have been cultured ex vivo in two glucose concentrations—11.1 and 16.7 mM, the latter representing the high plasma glucose levels reported in diabetic conditions. Hence, this dataset was chosen for the WGCNA (Langfelder and Horvath, 2008) to identify the genes that are coexpressed in hIAPP-Tg pancreatic islets and corelate their expression with hyperglycemia.
First, the data from GSE135276 were normalized using the “voom” function of the limma package (version 3.59.1), which transformed the count data into log2 values with variance stabilization (Law et al., 2014). R software (version 4.0.4) package—WGCNA, was used to construct coexpression gene modules mapped with the four different traits: WT islets cultured ex vivo in media containing (1) 11.1 mmol/L glucose and (2) 16.7 mmol/L glucose; and hIAPP-Tg mouse islets cultured in media containing (3) 11.1 mmol/L glucose and (4) 16.7 mmol/L glucose. The outliers were first removed, followed by the construction of an adjacency matrix by using the pickSoftThreshold function. Subsequently, topological overlap matrices (TOMs) and the corresponding dissimilarity (1-TOM) were obtained from the adjacency values. Next, hierarchical clustering of TOM was performed, and dynamic tree cutting was used following the package manual for detecting gene modules. The parameters were set as following: soft Power = 14, cor Options = list (use = “p,” method = “Pearson”), TOM type = “unsigned,” min Module Size = 30, deep Split = 2, MEDissThres = 0.2. The correlation between the modules and the experimental condition was then obtained by calculating gene significance (GS) and module membership (MM). The higher the absolute value of GS, the more biologically significant the gene is. MM, on the contrary, provides information about the correlation coefficient between the genes and module eigengenes, which is used to represent the reliability of a gene belonging to a module (Langfelder and Horvath, 2008).
Differential gene expression analysis
To identify the DEGs in hIAPP-Tg mice, the expression profiles of the pancreatic islets of hIAPP-Tg mice were compared with WT mice. The microarray datasets (GSE84423, GSE85380, and GSE94672) contained preprocessed data that had been provided with log2-transformed robust multiarray average values. This normalization method includes background correction, quantile normalization, and median polish summarization, ensuring that data are comparable across different datasets (Kim et al., 2014). The DEGs for these datasets were identified by performing GEO2R analysis in the NCBI GEO database (https://www.ncbi.nlm.nih.gov/geo/geo2r/). This analysis uses the limma package by default, which applies an empirical Bayes procedure that accounts for variability within and across datasets (Ritchie et al., 2015).
The HTS dataset, GSE148809, was analyzed using R software (version 4.0.4) Bioconductor package, empirical analysis of digital gene expression data in R (edgeR) (version 3.32.1). The tool applies TMM (trimmed mean of M-values) normalization by default for the correction of differences in sequencing depth and compositional bias (Robinson and Oshlack, 2010).
The Benjamini–Hochberg test was employed to control the false discovery rate (FDR) in GEO2R as well as edgeR analysis. The output “.tsv” files were converted into “.xlsx” format for further analysis using Microsoft Office Excel 2021 (Microsoft Corporation, WA, USA). DEGs were identified by arranging gene symbols in alphabetical order and applying a threshold of log fold change (logFC) ≥0.5 (for upregulated genes) and logFC ≤−0.5 (for downregulated genes), as well as a p value ≤0.05. The purpose of setting the cutoff values at 0.5FC was to capture the largest number of DEGs possible with statistically significant p values (p ≤ 0.05). To eliminate any duplicate values in the screened data, the conditional formatting command in MS Excel was utilized.
Identification of overlapping genes
To identify the overlapping genes among the five datasets, the gene list of each significant module obtained after WGCNA of GSE135276 was subjected to Venn analysis (https://bioinformatics.psb.ugent.be/webtools/Venn/) with a list of DEGs for each dataset, namely, GSE84423, GSE85380, GSE94672, and GSE148809.
Functional enrichment of overlapping DEGs
The shortlisted overlapping DEGs were submitted to Metascape (version 3.5)—a gene annotation and analysis resource, which is a web-based platform specially created for identifying biological processes and functionally enriched pathways in the gene list submitted online (https://metascape.org) (Zhou et al., 2019). Next, Mus musculus was selected as an input, as well as the analysis species, and the express analysis option was selected.
Constructing a protein–protein interaction network
The online Search Tool for the Retrieval of Interacting Genes (STRING; https://string-db.org/) was used to construct a protein–protein interaction (PPI) network (Szklarczyk et al., 2019). The shortlisted overlapping DEGs were submitted in the “Multiple proteins”—search window in STRING (version 12.0), and the organism “Mus musculus” was selected. To build a PPI network, the cutoff criteria as a confidence score ≥0.4 and the maximum number of interactors = none/query proteins only were set. The confidence score ≥0.4 minimizes the false positives and ensures that the network created has interactions supported by experimental evidence, computational predictions, and text mining of the scientific literature (Szklarczyk et al., 2023; Szklarczyk et al., 2025). The maximum number of interactors = none/query proteins only detects direct and specific interactions of query proteins, eliminating the interaction of unrelated proteins, thus creating a biologically relevant/meaningful PPI network.
To analyze the PPI network created, the data from STRING were exported in a tabular text output (.tsv) file. The PPI network was visualized and analyzed by using Cytoscape software (version 3.10.3) (Shannon et al., 2003). To identify the important clusters in the PPI network, Molecular Complex Detection (MCODE version 2.0.2)—a Cytoscape software plugin was used. To determine the significant clusters, the criteria were defined as—fluff, degree cutoff = 2; node density cutoff = 0.1; node score cutoff = 0.2; K-core = 2; and maximum depth = 100 (Bader and Hogue, 2003).
Hub gene identification
To determine the hub genes from the significant MCODE clusters, the Cytoscape software plugin—“CytoHubba” (version 0.1) was used (Chin et al., 2014). Each significant cluster obtained by MCODE was analyzed by using the topological algorithm—“Degree.” The shortlisted genes were examined for their expression across all the datasets.
Pathway analysis
To find out the different pathways involving identified hub genes Kyoto Encyclopedia of Genes and Genomes (KEGG) mapper tool version 5.0 was utilized (https://www.genome.jp/kegg/mapper/) (Kanehisa et al., 2022).
Results
Weighted gene coexpression network analysis
To explore the correlation of hIAPP aggregation with high-glucose conditions, WGCNA was performed with the dataset GSE135276. The samples were clustered based on their Euclidean distance. Figure 2A shows that there were no outliers in the supplied sample set. The soft threshold was set to 14 to fit a scale-free network and the maximum mean connectivity, while the scale-free R2 was more than 0.8 (Fig. 2B). A total of 40 coexpression modules, each with a minimum of 30 genes, were identified using the Dynamic Tree Cut method and have been depicted as a dendrogram (Fig. 2C). The module–trait relationship has been represented in Figure 2D. The genes listed under the “cyan” (r = 0.98, p < 1e-200) and the “turquoise” modules (r = 0.97, p < 1e-200) were found to be highly correlated with high-glucose exposure in islets isolated from hIAPP-Tg mice (Fig. 2E). Therefore, genes from these modules were used for further analysis.
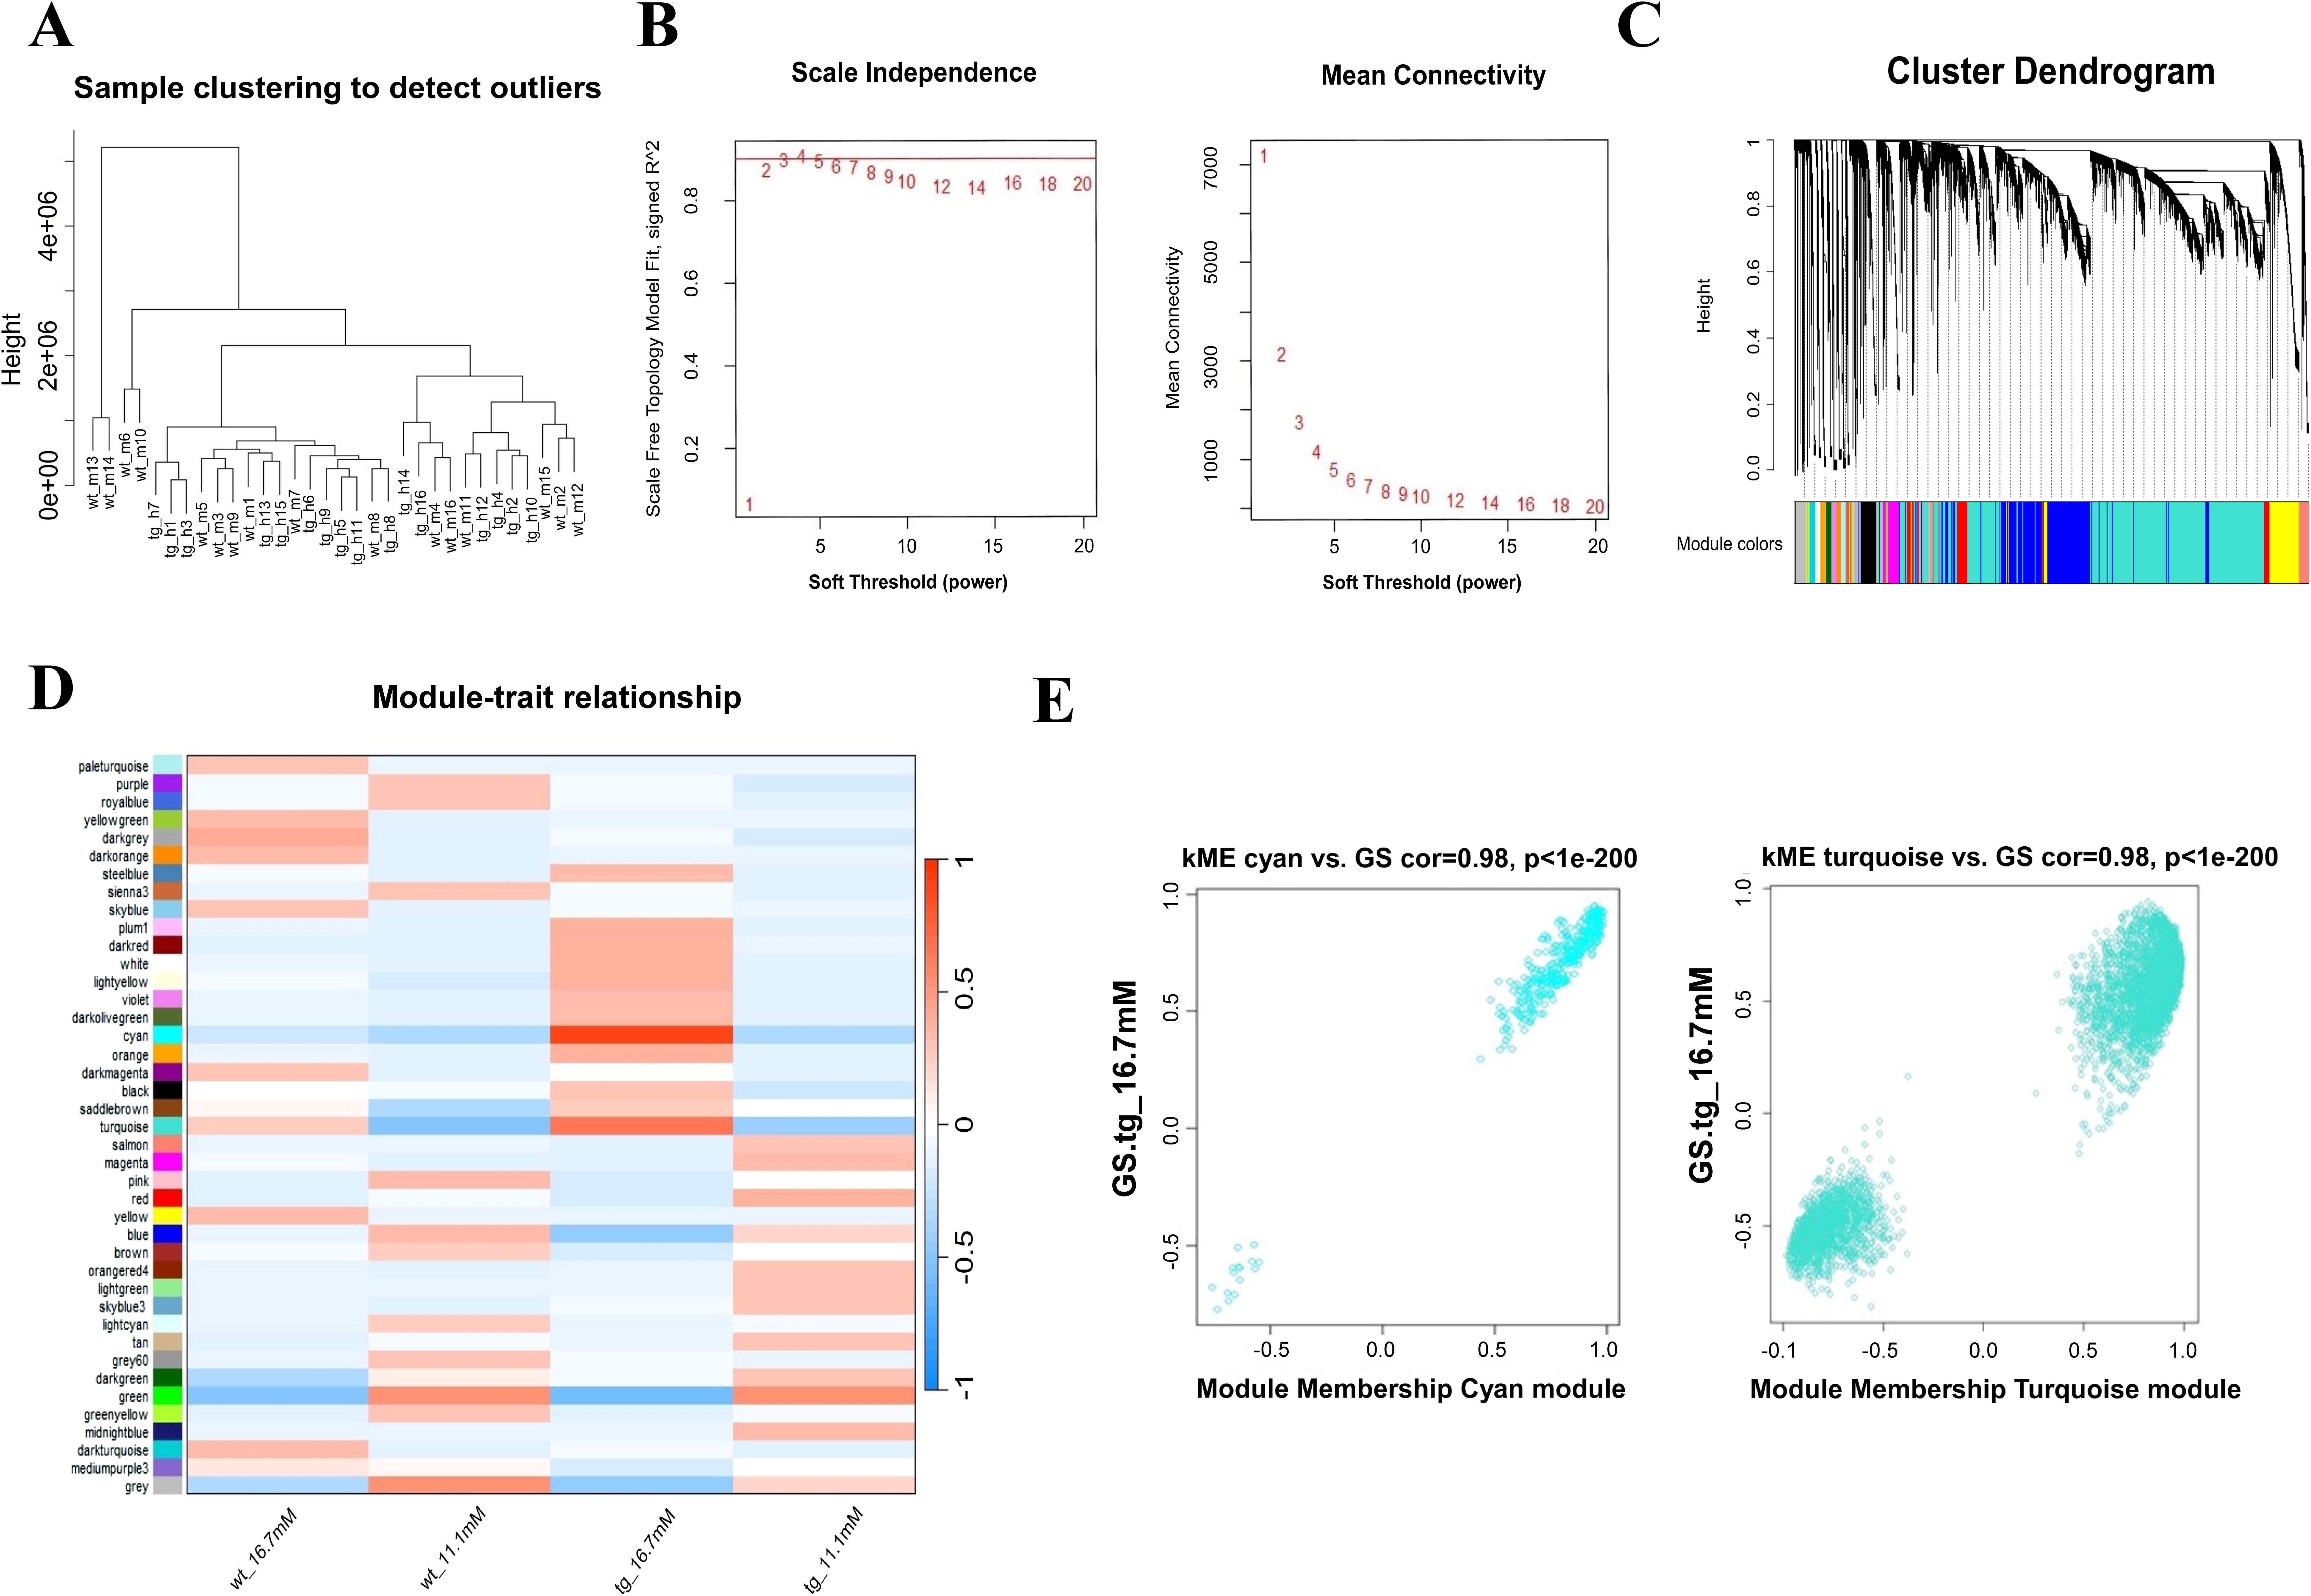
Result of proper soft thresholding value (β-value) for constructing a scale-free network:
Differential gene expression analysis
For the identification of DEGs expressed in hIAPP-Tg mice, the transcriptomic profiles of hIAPP-Tg mice were compared with WT mice. The total statistically significant DEGs for GSE84423, GSE85380, GSE94672, and GSE148809 were found to be 2647, 273, 280, and 1452, respectively (Table 1; Supplementary Data).
The Number of Up- and Downregulated Differentially Expressed Genes for Each Gene Expression Omnibus Dataset Used for the Analysis
Identification of overlapping genes
To identify overlapping genes from the two highly correlated modules, cyan and turquoise identified using WGCNA and DEGs from other datasets, Venn was plotted. A total of 1063 genes found to be overlapping with the DEGs, out of which 129 DEGs were common with cyan module genes (Fig. 3A) and 934 DEGs with turquoise module genes (Fig 3B) (Fig. 3 Supplementary Data), were used for further analysis.

Identification of overlapping differentially expressed genes across the selected datasets (GSE84423, GSE85380, GSE94762, and GSE148809) and the
Functional enrichment of overlapping genes
The functional enrichment of identified overlapping DEGs was carried out by using Metascape. For the submitted list of genes, Metascape showed a bar graph of the top 20 functionally enriched clusters colored according to the increasing p values in the output file (Supplementary Table S2). Out of the top 20 functionally enriched clusters in the bar graph (Fig. 4A), 17 represented Gene Ontology (GO) biological processes, namely—positive regulation of locomotion, regulation of mitogen-activated protein kinase (MAPK) cascade, regulation of inflammatory response, positive regulation of phosphorus metabolic process, regulation of smooth muscle cell proliferation, regulation of myeloid leukocyte-mediated immunity, wound healing, regulation of secretion, carboxylic acid biosynthetic process, actin cytoskeleton organization, response to hypoxia, response to corticotropin-releasing hormone, negative regulation of MAPK cascade, regulation of muscle system process, endocytosis, cell–cell adhesion, and regulation of tumor necrosis factor superfamily cytokine production. Out of the three remaining clusters, two represented Wiki pathways—microglia pathogen phagocytosis pathway, and Tyrobp causal network in microglia; and one was KEGG pathway—osteoclast differentiation, Mus musculus (house mouse). These enriched pathways have also been depicted as a network of clusters. Each cluster is represented by a colored circular node, wherein the size of the node reflects the number of input genes (Fig. 4B); and nodes are colored based on their p values, wherein the darker colors indicate greater statistical significance (Fig. 4C).
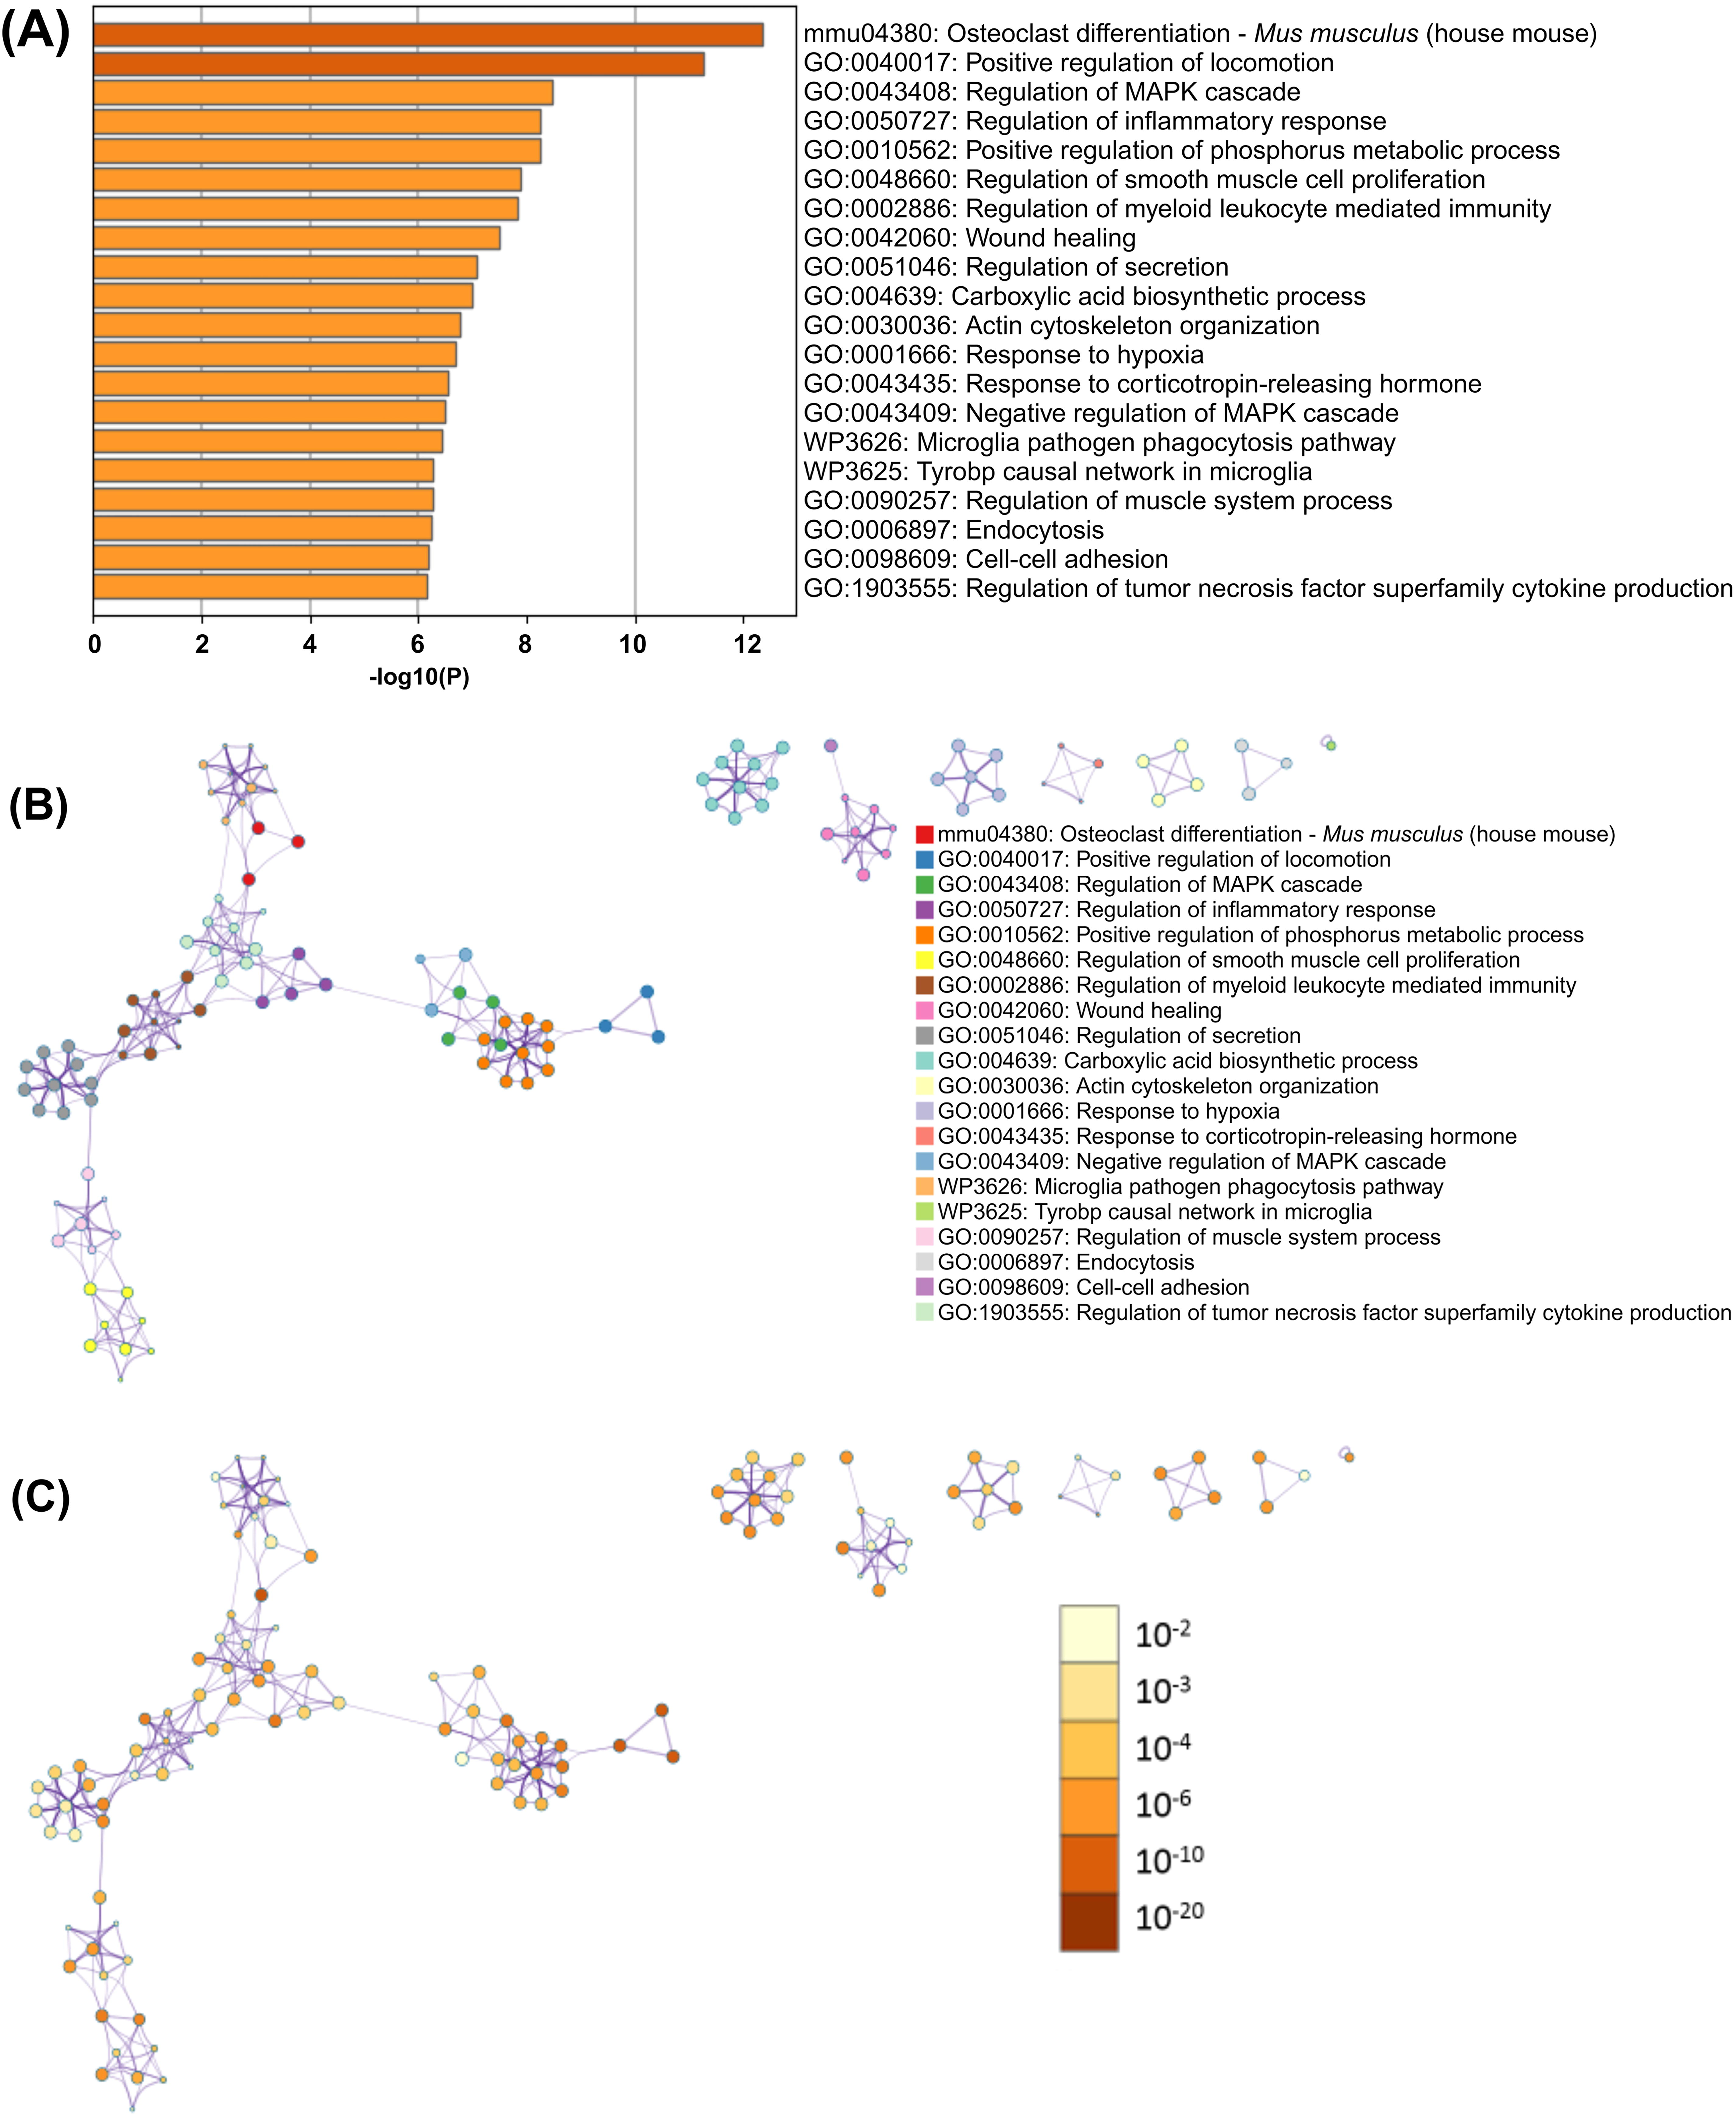
Metascape analysis of the selected 1063 DEGs.
Analysis of the PPI network
To find out how the overlapping genes are interconnected, the PPI network was constructed using STRING (Fig. 5). This network was visualized and analyzed by Cytoscape. The plugin, MCODE, was used for the identification of significant clusters for the PPI network, which generated 30 clusters (Supplementary Table S3). The MCODE cluster with the highest enrichment score, that is, 16.537, was selected for further analysis (Supplementary Fig. S1).
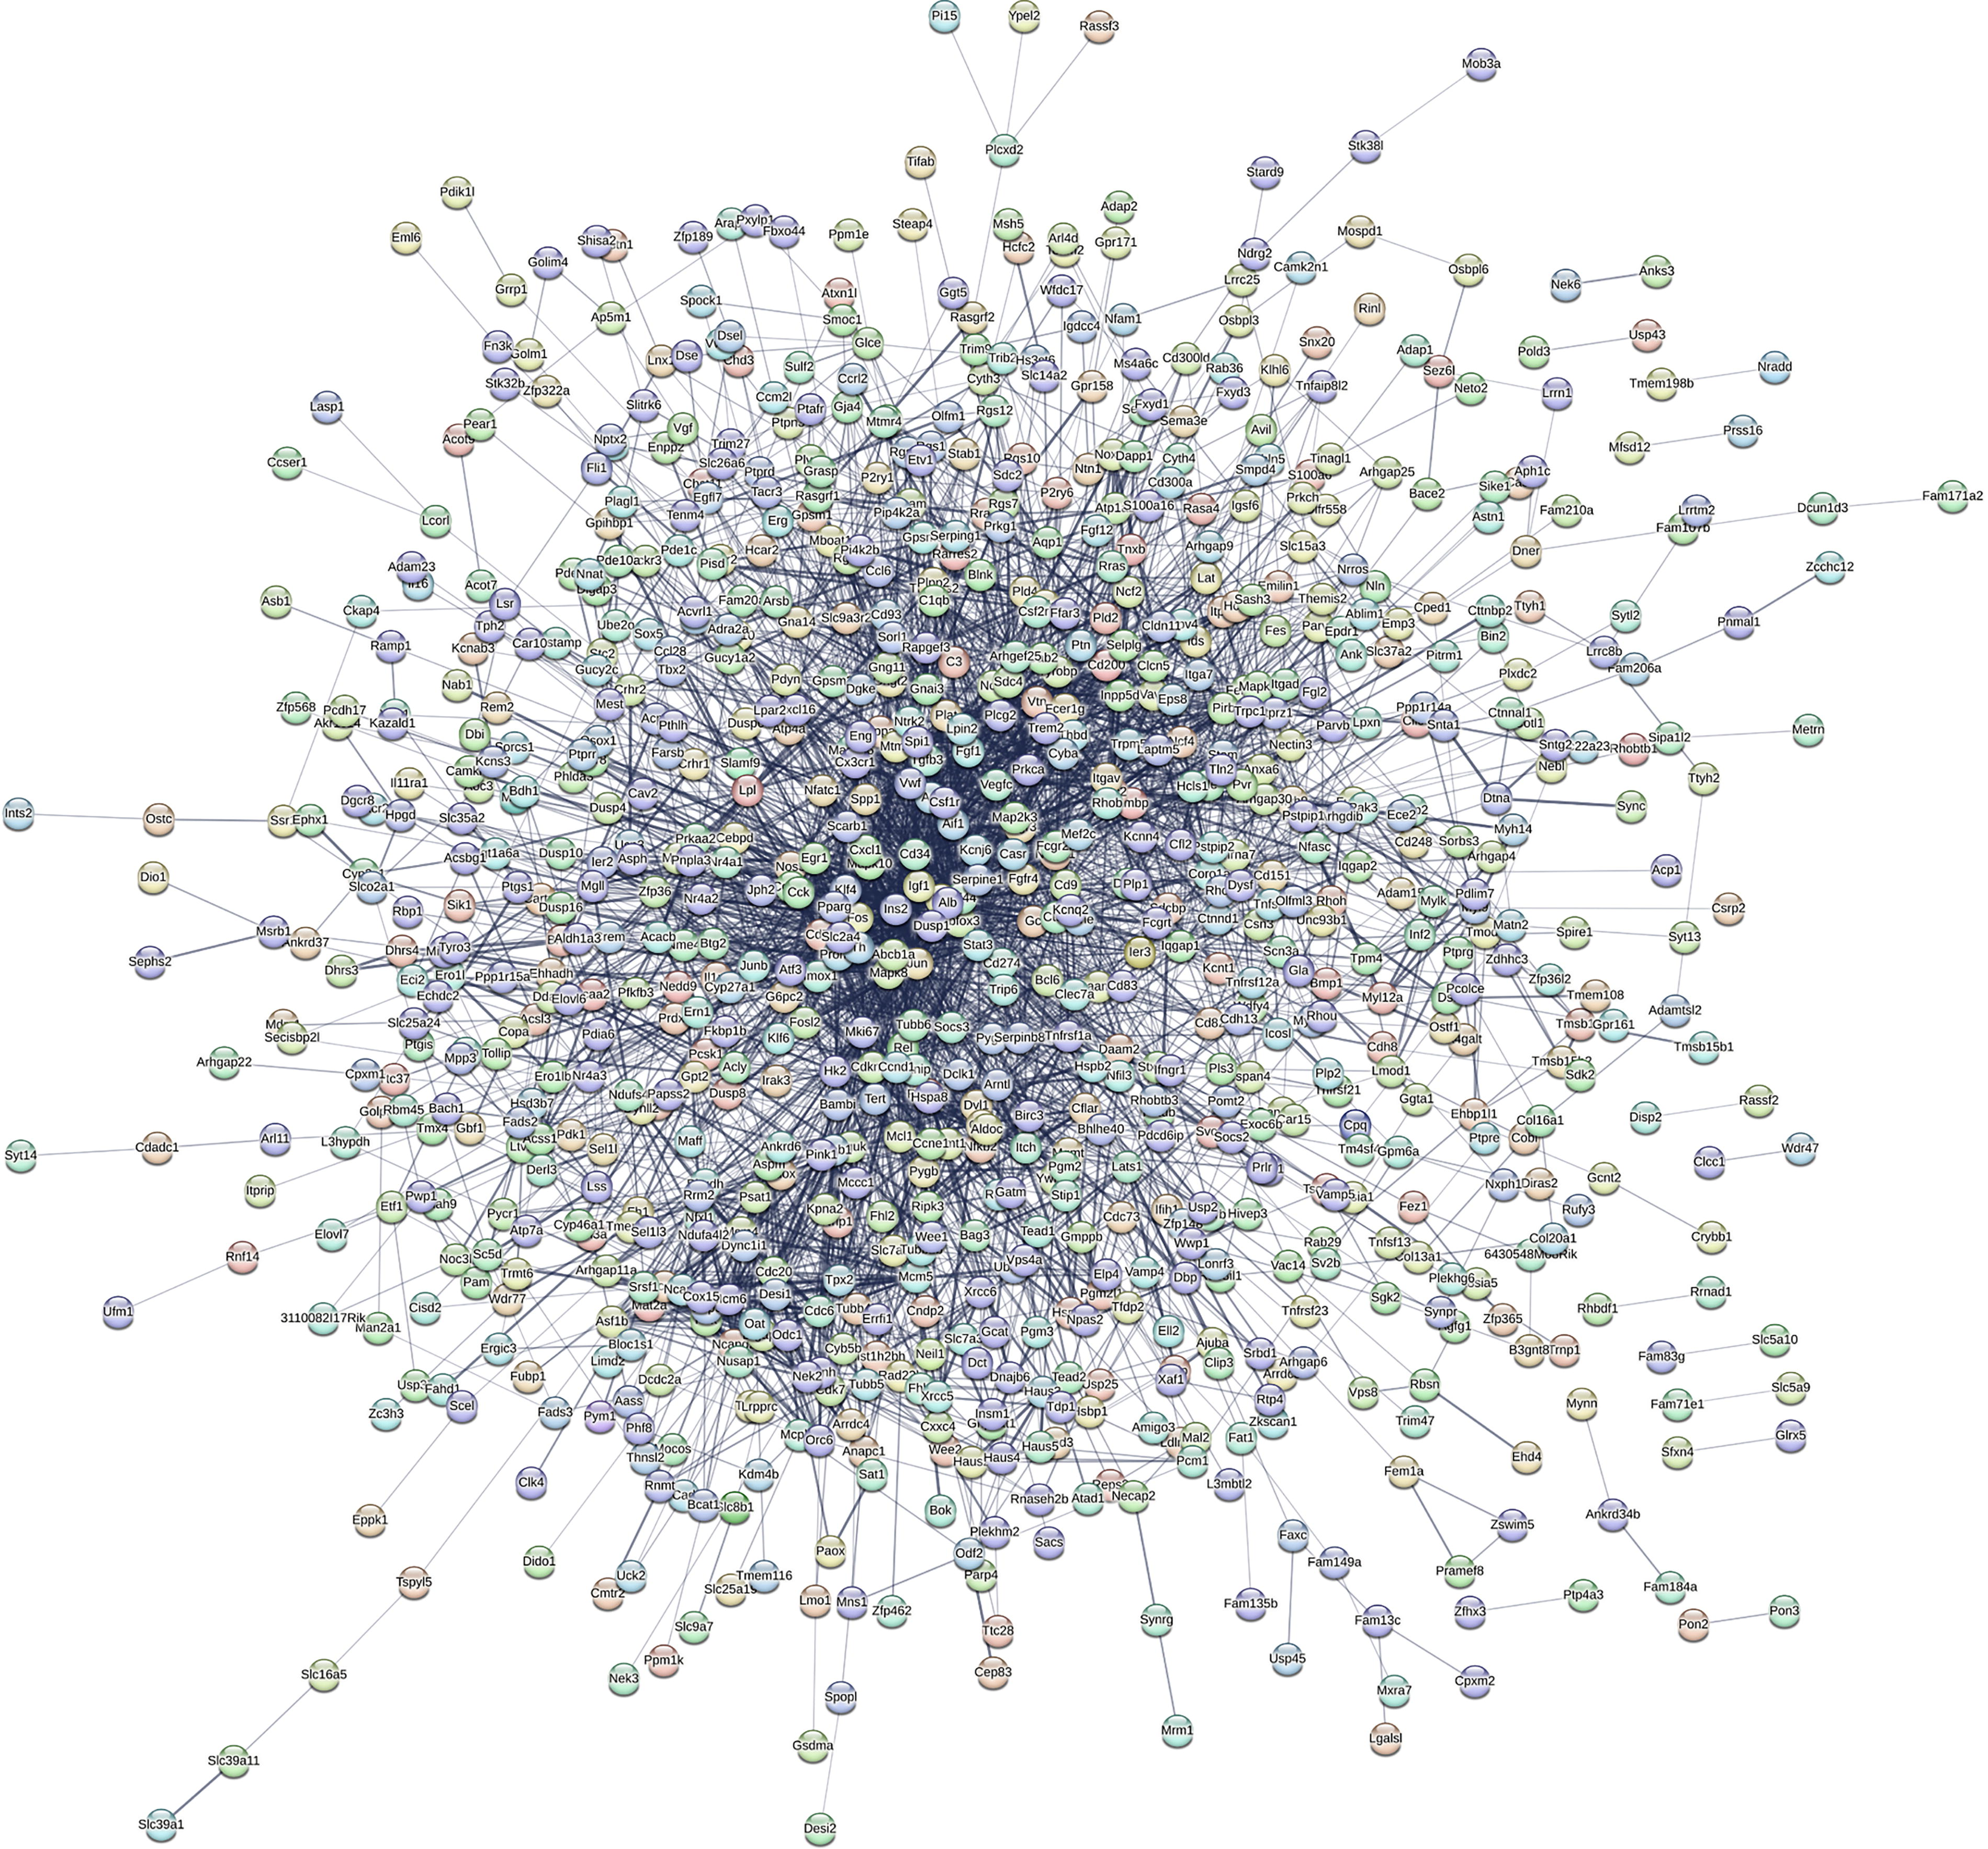
Protein–protein interaction (PPI) network of the 1063 selected overlapping genes created in STRING. The PPI network has 1059 nodes, 4167 edges, 7.87 average node degree, 0.371 average local clustering coefficient, and <1.0e-16 enrichment p value. STRING, Search Tool for the Retrieval of Interacting Genes.
Hub gene identification
For the identification of hub genes, the Cytoscape application, CytoHubba, was used. The hub genes were identified from the selected MCODE cluster using the Degree algorithm, which ranks the genes in the network according to their direct connections (edges) with other genes in the network, and the proteins with higher degree scores are more likely to be essential biological proteins (Table 2) (Chin et al., 2014). The genes that showed a consistent gene expression pattern (Supplementary Table S4) in at least four of the five datasets were selected as hub genes.
Degree Scores Obtained for the Molecular Complex Detection Cluster 1 (Score: 16.537)
A total of seven genes were identified as hub genes, namely, insulin II (Ins2), angiotensinogen (Agt), jun proto-oncogene (Jun), FBJ osteosarcoma oncogene (Fos), cluster of differentiation-44 (Cd44), insulin-like growth factor 1 (Igf1), and peroxisome proliferator-activated receptor gamma (Ppar-γ). Out of these hub genes, five genes—Jun, Fos, Cd44, Igf1, and Ppar-γ—showed upregulation, whereas two genes—Ins2 and Agt—showed downregulation.
Pathway analysis
The KEGG mapper tool identified a total of 102 KEGG pathways against the seven hub genes submitted. These pathways have been categorized based on each hub gene (Supplementary Table S5). The KEGG database linked hub genes to different pathways, including insulin secretion, MAPK signaling pathway, phosphoinositide 3-kinase (PI3K)/protein kinase B (Akt) pathway, mammalian target of rapamycin (mTOR) signaling pathway, hypoxia-inducible factor-1 (HIF-1) signaling pathway, PPAR signaling pathway, and apoptosis (Fig. 6).
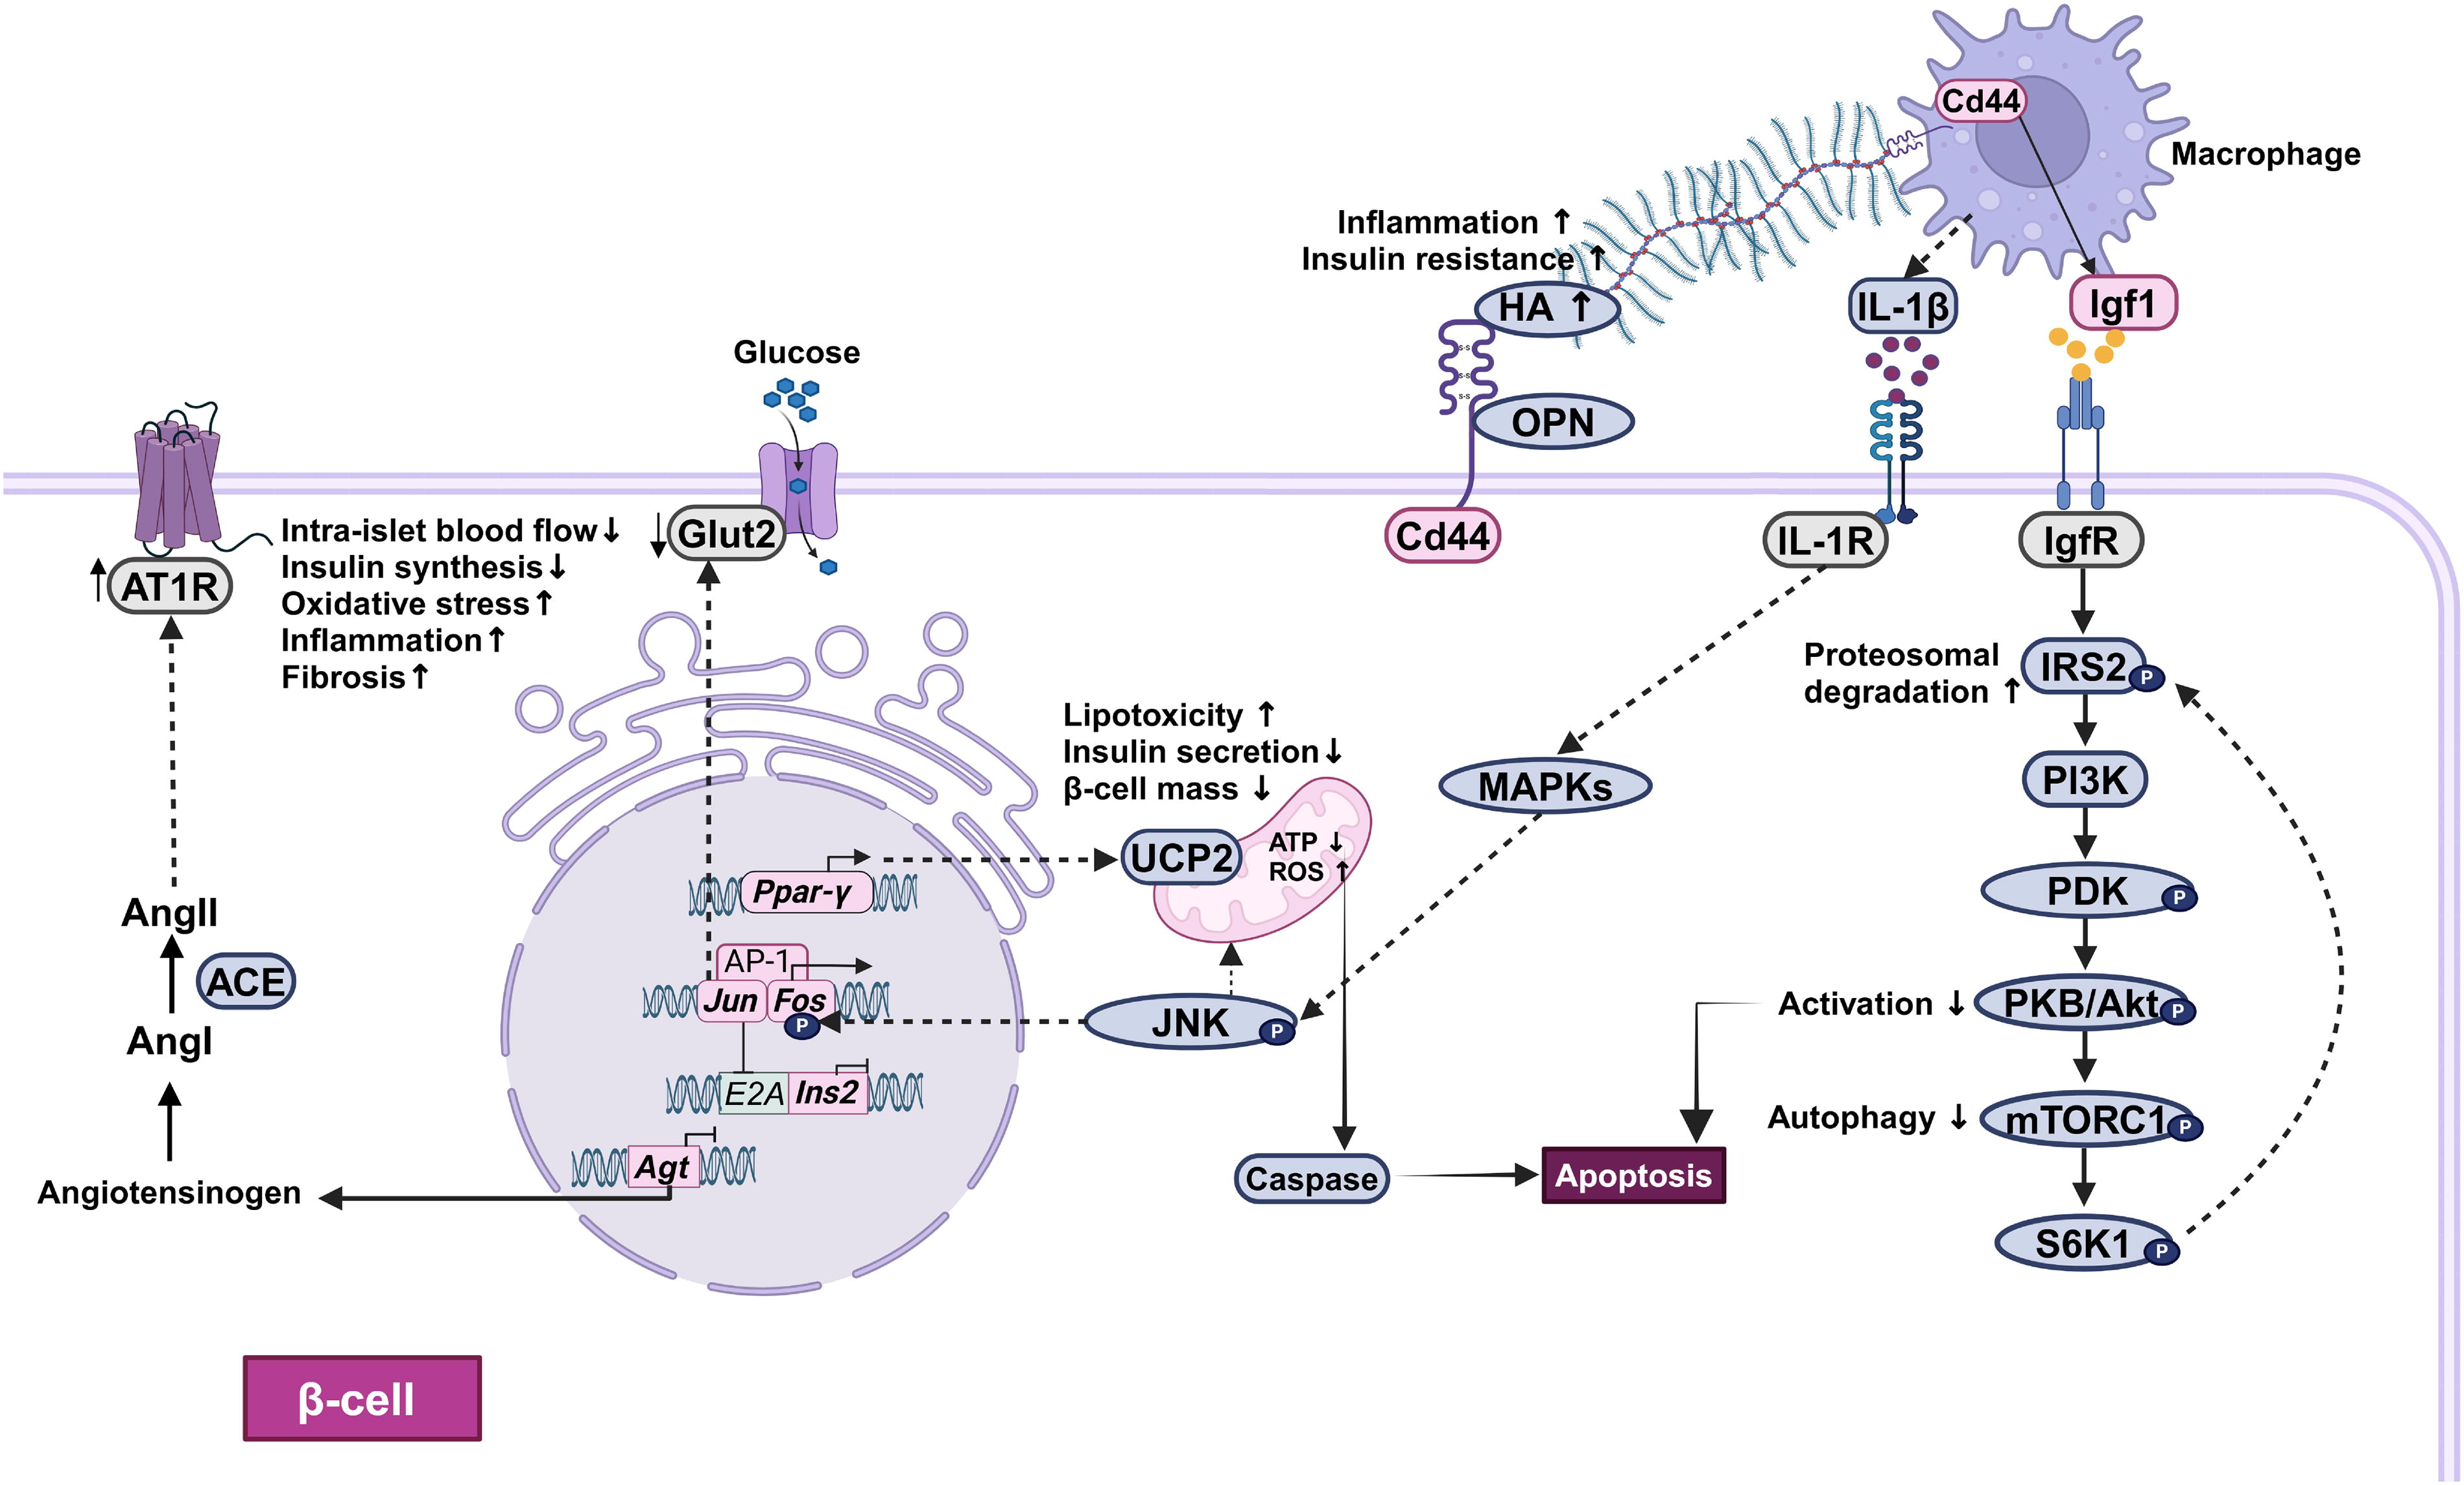
Mechanisms of hIAPP-induced cytotoxicity. Pancreatic islets from hIAPP-transgenic mice show reduced Ins2 and Agt gene expression and increased Jun, Fos, Igf1, Cd44, and Ppar-γ gene expression under hyperglycemic conditions. Agt gene codes for angiotensinogen, which is a precursor for angiotensin II (AngII). AngII mediates its action via the G-protein coupled type I receptor (AT1R), wherein the upregulation of AT1R results in reduced islet blood flow and increased oxidative stress, inflammation, and fibrosis, eventually leading to β-cell death. Inflammation is also mediated by interleukin (IL)-1β, secreted from the macrophages leads to the activation of the MAPK signaling pathway. The upregulation of Jun and Fos levels leads to the activation of Jun N-terminal protein kinase (JNK) followed by the activation of caspase cascade and subsequently apoptosis. Jun also reduces the insulin gene expression by decreasing the transactivation of the E2A gene. The increased expression of Cd44 results in the accumulation of its ligands; osteopontin (OPN), hyaluronic acid (HA) along with hIAPP, in the extracellular matrix (ECM). It also promotes the infiltration of macrophages and the induction of proinflammatory gene expression in the islets. The activated macrophages secrete Igf1, which acts on the β-cells and activates the mammalian target of the rapamycin/Ak strain transforming (mTOR/Akt) pathway. Sustained activation of this pathway leads to the induction of oxidative stress, impairment of autophagy, blockade of mitophagy, and eventually apoptosis. The increased Ppar-γ levels inhibit insulin synthesis via the upregulation of uncoupling protein 2 (Ucp-2), which decreases ATP production and increases oxidative stress, and lipid content, thereby causing lipotoxicity. ACE, angiotensin-converting enzyme; Ang I, angiotensin I; AP-1, activator protein-1; ATP, adenosine triphosphate; Glut2, glucose transporter 2; hIAPP, human islet amyloid polypeptide; IRS2: insulin receptor substrate 2; MAPKs: mitogen-activated protein kinases; PDK: pyruvate dehydrogenase kinase; PI3K: phosphoinositide 3-kinase; PKB, protein kinase B; ROS, reactive oxygen species; S6K1, S6 kinase 1.
Discussion
Transcriptomics is a versatile systems science tool to investigate gene expression patterns in healthy and diseased conditions. It has largely contributed to improving our understanding of gene regulation, cellular functions, and disease mechanisms over the past several decades (Stokes et al., 2023; Yang et al., 2020). Deciphering the gene interaction networks from transcriptomic studies has significantly added to the knowledge required for the identification of biomarkers for disease diagnosis and prediction of drug response (Li et al., 2024; Meimetis et al., 2024). Transcriptomic and omics studies also contribute to the development of personalized medicine (Serelli-Lee et al., 2022).
To identify the transcriptomic signatures of pancreatic β-cell dysfunction and death induced by hIAPP under hyperglycemic conditions in T2DM, we analyzed in the present study the gene expression profiles of pancreatic islets obtained from hIAPP-Tg mice and compared them with the WT. We identified seven hub genes, namely, Ins2, Agt, Jun, Fos, Igf1, Cd44, and Ppar-γ. To the best of our knowledge, this is the first report describing the results obtained from the combined analysis of Affymetrix microarray and HTS GEO datasets of hIAPP-Tg mice islets.
The hub genes identified in this analysis can be further validated experimentally by performing quantitative real-time PCR, Western blotting, and immunostaining experiments using pancreatic islets of hIAPP-Tg animal models, T2DM human pancreata. However, the execution of these experiments is limited by the availability of a sufficient number of biological samples and associated costs. Investigating human pancreatic islets for research requires comprehensive ethical approvals because of stringent regulatory guidelines regarding the use of human tissue. In addition to this, currently, in India, there are no human islet isolation centers that can provide human islets for diabetes research (Gandasi et al., 2023) . These challenges can be addressed by using alternative in vitro models such as human stem cell-derived pancreatic islets. Experimental validation with these in vitro systems possibly eliminates challenges such as sample size and reproducibility. These stem cell-derived pancreatic islets can further be transplanted in animal models to check their in vivo response and enhance the reliability of the outcomes. Nonetheless, validation of these hub genes with humanized model systems will surely provide the required knowledge for the development of diagnostic tools and therapeutic interventions for T2DM.
The relationship between identified hub genes, the affected metabolic pathways, and T2DM pathophysiology has been illustrated in Figure 6 and discussed further. In contrast to humans, which only have one copy of the insulin gene (Ins), insulin genes in mice and rats comprise a two-gene system. Pre-proinsulin 2 (Ins2), an ortholog of the insulin gene in other mammals, and pre-proinsulin 1 (Ins1), a rodent-specific retrogene, make up the two-gene system. Ins2 has been selected during evolution to get protection from developing diabetes in rodents (Shiao et al., 2008). Indeed, Ins2-deficient mice have been shown to develop insulin resistance (IR) and T2DM (Hong et al., 2007). The mRNA levels of Ins2 measured by qRT-PCR were found to be significantly reduced in the islets obtained from hIAPP-Tg diabetic mice (Zhang et al., 2014). Exposure of hIAPP monomers to murine islets in vitro has been shown to reduce both Ins1 and Ins2 peptide levels (Gray et al., 2021). Experiments with rat insulinoma cells, INS832/13 overexpressing hIAPP and hIAPP-Tg rat islets, have demonstrated that hIAPP misfolding and aggregation associate with reduced insulin levels, increased oxidative stress, mitochondrial fragmentation, and activation of HIF-1alpha (HIF-1α) pathway (Montemurro et al., 2019). This is in line with our analysis, wherein reduced Ins2 gene expression was observed in hyperglycemic hIAPP-Tg islets.
The next hub gene that showed downregulation in our analysis is Agt. A previous study identified genetic variations in the Agt gene that were associated with T2DM (Joyce-Tan et al., 2016). Agt forms an important component of the renin–angiotensin system (RAS)—local or circulatory. Pancreas-specific RAS governs the synthesis of proinsulin and glucose-stimulated insulin secretion (GSIS) from β-cells (Leung, 2007). On the other hand, the Agt gene is mainly expressed in α-cells in the pancreas, which encodes angiotensinogen—a glycoprotein and the only precursor of all angiotensin peptides involved in RAS, including angiotensin II (Ang II) (Lu et al., 2016; Regoli et al., 2003). Ang II mediates its function on the β-cells via the G-protein-coupled type 1 receptor (AT1R). Intraislet AT1R upregulation reduces islet blood flow and (pro) insulin synthesis, both of which result in impaired GSIS. In addition to this, elevated levels of AT1R promote oxidative stress, inflammation, and fibrosis, leading to β-cell dysfunction and death (Cheng and Leung, 2011). Interestingly, human islets cultured in vitro in high-glucose conditions showed 37% increased expression of Agt mRNA levels compared with basal glucose conditions. However, there was no change in AT1R expression in these islets (Dubois et al., 2010). In contrast to these results, we report a significant reduction of Agt mRNA levels in hyperglycemic hIAPP-Tg islets. The previous studies discussed above do not shed any light on the role of hIAPP on Agt expression. Thus, more studies are warranted in this direction.
Out of the identified hub genes, Jun and Fos encode the proteins that are subunits of the activator protein-1 (AP-1) transcription factor complex, which is known to be involved in cell proliferation, cell survival, tumorigenesis, tissue morphogenesis, and apoptosis (Meng and Xia, 2011). A recent study emphasized the role of the AP-1 complex in the regulation of glucose metabolism (Backes et al., 2021). In line with our results, increased expression of Fos has been reported in response to various cellular signals such as glucose (Susini et al., 1998), insulin (Uhles et al., 2007), palmitate, and oleate (Roche et al., 1999).
Experiments conducted with rat insulinoma (RIN)m5F cells and human insulinoma cell line - CM have shown that hIAPP exposure leads to the stimulation of the AP-1 transcription complex, wherein c-Jun dimerizes with Fos, leading to its rapid activation. This is followed by its phosphorylation at Ser63 by Jun N-terminal protein kinase (JNK), subsequently leading to the activation of the caspase cascade and eventually apoptosis (Zhang et al., 2003). Likewise, the analysis of pancreatic islets derived from hIAPP-Tg mice has also demonstrated that increased expression of Jun activates the JNK signaling pathway—a key mediator in both intrinsic and extrinsic apoptotic pathways (Subramanian et al., 2012). Jun also inhibits the expression of the insulin gene in pancreatic β-cells by reducing the transactivation potential of the E2A gene, a crucial component of the insulin control element (ICE) activator complex (Robinson et al., 1995). In addition to this, investigations with hepatocellular carcinoma (HCC) cells have shown that higher expression of Jun reduces glucose uptake, induces IR, and inhibits the glycolysis and mammalian target of rapamycin/Ak strain transforming (mTORC2/AKT) pathways in these cells (Serna et al., 2022). These pathways are essential for glucose metabolism regulation and the proper functioning of pancreatic β-cells (Yuan et al., 2018). This suggests that Jun could also possibly inhibit these regulatory pathways in hIAPP overexpressing pancreatic islets under hyperglycemic conditions.
Gene expression-based genome-wide association study (eGWAS) has identified Cd44 as a causative factor in IR and adipose tissue inflammation in humans and rodents (Kodama et al., 2012). In addition to this, diet-induced obese mice treated with anti-Cd44 antibodies showed improved insulin sensitivity, decreased hyperglycemia, adipose inflammation, and hepatic steatosis/liver damage (Kodama et al., 2015). Overweight/moderately obese people had higher levels of Cd44 in their serum and subcutaneous adipose tissue than healthy people, which was linked with proinflammatory macrophages and IR (Liu et al., 2015). Cd44 is involved in the regulation of glucose and lipid homeostasis in the pancreas, adipose tissue, liver, and skeletal muscles and thus contributes significantly to the development of metabolic diseases, including T2DM (Weng et al., 2022). Cd44 variant has been shown to inhibit insulin secretion by affecting L-type amino acid transporter-, LAT1, mediated amino acid transport. Knockdown of Cd44 increased insulin secretion and the intracellular insulin levels in MIN6 cells. Moreover, LAT1 inhibition reduced insulin secretion and content, while the overexpression of LAT1 was associated with increased insulin secretion (Kobayashi et al., 2018).
Cd44 has been shown to promote the development of hyaluronic acid (HA)-mediated IR in skeletal muscles and T2DM in high-fat-fed C57BL/6 mice (Hasib et al., 2019). Indeed, examination of pancreatic sections of high-fat diet-fed hIAPP-Tg mice showed a significant amount of HA accumulation in both peri- and intraislet extracellular matrix (ECM) along with the hIAPP deposition, increased macrophage filtration, and proinflammatory gene expression in pancreatic islets (Hull et al., 2015).
The next hub gene, Igf1, codes for 70-amino-acid-long peptide hormones, with >60% structural homology with proinsulin. Igf1 is an important growth factor in energy metabolism and the growth of tissues. It improves insulin sensitivity and peripheral glucose absorption and reduces glucose production in the liver (Aguirre et al., 2016). A significant reduction in Igf1 expression has been reported in patients with T2DM when compared with healthy individuals (Al-Salam et al., 2009). A previous population-based study reported the association between serum Igf1 levels and homeostasis model assessment IR (Friedrich et al., 2012). Decreased Igf1 serum levels have also been associated with increased mortality in patients with T2DM (Miyake et al., 2016).
Macrophages continuously monitor the β-cell state by getting activated with the chemokine signals, detection of adenosine triphosphate (ATP), insulin, and hIAPP released (Cosentino and Regazzi, 2021). In response to β-cell death, macrophages showed decreased production of proinflammatory cytokines and increased production of Igf1. This Igf1 acts on β-cells and maintains insulin secretion in streptozotocin-induced diabetic mice with no effect on β-cell number (Nackiewicz et al., 2020). It is important to note that Igf1 receptor signaling pathways are crucial for pancreatic β cell function, which includes PI3K/Akt and MAPK signaling pathways (Hu et al., 2025; Ullrich, 2015). Signaling through the increased Igf1 leads to the continuous activation of mTOR (a ser/thr kinase), which in turn promotes the serine–threonine phosphorylation of insulin receptor substrate 2 (IRS2) through p70 ribosomal protein S6 kinase 1 (S6K1). Continuous activation of IRS2 followed by its proteasomal degradation results in the inactivation of protein kinase B (PKB/Akt), thereby leading to increased β-cell apoptosis (Ardestani et al., 2018). Furthermore, the glucotoxic or lipotoxic conditions related to T2DM have also been shown to be associated with the chronic activation of mTOR, which results in the accumulation of p62 indicating the impairment of autophagy (Ardestani et al., 2018; Mir et al., 2015). In addition, sustained mTOR activation also blocks mitophagy leading to increased oxidative stress (Ardestani et al., 2018; Bartolome et al., 2014).
A recent study with INS-1 cells reported that the treatment of coix seed prolamin-derived active peptide (LPFYPN, LP6) decreased hIAPP-induced cytotoxicity in these cells via inhibition of PI3K-Akt-mTOR signaling pathway, reducing p62 levels and increasing autophagy (Zhang et al., 2025). In line with these studies, our analysis has shown the upregulation in Igf1 gene expression levels in hyperglycemic hIAPP-Tg islets.
The number of intraislet macrophages is increased in T2DM, and these cells are the main source of proinflammatory cytokines within islets. Various stressors, including high glucose, palmitate, and endocannabinoid, have been shown to induce inflammation and secretion of a potent proinflammatory cytokine—interleukin (IL)-1β from macrophages (Eguchi and Nagai, 2017; Meier et al., 2025). hIAPP aggregates trigger IL-1β secretion from resident islet macrophages and direct them to adopt a proinflammatory phenotype (Westwell-Roper et al., 2014). IL-1β plays an important role in the progression of T2DM, wherein it is involved in the impairment of insulin secretion and β-cell apoptosis via activation of MAPK signaling (Alfadul et al., 2022; Ou et al., 2020). A study has demonstrated that treatment of transactivator of transcription protein from HIV-1 tagged cytokine-induced apoptosis inhibitor 1 (CIAPIN1) protein inhibits hIAPP-mediated cytotoxicity via suppressing MAPK signaling and apoptosis pathway in RINm5F β-cells (Yeo et al., 2023).
We also report the upregulation of ligands of nuclear hormone receptor superfamily member—Ppar-γ, in hyperglycemic hIAPP-Tg islets. Ppar-γ plays a regulatory role in energy homeostasis and metabolic function (Tyagi et al., 2011) by regulating the transcription of β-cell essential genes such as glucose transporter 2 (Glut2), glucokinase (Gck), and pancreatic and duodenal homeobox 1(Pdx1). These genes are involved in glucose sensing, insulin synthesis, and secretion (Gupta et al., 2010). Ppar-γ agonist such as rosiglitazone decreases hIAPP-induced apoptosis via the activation of the PI3K/Akt pathway (Lin et al., 2005). Rosiglitazone supplementation has also been shown to augment insulin secretion, intracellular calcium mobilization, and β-cell gene expression by enhancing G-protein coupled receptor 40 (GPR40) and Glut2 gene expression in INS-1E cells and Otsuka Long-Evans Tokushima Fatty (OLETF) rat islets (Kim et al., 2013). Another class of Ppar-γ agonists, thiazolidinediones (Lebovitz, 2019), protect against stress induced by glucose, lipids, cytokines, and hlAPP aggregation (Gupta et al., 2010). On the contrary, Ppar-γ overexpression has been shown to inhibit insulin synthesis and its exocytosis via upregulation of uncoupling protein 2 (Ito et al., 2004). Furthermore, reduction in ATP production, increased lipid content, lipotoxicity, enhanced oxidative stress, and deficit β-cell mass have also been reported in high-fat-fed male mice (Hogh et al., 2014; Ito et al., 2004).
All pathways identified from the present study have previously been associated with the pathophysiology of T2DM (Cao et al., 2023). For example, β-cell dysfunction (Khin et al., 2023; Lu et al., 2024), hyperglycemia-induced oxidative stress, and activation of the HIF-1α pathway (Montemurro et al., 2019; Yamagata et al., 2024) have been documented. The HIF-1α pathway, in particular, is involved in the dedifferentiation of β-cells—a key mechanism behind the reduction of β-cell mass in T2DM (Liu et al., 2020).
The dysregulated RAS in pancreatic islets plays a key role in the impairment of GSIS of β-cells and remodeling of islet structure, both of which are crucial steps in the onset and progression of T2DM (Graus-Nunes and Souza-Mello, 2019; Nurun Nabi and Ebihara, 2021). The MAPK pathways are activated in the presence of various stress stimuli, including oxidative stress (Sidarala and Kowluru, 2017). There are three main subgroups of mammalian MAPKs—extracellular signal-regulated kinases 1 and 2 (ERK1/2), JNKs, and p38 MAPKs. The pancreatic β-cell function is negatively regulated by the JNK and p38 signaling pathways, while ERK phosphorylation positively regulates it (Ghimire et al., 2025). The JNKs are activated in response to cell stressors such as hyperglycemia, hyperlipidemia, elevated cytokines (Yung and Giacca, 2020), and hIAPP (Subramanian et al., 2012). The JNK signaling pathway mediates β cell apoptosis in T2DM, leading to a reduction in β-cell mass (Kim and Lee, 2010).
The PI3K plays a crucial role in glucose transport, protein synthesis, lipid metabolism, differentiation, proliferation, and apoptosis of β-cells. AKT upon phosphorylation transduces signals initiated by PI3K to downstream effectors (Huang et al., 2018). The dysregulation of this pathway leads to IR, oxidative stress, mitochondrial dysfunction, protein misfolding and accumulation, inflammation, and apoptosis (Ramasubbu and Devi Rajeswari, 2023). A member of the PI3K-related kinase family is mTOR, an important nutrient sensor of β-cells involved in energy production, cell growth, and proliferation (Asahara et al., 2022). Hyperactivation of this protein has been shown to increase oxidative stress and impairment of mitophagy, thus resulting in apoptosis of β-cells, resulting in the development and progression of β-cell failure in T2DM (Ardestani et al., 2018; Asahara et al., 2022).
We propose that the hub genes identified in our study could serve as diagnostic biomarkers for detecting individuals at risk of β-cell dysfunction, hIAPP misfolding, aggregation, and monitoring the progression of T2DM. The expression levels of these hub genes can be correlated with the severity of the disease. This will lead to early intervention before a significant loss of functional β-cells occurs. Checking the expression of these hub genes will help to predict how well a patient will respond to specific therapeutics, which will aid in designing personalized medicines that can improve the efficacy of the treatment.
Conclusions
The analysis of the transcriptomic profiles of pancreatic islets obtained from hIAPP-Tg mice by Affymetrix microarray and HTS led to the identification of seven hub genes—Ins2, Agt, Jun, Fos, Cd44, Igf1, and Ppar-γ. Thus, it can be concluded that hIAPP-mediated β-cell dysfunction and death occur through different pathways, including the HIF-1α pathway, MAPK signaling pathway, PI3K/Akt signaling pathway, mTOR signaling pathway, PPAR signaling pathway, and apoptosis in T2DM. We propose that the identified hub genes can help explain T2DM pathogenesis and can be potentially utilized to develop therapeutic interventions targeting hIAPP for the clinical management of T2DM in the future.
Footnotes
Authors’ Contributions
P.H.R.: Data curation, formal analysis, investigation, methodology, writing—original draft, review and editing. S.S.Y.: Data curation, formal analysis, investigation, methodology, and writing—original draft. B.S.: WGCNA. P.P.: Data curation, preliminary analysis, and writing—original draft. S.R.: Supervised WGCNA, formal analysis, and writing—review and editing. S.S.: Conceptualization, supervision, writing—review and editing, and funding acquisition. All authors have read and approved the final version of the article.
Data Availability
The data reported in the article have been acquired from the NCBI GEO database, and all data pertaining to the present study and analysis are available in the article.
Author Disclosure Statement
The authors declare no conflicts of interest.
Funding Information
S.S. acknowledges funding from the University Grants Commission (Grant No.: F.4-5 (18-FRP) (IV−Cycle)/2017(BSR); Government of India) and Council of Scientific & Industrial Research (CSIR) (Grant No.: 37/1751/23/EMR-II). The S.S. lab has been generously supported by the Rashtriya Uchchatar Shiksha Abhiyan (RUSA) 2.0 grant to SPPU. P.H.R. acknowledges CSIR-SRF, GOI (Grant No.: (09/137/0602)2019-EMR-I), for her SRF fellowship. S.S.Y. and P.P. acknowledge the Department of Biotechnology (DBT), Government of India, for their Master’s in Biotechnology fellowship. S.R. acknowledges the Science and Engineering Research Board (SERB) Teachers Associateship for Research Excellence (TARE) fellowship and grant (TAR/2019/000062).

Abbreviations Used
References
Supplementary Material
Please find the following supplemental material available below.
For Open Access articles published under a Creative Commons License, all supplemental material carries the same license as the article it is associated with.
For non-Open Access articles published, all supplemental material carries a non-exclusive license, and permission requests for re-use of supplemental material or any part of supplemental material shall be sent directly to the copyright owner as specified in the copyright notice associated with the article.
