




Abstract
Introduction
Despite the different clinical presentations of BCC lesions, the more pronounced characteristic is an asymptomatic nodule or ulcerated lesion containing telangiectasic vases. 3 According to Gniadecka et al. (1997), up to 50% of early diagnoses of skin malignant lesions may escape detection during clinical routine examinations, whereas experts achieve an accuracy of approximately 80 – 90%. 4 Many efforts have been made to develop techniques that can provide early tissue diagnostics and accurate follow-up procedures with better sensitivity and specificity. Among them, optical techniques such as fluorescence and Raman spectroscopy are gaining importance in several medical specialties. 5 –9
The challenge of modern medicine is to develop an analytic technique that investigates differences in the biochemistry of normal and pathologic tissues with method that gives diagnostic information in real time and is noninvasive and nondestructive. Among those methods, vibrational spectroscopy, particularly Raman spectroscopy, is a potential technique with which to diagnose and study the evolution of human diseases, such as atherosclerosis 9 –11 and precancerous and cancerous lesions. 4,6,12 –15
Raman spectroscopy is an important optical tool that is able to detect biochemical changes of benign or malignant tissues of different pathologies. 8,16 Abnormal tissues have differences in composition caused mainly by changes in the molecular structures of proteins, lipids, and pigments (carotenoids) compared with normal ones. 17 –19 Those changes can be detected by Raman spectroscopy, and therefore, this technique has been considered a promising tool for early cancer diagnosis. Raman spectroscopy using near-infrared excitation (typically 785 or 830 nm from diode lasers) has an important advantage that lies in the decreased likelihood of biologic-sample fluorescence. 20 Raman confocal microspectroscopy has been used to observe microscopically the spectral differences between normal and BCC and to provide differential diagnosis. 21 –23 The applicability of the Raman spectroscopy could be to complement histopathologic diagnosis, where the biopsy is impracticable, for example, in multiple lesions or in incipient lesions that still are not revealed clinically and also help to detect surgical limits in tumor-removal clinical procedures. 24 The potential use of a fiberoptic cable (the Raman probe) would provide the capability for specific molecular fingerprinting and analysis for in vivo experiments 25 –27 and for detecting perilesional skin by using higher wave numbers. 28
Currently, a number of researchers use multivariate statistics for spectral data analysis, interpretation, and classification. Principal components analysis (PCA) is a very effective data-reduction technique. Basically, it decomposes the spectra into factors, or principal components, that represent the most important variations that occur in the original dataset. Each principal component is related to the spectrum with a variable called the score, representing the weight of that particular principal component to reconstruct the original spectrum. Because the scores carry the importance of each component in the spectrum, they can be used to develop a model to classify the spectra into well-defined groups, according to differences observed in the principal components related to the spectra dataset, carried out by the scores of the first PCs. 29
Recently, a number of authors proposed that the relative amount of specific biochemicals presented in a particular sample could be calculated by using the Raman spectra of such biochemicals linearly fitted to the spectra of samples. 26,27,30 Then the tissue identification and classification into specific classes could be done by comparing the changes in the biochemicals for each disease status. Haka et al. 26 proposed the diagnosis of breast cancer by calculating the amount of fat, collagen, cholesterol, cell nucleus and cytoplasm, and calcium oxalate through Raman spectra and comparing with the normal tissue. Stone et al. 30 diagnosed urologic pathologies through dispersive Raman spectroscopy, aiming to measure basic tissue constituents such as actin, collagen, choline, triolein, oleic acid, cholesterol, and DNA to assess the gross biochemical changes in each of the pathologies. Motz et al. 27 used a Raman probe connected to a near-infrared Raman spectrometer to scan carotid arteries in vivo to access the biochemical presented in the sample, correlating the plaque composition with the possible prevention of plaque vulnerability to rupture.
The objective of this work is to use the near-infrared, dispersive Raman spectroscopy to differentiate skin lesions from normal tissues and to develop two diagnostic algorithms by using the differences in the Raman spectra of normal (N) and basal cell carcinoma (BCC) skin tissues in vitro correlated to the histopathology. The first one is based on the PCA scores calculated from a training dataset and testing the algorithm in a prospective dataset, by using the Mahalanobis distance as a discriminator. The second is a simplified model based on the biochemical constitution of skin tissue in which we consider the macroscopic spectra of collagen and cell fat from intact tissues (tendon and perivascular tissues, respectively) to classify the tissues according to the relative amounts of these biochemicals.
Materials and Methods
This study was approved by the Committee on Ethics in Research from Universidade do Vale do Paraíba. Skin-tissue fragments were obtained from routine oncologic biopsies, and each fragment was divided in two slices of ∼2 mm diameter each, with about 1- to 2-mm thickness. One slice was fixed with formalin, 10%, and stored for the histopathologic analysis (for the patient's diagnosis), and the other one was snap frozen and stored in liquid nitrogen (−196°C) for spectroscopic study.
At the time of collecting Raman spectra, all samples were warmed to room temperature and kept moisturized by washing with 0.9% saline solution. The dispersive Raman spectrometer (Fig. 1) consisted of a semiconductor AsGaAl laser (Micro Laser Systems; L4830S) with about 80-mW power output and 830-nm wavelength. The laser beam was filtered by a holographic bandpass filter (Kaiser Optical Systems, HLBF 830) and directed to the sample holder by a prism, before being focused by an f = 25-mm lens. Each tissue fragment was placed in an aluminum holder. Because of the high scattering presented by biologic samples after photon interaction with cell membranes and organelles, it is expected that the spot size would become larger and illuminate a larger area in the tissue fragment. The signal scattered from the sample was collected by a set of lenses and was coupled to the entrance of the spectrograph (Chromex, 250IS) for dispersion, which had a notch filter at 830 nm (Spectral Iridian Technologies, PN-ZX 000080) in front the entrance slit to reject the Rayleigh scattering from the laser. The spectrograph resolution was about 10 per centimeter. The signal dispersed by the spectrograph was detected by a liquid N2-cooled deep-depletion CCD camera (Princeton Instruments, LN/CCD-1024-EHR1, 1,024 × 256 pixels), connected to the controller (Princeton Instruments, ST130) and the PC for spectra acquisition and storage. Each sample was read on the same day and in the same experimental conditions (temperature, humidity, and lights off ). The Raman signal was collected in 50 sec for all samples.
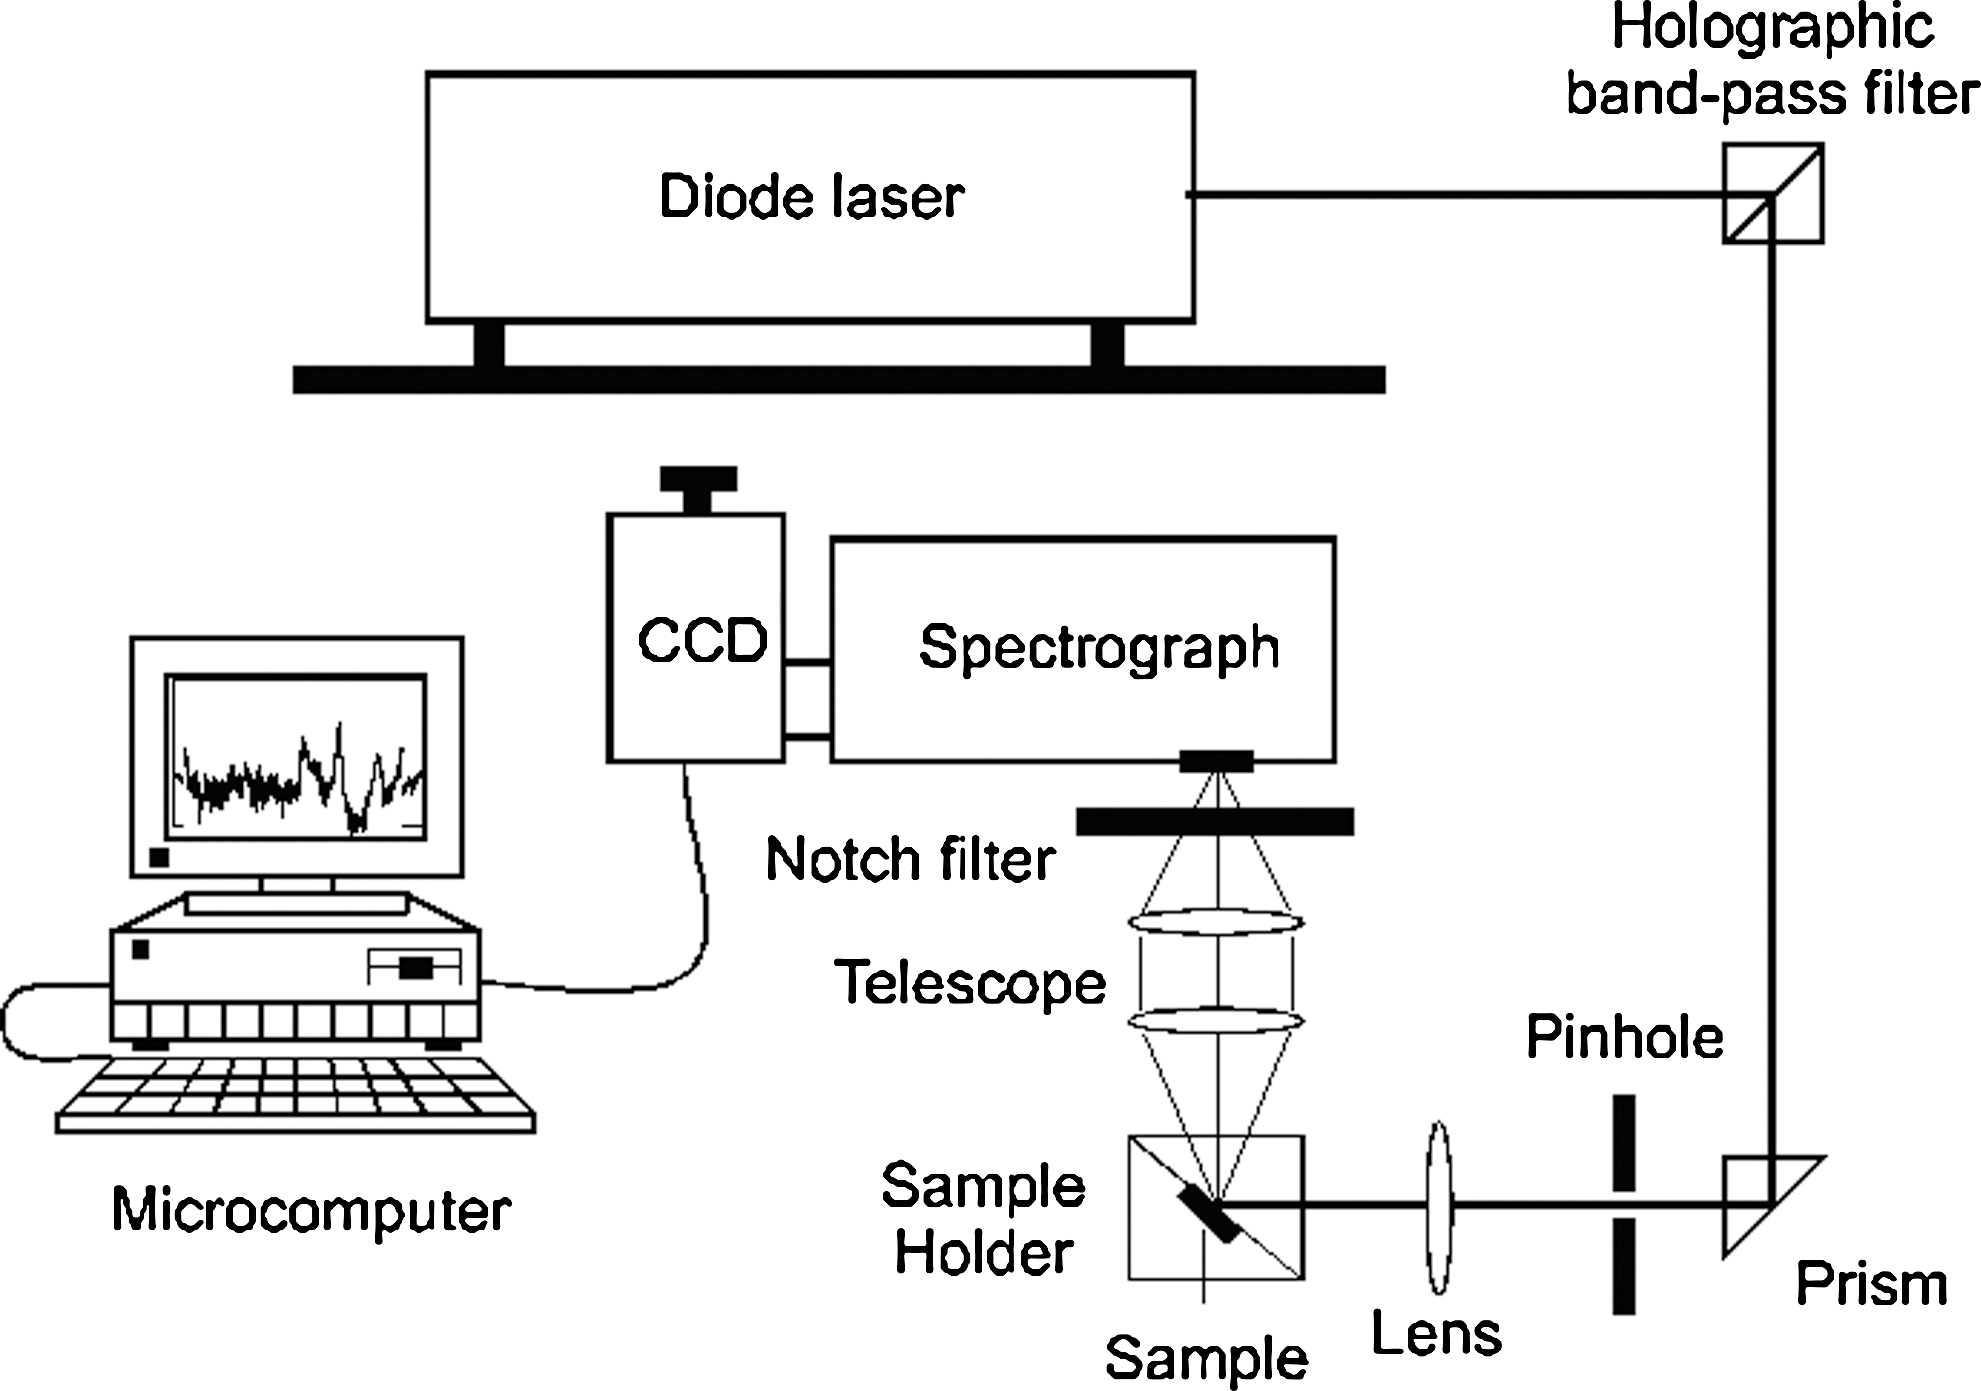
Schematic diagram of the dispersive Raman spectrometer used in the skin cancer study. Laser power, 80 mW; wavelength, 830 nm; spectrograph resolution, 10 per centimeter.
The procedure of spectra calibration was performed as described elsewhere. 10 In brief, the Raman shift calibration was done by using the known peaks of naphthalene, where the main peak positions (pixels) were correlated to the known wave numbers and fit to a third-order polynomial, creating a Raman wave number/pixel curve. For the fluorescence background filtering (baseline correction), spectral response correction, and cosmic ray removal, we used the software OriginPro 7.5. Spectra were also smoothed by using adjacent averaging (10 points), also with OriginPro 7.5. After calibration and filtering, spectra were normalized by the most-intense band at around 1,450 per centimeter and plotted in the spectral range of 800 to 1,800 per centimeter by using Microsoft Excel.
Two Raman spectra were collected from each fragment. In total, 54 samples were used for the training dataset, and 25 samples were used for the prospective dataset. Fragments were then labeled, fixed with formalin 10%, and sent to histopathology with the following diagnostics: for the training group, 15 as normal skin (N), three as keratosis, 29 as BCC, four as pigmented BCC, three as in situ and invasive squamous cellular carcinoma; for the prospective group, 13 as N and 12 as BCC. Spectra of pigmented BCC were withdrawn because of the high fluorescence background. Spectra of keratosis and squamous cell carcinoma were not included in the model because of the infrequent occurrence, but an exploratory spectral data analysis was performed to address the possible use of such samples in a diagnostic algorithm. Two spectra of N and three of BCC had a low signal-to-noise ratio and were not considered in the model (the criterion was SNR <5, considered as the ratio of the peak-to-peak intensity of the most intense band and the peak-to-peak background variation in the 1,750 to 1,800 per centimeter spectral range, calculated before smoothing). In total, 133 spectra were considered for the analysis (85 for the training group and 48 for the prospective group).
To separate the spectra of histopathologically N and BCC tissues clearly into two groups, depending on the spectral information, two diagnostic algorithms were implemented. First, the PCA and discriminant analysis based on Mahalanobis distance were applied in the spectral data, and an algorithm based on the spectral differences found in each principal component was implemented. Second, a simplified model based on tissue biomolecular composition was developed by using the Raman spectra of collagen (from tendon) and cell fat (from adipocytes of perivascular fat) obtained from human postmortem bulk samples. Spectra of tendon and adipocytes were compared with the literature to check their similarity to collagen and triolein (triglyceride). 30 Both algorithms were then compared in terms of sensitivity and specificity.
The PCA is a multivariate statistical technique that extracts the most important information of each data group by using the covariance calculation and correlates these covariance spectra (the principal components, PCs) to each spectrum, by calculating the intensities (the scores) that represent the amount of each covariance spectrum in the original spectra. Then a discriminant analysis, either by euclidean or Mahalanobis distance, 10,31 or even by logistic regression, 24 is applied to these scores, aiming classify each spectrum in a group, depending on the spectral information contained in each covariance spectrum. The PCA and the Mahalanobis distance calculations were performed by using Matlab 7.01 applied to all the obtained Raman spectra, and the scores of the first four principal components scores were plotted, to choose which PC could best differentiate the skin tissue samples.
The simplified biochemical model was performed by calculating the relative amount of two biochemicals found in skin tissues: collagen and cell fat (mainly triglycerides) in each tissue fragment by using the Raman spectra from a fragment of bulk human tendon (collagen) and adipocytes (cell fat). The differences in the amounts of proteins ad lipids in tissue skin have been associated with the BCC lesions detected by Raman spectra,
21,23,24
allowing the detection in a simplified manner with spectra of only two compounds. The fitting of the spectra of tissue constituents to the spectra of skin tissues was performed by using linear least-square analysis, by solving the formula
30,32
:
where X is the original spectra, SC is the matrix of spectral tissue constituents, C is the matrix of concentrations to be predicted, and E is the residual. This formula can be used to provide a “best fit” of the spectral components or basis spectra found within the measured spectrum. The assumption is made that the residual is minimized and that the spectral components selected are the major components of the spectra. Then the predicted C is plotted, and the coefficient for each tissue type is separated by euclidean distance. Observation of the residual E enabled the quality of the fit to be evaluated. The disadvantage of this fitting is that any colinearity in the components selected or absence of important basal compounds would skew the fit. 30
Results
Figure 2 presents the average normalized Raman spectra of several skin tissues (normal and three types of skin lesions) in the interval of 800 to 1,800 per centimeter. Differences in the intensity of some bands of the Raman spectra can be observed in all tissues. Figure 3 (top) shows the Raman spectra of N and BCC tissues, with the regions labeled. Main bands can be assigned to nucleic acid, lipids, and proteins from tissue as follows 4,24,33 –37 : region 4: 1,659 per centimeter (C=O stretching of amide I, proteins; C=C stretching, lipids) and 1,451 per centimeter (CH2 deformation and CH2 bending, lipids and proteins); region 3: 1,271 to 1,333 per centimeter (C-N stretching of amide III, α-helix conformation, proteins, CH2 deformation, lipids, CH3CH2 twisting of collagen/lipids and polynucleotide chain); region 2: 1,125 per centimeter (C-N and C-C stretching, proteins and lipids), 1,085 per centimeter (C-O, C-C, and C-N stretching, proteins and lipids to a lesser degree and PO2- stretching mode, phospholipid and nucleic acids backbone), and 1,062 per centimeter (C-C stretch skeletal, lipids); and region 1, 1,002 per centimeter (ring breathing, phenylalanine), 946 per centimeter (C-C stretch backbone, α-helix conformation, collagen and lipids, and C-C stretching, proline and valine) and 873 per centimeter (C-C breathing, proline/tyrosine/collagen). Figure 3 (bottom) presents the standard deviation of all N and BCC spectra for each Raman shift. Highest differences were found in the regions 3 and 1, corresponding to differences in the amounts of nucleic acids, proteins, and lipids. Regions 4 and 2 had small differences, not significant to the proposed work.
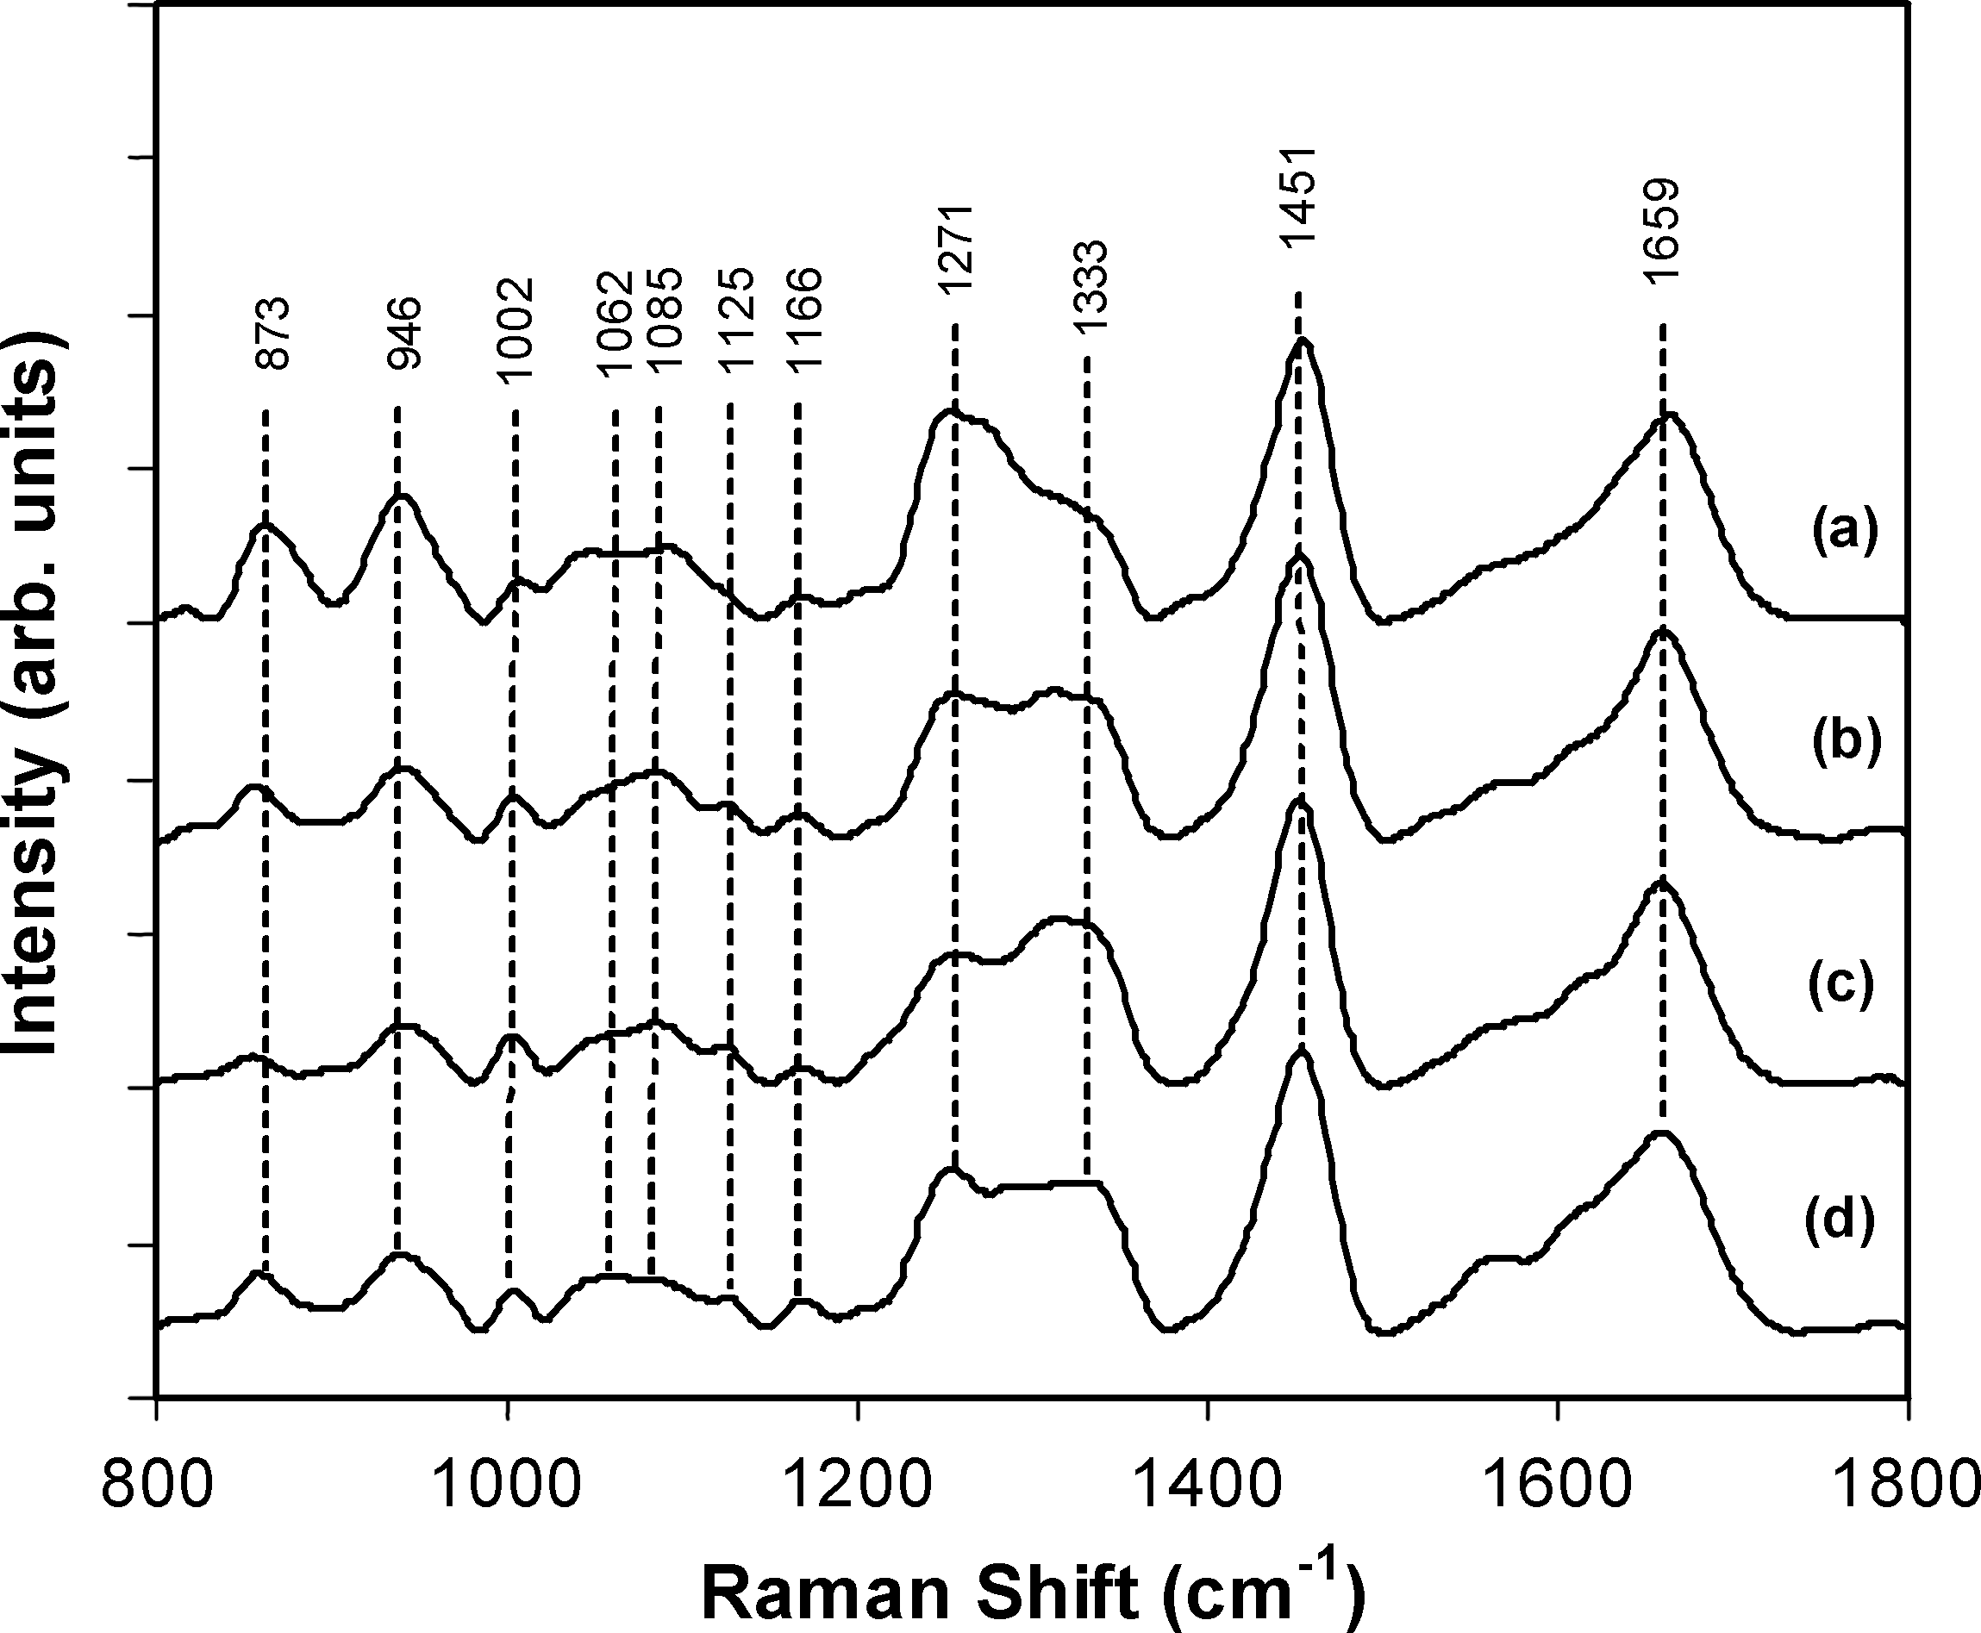
Dispersive Raman spectra of (
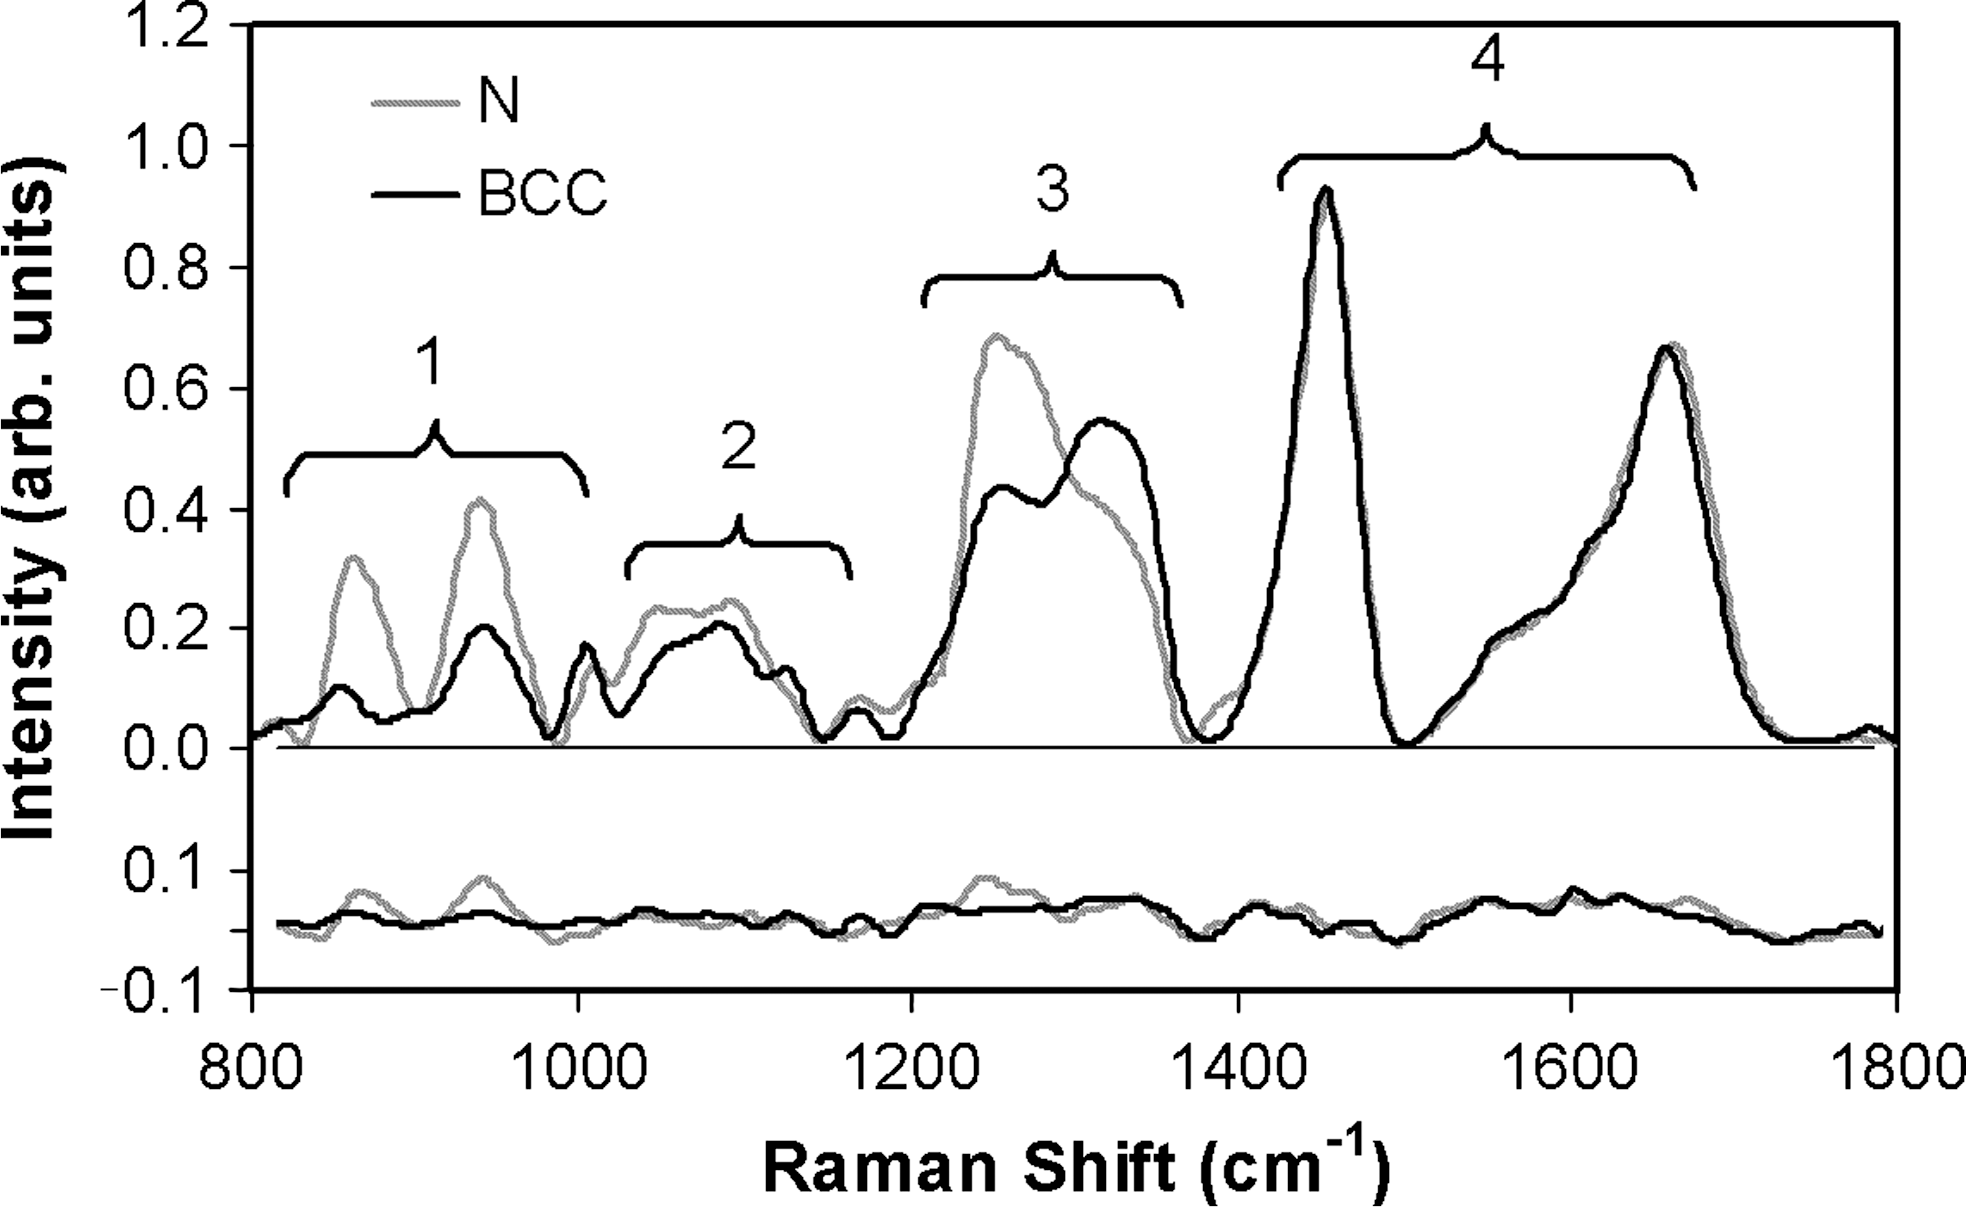
Top: Normalized and mean centered dispersive Raman spectra of normal (N) and basocellular cell carcinoma (BCC) with labeled regions of main spectral differences: (1) mainly proteins; (2) lipids, proteins, and nucleic acid; (3) amide III (collagen, proteins, and lipids); and (4) amide I (lipids, proteins). Bottom: Standard-deviation spectra of N and BCC.
Normal skin has endogenous lipids that can be identified by the bands at 946 per centimeter and around 1,333 per centimeter, which could be attributed to phospholipids and ceramides. 36 Spectral features arising from lipid conformation in the skin appears at the region of 1,050 to 1,100 per centimeter (hydrocarbon chain). The C-H deformation associated with lipids and CH2 bending with proteins is presented at 1,451 per centimeter. The protein content of the normal skin can be visualized mainly by the amide III bands (1,271 per centimeter) and amide I (1,659 per centimeter), and several other weaker vibrations. 23,24,37 BCC skin has features at around 1,333 per centimeter, which could be attributed to CH3CH2 twisting of lipids and the polynucleotide chain, the feature at 1,125 per centimeter (hydrocarbon chain, gauche conformation), a sharp band of phenylalanine-ring breathing vibration around 1,002 per centimeter, and the C-C breathing-proline/tyrosine/collagen at 873 per centimeter.
It can be seen that the main spectral differences between both normal and BCC tissues are in region 3 of amide III/CH3CH2 twisting and region 1 of C-C vibrations from proteins and lipids. The biochemical alterations of neoplastic tissue change significantly the intensity conformation of the amide III vibration bands, with lower intensity for the 1,271 per centimeter band and higher intensity for the 1,333 per centimeter band compared with normal samples. A reduction is seen in the intensity of bands between 800 and 1,000 per centimeter, mainly the protein at 873 per centimeter of malignant tissue compared with the normal one. 21,23,24
The PCA was applied in the Raman data set (all samples) to develop a statistical diagnostic model. Data were divided into two groups: training (spectra of N, BCC, keratosis, in situ SCC) and prospective analysis (spectra of N and BCC). Principal components vectors (PCs) resemble Raman spectra, with positive as well as negative bands in the same positions as found in tissues. 10 The first four PCs of the training group are shown in Fig. 4, and are responsible for about 90% of all spectral variations. PC1 reproduces the mean spectrum of all datasets, and it has features from all tissues analyzed. PC2 has complementary, noncorrelated information, with band positions (positive and negative) that could be used to differentiate diseased from normal tissue. PC3 and PC4, although they have band positions similar to normal and diseased tissues, do not add new relevant diagnostic information. It was found that PC2 scores have a statistically significant difference (ANOVA test, p < 0.01) for N and BCC.
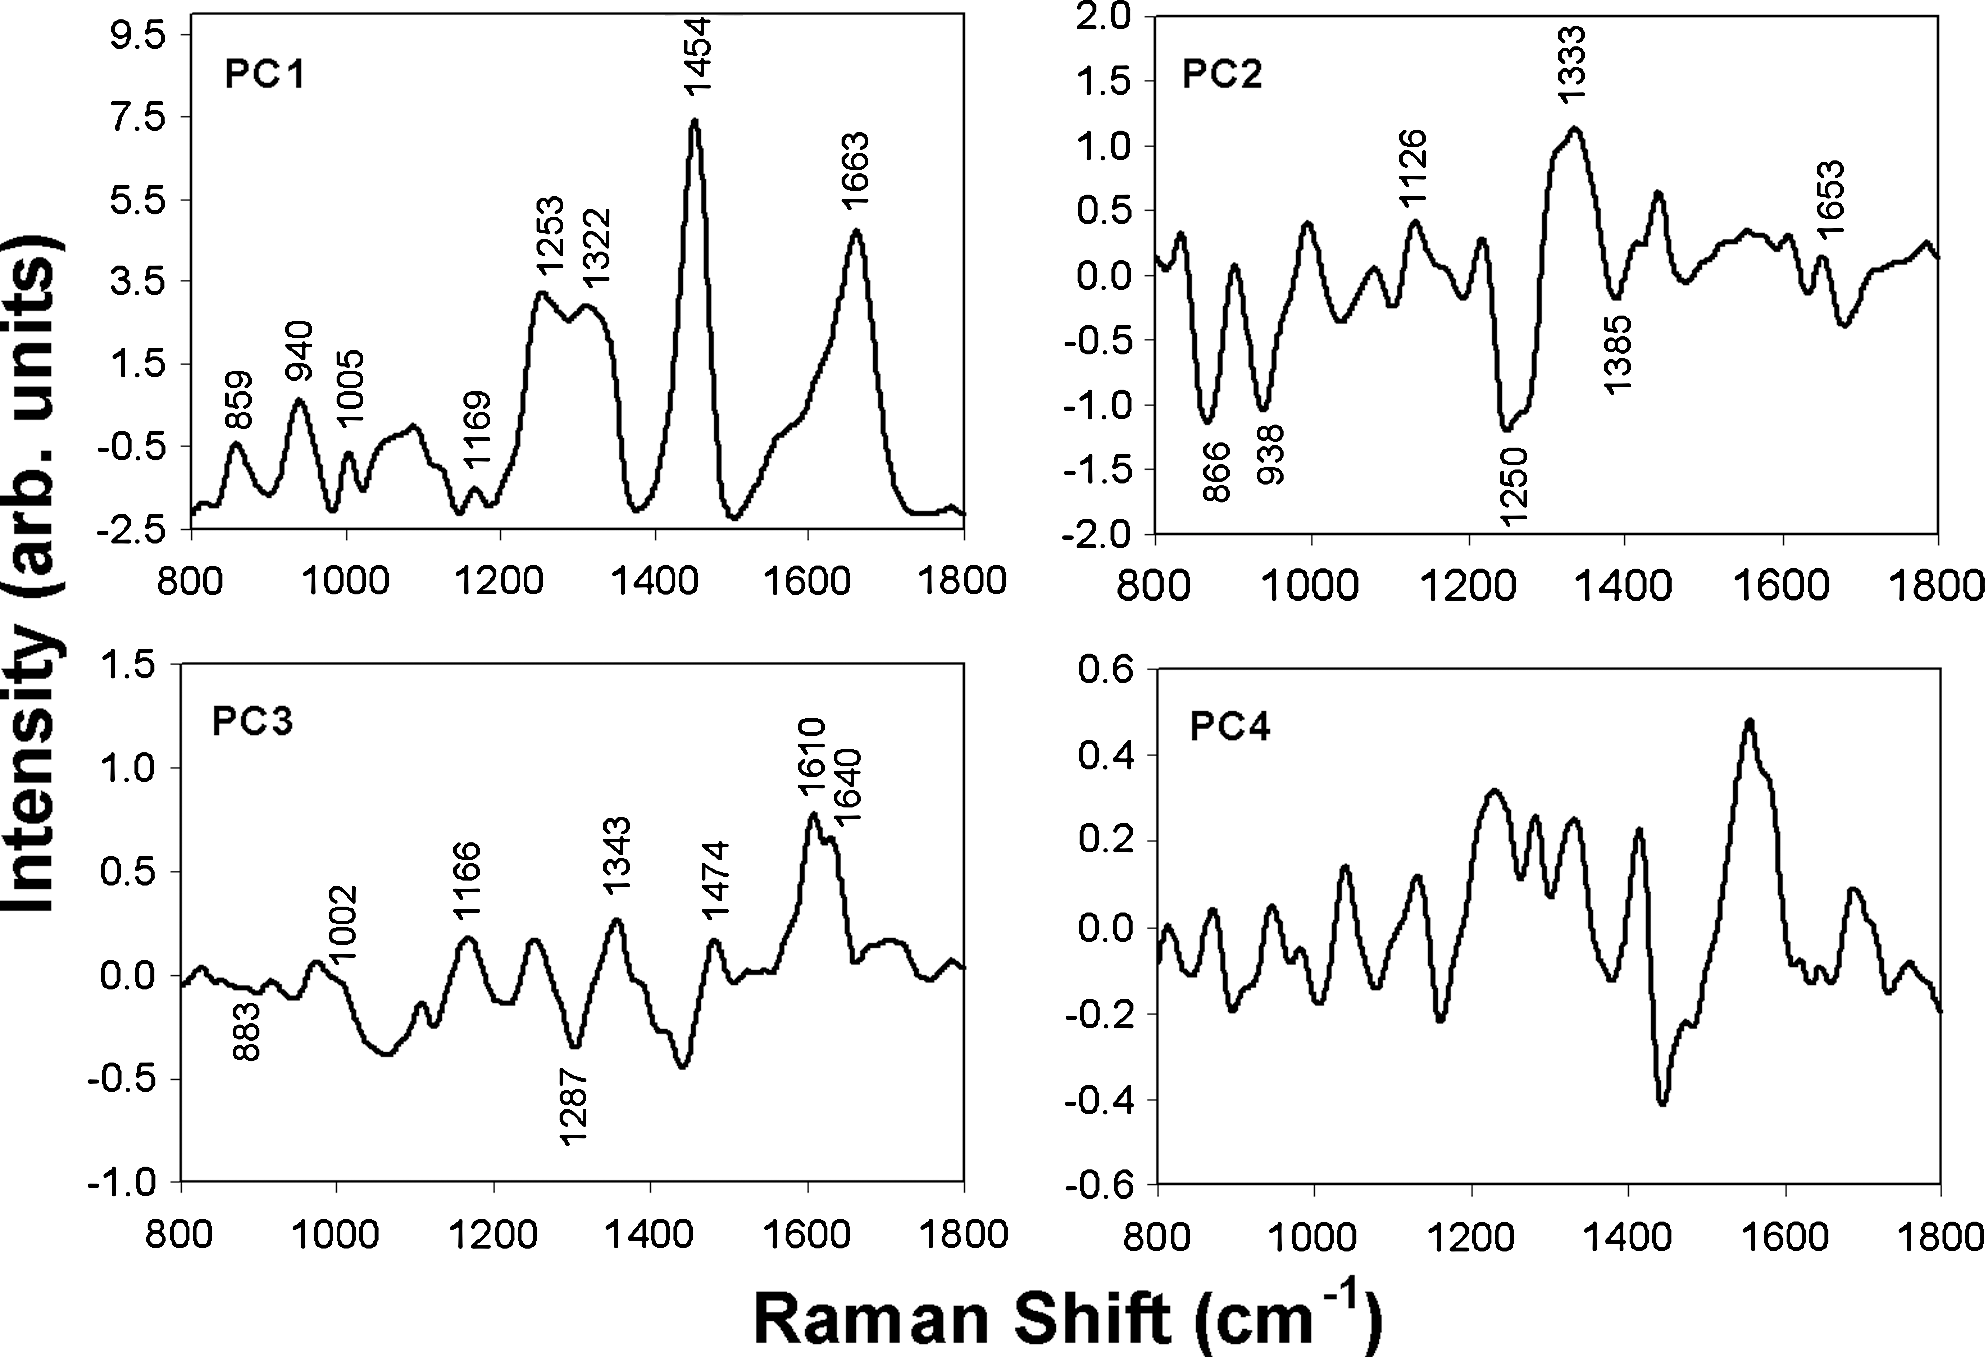
Plot of the first four principal components vectors obtained from the training group of 85 Raman spectra. Main spectral features that occur in N and BCC tissues are labeled.
The first two PC scores (PC1 and PC2) are plotted in Fig. 5. These scores were used to separate the dataset into the two tissue types (N and BCC), according to the spectral information found in each PC. To separate the tissue types clearly, a diagnostic line based on the Mahalanobis distance was calculated and is plotted in Fig. 5. Mahalanobis distance differs from euclidean distance because it takes into account the covariance of the dataset and is scale-invariant (i.e., not dependent on the scale of measurements. PCA and Mahalanobis distance could correctly identify and separate the two types of tissues, giving a sensitivity of 89% and a specificity of 93% for the training group (Table 1).
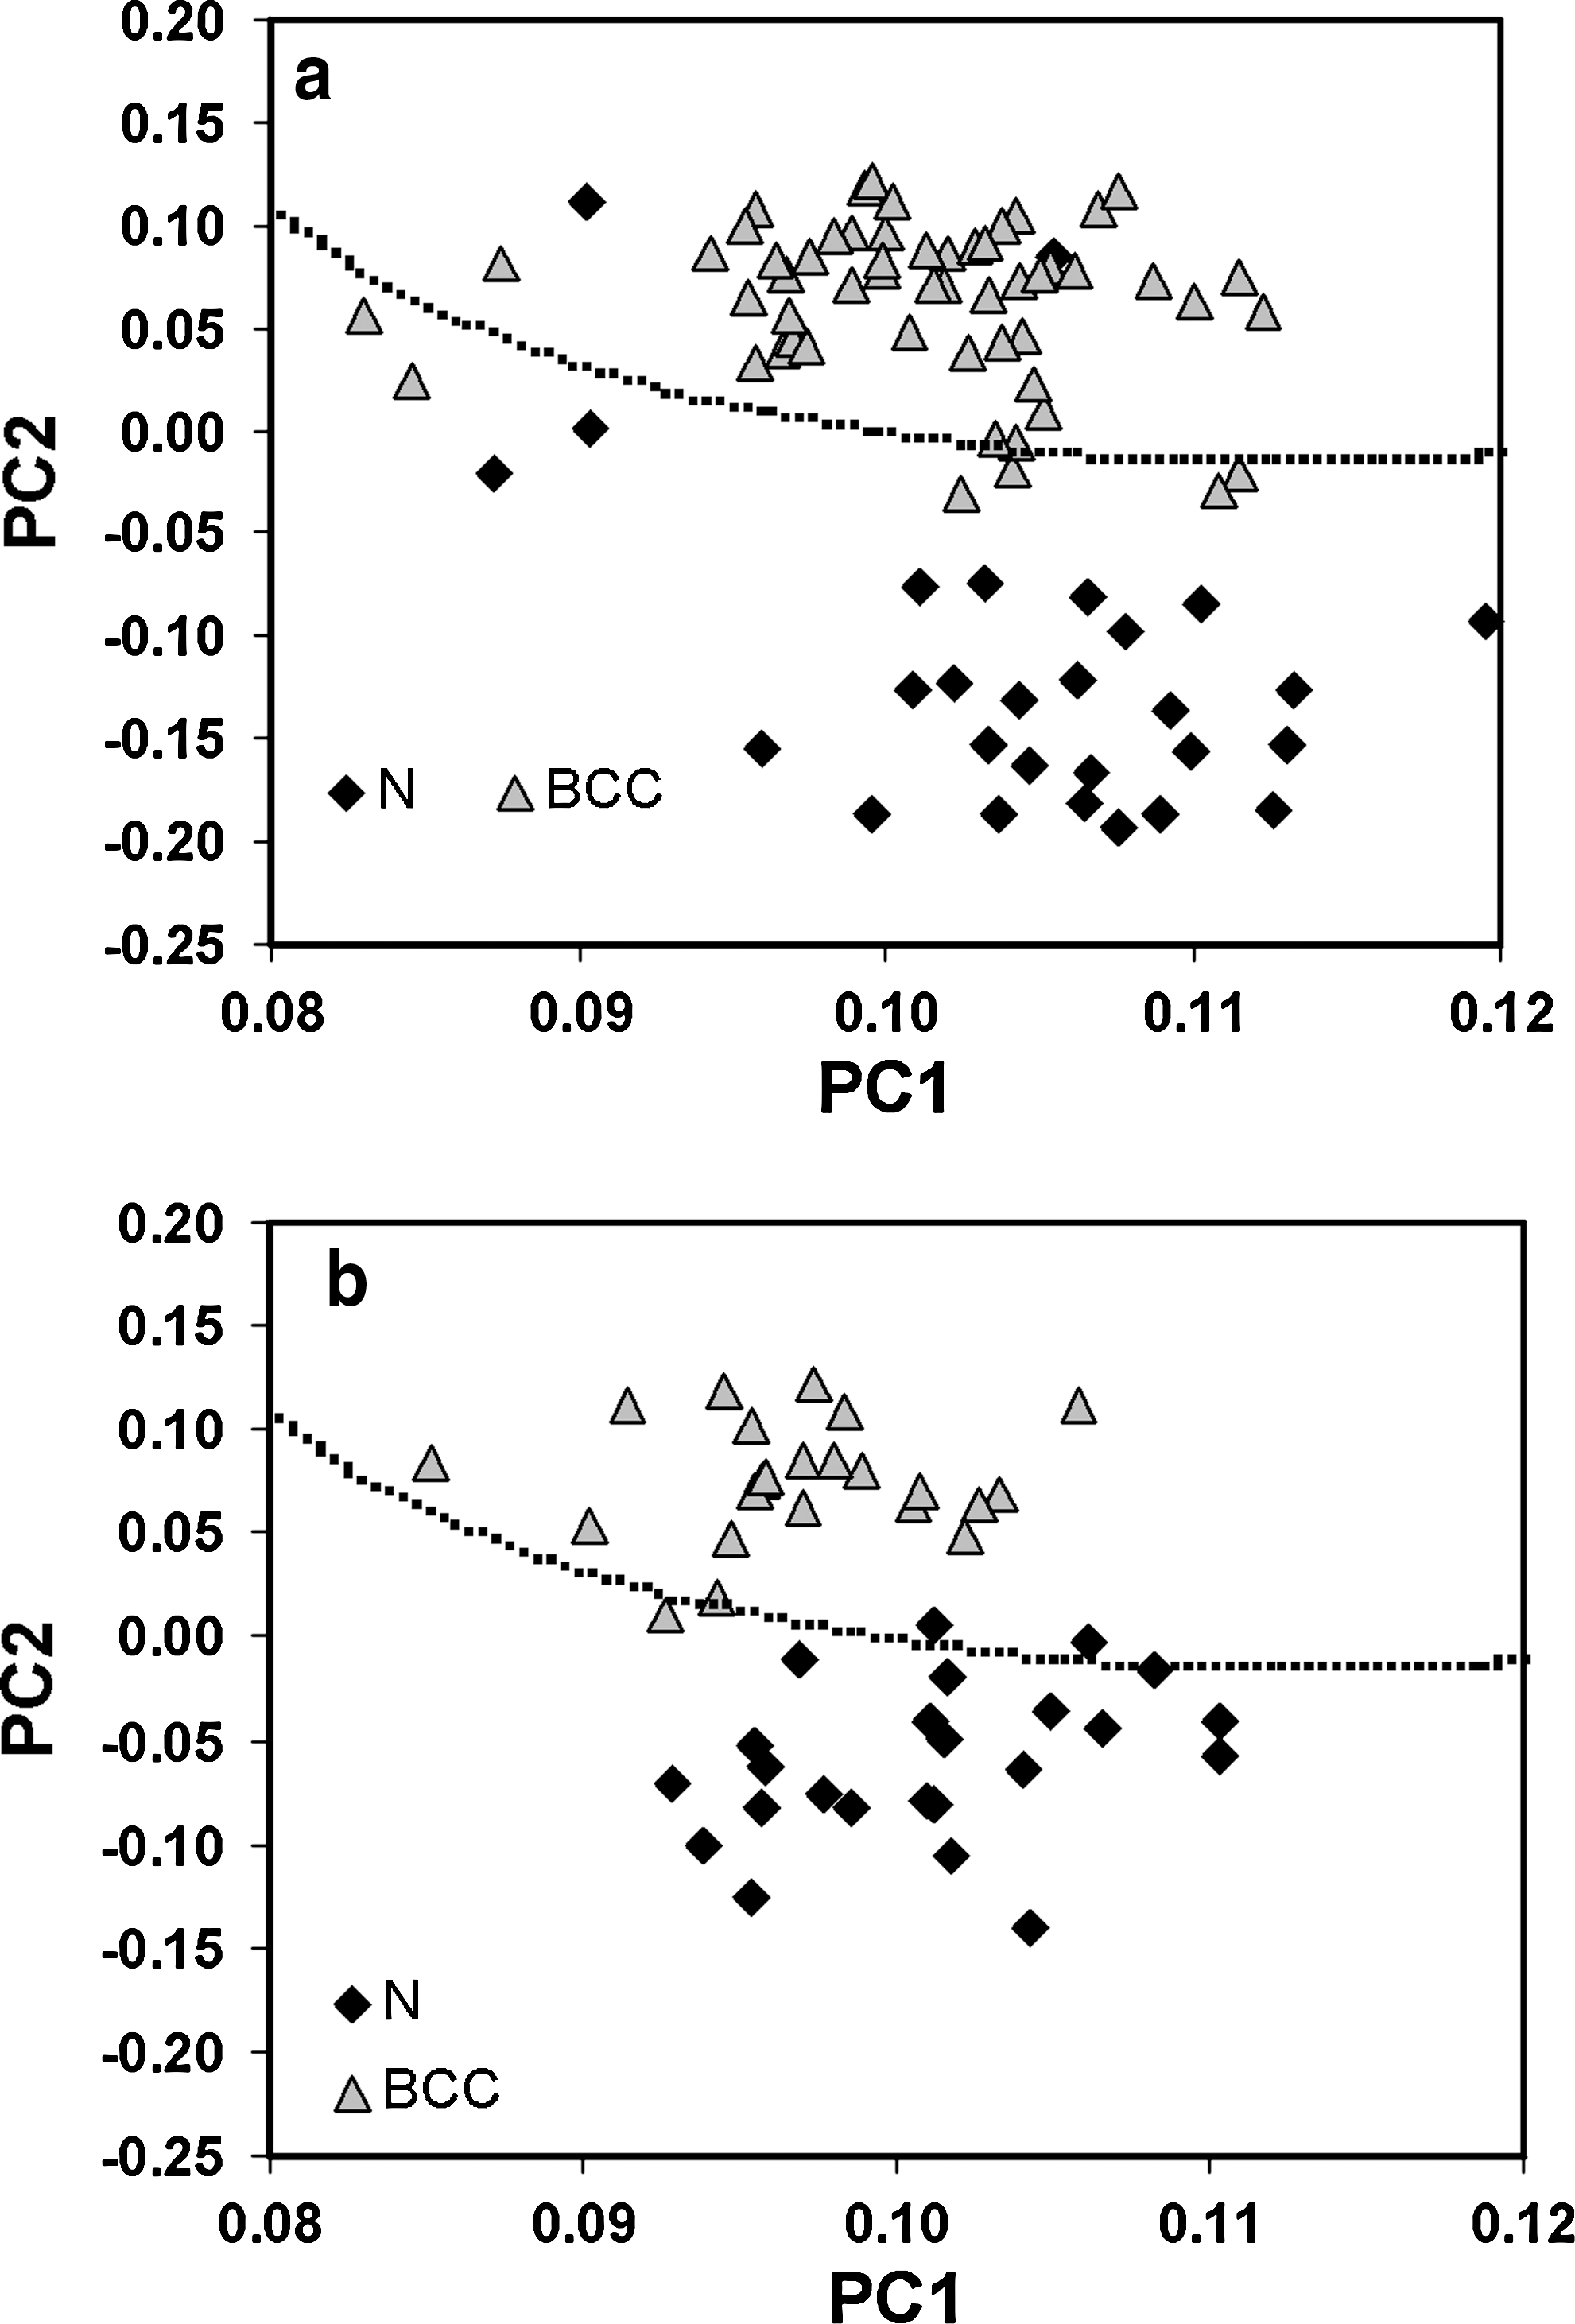
Principal components scores 2 versus 1 (PC2 × PC1) for all Raman spectra used in the (
The PCA algorithm was tested on the prospective dataset. To calculate the intensity of each PC on these spectral data, the principal component vectors from the training set were used, and the prospective PC intensity was calculated by solving the linear equation (least squares fitting):
where P is the intensity matrix of prospective data, XP is the prospective Raman spectra, and PC is the principal components matrix from the training set. Then the intensities of the principal components PC1 and PC2, which were the ones of best separation in the training group, were plotted, keeping the discriminant curve the same as the one used for the training group.
The diagnostic capability of the PCA model for the keratosis and in situ SCC samples was tested in an exploratory analysis. The PC1 × PC2 and PC3 × PC4 scores, including such diseases, were plotted in Fig. 6. We observed that PC1 and PC2 did not discriminate among these two diseases, but the scores were found between N and BCC groups, leading to an expectation of a possible grouping when evaluating a dataset with more samples and more diseases. In the PC3 × PC4 scores, both keratosis and SCC data showed a statistically significant difference (ANOVA test, p < 0.01), and they could be classified by using the Mahalanobis distance, but these PCs were not capable for discriminating among N and BCC.
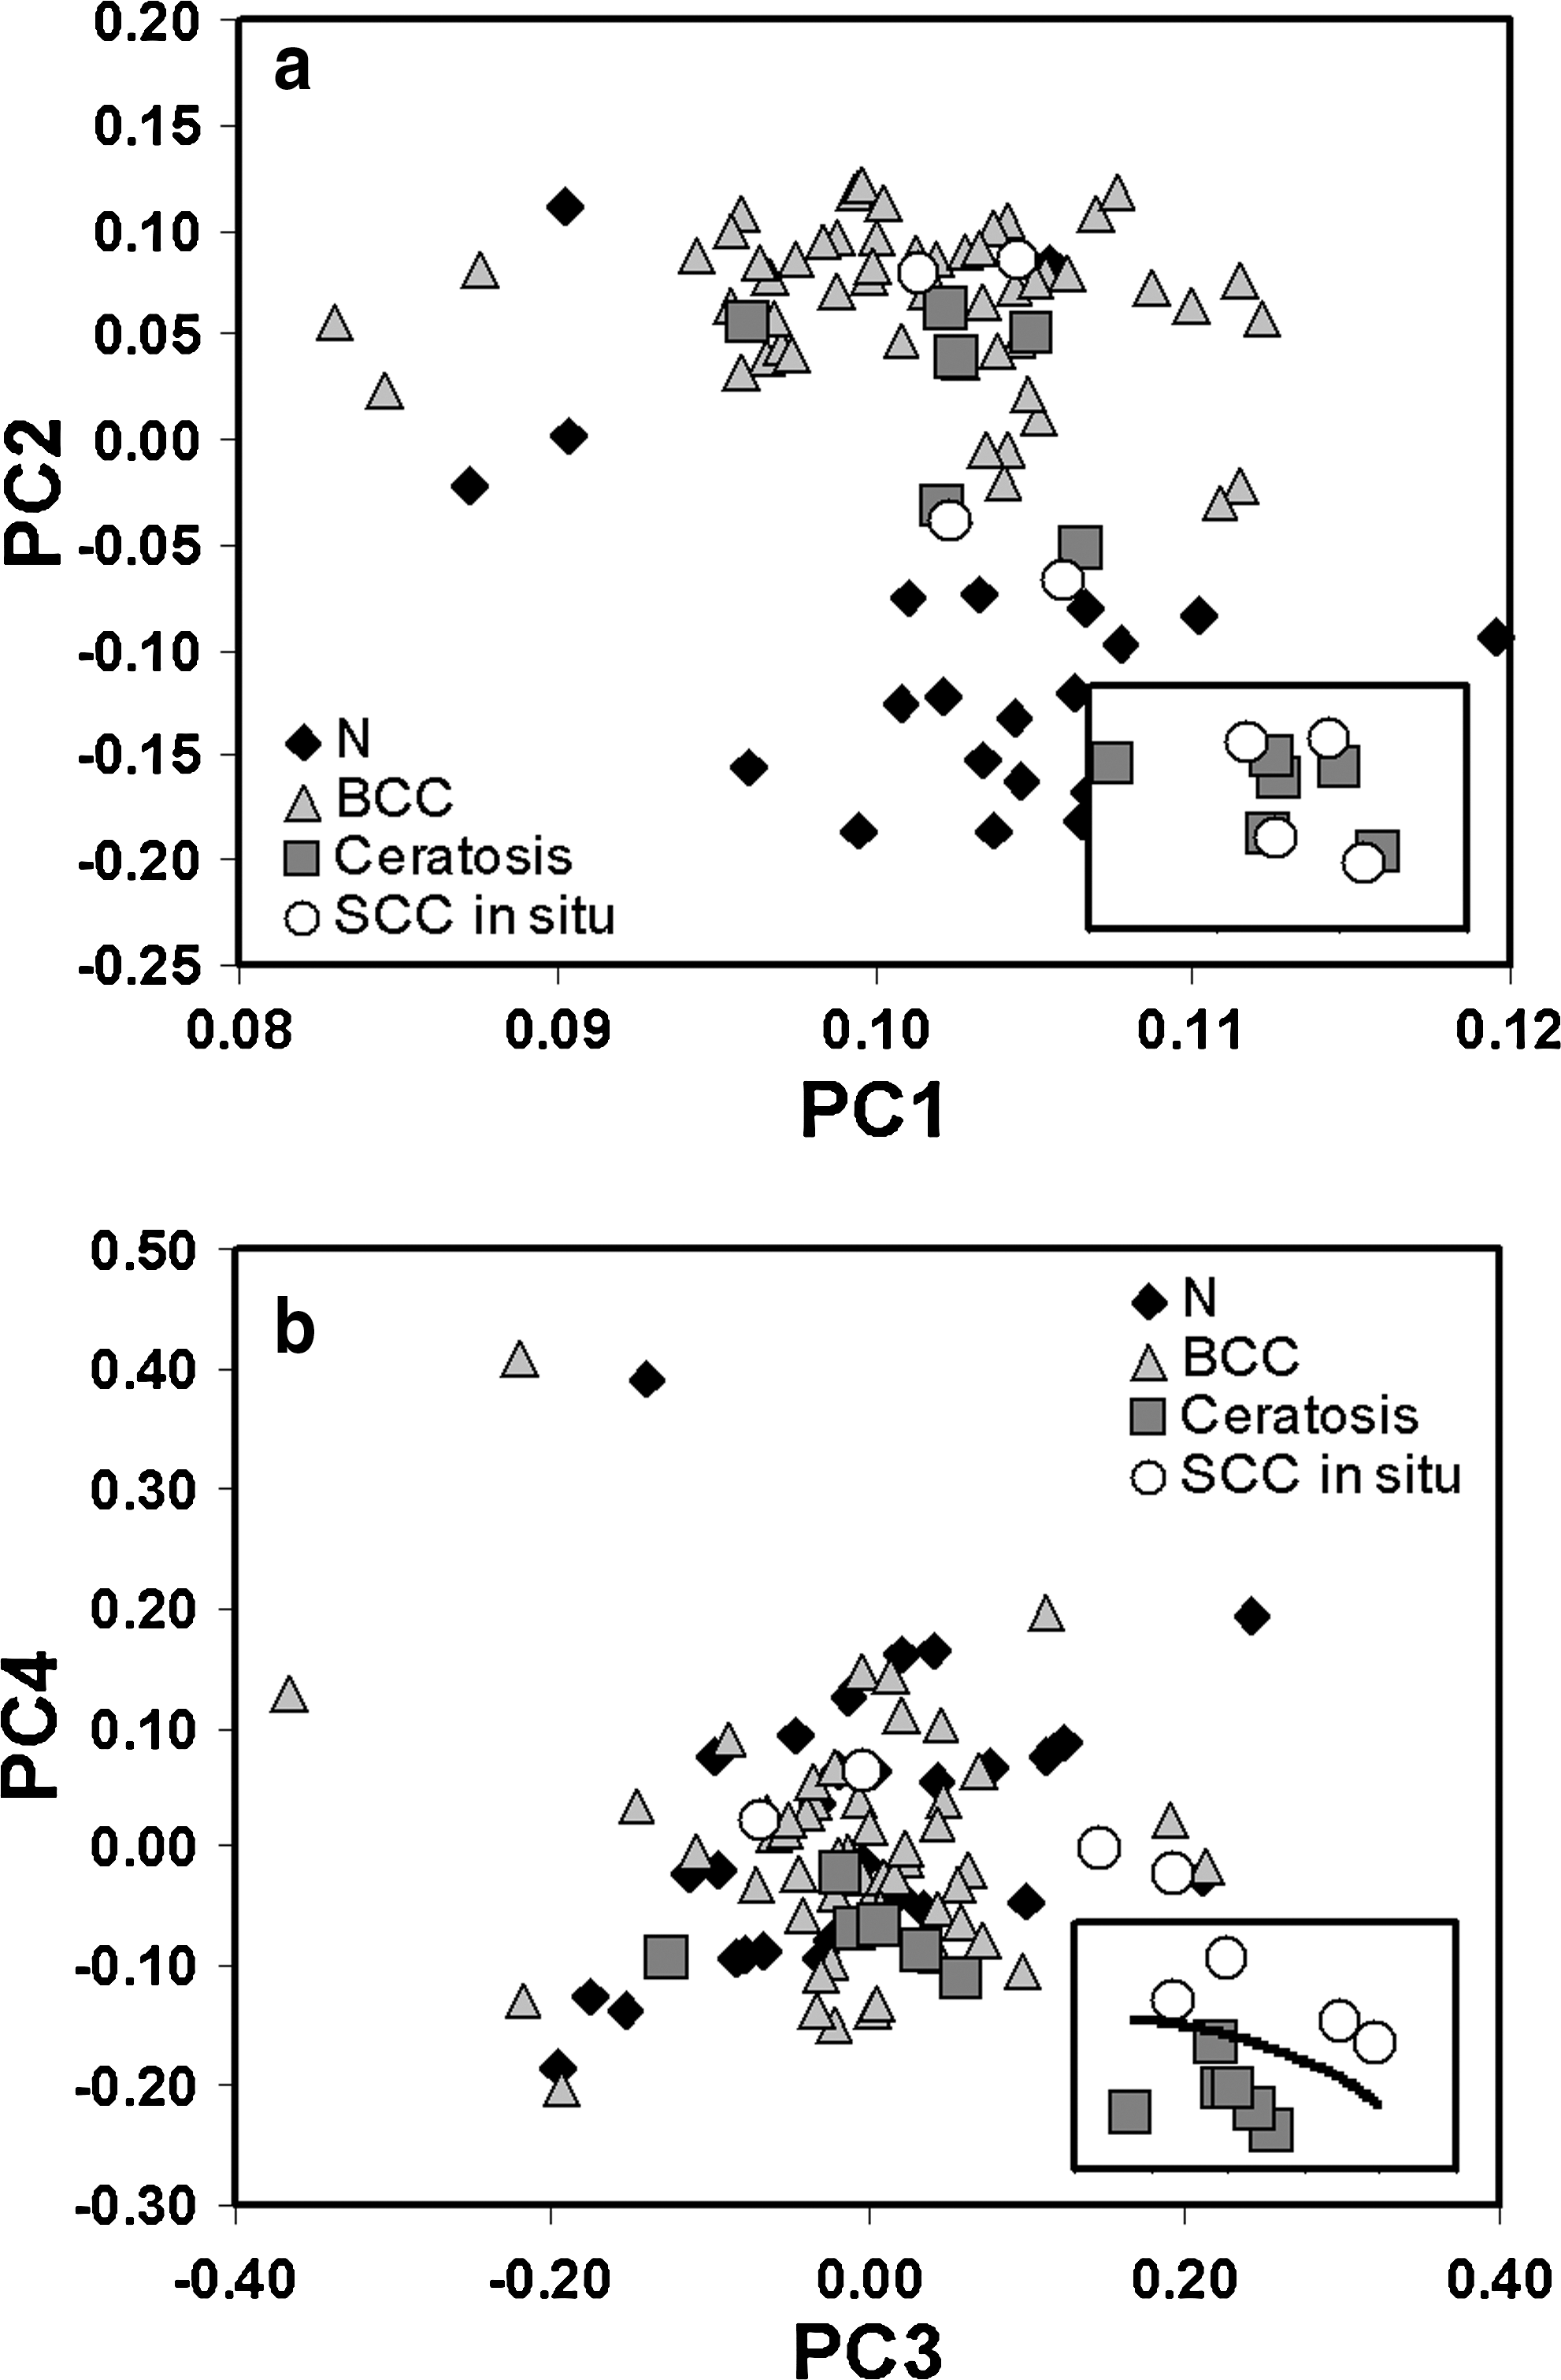
Exploratory data analysis of the principal components scores PC2 × PC1 and PC4 × PC3 calculated including the Raman spectra of keratosis and squamous cell carcinoma in the dataset for the training group. Inner plots represent the plots of only these two disorders.
A simplified biochemical model was also developed based on the relative amounts of protein and lipids (collagen and cell fat) found in each tissue spectrum by using the Raman spectra of bulk human tendon and adipocyte cells. Figure 7 shows the spectra of tendon and adipocytes collected from human tissue fragments, showing bands in the same positions in normal and skin carcinoma tissues. Then the relative intensity of each biochemical found in each normalized tissue spectrum was calculated by solving the linear equation of the tissue spectrum with the basal spectra, calculated by using Matlab 7.01.

Raman spectra of basal compounds collagen from human tendon and fat from tissue adipocytes used to develop the biochemical model. Laser power, 80 mW; wavelength, 830 nm; spectral resolution, 10 per centimeter.
Figure 8 presents the correlation of the relative amount of collagen versus cell fat calculated for each tissue Raman spectrum for the training and prospective groups. We show the mean residual of the least-squares fitting, calculated as follows:

Plot of the relative amount of collagen versus cell fat calculated from Raman spectra of samples by fitting the spectra of human tendon and adipocytes. The diagnostic lines (solid) were based on the mean of data points (euclidean distance) of the training group (horizontal line, collagen; vertical line, cell fat). Correlation of the collagen versus fat model (dotted line) was r = 0.93. Inner plot, mean residual of the fitting model for the training spectra.
(Fig. 8, inner graph). We found a high correlation coefficient (r = 0.93) among the two biochemicals. The relative amount of collagen was reduced in BCC samples, although the amount of fat was increased. Some samples of normal skin showed negative fitting coefficients for the cell fat.
To obtain a diagnostic algorithm, a discrimination line was drawn based on the mean (euclidean) intensity of the collagen and cell fat for each histologic group. This simplified model showed, for the training and prospective groups, respectively, higher sensitivity and specificity by using the collagen (Table 2). Comparing the biochemical and the PCA models, both models presented high sensitivity and specificity (>80%), with higher values for the PCA algorithm.
Discussion
Normal and BCC tissues showed spectral differences that could be used to discriminate fragments of both samples in vitro, mainly in the Raman region of amide III and C-C bonds from lipids and proteins, 4,23,24,33 –35 as seen in Figure 3. Such differences were used for optical diagnosis by implementing two routines based on the PCA scores and the relative amounts of specific biochemicals, particularly collagen and cell fat. These biochemicals have been correlated to the observed differences in the normal and BCC tissues in vitro and in vivo, 21,23,24,33 –35 because they present most of the spectral features for human proteins and lipids (C-C bonds and amide III) found in both tissue types, as seen in Fig. 7.
The PCA diagnostic model applied to the Raman spectra and correlated to the tissue histopathology can be effectively used for classification of human diseases, because each principal component has a unique spectral characteristic, and the scores represent the magnitude of these characteristics. In this study, the PCA clearly separated both tissue types with high agreement with histopathology, by using Mahalanobis distance as a discriminator in both training and prospective groups. The disadvantage of such statistical model is the need for a representative dataset for training with the algorithm to extract reliable principal components scores, the need for the recalculation of PCA scores and vectors, and the consequent recalculation of discriminant curves when including new samples of different types of skin lesions in the training group, and the consequent need for a least-squares fitting of the new principal components vectors onto the Raman spectra of prospective samples.
We presented a diagnostic model based on the relative amounts of basic biochemicals, the collagen (proteins) and cell fat (lipids), which have been demonstrated by others to be responsible for the spectral differences in normal and BCC samples. 23,24,38 This biochemical model was implemented in a simplified manner, by using the Raman spectra of bulk samples of tendon and perivascular fat extracted from postmortem human tissues. The biochemical model presents some advantages over the statistical model; because of its ease in including new biochemicals, it could be applied to any data, without the need for a particular multivariate technique. No reprocessing is needed when new samples are included, and the prospective analysis can be done independent of the training group spectra without need for principal components extraction in a training dataset, because the Raman spectra of biochemicals are already the basis of the tissue spectral information. The model can be easily improved by adding new biochemicals or even morphologic spectral information from tissue layers, but one should be aware of including spectra of tissue compounds or structures that have spectral information with orthogonal (nonsimilar) information, 30 to avoid cross-correlation. The use of a few compounds could be extrapolated to other diseases, because diseased tissue shows changes in tissue morphology and biochemistry, mainly in protein/lipid contents, as demonstrated by several studies. 18,31
Results showed that collagen was increased in normal skin and reduced in BCC, and cell lipids were increased in BCC and reduced in normal tissues, corroborating with the microscopic studies of Raman and infrared in normal and BCC skin. 23,24,38 In terms of tissue histochemistry, studies suggest that the growth of certain tumors is dependent on maintaining sufficient lipid levels and that the lipid-mobilizing effect of the tumor may be necessary to sustain tumor growth. 40 For proteins, studies in oral tissue observed a progressive loss of continuity in the expression of collagen IV and laminin as tissues progressed from dysplasias to metastatic nodules. 41 This relation is important, as more-aggressive carcinomas have an increased ability to produce enzymes that degrade basal membrane components, consequently hindering new protein synthesis. 41
In the biochemical model, a highly inverse correlation was found between the collagen and the cell fat, although we found negative fitting coefficients for the cell fat in some normal tissues. Least-squares has disadvantages of overfitting and possible negative coefficients when dealing with specific situations, such as colinearity in the selected basal compounds, 30 as found in some bands of collagen and adipocytes, mainly in amide III and amide I regions, and present in most tissue biochemicals. The noise also could lead to bad parameter estimation, but the most important source of fitting error is the exclusion of other biochemicals that show bands in the region of interest, 39 sometimes overlapped with other tissue structures of tissue layers and cells, such as nucleic acids, fatty acids, carotenoids, and proteins such as elastin, among others. In the absence of bands of such compounds, the fitting would deal with those presented in the collagen and fat, allowing negative correlation. An alternative approach investigated was to use nonnegative constraint in the fitting to calculate the predicted constituent amount, 39 but we found a lack of correlation for the fat in some normal samples.
The result of the statistical model (PCA) was slightly better than that obtained with the simplified biochemical model. This could be explained by the fact that the PCA algorithm used two variables (PC1 and PC2) to describe the spectral variations, and the discriminator used is a statistical distance, which could handle two-dimensional data that follow nonisotropic distribution. The PCA has been largely used in the spectral data analysis, because of the capability of reducing the number of independent variables in the dataset to a more-coherent set of variables, the principal components vectors and scores, orthogonal to each one, being a linear combination of the original variables. 10 These variables could then be used to develop the algorithm, by comparing the information contained in the scores with the pathologies.
Keratosis and SCC were not included in the discrimination models because of the low number of cases for such tissues; consequently, the spectral differences among keratosis and SCC compared with BCC (Fig. 2) could not be fully explained. It is known that normal and malignant tissues have different protein structure and nucleic acids content, and under infrared spectroscopy, BCC and SCC have similar information, with an increase in the lipid-like spectral features for the BCC. 38 Despite the small amount of samples, we performed an exploratory data analysis in the training dataset with the keratosis and SCC spectra included in the PCA model, and we found the scores situated at an intermediate region between N and BCC. However, a correct interpretation of this result and a possible class discrimination could be done only with the inclusion of more samples of such skin diseases, because of the nature of a discrimination based on PCA or even the biochemical model, in which the robustness is a fundamental issue and can be achieved only with a large number of samples for all groups. 2 As the spectra of these new samples follow the changes in the regions 1 and 3 of Fig. 2, one could expect a discrimination by using PC1 and PC2 or even other PCs. The study will be improved by adding new skin diseases in vitro and searching for the spectral differences that could discriminate skin ex vivo and in vivo, in real, clinical situations, evaluating the effect of blood perfusion and the metabolism that might affect the spectra.
Raman spectroscopy is a promising technique for analysis of skin lesions nondestructively in real time, with the inclusion of a more-extensive list of lesions found in skin. By connecting handheld fiberoptic probes to collect light at the suggestive lesion in vivo, the technique makes it possible to collect the Raman signal for instantaneous diagnosis. 22,28 Both statistical and biochemical models could be easily implemented for an in vivo application, to assist in the histopathologic examination, mainly in situations in which biopsy is not effective (for example, in multiple lesions or incipient lesions, and after the cancer removal during surgery in vivo, for tumor-border demarcation. 23,24
Conclusion and Summary
Raman spectroscopy could become a technique for discriminating skin BCC from normal tissue, nondestructively. In this study, the dispersive Raman spectra obtained from in vitro human skin fragments could clearly separate normal from BCC tissues with high correlation with the histopathology, by using algorithms based on the PCA/Mahalanobis distance and the relative amount of collagen and cell fat (tissue proteins and lipids). The diagnostic model based on PCA showed higher sensitivity and specificity than did the biochemical model using Mahalanobis distance as discriminator, but the biochemical model could be implemented in a simplified manner, by using the Raman spectra of bulk samples of tendon and perivascular fat extracted from postmortem human tissues. With the biochemical model, it was shown that the relative amount of collagen was increased in normal skin and reduced in BCC, and the inverse occurred with respect to cell fat. The amount of lipids was inversely correlated to the collagen within the samples.
Footnotes
Acknowledgments
L. Silveira Jr. thanks CNPq (National Counsel of Technological and Scientific Development) for the Productivity Award fellowship (No. PQ2 - 305610/2008-2) and São Paulo State Research Foundation (FAPESP) (grant no. 2009/01788-5).
Author Disclosure Statement
No competing financial interest exists.