
Abstract
Introduction
Recently we developed an HP-FRI system that produced in vivo images of tumor masses implanted and grown in mice, by using hematoporphyrin (HP) dichlorohydrate as an exogenous fluorophore. 18,19 This system adopted a pulsed green laser source and a low-cost, low-sensitivity monochrome CCD camera for the optical setup. In this work, we improved the performances of the previous experimental apparatus by using (a) a low-noise cooled CCD camera for the detection of the red fluorescence radiation emitted by HP-injected tumor-bearing mice with high photometric sensitivity and dynamic range, and (b) a stereomicroscope to magnify the image of the investigated area. We exploited the high photometric sensitivity and the magnification to investigate in vivo the optical emission within the tumor region where the fluorophore accumulates, as seen from the exterior of the mouse body. As in our previous reports, 18,19 the HP compound was used: after being optically excited in the green, its long-wavelength red emission was captured as externally diffused light seen through a cut-on filter. Because the red light has a higher penetration in tissue than shorter wavelengths light, in principle, the red fluorescence from the solid tumor implanted under the mouse skin accumulating HP could be seen.
Materials and Methods
In the experimental apparatus for the fluorescence imaging, the fluorescence excitation light is supplied by a frequency-doubled pulsed Nd:YAG laser (λ, 532 nm; beam diameter, 7 mm; energy/pulse, 30 mJ; pulse width, 50 ps; repetition rate, 10 Hz). The horizontal laser beam, enlarged and directed vertically via a flat mirror, produces an elliptical spot (10 × 5-cm axis lengths) onto the plane where the animal to be imaged is located. The 532-nm light backscattered by the mouse toward the CCD camera was rejected by a cut-on long-wavelength pass filter (Andover 600FH90-25; λ >600 nm). HP fluorescence light emitted by the animal was collected by a positive relay lens of 10-cm or 33-cm focal length and by a cooled CCD monochrome digital camera [Hamamatsu ORCA 285 G, 1,344 × 1,024 pixels, 12-bit A/D converter, 8 electrons r.m.s. readout noise, amplification gain conversion coefficient, 4.6 electrons/ADC counts; camera gain between 0 (0 dB) and 255 (20 dB), exposure time from 10 μs to 10 s, 60% peak quantum efficiency at 500 nm] equipped with a 16-mm objective. This configuration provided a field of view (FOV) of about 5 × 4 cm2 or 13 × 10 cm2 on the measurement plane.
A second set of measurements was performed with a smaller FOV (∼1.1 × 0.9 cm2) and a slightly different experimental setup. The fluorescence radiation coming from the sample was collected by the objective of a stereomicroscope (Olympus SZ-40) with a magnification of 1.3 × and registered by CCD camera through the cut-on long-wavelength pass filter.
We used 6-week-old Crl:CD-1 athymic nude mice (Charles River Laboratories, Calco, Italy). Tumor cells subcutaneously inoculated in the mice are (a) MDAMB361 cells (hereafter called, for sake of brevity, MDA cells), derived from a mammary human carcinoma; or (b) ARO cells, derived from an anaplastic human thyroid carcinoma. Cells were cultured in Dulbecco's modification of Eagles' Medium (DMEM) culture medium supplemented with 10% fetal calf serum, penicillin (50 U/ml), and streptomycin (50 g/ml). About 106 cells were injected into the backs of the mice, and the measurements were performed 8 days later for mouse 1 (ARO), 30 days later for mice 2 and 4 (MDA), and 31 days later for mouse 3 (ARO).
The fluorescent marker, HP dichlorohydrate (Vit-porphyrin II, Teofarma, Italy), was injected IM in the right posterior leg of the mouse, on the opposite side with respect to the tumor. HP dichlorohydrate was injected in mice as a water solution at a concentration of 4 mg HP/ml 18 (dose of 28 mg HP/kg mouse body weight). Ten minutes before measurements, the animal was anesthetized by injecting 300 μl of a solution obtained by dissolving in 20 ml physiologic NaCl solution, 0.5 ml of a stock solution of tribromoethanol (Avertin) in 2-metil-2-butanol at the concentration of 1 g/ml. 20
In vivo fluorescence imaging was performed 6 h after the HP injection for mice 2 and 4 (MDA), and at 30 h (1 day + 6 h) for mice 1 and 3 (ARO). This different delay is because the first measurements performed on ARO mice only 6 h after HP administration showed no detectable fluorescence.
To obtain a reference image showing the position and the dimensions of the investigated structures on the animal, the mouse was first imaged in the red (i.e., with the cut-on filter (λ >600 nm) in front of the CCD) on white-light illumination (fiberoptic illuminator, 50-W tungsten lamp). Then the map of the fluorescence emission was registered by CCD camera with an exposure time ranging from 5 to 10 s and a gain between 50 and 120. The exposure time corresponds to 50 or 100 laser pulses per image. To compare images with different gain and exposure times, the image data. Before and after each measurement, the image of the laser spot was acquired to evaluate its long- and short-term stability and its spatial uniformity in the position where the mouse was located for the fluorescence imaging.
In two cases, immediately after in vivo fluorescence-imaging measurements, the mice were killed, and histologic sections were obtained from tumor tissues.
All the images are acquired as 12-bit images, but are represented here as 8-bit images.
Results
Spatial-resolution measurements
To estimate the spatial resolution of our in vivo imaging system, we used a borosilicate glass capillary (5 μL volume, nominal external and internal diameter of 1 mm and 260 μm, respectively). The capillary was filled HP solution at a concentration reduced by a factor of 4 with respect to that which we injected in mice for fluorescence imaging measurements, and it was inserted postmortem under the skin of a killed mouse for a length of 15 mm. Before inserting it, we imaged by fluorescence about 25 mm of capillary length in the air, by placing it on a black cardboard. The line profile of the corresponding fluorescence images (taken transverse to the capillary walls and integrated along a length of the capillary of ∼18 mm) showed a gaussian shape with a FWHM value of 240 ± 20 μm, in accordance with the nominal internal diameter of the capillary (Fig. 1, left).
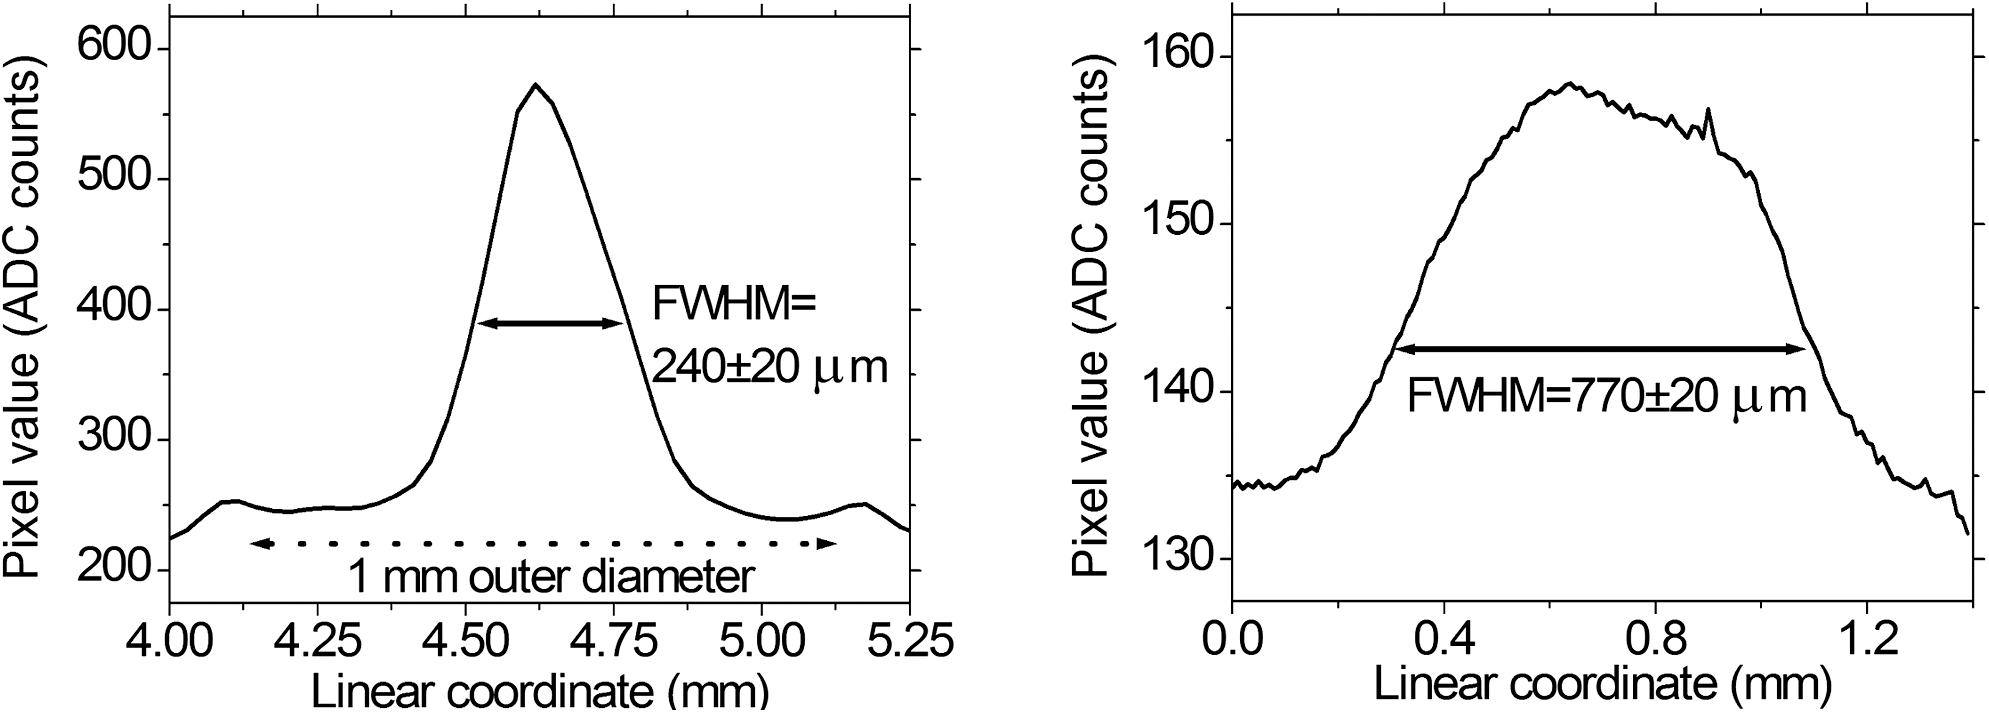
Transverse intensity profile of the fluorescence image of a capillary filled with HP solution when the capillary is kept in air (top) and when it is inserted under the mouse skin (bottom). The profiles have been integrated for a length of several millimeters along the capillary (see text). In the upper plot, the capillary tube walls are evident as small peaks at about 1 mm distance, because of the effect of internal diffuse reflection of fluorescence light at the glass-to-air interface.
The fluorescence image of the part of the capillary under the skin (Fig. 1, right) shows that the corresponding line profile has a FWHM value of 770 ± 20 μm, because of the effect of light scattering by the mouse skin. By subtracting in quadrature from this last value, the FWHM value measured in air, we obtained an estimated value of 730 ± 30 μm for the FWHM-system resolution of our in vivo fluorescence imaging system, when the fluorescent source is placed ∼0.5 mm under the mouse skin, as it happens for the tumors we implanted in the investigated mice.
Imaging measurements
We present the results obtained for four mice: two of them bear an ARO tumor, and the other two, a mammary (MDA) tumor.
Figure 2 shows the sequence of in vivo images for the mouse listed as no. 1 in Table 1. These images show (top to bottom) (a) the whole mouse, back view, image in the red on white light illumination; (b) the whole mouse, back view, fluorescence image before HP injection; (c) the mouse flank with the tumor, fluorescence image before HP injection; (d) the mouse flank with the tumor, fluorescence image after HP injection. Figures 2b and c show the mouse images by autofluorescence (the red fluorescence radiation emitted by tissues when they are excited at 532 nm). Figure 2d shows the fluorescence intensity in the tumor region, due to the accumulation of the exogenous HP fluorescent marker.

Images of mouse number 1. The mouse is imaged, before HP injection, in the red light (
The listed times (both for HP injection and fluorescence imaging measurements) are measured starting from the tumor cell injection time (t = 0 d). ARO, Anaplastic human thyroid carcinoma; MDA, mammary human carcinoma; d, day; h, hour.
We note that a bright spot appears on the mouse body in the image taken before HP injection (Fig. 2b). This fluorescence signal comes from a nontumoral region corresponding to the mouse stomach.
The profiles of the fluorescence intensity show a bell-shaped behavior with a peak value for the HP fluorescence image (Fig. 2d) higher than that for the autofluorescence image (Fig. 2c). The optical contrast, calculated as the ratio between the maximal and the minimal value of the fluorescence intensity along the line drawn in mouse images, is 1.4 for the tumor region imaged in the autofluorescence radiation (Fig. 2c) and 2.0 in the HP fluorescence radiation (Fig. 2d).
The first mouse with a mammary tumor (mouse 2), as observed in red light, shows three small tumors (a, b, and c) on the back (Fig. 3, top). The corresponding HP fluorescence image (Fig. 3, bottom) shows the highly fluorescent HP injection site in the right posterior leg (detail d), and a diffuse fluorescence in the back with some brightest points that correspond to the tumor regions (a, b and c). A fourth fluorescent region (e) is also visible; we were not able to correlate this visually with any normal or tumor structure. The histologic analysis shows that this fluorescent region (e) corresponds to a tumor region.
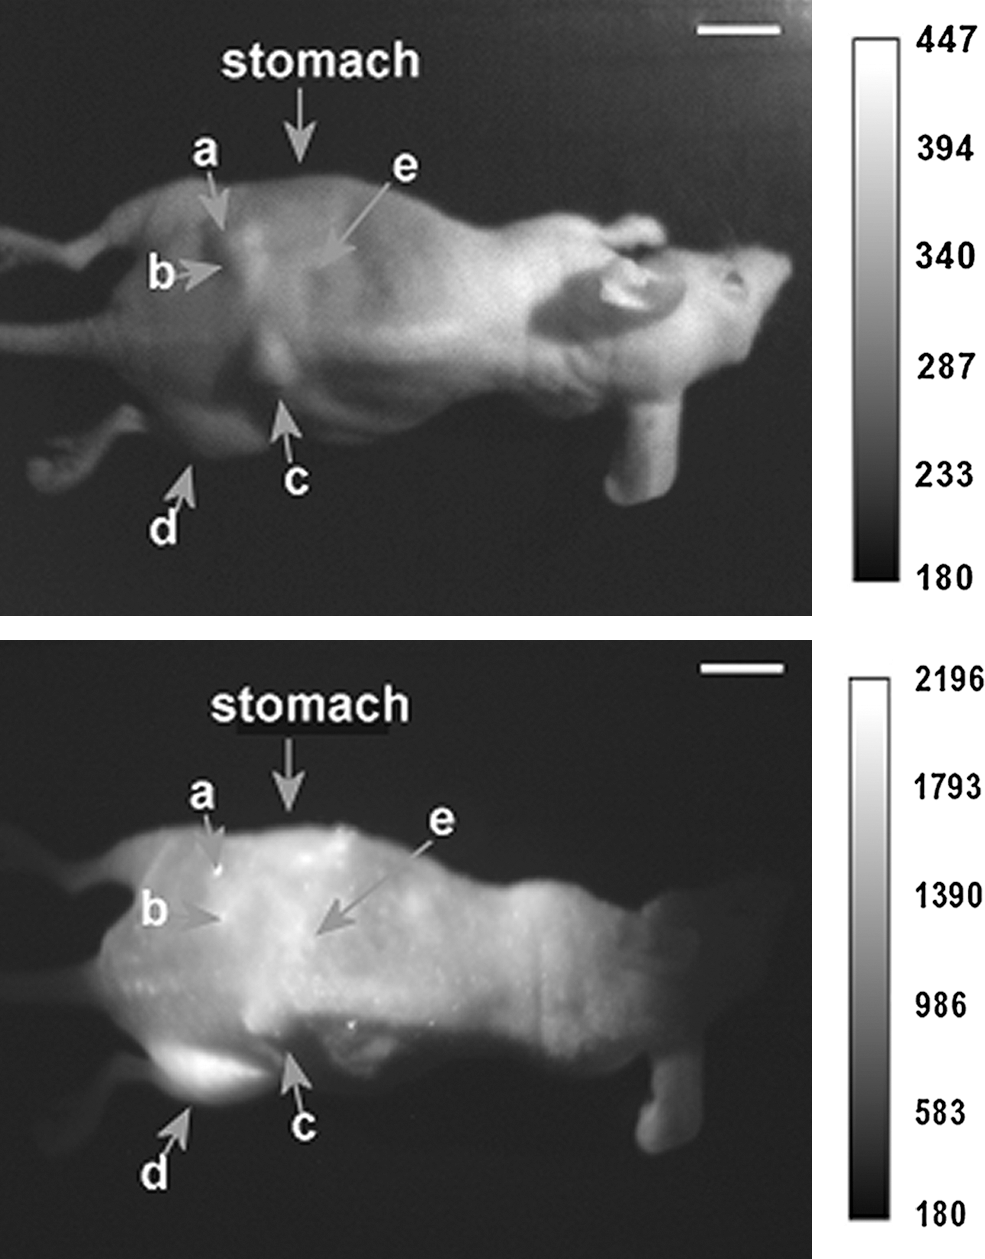
Red-light image (top) of the back of mouse number 2 showing the three tumor masses labeled a, b, and c. Fluorescence image (bottom) of the same view of the upper image. The fluorophore injection site is labeled d. The fourth fluorescent region (e) does not correlate visually with any normal or tumor structure. The horizontal white bar corresponds to the distance of 1 cm.
As in the case of the preceding mouse 1, this mouse as well shows a fluorescent region in a rough anatomic correspondence with the stomach, which is visible in the back view (Fig. 3, bottom).
Figure 4 shows the in vivo HP fluorescence images of the second mouse bearing an ARO tumor (mouse 3) acquired with the stereomicroscope (FOV of 1.1 × 0.9 cm2). In Fig. 4a, the tumor exhibits a two-lobe structure, as indicated also in the line-intensity profile (Fig. 4b): the smaller lobe has a FWHM linear size of ∼1 mm.
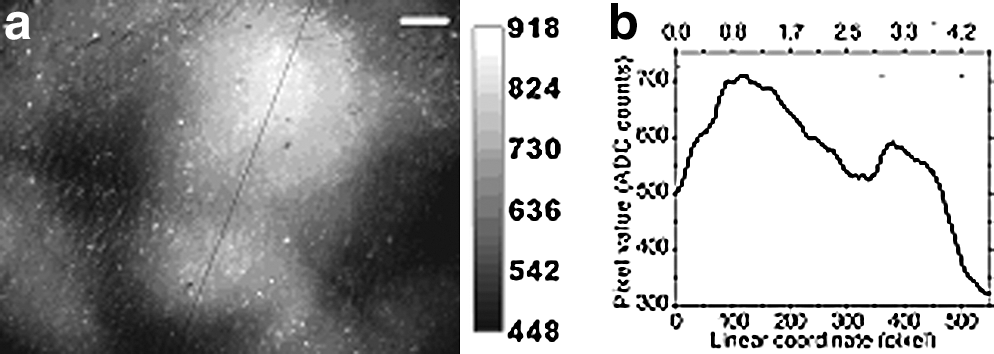
HP fluorescence images of a tumor (
The second mouse bearing mammary MDA tumors (mouse 4), as observed in the red light (Fig. 5, top), shows a tumor with three lobes; the two larger ones (A and B) are recognized, by the visual inspection, in an advanced state of necrosis. The fluorescence image (Fig. 5, bottom) confirms this three-lobe tumor structure. In addition, the two necrotized lobes (A and B) appear less fluorescent with respect to the surrounding healthy tissues, and the last lobe (C) has a slight fluorescence.
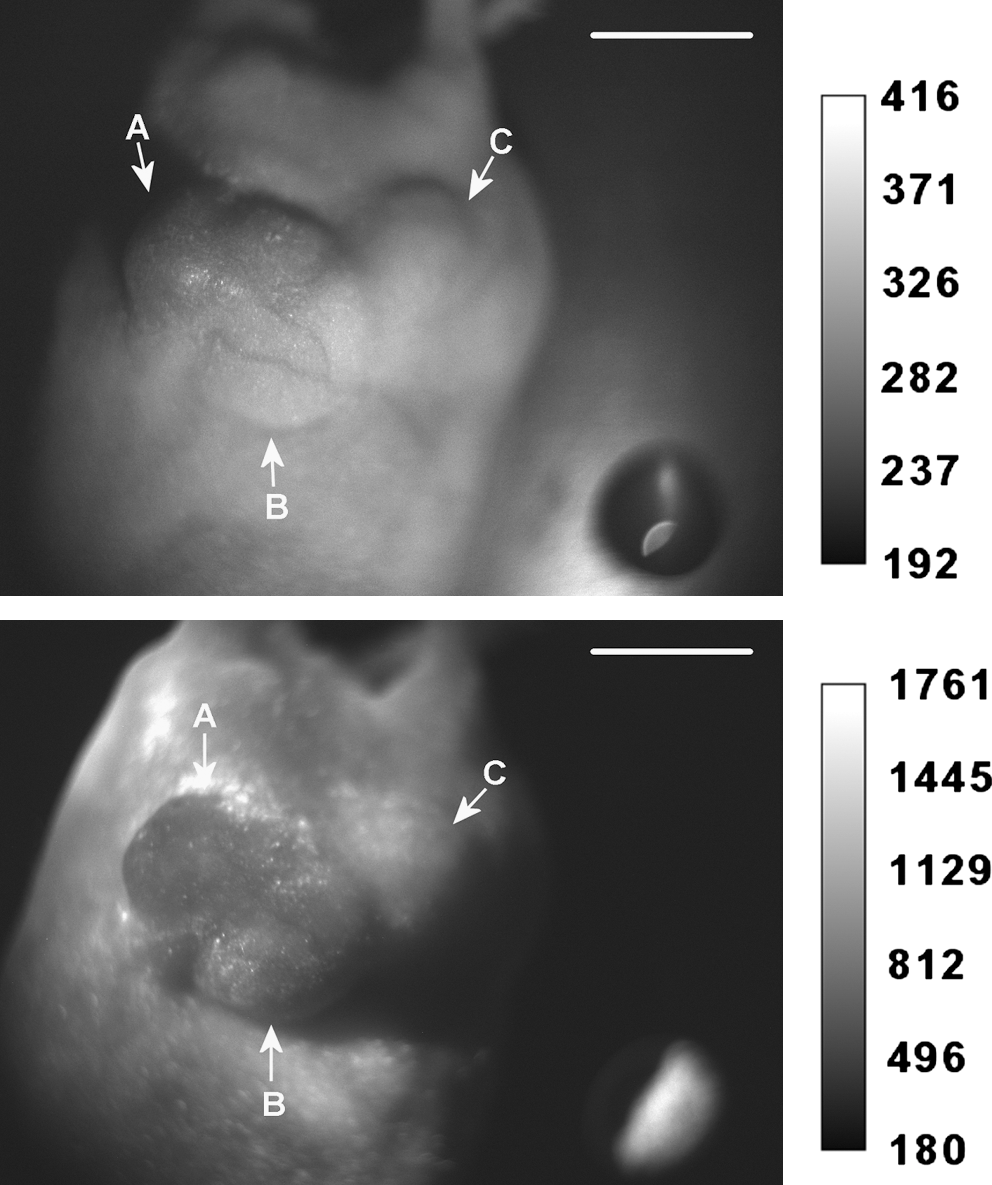
Red-light image (top) of the tumor area for mouse 4 showing the three tumor lobes labeled as A, B, and C. Fluorescence image (bottom) of the same tumor area. The horizontal white bar corresponds to the distance of 1 cm.
The histologic examination of a biopsy of this tumor region (shown in paraffin inclusion and a stained histologic section in Fig. 6a and b, respectively) supports this conclusion. The micrographies of the tumor tissue of lobe A (Fig. 6c) and lobe B show damaged (necrotic, hemorrhagic) cells, especially in the lobe central region, whereas the lobe C (Fig. 6d) shows scarce necrosis and hemorrhagic phenomena and one to mitoses per microscope field. The fraction of viable cells is ∼72%, 67%, and 95% for the lobes A, B, and C, respectively.
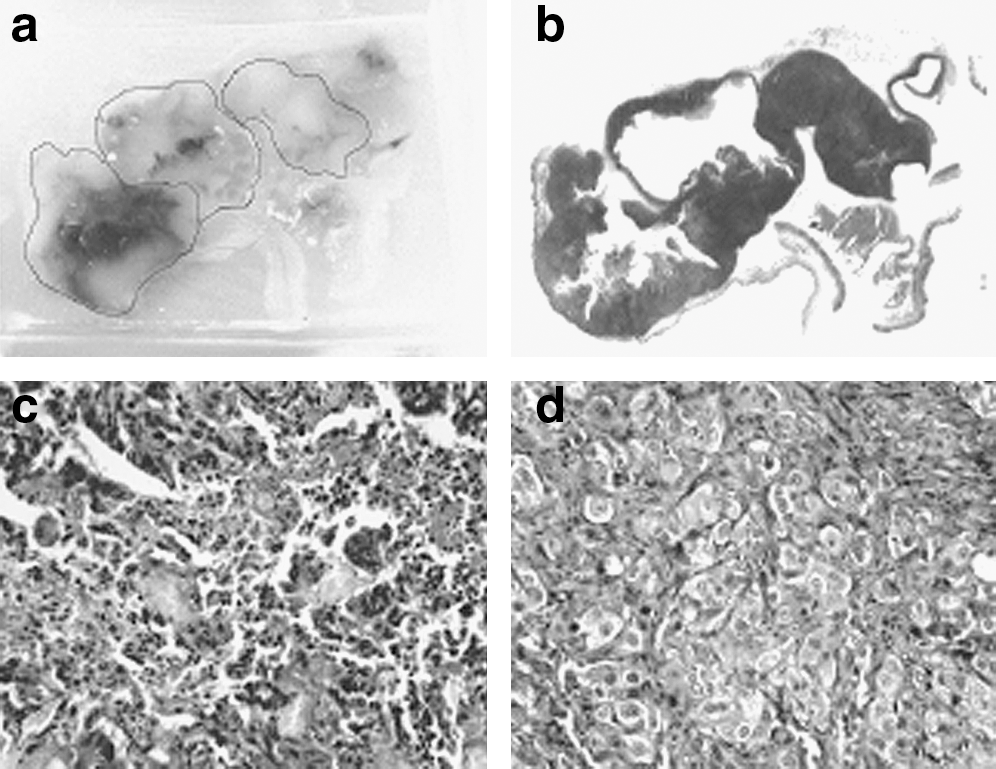
Macroscopic image of the tumor tissue of mouse 4: (
Discussion
In recent years, optical imaging systems have proved to be efficient tools for cancer diagnosis and for the study of the molecular mechanisms regulating the growth, dissemination, and the drug inhibition of the tumor masses. 21 –24 In particular, fluorescence reflectance imaging (FRI) is used mostly for the planar imaging with fluorescent reporter probes. 23 FRI is a relatively simple technique that needs an irradiation source, a collimation, optical filters both for the excitation and the fluorescence light, and a CCD camera for the capture of the fluorescence light. The fluorescent probe can be a fluorescent protein, like GFP, 25,26 a protease enzyme like cathepsin, 27 and a dye-labeled receptor-targeted probe. 28,29 The bioluminescence imaging (BI), where the insertion of luciferase gene in tumor cells causes light emission when exogenous luciferin is delivered to them 30 , has the intrinsic advantage, with respect to the fluorescent probes, that it needs no source of excitation so that any background signal is absent.
All the previously cited optical imaging techniques are specific, instrumentally simple, noninvasive, but limited in their performance by the strong scattering and absorption phenomena of light traveling into the biologic tissues. Because the penetration depth of light in tissues increases with the wavelength, and the tissue autofluorescence intensity decreases as well, the near-infrared probes are preferred for deep tumor/organs detection 22 . The penetration depth, however, does not exceed 7 mm for FRI, for all fluorescent probes. 31 Only the tomographic techniques (where the noise decreases with the signal by increasing the depth of the object to be imaged, so that the signal/noise ratio remains constant) offer the possibility of imaging internal structures embedded in tissues up to the depth of several centimeters. 32,33
In this context, the hematoporphyrin compound that we adopted as a fluorescent marker requires no labeling preparative procedures, has high resistance to photobleaching, 18 and preferential accumulation in tumor tissue with respect to the healthy tissue, as we reported in our previous imaging measurements, 18,19 and as it has been extensively reported in the literature. 34 –37 The tumor nonspecific HP uptake, rather than a limit of our fluorescent labelling, may be an advantage, because it allows the fluorescent labeling of different tumor types (ARO, NPA, 18 mammary). The features of the HP-mediated FRI technique we developed are related, besides the fluorescent marker we used, to the high sensitivity and to the submillimeter spatial resolution of the system. The high sensitivity of the system allows the imaging of the healthy tissues by the autofluorescence or background fluorescence, or both, due to the low accumulation of the exogenous HP. The detectability of the healthy tissues has the advantage of providing the localization of the hyperfluorescent region on the mouse body and, however, does not prevent the detection of the tumor areas by an increased fluorescent contrast of the tumor area with respect to the healthy tissue. For both cell lines, the tumor area appears definitely more fluorescent than the surrounding healthy tissues and than the tumor tissue itself before the HP administration (see Figs. 2 and 3). This result is in agreement with that obtained by Chang et al. 16 although the fluorescent drug and its modality of administration are quite different from ours. On the contrary, although they are able to correlate the severity of a lesion to its fluorescence intensity, the present feasibility study performed on a few cases does not allow one to state any correlation of this type.
Conversely, the relatively low fluorescence ratio of tumor to healthy tissue due to the autofluorescence and/or fluorescence background remains one of the most relevant limits to the detection sensitivity of the fluorescence systems.
It should be noticed that in our previous works, 18,19 the volumes of the studied tumors were about 50–400 mm3, so that the tumor masses were visible with the naked eye and were palpable. Instead, it is crucial in the tumor diagnostics to be able to detect the tumor formation: the earlier the diagnosis, the greater the patient-survival probability, especially if the tumor is highly invasive, as is the ARO tumor. In this work, the sensitivity and spatial-resolution performances of the system allow the detection of an early-stage tumor, as the ARO tumor in Fig. 3, implanted just 8 days before the fluorescence measurements. We can estimate that, starting from 106 injected cells, we observed a tumor with a number of ARO tumor cells of the order of tens of millions, corresponding to a volume of a few cubic millimeters. The presence of a real tumor in the region where the fluorescence was detected was confirmed by the successive evolution of the tumor region and by postmortem histologic analysis.
In addition, our HP-FRI system allows us to recognize, as a tumor, tissues that visually appear as healthy ones. The area labeled “e” in Fig. 3 is apparently a healthy area in the red-light image; nevertheless, this area appears fluorescent in the fluorescence image and presents an enhancement of optical contrast with respect to the surrounding region. The histologic analysis confirms that this fluorescent tissue is tumor tissue in a later stage of evolution, because fluorescence imaging measurements were performed 30 days after the tumor cell inoculation.
If the sensitivity and spatial-resolution performances are combined with the magnification provided by the use of the stereomicroscope, some rough “structural features” can be visualized as tumor lobes (Fig. 4).
In Fig. 5a, visually recognized tumor area does not fluoresce. The histologic analysis shows that the nonfluorescent tumor area contains a large amount of necrotic/hemorrhagic cells (Fig. 6). We might suppose that the tumor necrosis state prevents the accumulation of the dichlorohydrate HP.
Besides the fluorescence coming from the tumors, we also detected a single large fluorescence area located in the stomach regions of the mice (Fig. 2b, Fig. 3b). Because this fluorescence emission appears as well in the absence of a previous HP administration (Fig. 2b), we might speculate that it could be due to the presence in the mouse food of the natural derivatives of chlorophyll-a, whose fluorescence spectrum is similar to that of HP. 37,38 Although it is generally preferable to adopt, for the mice submitted to fluorescence measurements, a chlorophyll-free diet to avoid the detection of “spurious” fluorescence signals, in our work, the fluorescence of organs does not affect the detection of the tumor areas, because the stomach and tumor regions are spatially well separated.
We note that the internal organs, as well as tumor masses, are located immediately under the skin and can be imaged by optical fluorescence because the radiation in the wavelength range from 630 to 690 nm has a penetration depth in tissues less than 1 cm. 23,24 However, the resolution of the structures appearing in the fluorescence images of both tumors and organs is strongly affected by the high value of the scattering coefficient of the mouse skin (Fig. 1), according to the spatial resolution we calculated earlier.
Conclusions
By using an HP-FRI system based on a highly sensitive, low noise, cooled CCD camera, we could detect in vivo the red fluorescence signal from the whole body and from the accumulation of a fluorescent HP compound in tumor masses.
The system has a number of interesting features: (a) the instrumental apparatus is very simple; (b) the fluorescent labeling procedure and the imaging measurements are noninvasive, easy, and quick; (c) tumors of different types can be detected; (d) large-scale tumor detection is obtained, together with its localization in the mouse body, (e) early-stage or visually unrecognized tumors can be detected; and (f ) the optical magnification allows small-scale tumor imaging, providing the correspondence between the HP accumulation and the histologic structure. However, the results in item (e) require a confirmation on the basis of a large body of statistics. The advantages of this technique are counterbalanced by some drawbacks: (a) the applicability limited to surface tumors, (b) the low fluorescence contrast between tumor and healthy regions, and (c) the low spatial resolution due to the light scattering in tissues. In spite of this, we think that this system is suitable for cancer diagnosis and for the study of the growth, dissemination, and the drug inhibition of the tumor masses in mice. In particular, we think that it is very suitable for its instrumental and operational ease to provide the optical part of a multimodal imaging system (optical and/or x-ray and/or γ-ray system).
We are investigating some improvements for our optical in vivo imaging system. We are testing as an excitation light source a 150-W halogen lamp with fiberoptic illuminator. This illumination system is more compact and cheaper with respect to the picosecond laser source. The optical contrast of the tumor/healthy region could be improved by a digital subtraction procedure. 39 We are also investigating a different porphyrin compound with an excitation/emission band shifted in NIR window.
Footnotes
Acknowledgments
We thank Dr. William T. McClintock (Centro Linguistico di Ateneo, Università degli Studi di Napoli “Federico II”) for his collaboration in the revision of the English version of this article.
Author Disclosure Statement
No competing financial interests exist.