




Abstract
Introduction
The effects of LLLT on dental pulp cells have not been extensively investigated. In vitro studies showed that LLLT activated mitogen-activated protein kinase (MAPK), an enzyme that regulates cell proliferation, differentiation, and survival, 10 and stimulated mineralization by increasing the formation of calcified nodules; alkaline phosphatase (ALP) activity; and expression of mRNAs for heat shock protein 27, bone morphogenetic proteins (BMPs), and ALP. 11 Meanwhile, ALP activity decreased in the laser-treated MDPC-23 cells. 18 The few studies performed in vivo observed that irradiation induced tertiary dentin formation by influencing the secretory activity of odontoblasts; 19 increasing expression of proteins such as fibronectin; 20 and collagens type I, III, and V; 21 and improving organization of collagen fibrils. 22,23 Moreover, irradiated pulp presented less intense inflammatory reactions. 20 Therefore, the use of LLLT to stimulate dental pulp affects the expression of several matrix components representing a complex network composed by proteins that influence cell migration, proliferation, shape, and function. 24
Studies involving LLLT are controversial and present a wide range of parameters. Moreover, information on odontoblastic cells' response to irradiation in in vitro models is meager. Therefore, the purpose of this study was to evaluate the functional activity of a spontaneously immortalized cell line (MDPC-23) 25 after the application of two different irradiation times of a near-infrared low-level laser.
Methods
Cell culture
MDPC-23 cells were cultivated in Dulbecco's Modified Eagle's medium (DMEM, Gibco BRL, Grand Island, NY), supplemented with 10% fetal bovine serum (Gibco), 5 μg/mL ascorbic acid (Gibco), 7 mM β-glycerophosphate (Sigma
Laser irradiation
Infrared laser irradiation was performed using a gallium aluminum arsenide (GaAlAs) diode laser (Bio Wave LLLT Dual, Kondortech, São Carlos, SP, Brazil) emitting a wavelength light of 830 nm in continuous mode.
Laser was applied with the aid of a support device, which held the emission tip in contact to the cover of the culture plates. The beam was positioned perpendicularly, at 3 cm from the cell monolayer, transposing the culture medium. Irradiation was performed at the center of each culture well, without moving the laser tip. Each experimental group was cultured in different plates, and the cell cultures were distributed in five wells at an adequate distance from each other to avoid undesirable irradiation adjacently. For immunolocalization assay, cells were cultured on glass cover slips of 1.5 mm thickness (Fisher Scientific, Pittsburgh, PA).
All the groups were exposed to the same conditions such as temperature, humidity, and light. The wells were covered by a black mask during the experiment, exposing only the area to be irradiated. Group 1 was the control, with no laser application, whereas groups 2 and 3 received irradiation with the following parameters set at the equipment display: 20 mW power, 10 sec (group 2) and 50 sec (group 3). However, the evaluation of the real power delivered by the laser device was assessed by a powermeter (FieldMaster, Coherent, Santa Clara, CA), which detected 29 mW, 45% more than the power registered at the display. The acrylic wall of the plate cover and the culture medium determined a power loss of ∼12%. The beam diameter at a 3 cm distance was of 0.3 cm2, calculated by the knife-edge method. 26 These data allowed calculation of the real parameters delivered to the cell monolayer (Table 1). The irradiation protocol started simultaneously with the first day of culture. 6 After the four irradiation sessions, the cells were not irradiated.
According to Skinner et al, 1996. 6
Cell number and viability
Cells were cultured during 3, 7, and 10 days and detached from wells using 1 mM EDTA and 0.25% trypsin solution (Gibco). Total number of cells/well and percentage of viable cells were determined after trypan blue (Sigma-Aldrich) staining using a hemocytometer.
Total protein content and ALP activity
Total protein content was determined at days 3, 7, and 10 using a modification of the Lowry method. 27 Briefly, proteins were extracted with 0.1% sodium lauryl sulphate (Sigma) for 30 min and mixed 1:1 with Lowry solution (Sigma) for 20 min at room temperature (RT). The extract was diluted in Folin and Ciocalteau's phenol reagent (Sigma) for 30 min at RT. Absorbance was measured at 680 nm using a spectrophotometer (Cecil CE3021, Cambridge, UK). Total protein content was calculated from a standard curve and expressed as μg/mL per total cell number.
Alkaline phosphatase activity was assayed in the same lysates used for determining protein content, as the release of thymolphthalein from thymolphthalein monophosphate by using a commercial kit (Labtest Diagnóstica, Lagoa Santa, MG, Brazil). Briefly, 50 μL of thymolphthalein monophosphate were mixed with 0.5 mL of 0.3 M diethanolamine buffer, pH 10.1, and left for 2 min at 37°C. The solution was added to 50 μL of the lysates obtained from each well for 10 min at 37°C. For color development, 2 mL of 0.09 M Na2CO3 and 0.25 M NaOH were added. After 30 min, absorbance was measured using a spectrophotometer (CE 3021) at 590 nm and ALP activity was calculated from a standard curve using thymolphthalein to give a range from 0.012 to 0.4 μmol thymolphthalein/h/mL. Data were expressed as ALP activity normalized for total cell number.
Calcified nodules detection and quantification
Cultures were stained with alizarin red for detection of mineralized nodules at day 14. 28 Calcium quantification in the calcified nodules was detected through adaptation of the method described by Gregory et al. 29
Fluorescence labeling
At day 7, cells were fixed for 10 min at RT with 4% paraformaldehyde in 0.1 M phosphate buffer (PB), pH 7.2. After washing in PB, they were processed for indirect immunofluorescence labeling for detection of collagen. In addition, cell morphology was evaluated by direct fluorescence with fluorophore-conjugated probes. Briefly, cells were permeabilized with 0.5% Triton X-100 in PB for 10 min, followed by blocking with 5% skimmed milk in PB for 30 min. Primary antibody to COL1A1 (polyclonal LF-100, 1:1000, Larry Fisher, National Institutes of Health, MD) was used, followed by a mixture of Alexa Fluor 594 (red fluorescence) conjugated goat anti-mouse secondary antibody (1:200; Molecular Probes, Eugene, OR) and Alexa Fluor 488 (green fluorescence) conjugated phalloidin (1:200, Molecular Probes), which labels the actin cytoskeleton. Replacement of the primary antibodies with PB was used as control. All antibody incubations were performed in a humidified environment for 60 min at RT. Between each incubation step, samples were washed three times in PB. Before mounting for microscope observation, cell nuclei were stained with 300 nM 4′,6-diamidino-2-phenylindole, dihydrochloride (DAPI, Molecular Probes, Eugene, OR) for 5 min and samples were briefly washed with dH2O. Glass cover slips were placed face down on glass slides and mounted with a Fisherbrand 12-mm-round glass cover slip (Fisher Scientific) using an antifade mounting medium (Vectashield, Vector Laboratories, Burlingame, CA). Samples were examined under epifluorescence using a Leica DMLB light microscope, with N Plan (x10/0.25, x20/0.40) and HCX PL Fluotar (x40/0.75) objectives, outfitted with a Leica DC 300F digital camera (Leica, Bensheim, Germany). The digital images were processed with Adobe Photoshop software (Version 7.0, Adobe Systems, San Jose, CA).
Vascular endothelial growth factor (VEGF)164 expression quantification (Enzyme-linked immunosorbent assay [ELISA])
VEGF Quantikine Murine Kit (R&D Systems, Inc. Minneapolis, MN) was used to quantify VEGF164 expression in the culture supernatant. Cells were cultivated for 7 and 10 days and centrifugated for 5 min at 13,000g at 4°C. The medium was collected and put into wells of 96-well plates, previously covered with a monoclonal antibody for VEGF, and incubated for 2 h. Cells supernatants were assessed for presence and quantity of VEGF by means of ELISA.
RNA extraction and quantitative realtime reverse transcriptase-polymerase chain reaction (RT-PCR)
Quantitative expression of dentin matrix acidic phosphoprotein 1 (DMP1) gene was evaluated through RT-PCR. Gene-specific primers were designed with Primer Express 2.0 (Mm 01208365_m, Applied Biosystems, Foster City, CA). The total RNA from cells was extracted using Promega RNA extraction kit (Promega, Madison, WI). The concentration of RNA was determined by optical density at 260 nm wavelength, using the Biomate 3 spectrophotometer (Thermospectronic, Rochester, NY). Complementary DNA (cDNA) was synthesized using 2 μg of RNA through a reverse transcription reaction (M-MLV reverse transcriptase, Promega). RT-PCR was performed in an ABI Prism 7000 Sequence Detection System using the SybrGreen system (Applied Biosystems, Warrington, UK). SybrGreen PCR MasterMix (Applied Biosystems), specific primers and 2.5 ng cDNA were used in each reaction. The standard PCR conditions were 50°C (2 min), 95°C (10 min) and 40 cycles of 95°C (15 s), 60°C (1 min), followed by the standard denaturation curve. To mRNA analysis, the relative level of gene expression was calculated in reference to GAPDH expression and normalized by the gene expression of control culture (calibrator) using the cycle threshold (Ct) method.
Statistical analysis
Measurements were expressed as mean±SD of the representative data from three independent experiments (n=5). Data were compared by Kruskal–Wallis test (α=0.05).
Results
Growth curve and cell viability
After 3 days, all groups showed a similar proliferation rate, with no significant differences (p>0.05). There were more cells proliferated at day 7 and a decrease at day 10. Proliferation in group 2 was smaller than in the other groups (p<0.01) at 7 and 10 days, whereas group 3 showed a decrease in proliferation rate at 10 days compared with control (p<0.01) (Fig. 1). Cell viability was >90% for all the groups, with no significant differences (Fig. 2).
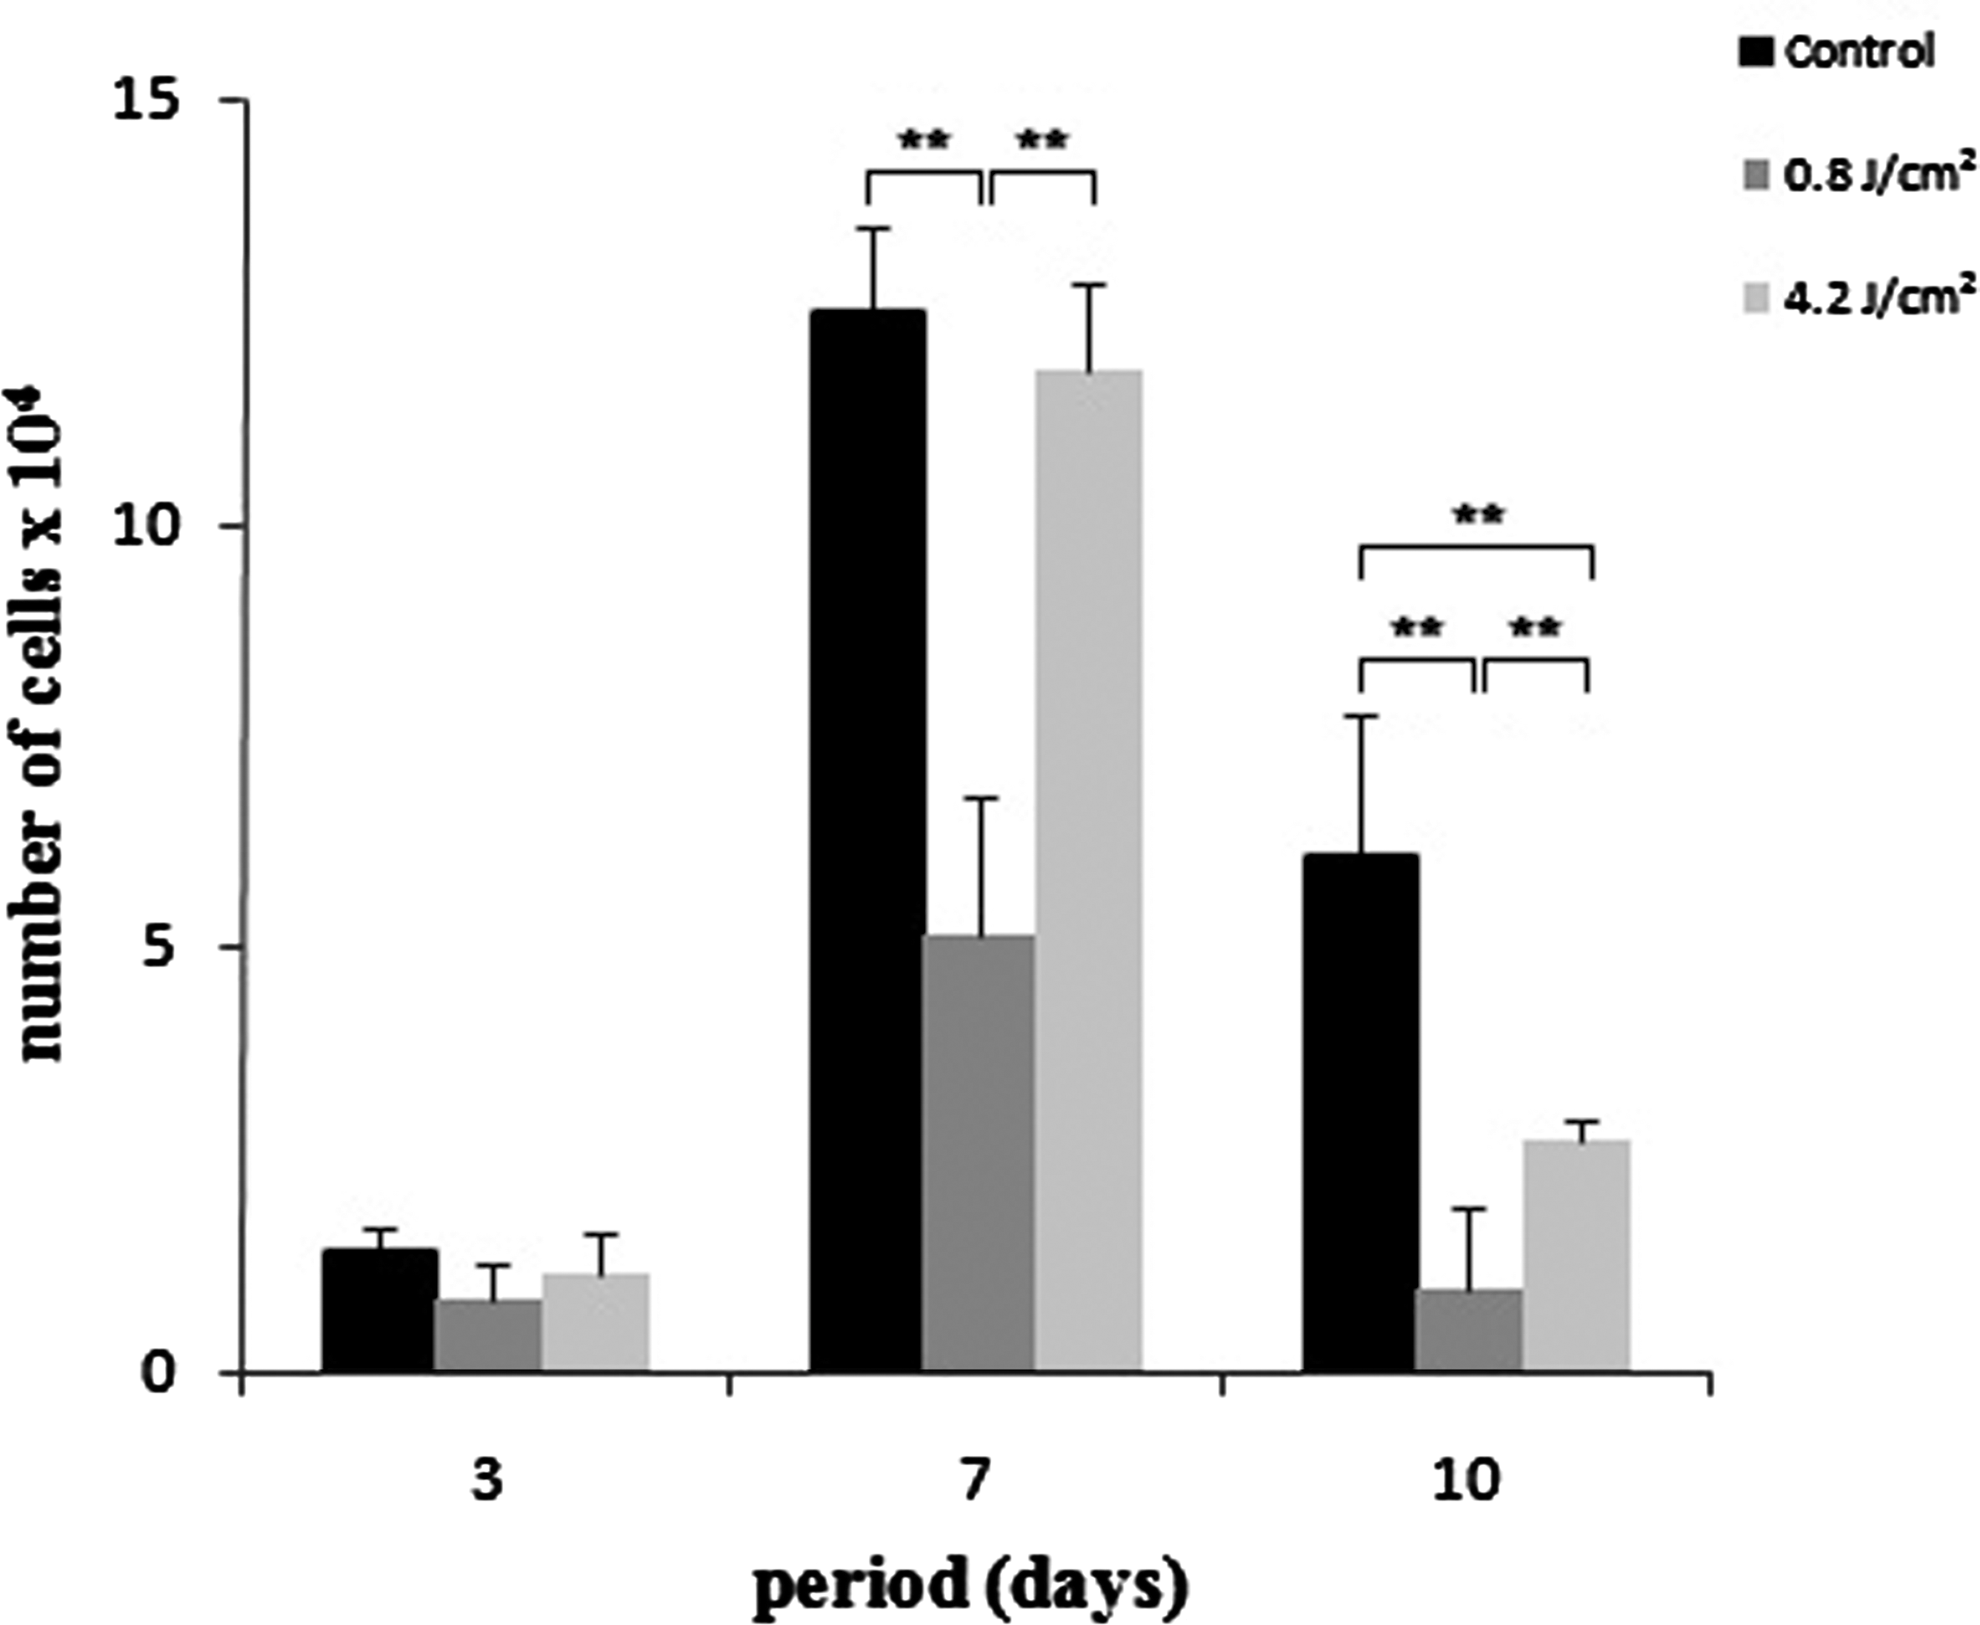
Cell proliferation expressed as number of cells×104/well at 3, 7, and 10 days of culture. Data are reported as mean±SD (n=5). Kruskal–Wallis test (**p<0.01).
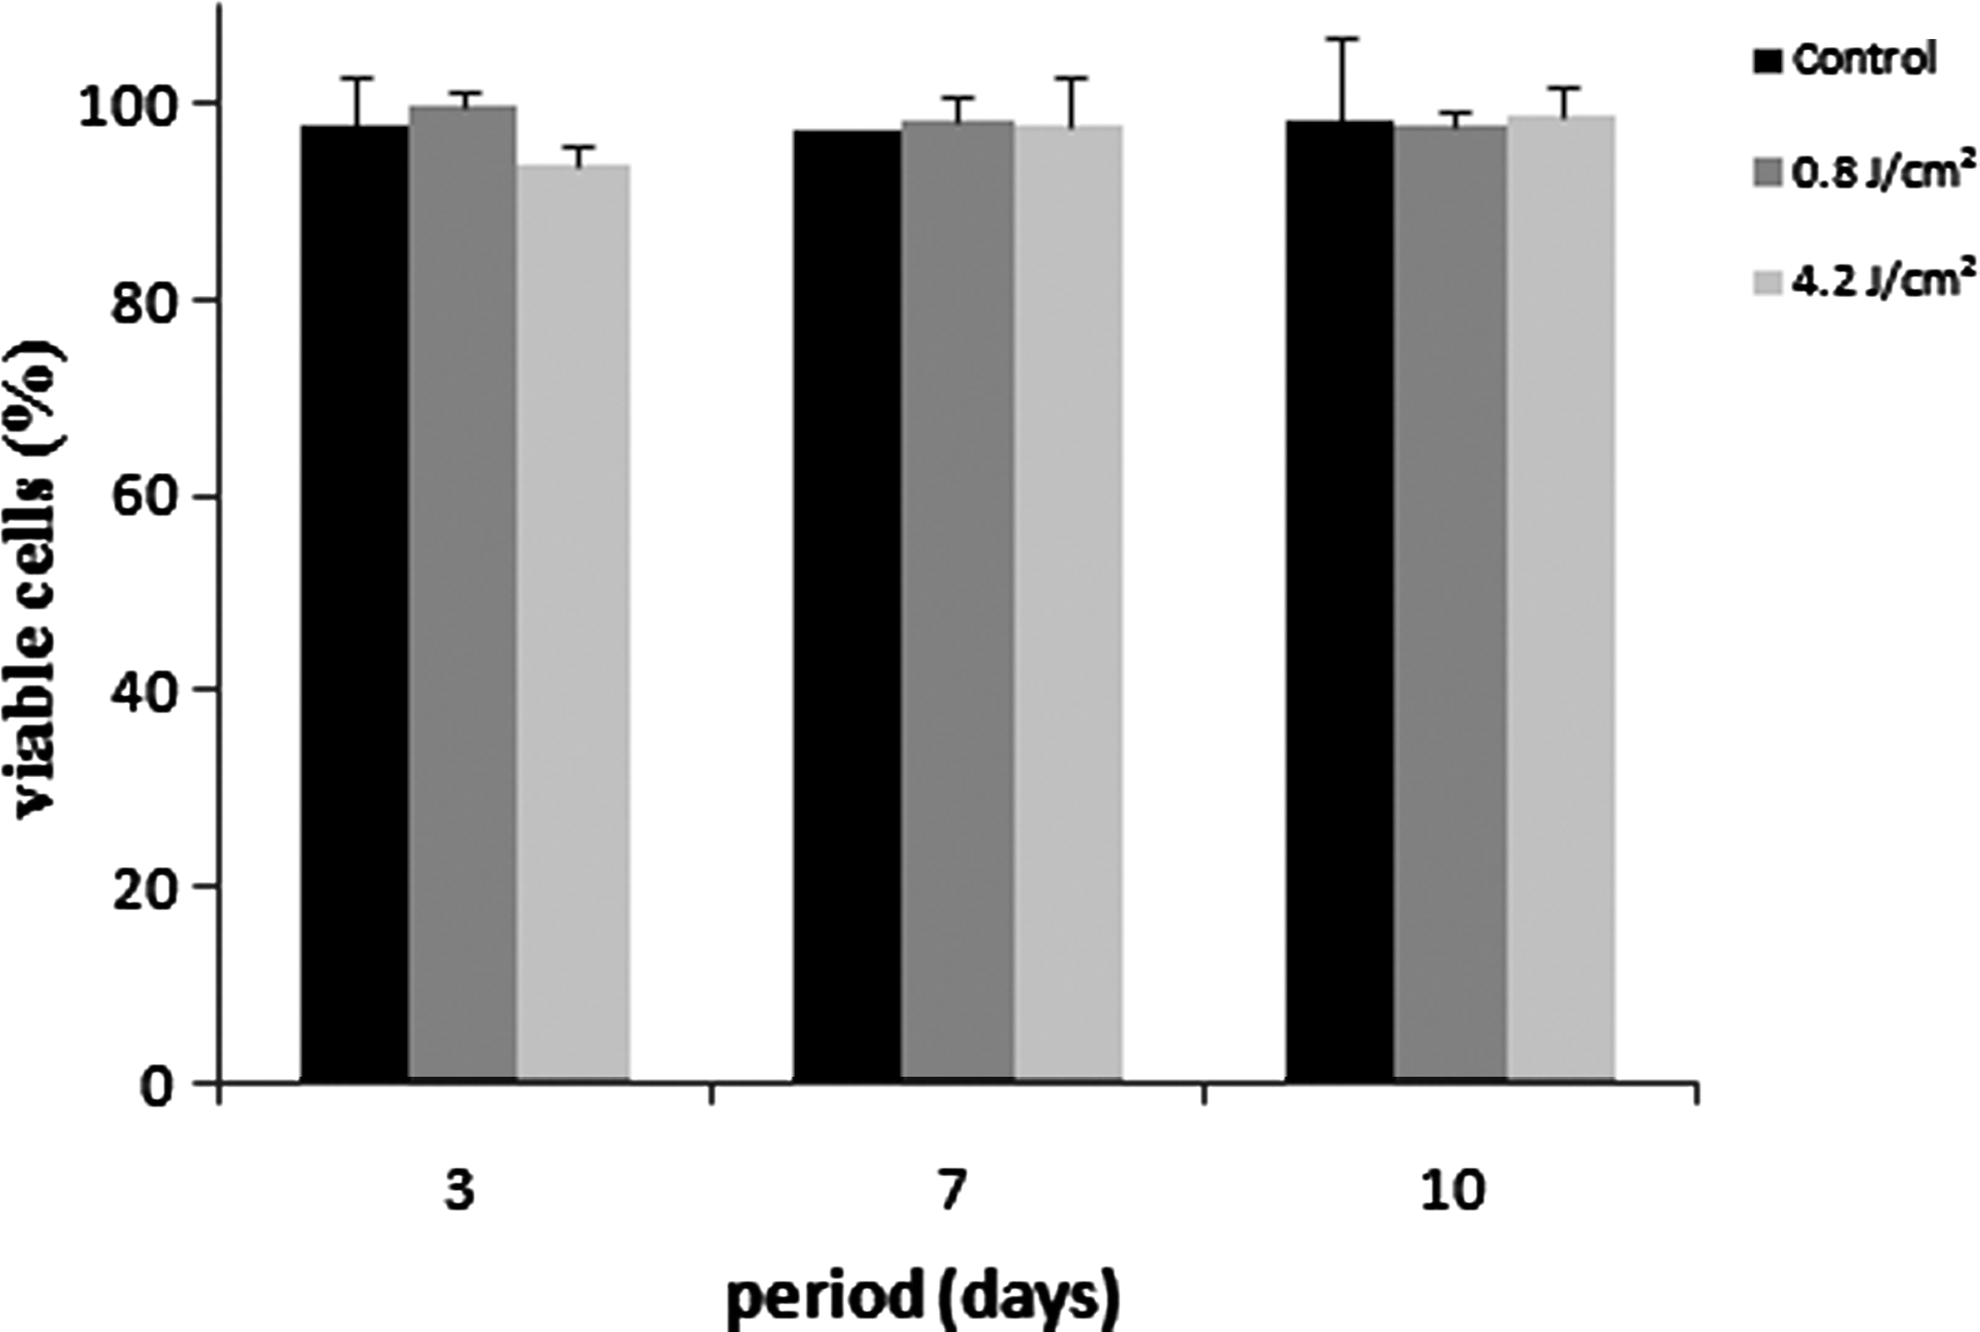
Cell viability expressed as percentage of viable cells at 3, 7, and 10 days of culture. Data are reported as mean±SD (n=5). Kruskal–Wallis test showed no significant differences.
Total protein content and ALP activity
Total protein content was similar for all groups after 3 days, showing a decrease after 7 days, without significant differences. However, it was significantly higher in group 2 at day 10 (p<0.01), whereas group 3 showed a higher amount of protein than control at the 10th day (p<0.01). The amount of ALP was decreased in group 3 at 3 and 7 days (p<0.05). At day 10, all groups presented statistical difference among them, being the highest amount of ALP observed in group 2 and the lowest in control (p<0.01) (Figs. 3 and 4).
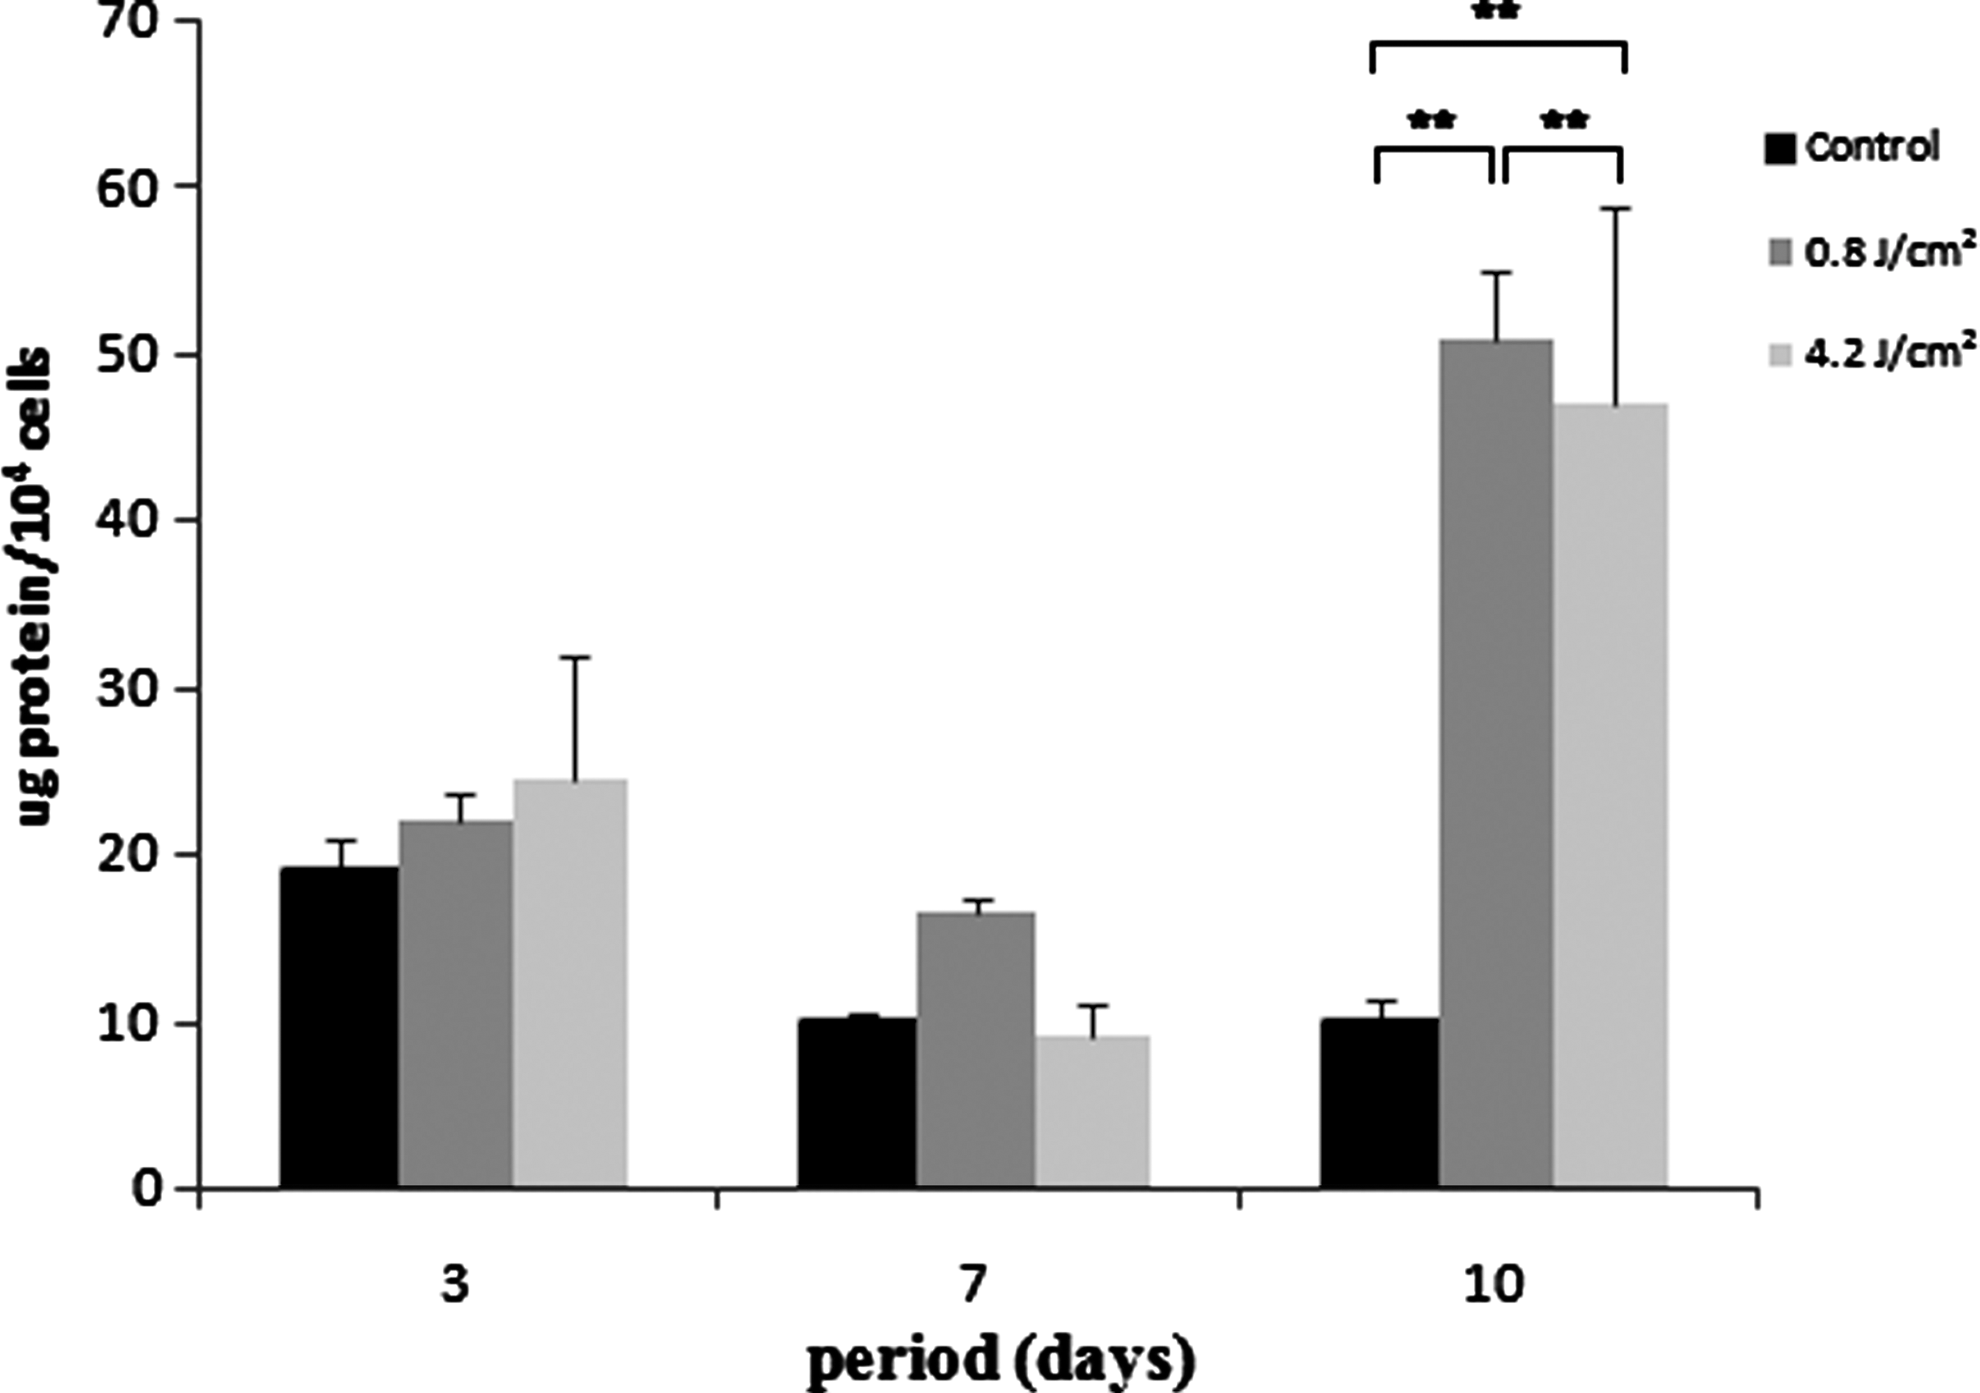
Total protein content expressed as μg of protein per number of cells at 3, 7, and 10 days of culture. Data are reported as mean±SD (n=5). Kruskal–Wallis test (**p<0.01).
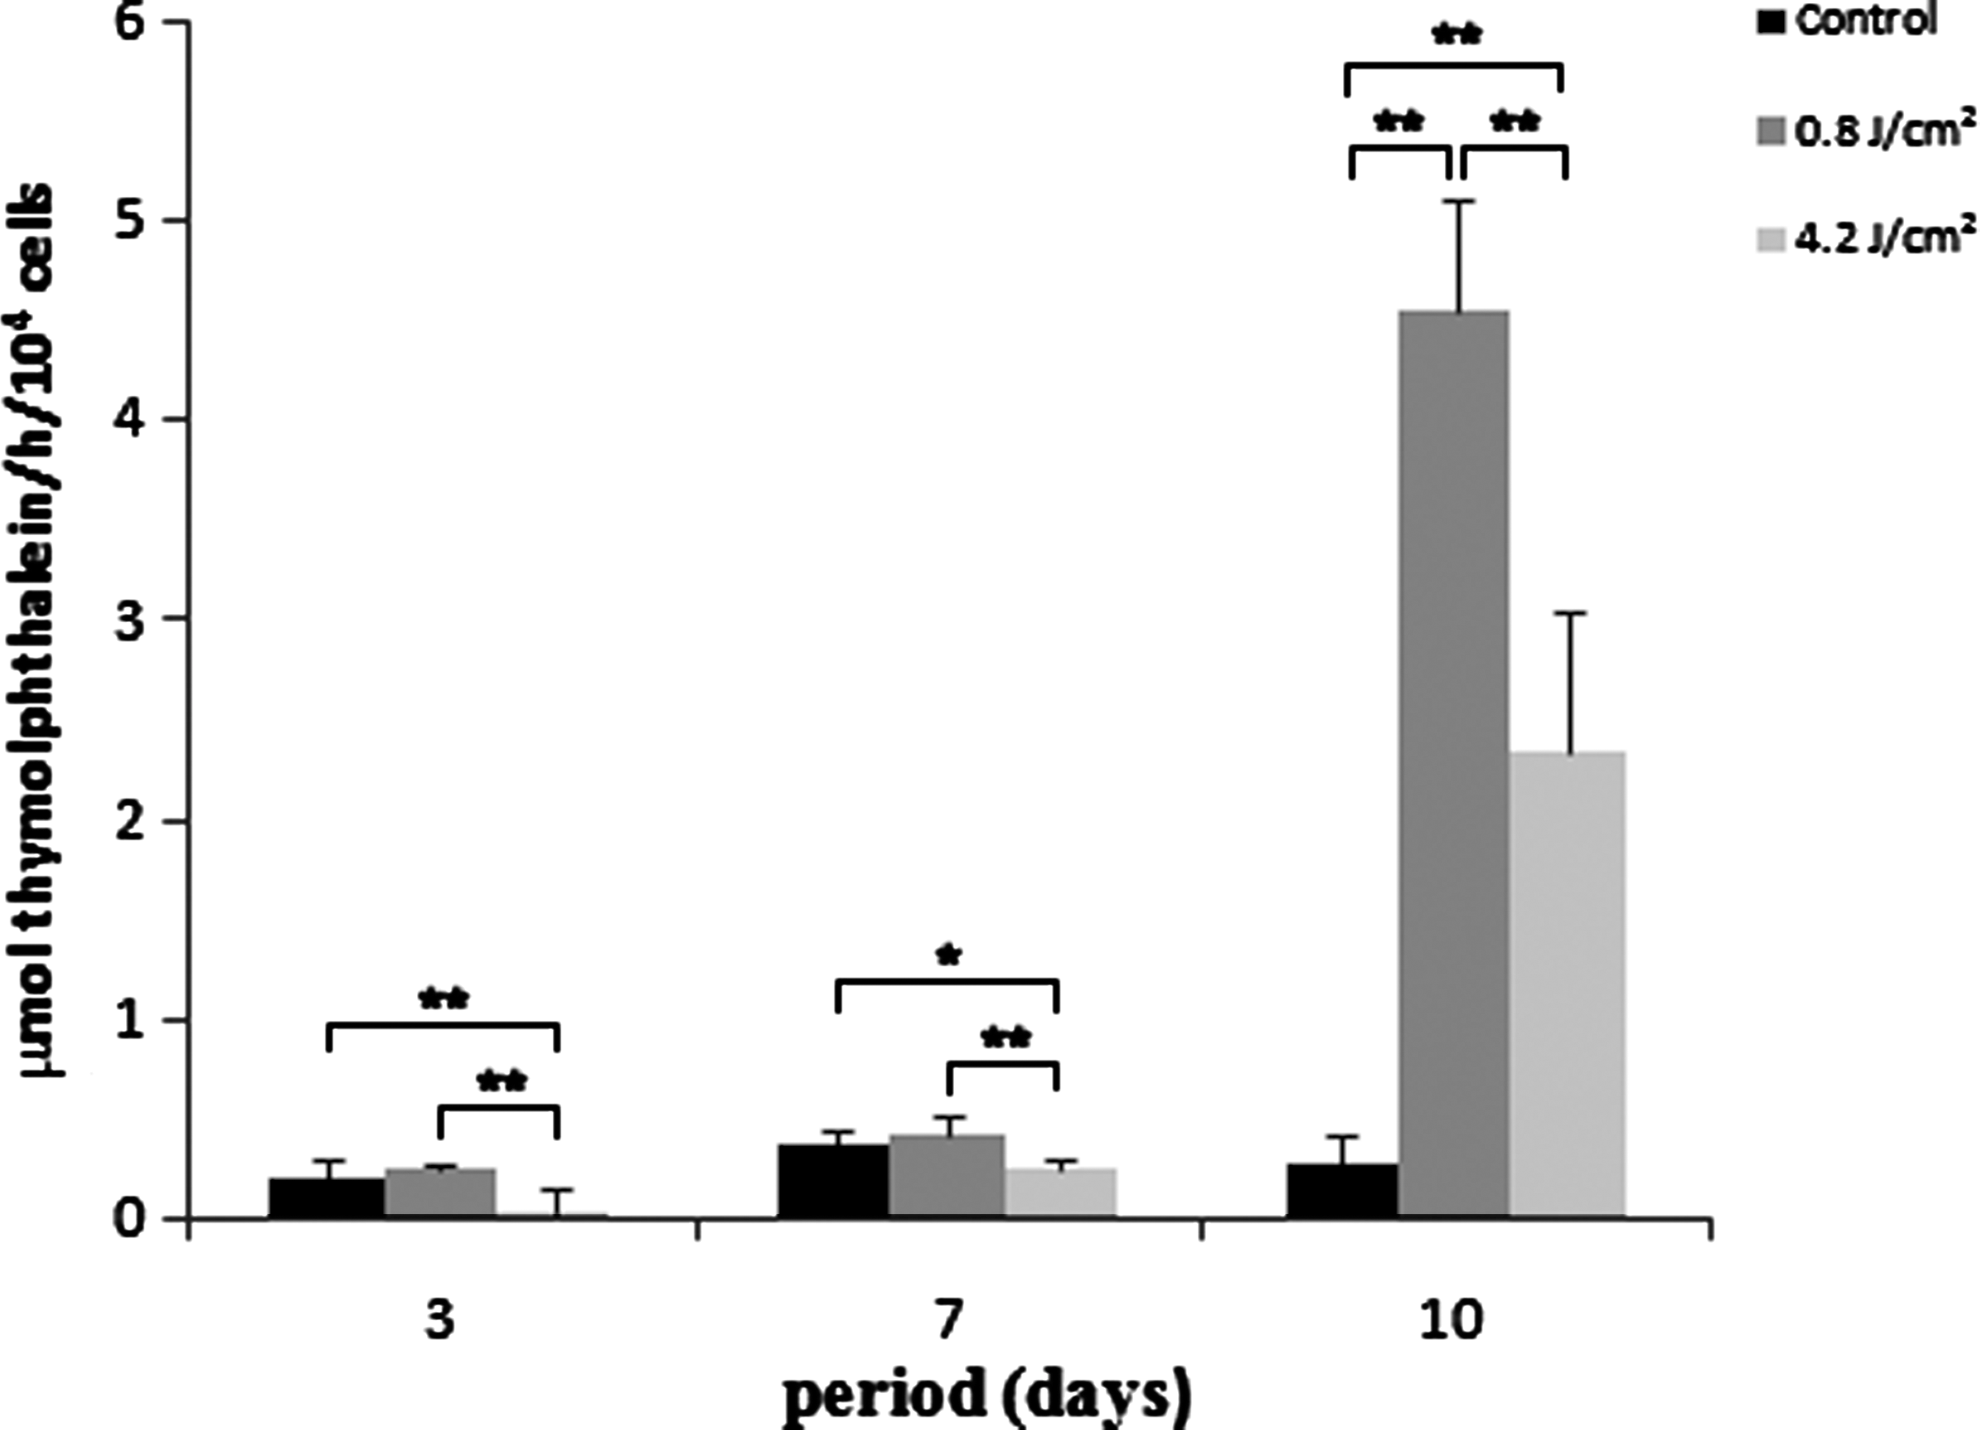
Alkaline phosphatase (ALP) activity expressed as μmol thymolphthalein/h per number of cells at 3, 7, and 10 days of culture. Data are reported as mean±SD (n=5). Kruskal–Wallis test (*p<0.05; **p<0.01).
Calcified nodules detection and quantification
All cultures exhibited mineralized nodules at day 14, especially increased in group 2 (Fig. 5). The quantification of the alizarin red showed that group 2 presented more calcium deposit (p<0.05), followed by group 3 and control (Fig. 6).
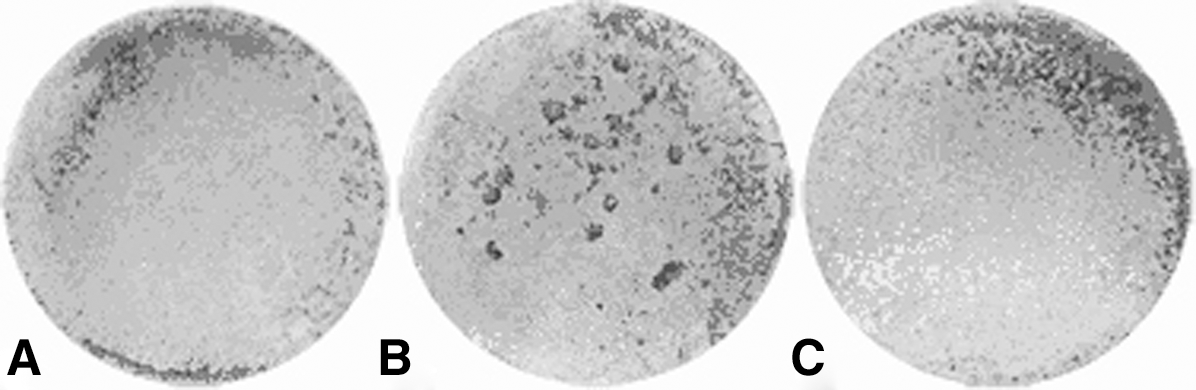
Dentin-like nodule formation in mouse odontoblastic cultured cells divided in
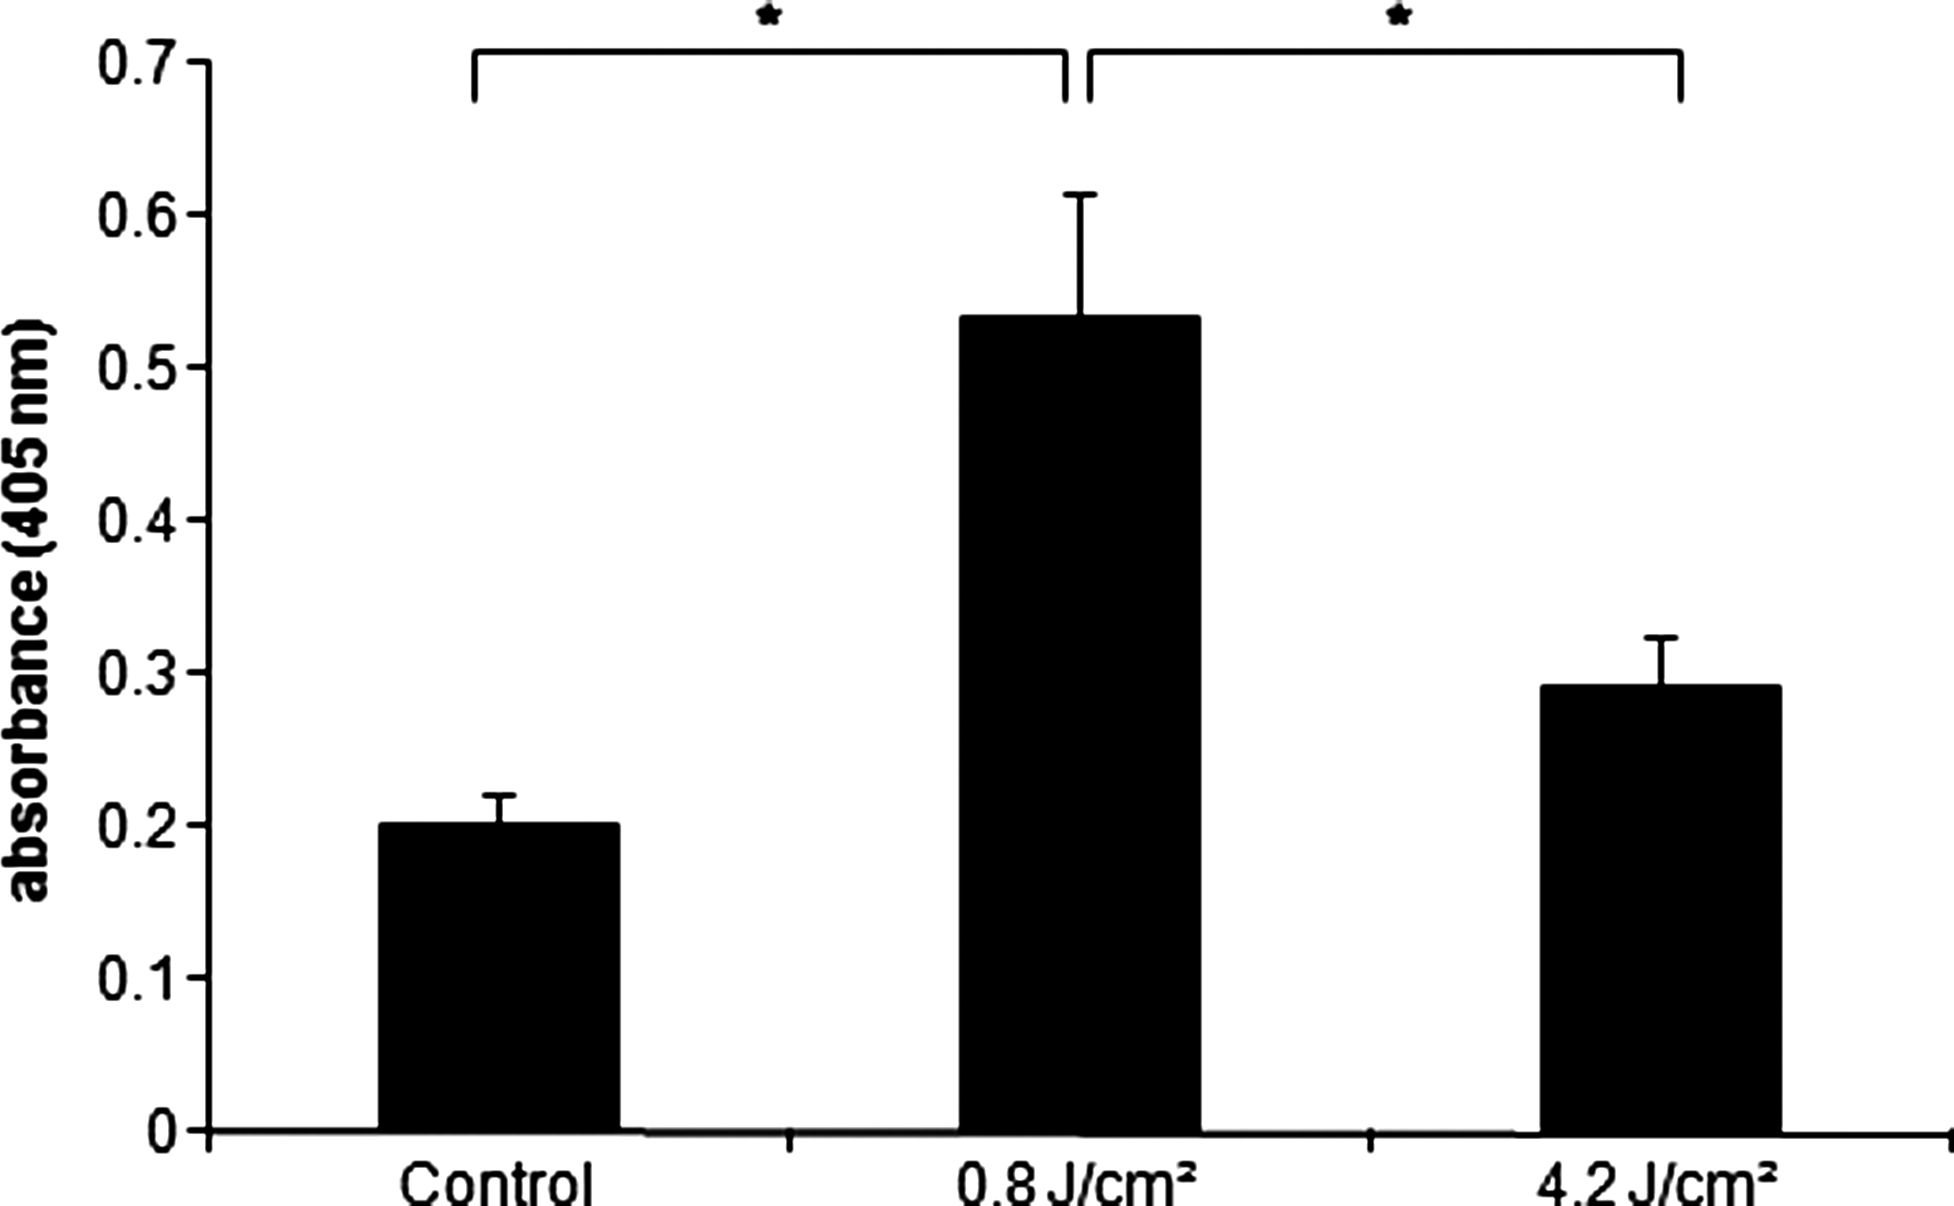
Calcium quantification through alizarin red staining after 14 days of culture. Data are reported as mean±SD (n=5). Kruskal–Wallis test (*p<0.05).
Fluorescence labeling
After 7 days, phalloidin staining revealed no differences in cell morphology and tissue architecture during the progression of culture for any group. In general, cells showed polyhedral outlines and groups were randomly distributed throughout the surface of the cover slips. Group 2 exhibited a higher expression of COL1A1 (red staining) from the nuclear area to the edge of cells, when compared with nonirradiated cells and group 3 (Fig. 7).

Fluorescence labeling preparations of protein expression in mouse odontoblastic cell cultures grown on glass cover slips divided into
VEGF164 expression quantification (ELISA)
After data normalization with total cell number, a higher concentration of VEGF was observed in group 2 (0.8 J/cm2) at 7 and 10 days (p<0.01) (Fig. 8).
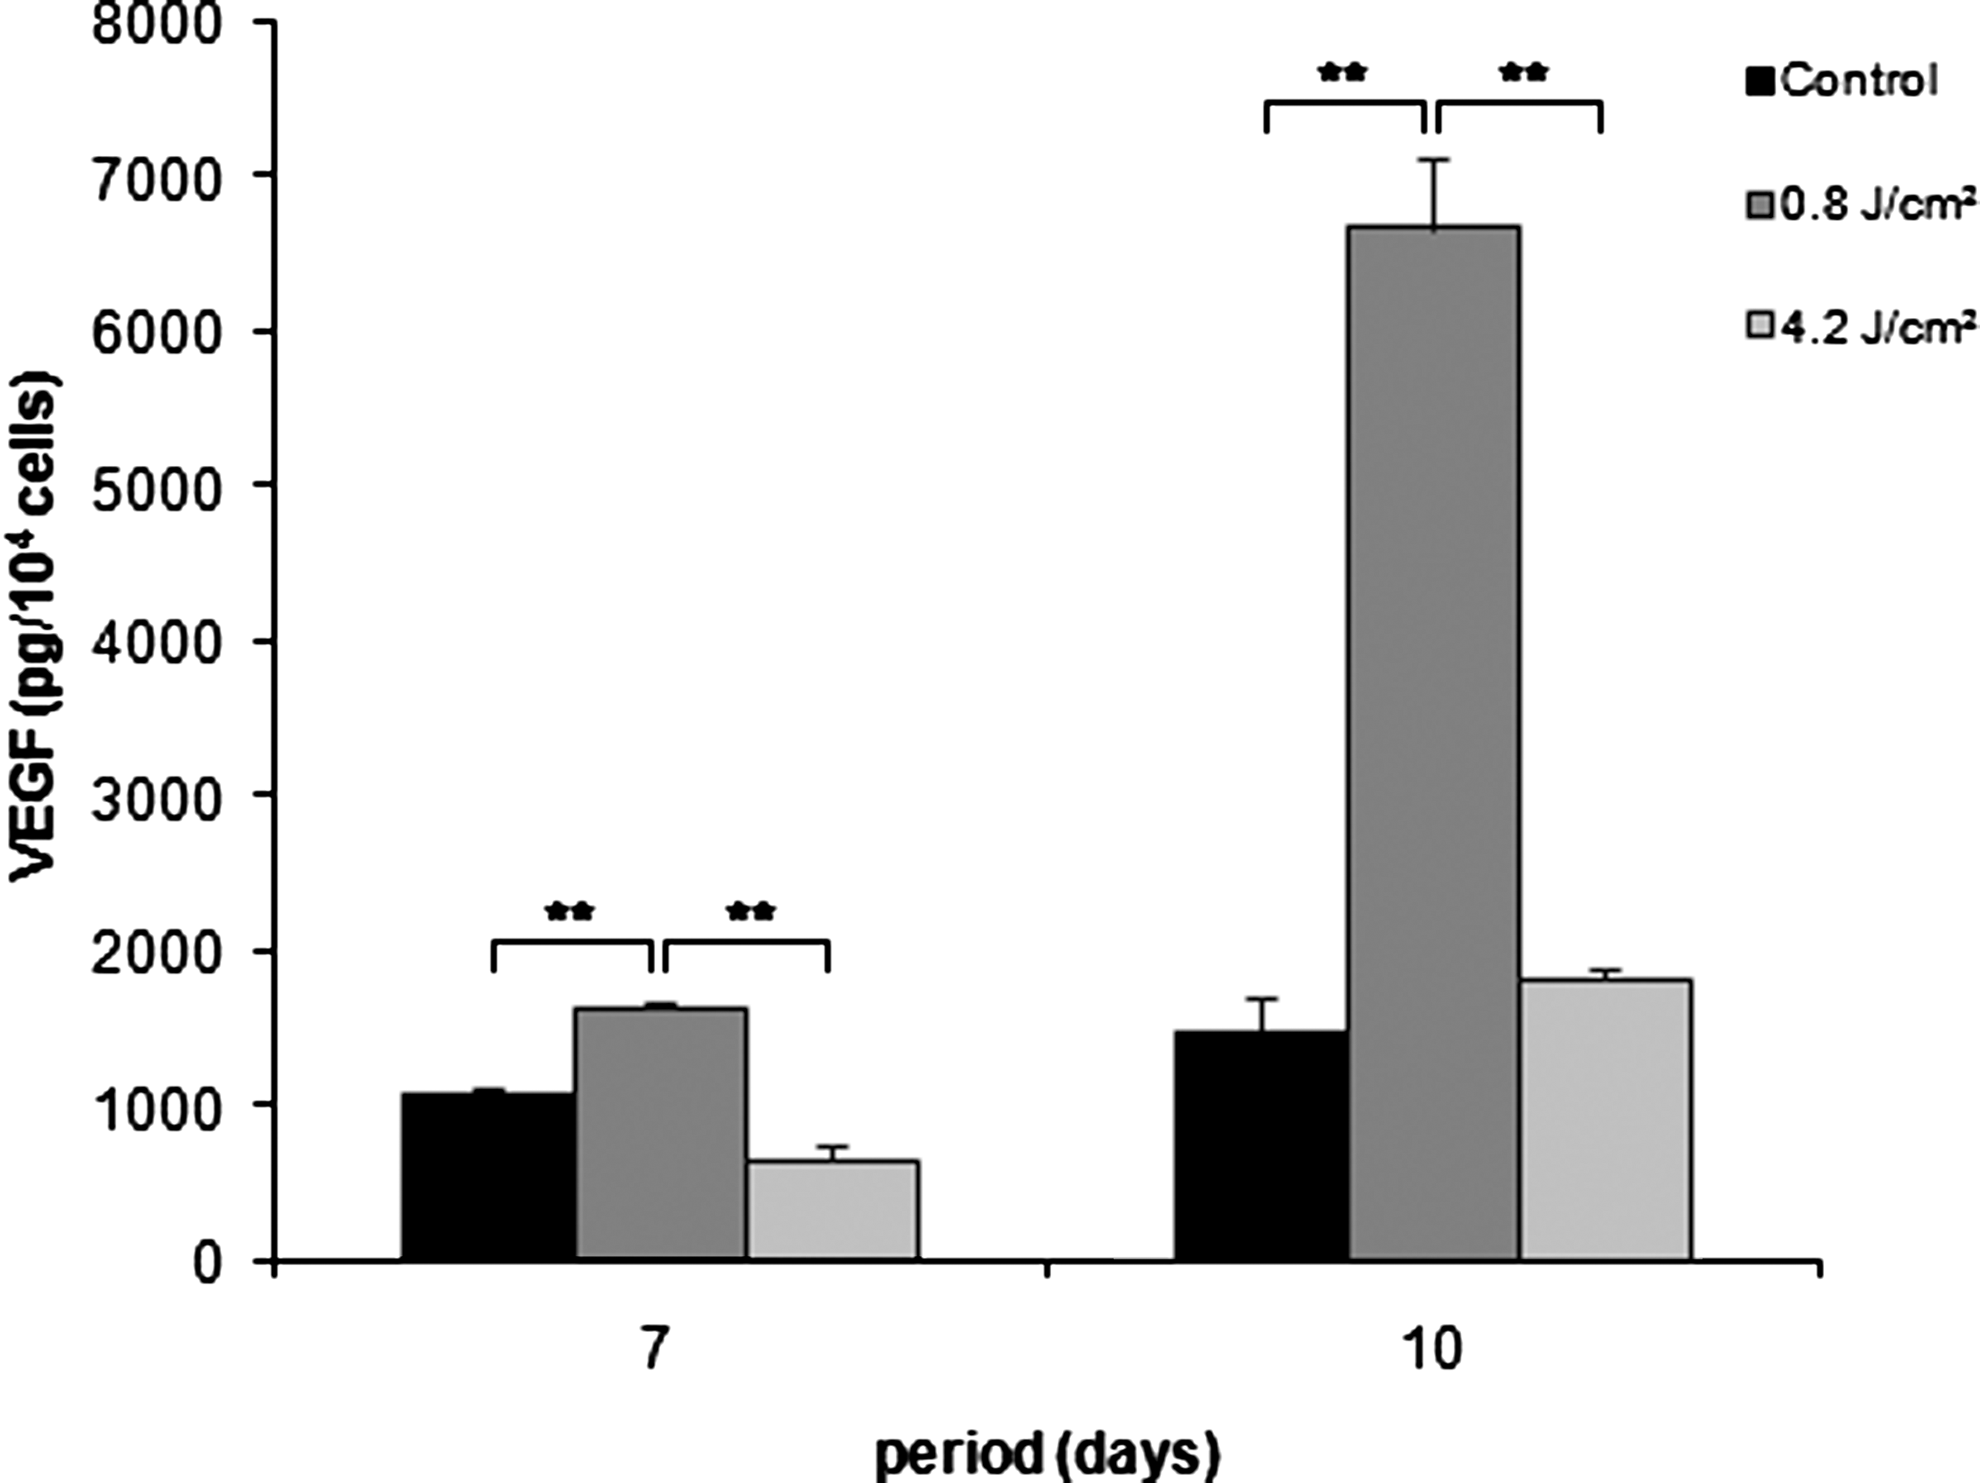
Vascular endothelial growth factor (VEGF) expressed as pg per number of cells in non-irradiated (black bar, control) and irradiated with 0.8 J/cm2 (dark gray bar) and 4.2 J/cm2 (light gray bar) MDPC-23 cells after 7 and 10 days of culture. Kruskal–Wallis test (**p<0.01).
RT-PCR
DMP1 gene was amplified, and data were analyzed referring all values to the control obtained after 3 days. Figure 9 shows a significant expression of DMP1 in group 3 (p<0.05) after 3 days of treatment and no difference when compared with group 2 (p=0.149). After 7 days, all groups showed a higher expression of DMP1 (p<0.05; control >0.8 J/cm2>4.2 J/cm2) when compared with control after 3 days of treatment. Group 1 after 10 days showed no significant difference (p=0.171) compared with control after 3 days. Group 2 maintained a higher expression when compared with group 1 after 3 days and group 3 after 10 days (p<0.05). The analysis of each period individually shows that DMP1 had its expression increased in group 3 when compared with the control and group 2 after 3 days (p<0.05). At day 7, it was observed that the control group presented the highest expression of DMP1 when compared with irradiated groups (p<0.01). The comparison between the laser groups demonstrated an augmentation of the gene expression in group 2 (p<0.05). At the 10th day, DMP1 expression was higher in the irradiated groups when compared with the control (p<0.01), with group 2 being the one expressing the highest level (p<0.05).
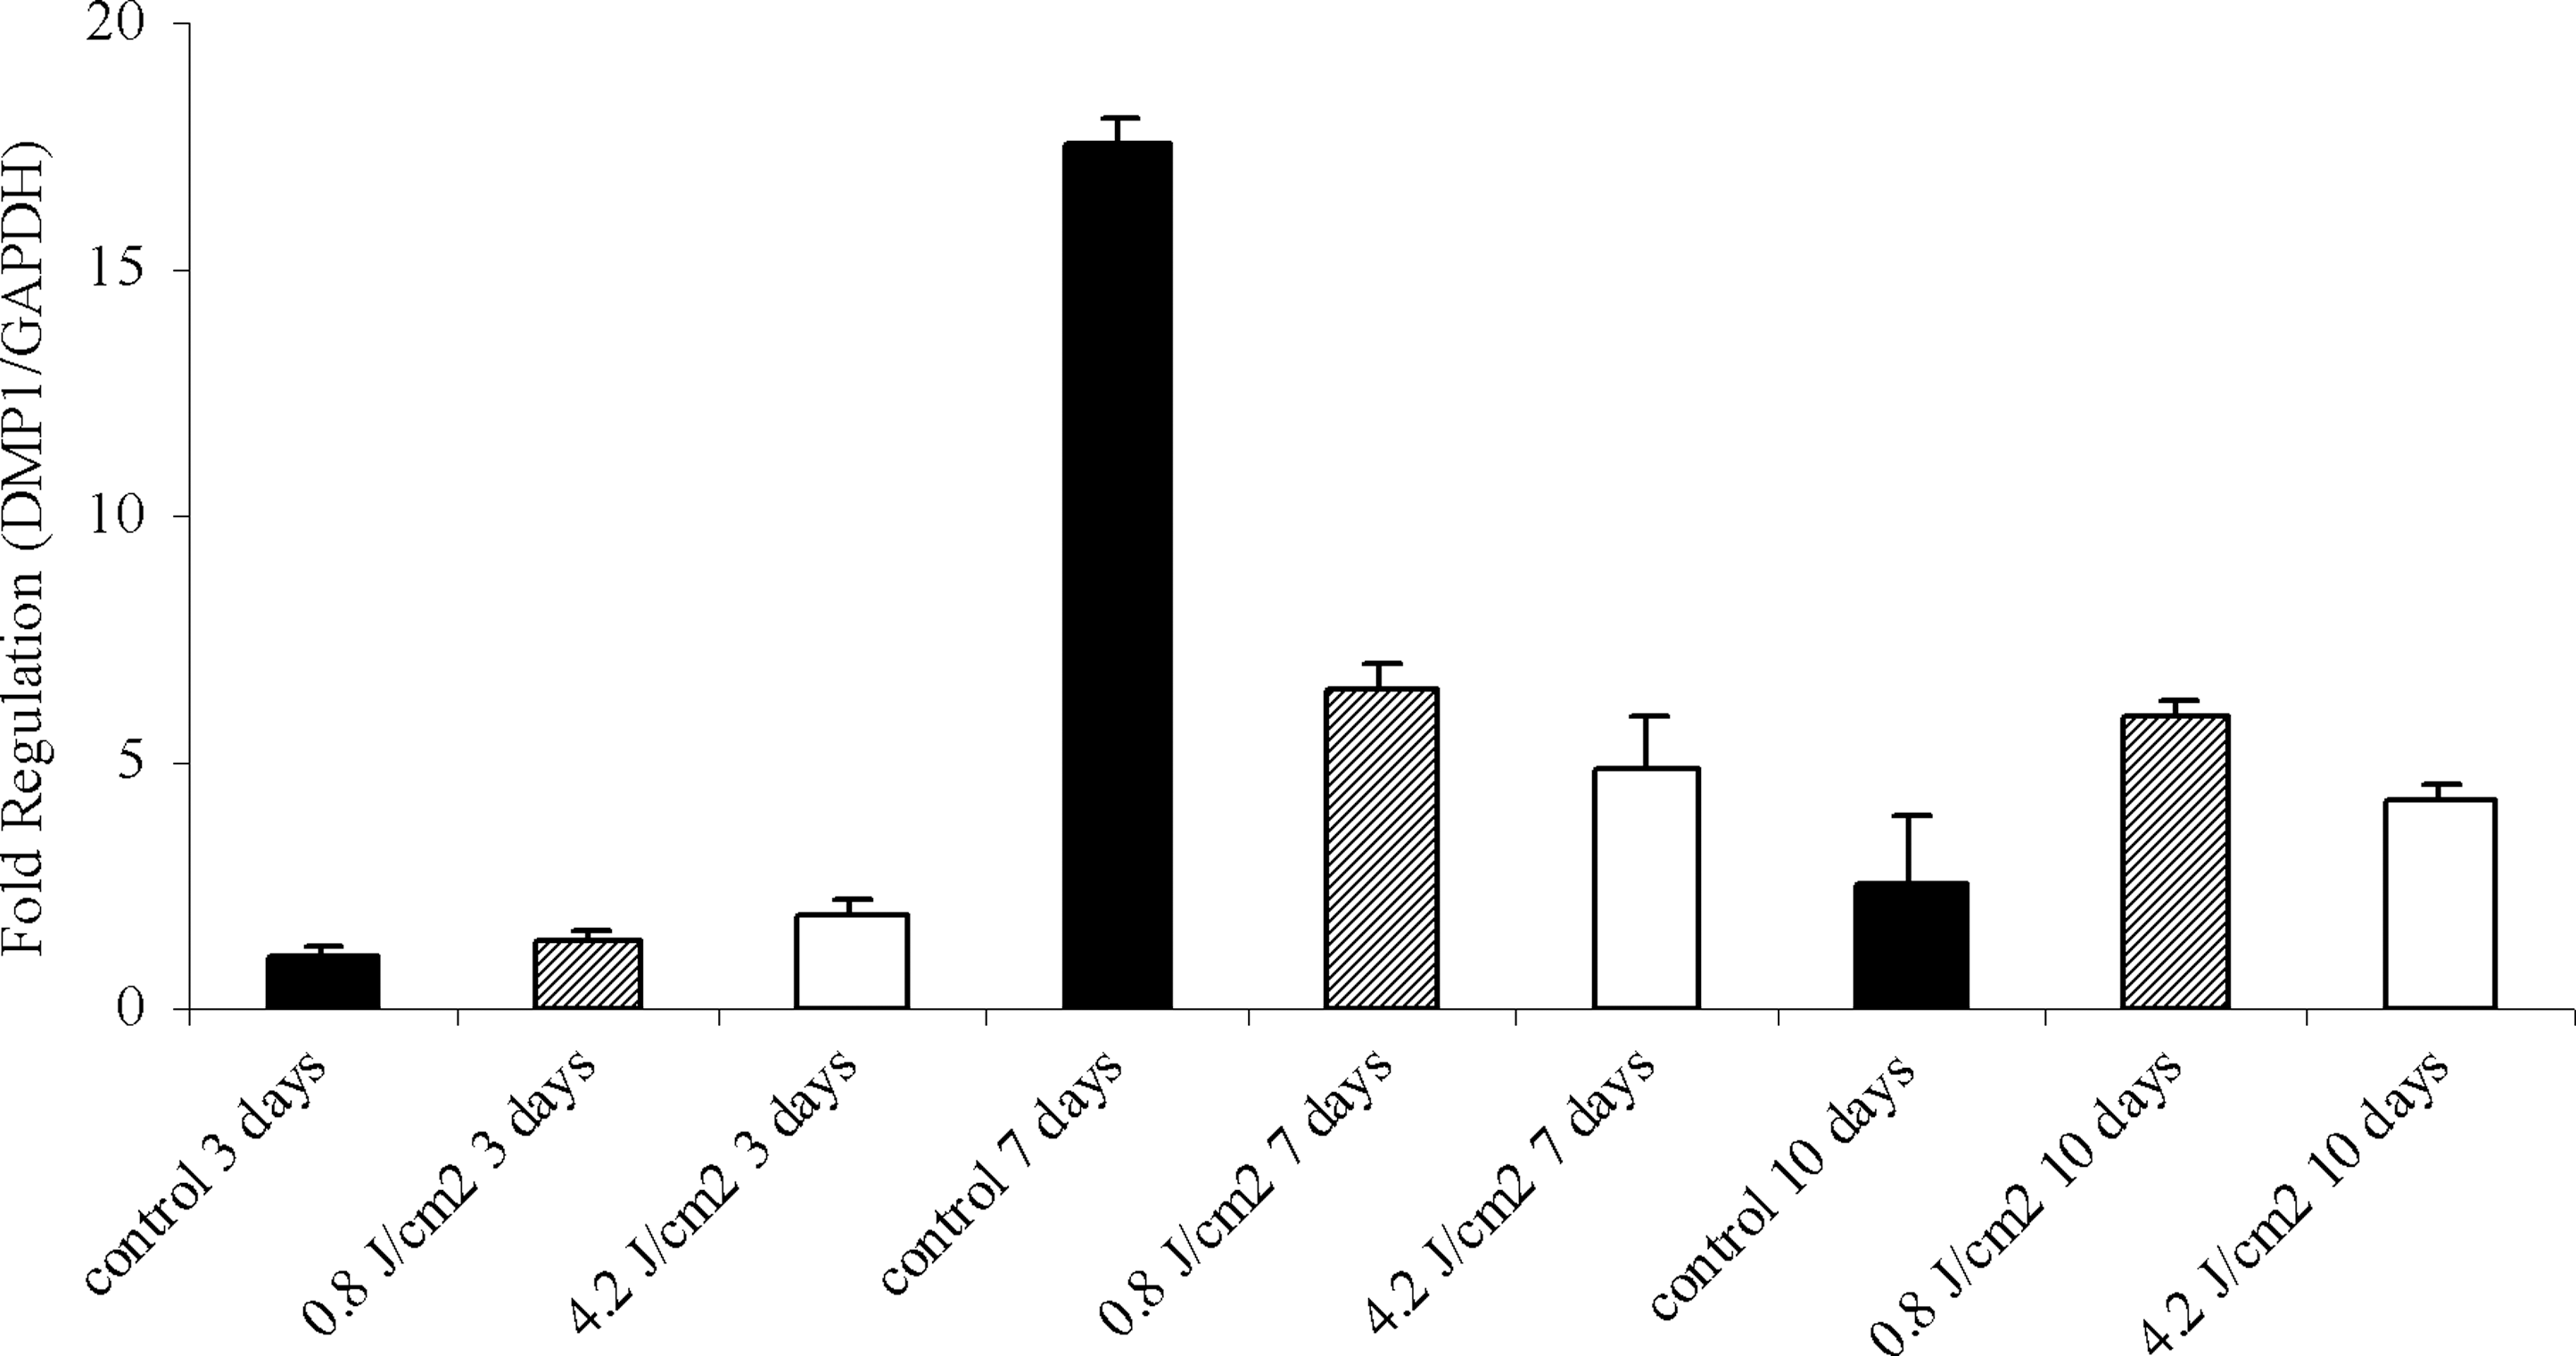
Dentin matrix acidic phosphoprotein 1 (DMP1) gene expression through real-time polymerase chain reaction (RTPCR) in nonirradiated, and irradiated with 0.8 J/cm2 (striped bar) and 4.2 J/cm2 (white bar) MDPC-23 cells after 3, 7, and 10 days of culture. Data were analyzed referring all values to the control (black bar) obtained after 3 days of treatment. Mann–Whitney test (*p<0.05; **p<0.01).
Discussion
This study evaluated the effect of two different irradiation times of a 830 nm, 85 mW/cm2 laser on a mouse odontoblast-like cell line (MDPC-23), showing that variations in the amount of time/energy affected cell response differently. The energy densities used were chosen after a pilot study, showing that the smallest energy density induced a higher cell activity, corroborating other reports. 30 –32
There was a decrease in cell proliferation rate when the lowest energy density was applied, whereas some articles reported an increase in the proliferation rate of irradiated cells. 33 However, it depends upon the type of laser, the parameters used, and the cells studied. A low proliferation rate might be correlated to a beginning of cell differentiation, supported by other investigations, 34,35 suggesting that differentiation is preceded by cell growth reduction. Thus, a reciprocal relationship between decreasing cell proliferation without affecting cell viability and subsequent induction of functional activity might have occurred. We observed ALP increase after irradiation with the smallest dose, as well as reduction in cell number, even though the viability was not affected. Matsui et al. 11 showed an increase in ALP activity in human pulp cells irradiated with a wavelength of 810 nm, 15.2 mW/cm2 for 500 sec (7.6J/cm2). Alkaline phosphatase, which stimulates mineralization by supplying phosphate or by splitting away inorganic pyrophosphate, is regarded as a marker of odontoblast differentiation and dentine biomineralization. 36 A correlation was observed between high levels of ALP and an increase in mineralized nodules in the group irradiated with 0.8 J/cm2.
A possible photobiological response to irradiation might be an increase in protein release, as observed in group 2, through biochemical and immunolocalization assay. Proteins such as collagen not only enhance the matrix structure with their viscoelastic properties, but also enable organized mineral deposit. 37 Godoy et al. 22 observed that irradiated odontoblasts presented processes in close contact with the extracellular matrix, whereas collagen fibrils appeared more aggregated and organized than those of the control group. Meanwhile, other reports showed that LLLT may increase the production of proteins such as collagen type III. 20 Our results suggest that 830 nm, 85 mW/cm2 for 10 sec (0.8 J/cm2) stimulated the synthesis of COL1A1. Nevertheless, collagen is not enough to trigger the process of ion deposition, non-collagen proteins being considered as important precursors of mineralization. 38
It was observed that DMP1 was expressed by MDPC-23 cells, corroborating the study by Pang et al. 39 Narayanan et al. 40 indicated that DMP1 is a key regulator of odontoblast differentiation and dentin mineralization. Our results demonstrated that there was an increase in DMP1 expression in all groups and all periods compared with the control at the beginning of the experiment. Besides, it can be seen that the lowest energy density employed upregulated DMP1 gene after 7 days when compared with group 3, suggesting a possible biphasic dose response. This theory suggests that if insufficient energy is applied, there will be no response (because the minimum threshold has not been met); if more energy is applied, the threshold is crossed and biostimulation is achieved; but when excessive energy is applied, then the stimulation disappears and is replaced by bioinhibition. 41 The benefits of LLLT could be seen especially in the late period of culture, when DMP1 expression was superior to the untreated group.
The evaluation of LLLT on VEGF expression suggests that laser irradiation may be an inductor of VEGF secretion, because the MDPC-23 cells expressed the highest level of VEGF164 when irradiated with 0.8 J/cm2. The VEGF expression has been associated with tooth development 42 and angiogenesis within the dentine–pulp complex, necessary for pulp repair and reparative dentine formation. 43
Conclusions
This study demonstrated that LLLT influenced odontoblast-like cells and that variation in the energy density can interfere in cell response, with the shorter time/smallest energy density promoting inductions in the expression of odontoblastic phenotype in a more significant way.
Footnotes
Acknowledgments
We thank Sao Paulo Research Foundation (FAPESP) for financial support (Process n° 2006/06313-7) and Professor Jacques Eduardo Nör and colleagues (School of Dentistry, The University of Michigan) for granting the MDPC-23 cell line.
Author Disclosure Statement
No competing financial interests exist.