
Abstract
Introduction
In orthodontics, the most commonly used medications for pain relief are nonsteroidal anti-inflammatory drugs. However, it has been shown that these drugs may adversely affect orthodontic tooth movement and cause gastrointestinal sensations, and that they are also contraindicated in patients who are allergic to those drugs. 3,4
The biostimulatory effects of low-level laser therapy (LLLT) on several processes have been investigated since 1971, 5 and it has been shown that LLLT is an efficient method in pain relief. 6,7 Although the mechanism is still not clear, the analgesic action has been explained by stimulation of nerve cell, stabilization of membrane potentials, and the release of neurotransmitters in the inflammatory tissue. 8 –10 In orthodontics, the analgesic effect of laser therapy has generally been utilized to reduce the post-adjustment pain, and has been found effective on force-induced pain relief. 8,11,12
Chemical analysis of gingival crevicular fluid (GCF) is a promising technique in order to investigate the response of dental and periodontal tissues to orthodontic force load in a biochemical/immunological manner. 13 Prostanoids, metabolites of arachidonic acid through the cyclo-oxygenase pathway, are the best known lipid mediators that contribute to inflammatory pain. Prostaglandin E2 (PGE2), among the prostanoids, has the greatest impact on processing of pain signals. 14
The objective of this study is to evaluate the effects of LLLT on orthodontically induced pain. Immunological assessment of PGE2 in GCF was also performed as an objective measurement in addition to visual analogue scale (VAS) scoring.
Materials and Methods
The study consisted of 19 patients (11 girls, 8 boys), between the ages of 13.5 and 14.5 years (mean 13.9 years), referred to Cumhuriyet University, Department of Orthodontics, for orthodontic treatment. Ethical approval was obtained for this study. The patients and their guardians were informed and consent was obtained. Patients' inclusion criteria were:
• should be a non-extraction patient with fully erupted second molars, and all teeth in maxillary arch should be in contact
• should have healthy periodontal tissues (gingival index=0, plaque index <1, probing depths <3 mm, no periodontal attachment loss, and no radiographic evidence of periodontal bone loss)
• should not be under medical treatment that could affect perception of pain
• should not have any systemic problems or have undergone any orthodontic treatment previously
Maxillary first molars were randomly defined as control or lase-irradiated tooth to eliminate inter-subject variability. Random sampling was done by using the web site about randomization to control for left and right site variability of dentition (
Before any clinical application, GCF was collected from maxillary first molars' gingival crevice (PT1). Afterwards, molar bands (3M Unitek, Monrovia, USA) were placed on both maxillary molars. At this time, the bands were not cemented, in order to prevent physical trauma that might cause misleading cytokine levels. Immediately after, LLLT was applied to the selected molar and the molar at the other side had the laser probe positioned similarly for the same duration to exclude the placebo effect. At the end of 1 h, GCF was collected again (PT2). Finally, the molar bands were cemented with a glassionomer cement (Meron, Voco, Germany). Twenty-four hours later, the selected teeth were irradiated again, and GCF collection was repeated (PT3).
Laser irradiation
The randomly selected maxillary right or left first molars were irradiated using an 820 nm GaAlAs diode laser (1106MX, CTL, Warsaw, Poland) with an output power of 50 mW. The irradiation was performed with continuous waves by a fiber applicator 2 mm in diameter (2241, CTL, Warsaw, Poland) on four points (mesiobuccal, mesiopalatinal, distobuccal and distopalatinal gingiva) around the tooth (Table 1).
VAS scoring
All subjects were instructed to mark their pain level on a 100 mm VAS form at 5 min (VT1), 1 h (VT2) and 24 h (VT3) after band placement for their maxillary left and right first molars separately. The mark was measured with a 10 cm ruler from the left side in millimeters. Each millimeter was given a VAS score of 1 so that the score of 0 at the left end of the scale indicated no pain, the score of 100 at the right end of the scale was regarded as maximum pain, and the score of 50 in the center indicated moderate pain.
Determination of PGE2 levels by enzyme-linked immunosorbent assay (ELISA) kits
On the day of analysis, 200 μL of Hank's buffered salt solution containing 1% bovine serum albumine (Sigma, St Louis, MO) was added to the tubes containing the sample strips. The tubes were gently shaken for 1 min and then centrifuged at 2000 rpm for 5 min. Then the strips were removed. The amount of PGE2 was determined using ELISA assay (Cayman, Ann Arbor, MI) in accordance with the manufacturer's instructions. After the color development was stopped, the optical density was measured using a microtiter plate-computerized reader (Bio-kinetics Micro Plate reader EL-312, Bio-tek Instruments, Inc., VT) set to a wavelength of 450 nm. The PGE2 levels in GCF were calculated from the standard curves and defined as picograms/site for total cytokine levels. Sites with cytokine levels below the limits of the kit's detectability were scored as 0.
Statistical analysis
Data analysis was performed by SPSS for Windows, version 16 (SPSS Inc, Chicago, IL). Means and standard deviations at each time interval were calculated as the descriptive statistics for VAS scores and PGE2 levels. Mann–Whitney U test was used to compare differences in mean pain scores and PGE2 levels between the groups. The intra-group comparisons for different time intervals were analyzed by using the Friedman test. The level of significance was set at p<0.05.
Results
Statistical analyses revealed that PGE2 levels at PT1, PT2, andPT3 were found as 77.36, 87.63, and 107.10 pg/site for control and 75.63, 59.68, and 46.73 pg/site for laser groups, respectively. The difference among measurements in both groups was statistically significant (p<0.05) (Table 2).The results showed that mean VAS scores at VT1, VT2, and VT3 for control group were as 14.73, 6.36, and 12.89, respectively. The difference between VT1 and VT2 and between VT2 and VT3 were statistically significant (p<0.05) whereas there was no difference between the measurements VT1 and VT3 (Table 3). The mean VAS scores of the laser group at VT1, VT2, and VT3 were observed as 15.31, 5.36, and 1.42, respectively, and the difference between measurements was found to be statistically significant (p<0.05) (Table 3).
p<0.05; b p<0.01.
p<0.05; b p<0.01.
Comparison of PGE2 levels between two groups at three different times revealed that there was no difference at PT1 measurements, but that statistically significant differences were observed at PT2 and PT3 (p<0.05))(Fig. I). Intergroup analyses showed that there was no difference in VT1 andVT2 scores, whereas scores at 24 h (VT3) were significantly different between two groups (p<0.05)(Table 4 and Fig. 2).
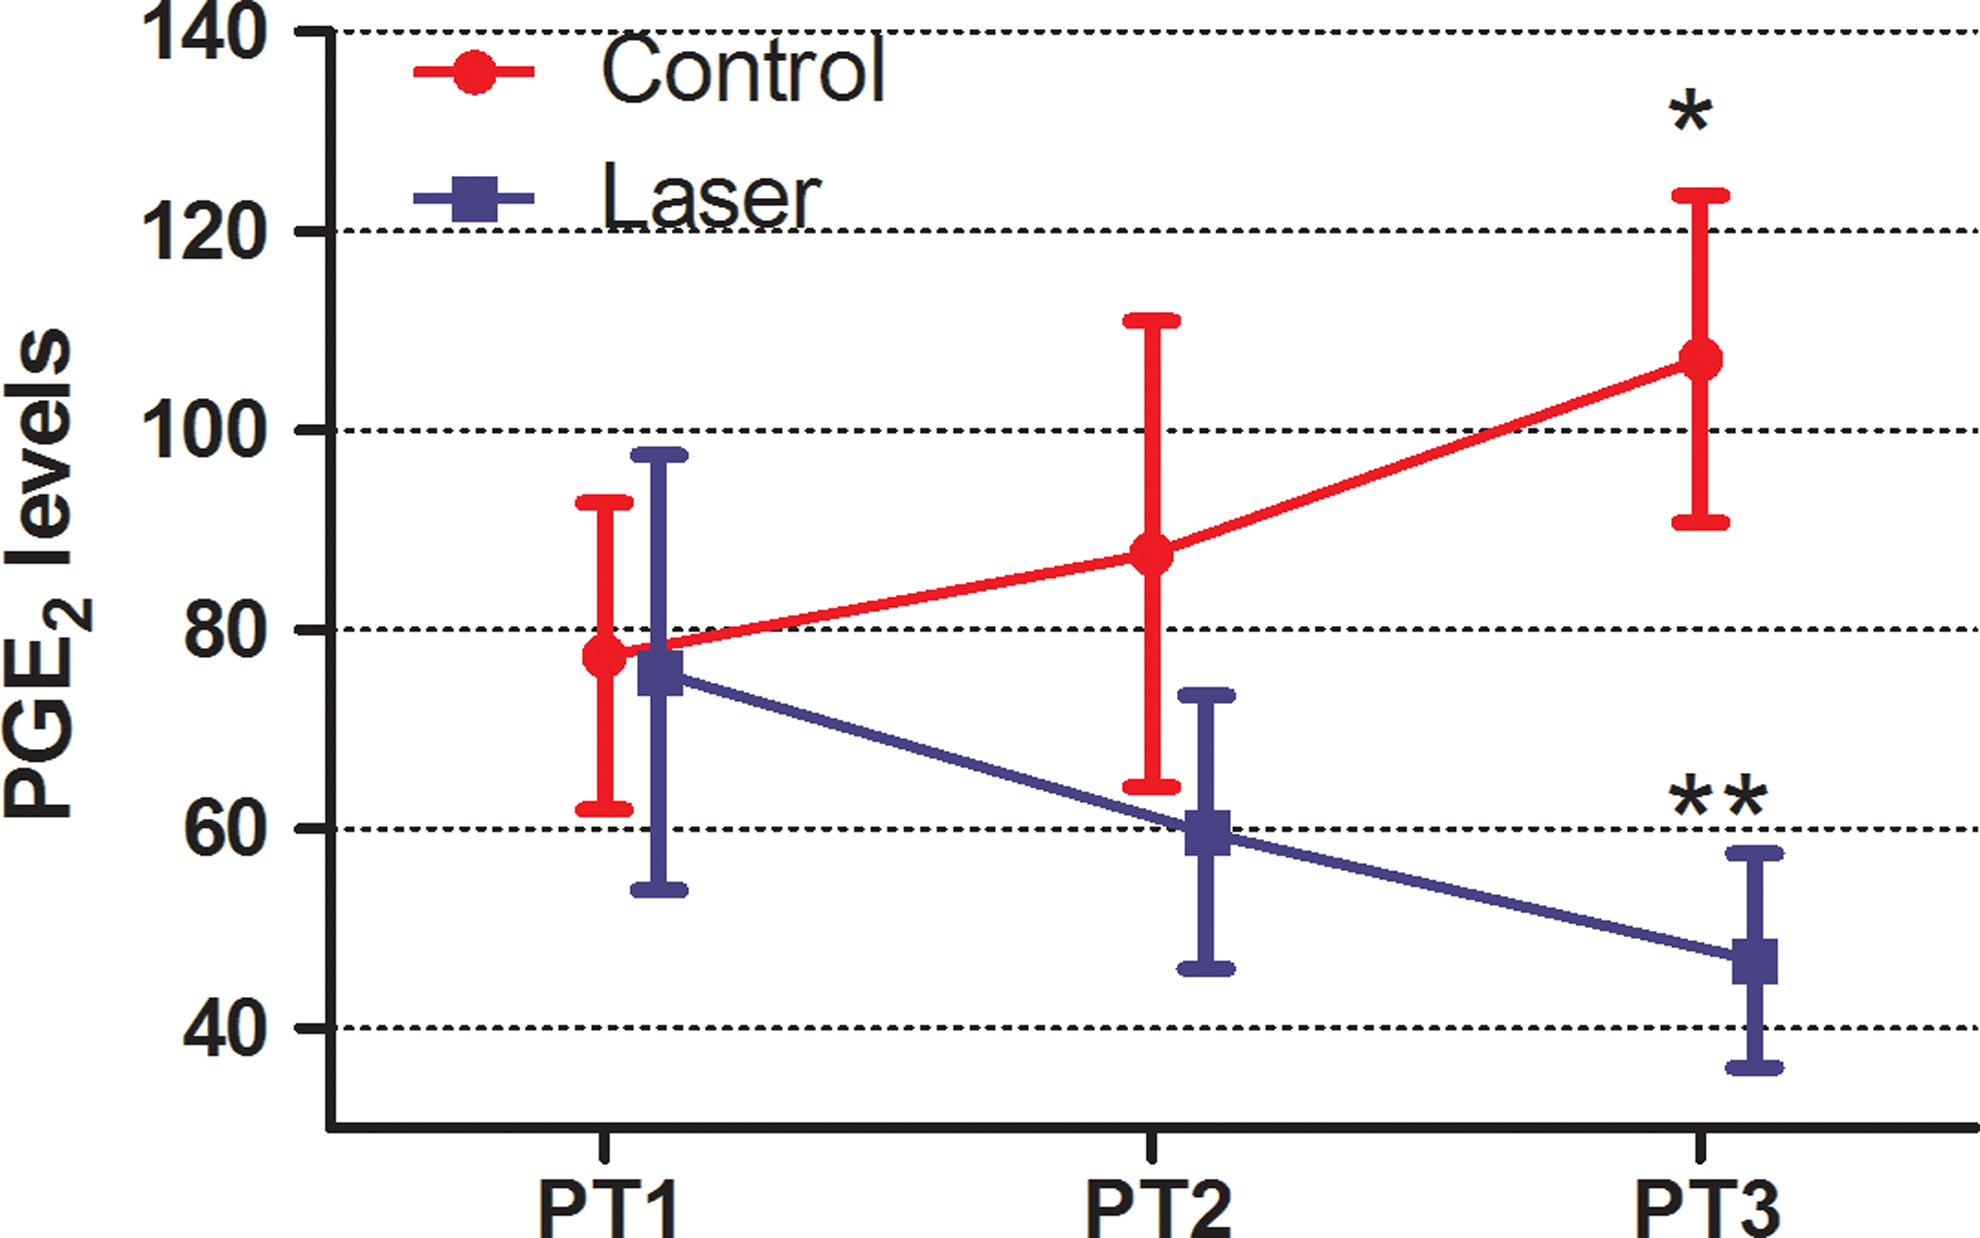
Prostaglandin-E2 (PGE2) levels at different time intervals.

Visual analogue scale (VAS) scores at different time intervals.
p<0.05; b p<0.01.
Discussion
In the assessment of orthodontic pain, VASs have been used by many investigators. 16 –18 Although it was found to be a reliable method, the subjectivity of pain perception and dependence of the responses upon the patient's rating may involve some questions about the accuracy of the results. Consequently, to obtain an objective parameter, cytokine levels in GCF were also evaluated in the present study.
Although the generation, measurement intervals, and the peak period may show differences among studies, it has been presented that orthodontic pain generally starts at 2 h and peaks at 18–24 h after initial archwire placement. 3,8,19 However, severe pain may appear immediately after force application (30 sec–60 min) if an acute and heavy force, such as separator or band placement, is applied on teeth. 11,12,20 In the present study, measurements were taken at 5 min and 1 h to test the acute effect of LLLT on this instant pain. Afterward, 24 h measurement was also performed, which would cover the peak period.
The VAS scores obtained at 5 min after band placement were found to be higher than 1 and 24 h scores for both nonirradiated control and laser sides. This result obtained from the control side is different from that in previous studies comparing the effects of LLLT on orthodontic pain. 8,11,12,17 –23 In these studies, it was shown that the peak level of discomfort occurred between 18 and 24 h after force application. This difference may depend upon the fact that the age of the patients in the present study was homogeneous and between 13.5 and 14.5 years, whereas in the abovementioned studies it was heterogeneous and the groups consisted of older patients. The subjects in the present study most likely could not be sure about the emotion that they had encountered and hesitated between the sense of “pressure” and of “pain.” Therefore, they described this severe compressive stress as “pain.” One hour later, the intensity of this feeling reduced, they were adapted and got used to this “new” feeling, and, consequently, marked a lower VAS score. This difference in the peak levels between the literature and the present study may also be attributed to the method used. In the previous studies, researchers usually preferred a case–control study design. However, in case–control studies, inter-subject variability in pain threshold cannot be eliminated. In the present study, a split-mouth design was performed to eliminate all components related to differences among subjects.
Although LLLT has been used in various clinical applications, its usage is very limited in orthodontic pain relief. 8,11,12,19,24,25 In one of these, Lim et al. presented that LLLT could not provide immediate pain relief, whereas it was found to be effective in reducing pain at 24 h after application similar with the results of the present study. 12 The VAS valuation of 24 h scores revealed that the intensity of the pain that patients felt in their irradiated teeth was nearly 10 times lower than it was in their control teeth.
Bergius et al. evaluated pain perception during orthodontic treatment and the authors stated their desire to know whether the presence of mediators in GFC could explain the difference in pain perceptions among the subjects. 26 Four years later, Giannoppoulou et al. answered this question and showed that the relationship between orthodontic pain and GCF composition changes at the level of interleukin-1β, substance P and PGE2. 20 In respect thereof, the difference between the present study and previous studies investigating the effect of LLLT in pain relief is the use of not only subjective, but also objective data obtained from patients. For this purpose, PGE2, which is considered to be related to pain generation, 20,27 –29 was measured in GCF. In previous studies investigating the GCF composition, changes caused by various treatment effects, different inflammatory chemicals such as Interleukin-1β, substance P, or β-glucuronidase were also evaluated. 20,27 –31 In this regard, these mediators might have also been evaluated additionally in the present study. However, in a pilot study that had been performed to investigate four different cytokines in GCF, it was seen that the pocket depths were quite shallow, accompanied by a very limited amount of GCF in healthy patients. Therefore, GCF was collected from four different points twice, and diluted ∼800-fold to acquire enough liquid. Unfortunately, this led to a decrease in concentration of the cytokines to a level under the detection limit of the ELISA kit.
Evaluation of PGE2 levels revealed that there was no difference between control and laser-irradiated teeth before band placement. Afterward, it was shown that laser application caused a significant decrease, whereas an increase was observed in the control group at 1 h. The reducing effect of laser application on PGE2 synthesis was evident already after 24 h, whereas the increment continued in control teeth. This result obtained from the control group was similar to that of the previous study, showing a rapid release of mediators that occurred at 1 h and peaked at 24 h. 20 Moreover, the significant difference in PGE2 levels at 1 h and 24 h between the two groups demonstrated the validity of laser application in reducing PGE2 production. This reduction may be based on the effects of LLLT on the steps of the inflammatory process. Following band placement, an orthodontic force was generated; the molar teeth were displaced and an inflammatory reaction was induced by compression of the periodontal ligament. This inflammatory reaction resulted in production of cytokines by periodontal ligament cells that diffused into GCF. 20,30,31 Immediately after, some mechanisms such as increase in blood flow, decreasing of peripheral nerve activity, stimulation of homeostasis, production of endorphins or opiate-like substances, and stimulation of metabolic processes in mitochondria might have occurred as a result of LLLT. 32 The mechanisms describing the analgesic effect of laser therapy, such as enhanced serotonin production, release of acetylcholine, singlet oxygen production, and nitric oxide syntheses might have also been other possibilities. 33 –36
It was known that LLLT can either biostimulate or inhibit the biological process, and that the generated effects of the therapy depend upon physical features and parameters of laser device (wavelength, output power, frequency, irradiation dose, type of the lens of probe), irradiation technique, and the target tissue (absorption coefficient, density, depth, thickness). 37,38 The proper wavelength for biostimulation has been assigned to be between 550 and 950 nm. 39 Because the absorption of infrared light is low by hemoglobin and water, an infrared light-emitting laser with a wavelength of 820 nm was chosen for this study.
Another point about LLLT is to define the effective dose for a specific action. Previously, researchers utilized GaAlAs diode laser for pain relief and preferred to use doses between 0.9 and 4.2 J/cm2. 8,12,19 However, the results regarding the success of LLLT in pain relief were controversial, 8,12,19 which might be attributed to the chosen dose. It was also possible that scattering of light might have affected the results by reducing the energy of the beams and the effectiveness of the therapy. Luger et al. used light energy of 64 J/cm2, which was quite high for biostimulation, and concluded that the energy amount at the target area was only 3–6% of the total energy, because of the scattering of light while transmitting through the tissue. 40 On the other hand, Shimizu et al. 41 speculated a relationship among laser irradiation, inhibition of PGE2, and pain relief with the dose of 1152 J/cm2, which greatly exceeded the ideal dose range stated in the literature (2–12 J/cm2). 37 They reported that LLLT has the ability to inhibit PGE2 production in a dose-dependent manner. In the present study, a dose of 7.96 J/cm2 at four points was applied by taking into consideration the scattering factor. Although a total inhibition could not be obtained, the findings of this study revealed that the dose used could manage to reduce pain and inhibit PGE2 synthesis significantly.
LLLT has been approved as an effective alternative for pain relief. The key point of this therapy is to choose the right wave length and the efficient dose. Because the therapy is relatively inexpensive, needs short chair time, and has no adverse effect, the clinician can try it. However, the ideal dose and irradiation intervals change from patient to patient, and should be investigated by further studies to achieve better results.
Conclusions
Although single dose LLLT could not provide a prompt pain relief effect, it is significantly efficient in reducing orthodontically induced pain 24 h after the application. LLLT was also found to be effective in reducing PGE2 production.
Footnotes
Acknowledgments
This study was supported by the Scientific Research Project Fund of Cumhuriyet University under the project number DIS-063. We thank to Dr. Ziynet Cinar for statistical evaluations, and Dr. Ulvi Gursoy for his critical review.
Author Disclosure Statement
No competing financial interests exist.