




Abstract
Introduction
A number of in vitro investigations using a wide range of cell cultures have provided different data concerning cell proliferation 11,12 and differentiation, 13 DNA and bone protein synthesis, 1,14 –16 and bone tissue formation without genotoxic or cytotoxic damage. 17 Unfortunately, these studies have particular irradiation setups and different methodologies, so that the results obtained cannot be compared with or extrapolated to others. In some of these studies, cells were seeded in 96 well plates and irradiated through the bottom using wavelengths of 810 or 830 nm. 12,18 –20 In others, the cells were seeded in Petri dishes and the probe was positioned at a distance of 9 cm1 or 13 cm21 from the cell cultures. Cells seeded in wells of 24 well plates were also irradiated at a distance of 0.5 mm22 or 550 mm. 15 There is a significant difference in experimental methodologies when only one light source (serial procedure) has been used to irradiate a 96 well and a 24 well test plate or a Petri dish, especially when comparing the delay between irradiating the first and last sample of plate, or a limitation of the maximum power density reached in experimental protocol, because of the need to irradiate the entire area of the well bottom. In addition, different culture media and solutions have been used to irradiate cell cultures. 18 –21,23 One should be aware that the laser system used, 24 its pulse width, 25,26 or even the use of a single-diode LLT or multi-diode light-emitting diode therapy (LEDT) 27 may promote different interactions with a biological environment, which should not be compared. 12
Therefore, the purpose of this study was to develop a device capable of irradiating samples of cell cultures in a standard manner and with a parallel procedure of irradiation. This homemade device, termed LASERTable (LT), simultaneously and in a similar way, irradiates 12 wells of a 24 well plate, taking into account the area of the bottom of each well. The LT still preserves laser as its source, as its monochromaticity and spectral resolution are effective in the modulation of biological processes.
This article describes both assembly of the LT and its profile of lighting on each well of a plate, with the aim of highlighting that cell irradiation is more valuable than an experimental setup for the standardization of LLLT experiments. Ideally, all LLLT experiments should submit the cells of samples in the same experimental group to an equal optical power density. When facing the real situation, it is no trivial matter to reach this homogeneity in irradiation. It depends upon the manufacturing design of each individual light source, and the use of additional optical elements the in experiment, such as lenses; and the optical alignment of visible or infrared beams performed by the researcher. Therefore, detailing of irradiation should consider the spatial profile of irradiation inside each well of a test plate, the total irradiated area, spectral peak and band width of the light source, and the time of irradiation throughout the experiment.
Materials and Methods
LASERTable (LT) system
In a brief overview, LT is composed of laser diodes, an electrical source, a drive board with 12 electrical circuits, three plano-convex cylindrical lenses, metal heat sinks, and a mechanical assembly for optical alignment and support of the test plate. A schematic view of LT presenting the main components is shown in Fig. 1.

Twelve units of the laser diode DL-7140-201S (SANYO Electric Co., Ltd., Japan) were used in the LT. In the typical mode of operation, these units emit 70 mW of NIR radiation at 785 nm in the continuous wave mode. The lasers were aligned in groups of four in-line diodes as in Fig. 1a; three such groups were mounted in order to irradiate 12 wells. This strategy favored both the lens design and optical alignment of the LT. Usually, laser diode beams present a particular angular divergence between the parallel and perpendicular axes, which modulates the emission in an ellipse-shaped profile. The diode datasheet updates us about the 17 degrees of divergence for the perpendicular axis, and the 8 degrees for the parallel axis in the typical mode of operation. Therefore, three cylindrical acrylic lenses (24 mm width, 82 mm length, 12 mm radius) were manufactured and aligned with the groups of in-line diodes, taking the more divergent axis of the lasers parallel to the curved surface of the lens. Therefore, only the larger divergence of the laser beam was the corrected by lens; the smaller divergence of the beam was explored to irradiate the entire bottom area of a well by adjusting the distance between the laser and the well plate.
The electrical supply of the lasers was provided by a 160 W power source MPS-303 (MINIPA Ltda., São Paulo, Brazil) and 12 circuits configured as the source of electric current. Each diode was wired to one current source in order to control its electrical current individually. Regulations were performed setting each diode in its typical mode of operation (100 mA, 2V). Finally, an acrylic box was designed and manufactured for coupling the LT components, and for aligning the diodes and lenses with the test plate. The final LT design is shown in Fig. 1b.
Heat sinks of the laser diodes
As the higher operating temperatures lead to early failure of laser diodes, particular attention should be paid to fabrication of the heat sinks and coupling the lasers to them. This unfortunate situation was experienced during the LT development. Initially, LT was mounted using diodes DL-7141-035 (SANYO Electric Co., Ltd., Japan; 808 nm, 100 mW) and it was successfully used in some experiments. 19,20 Failure of these diodes occurred in an experiment with a long irradiation time (25 min, 30 J/cm2) in which the laser temperature increased beyond its limit. After this, these elements were replaced by current laser diodes, and new heat sinks were manufactured.
Each new heat sink was composed of a cylindrical metal body (18 mm in diameter, 22 mm long) and a metal cover (10 mm in diameter, 2 mm thick), both made of aluminum. A large opening (10 mm in diameter, 4 mm deep) was drilled into the body to accommodate the laser; small concentric openings (5 mm diameter) were also drilled throughout the entire piece, in order to wire the diode pins to the current source. Threads were made in the wall of the large opening, and covered so that the diode was sandwiched between the body and the cover, which kept it in permanent contact with the heat sink. The contact surface between the laser and the body was covered with thermal grease in order to deliver the maximum amount of heat from the laser to the heat sink. The temperature of the diode package was monitored, revealing that LT could be used in long-term protocols. Finally, the sets of diode coupled to the heat sink were bonded to an acrylic plate, forming the laser board.
Bottom-up and top-down irradiation configuration
The LT was designed to irradiate a well plate individually in two configurations: top-down and bottom-up, switching between them by simply changing the position of the laser board. In the bottom-up configuration, each laser irradiated the entire area of one well (18 mm in diameter, 2.5 cm2 in area).
In the top-down configuration, the laser board was turned upside down and placed 3 mm above the plate. Here there were no lenses between the lasers and well, so that an unexpanded irradiation was performed (5 mm in diameter, 0.2 cm2 in area). The top-down configuration was used in a particular experiment with laser transillumination of dentin discs. Here, odontoblast-like cells were cultured on the obverse surface of the disc, and illumination was performed on the reverse surface, projecting light through the disc. The discs floated on cell culture medium with the obverse face immersed in liquid to allow the growth of cells. This experimental model tried to simulate transdentinal irradiation of odontoblast cells in dental pulp tissue, taking the dentin disc as the pulp chamber wall. The dentin disc acted as an optical barrier that scattered and absorbed light, so that the top-down configuration increased the light dose on the cells. 28
Optical alignment and profile of laser irradiation
Optical alignment of the LT was reached by displacing the laser board from the test plate, and then calibrating the distance between the laser board and the lenses. The distance between the diodes and lenses was set at 25 mm, whereas that between the lenses and the plate was set at 44 mm. These values were used to design the acrylic box for the LT. However, this alignment was used only for the bottom-up configuration; in the top-down configuration the laser board was set at 3 mm above the test plate.
The emission of a single laser of the LT in the bottom-up configuration was measured, using an optical power meter FieldMaster-GS with a LM-2-VIS sensor (Coherent Inc., San Jose, CA) (8 mm in diameter, 50 mm2 in area). An SMA fiberoptic connector (component of the sensor) was used to increase the spatial resolution of calibration by reducing the measurement area to 8.5 mm2 (3.3 mm in diameter). A circular mark on the acrylic cover of the test plate was used as reference of a well. The sensor was fixed to a mechanical stage with millimeter displacement; then the laser emission was scanned along the diameter of the circular mark surface. Scans with a 3 mm displacement step were performed in triplicate, followed by calculation of mean and standard deviation. The total optical power on the circular mark was measured using the sensor (Coherent Inc., USA) (16 mm in diameter, 2 cm2 in area). LM-10 has a detection area slightly smaller than the area of one well; therefore, almost all the radiation that flowed through a circular mark could be detected.
After this, a digital image of the LT operating in the dark was obtained, in order to observe the emission of all diodes simultaneously. This image was captured by placing a sheet of white paper (neutral light diffuser) on the acrylic cover. As the image was captured in a dark environment without using a flash light, the emission detected depended only upon the shutter of the digital camera.
Temperature tests
The temperature of the culture medium (Dulbecco's Modified Eagle Medium [DMEM]), either supplemented with fetal bovine serum (FBS), or not, was monitored during a bottom-up irradiation of 1200 sec (20 mW/cm2, 24 J/cm2), simulating different LLLT protocols. FBS was tested at three concentrations (2%, 5%, and 10%). A digital thermometer MT-600 (MINIPA Ltda., São Paulo, Brazil) was used with the sensor fixed to the bottom of a well. Initially, the temperature was monitored using an empty well; these data revealed the heating induced by radiation directly on a sensor; therefore, it was taken as a baseline. Then the well was filled with culture medium, which remained at rest for ∼3 min in the container, until it reached a constant temperature approximating the room temperature; after this, the temperature was measured again. The baseline value was subtracted from the new temperature value found, and the difference was the amount of culture medium heating that occurred during the protocol. This procedure was repeated in triplicate. Finally, the mean and standard deviation of temperature were calculated.
LLLT applied on odontoblast-like cells
The metabolism of odontoblast-like MDPC-23 cells under nutritional stress, subjected to direct LLL irradiation, was evaluated. The complete description of experimental method, results, and data analysis can be found in the work of Oliveira et al. 29 Actually, the focus is to emphasize the performance of the LT in this study, and present the experimental results obtained.
Cells were seeded (12,500 cells/well) in the wells of 24 well plates, and incubated for 24 h at 37°C. The DMEM was replaced by fresh DMEM supplemented with 2% or 5% (cell stress induced by nutritional deficit) or 10% FBS. The cells were irradiated (2, 4, 10, 15, and 25 J/cm2) using the LT in the bottom-up configuration. One control group was established for each experimental condition. Seventy-two hours after the last irradiation, cells were assessed with regard to metabolism, morphology, and total protein expression.
Results
Light distribution and temperature tests
The normalized (percent) spatial distribution of optical power density provided by each laser of the LT is presented in Fig. 2. Lasers irradiate samples with a Gaussian-like profile, which is characteristic of laser diodes. This profile demonstrates that radiation is preferentially concentrated in the center of a well, determining the effectiveness of optical alignment; however, it also reveals that optical intensity at the periphery is 30% lower than in the center. The total optical power was measured, showing 48.3±0.6 mW per well, which leads to a mean power density of ∼20 mW/cm2. These values are significantly different from those of the top-down configuration, which presents optical power of >68.5 mW and a mean power density of >350 mW/cm2.

LASERTable with bottom-up configuration provides a Gaussian-like profile of irradiation in wells. Circular marks on the acrylic cover of the test plate were used as a reference to measure optical power inside and outside the wells of the test plate. The curve shows that a significant amount of irradiation is concentrated inside the well.
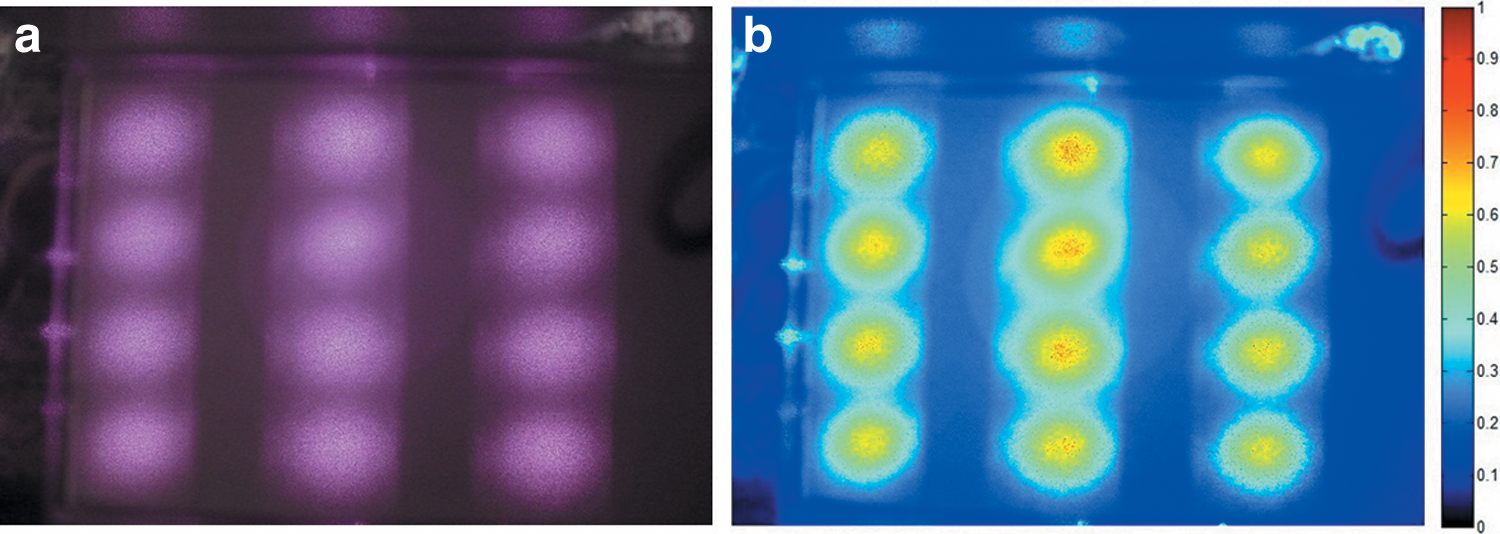
A qualitative profile of irradiation using all the diodes simultaneously is presented in Fig. 3. Figure 3a shows a digital image of emission revealing preferential illumination by all diodes illuminating inside the wells. Nevertheless, a small part of the radiation is scattered out of the well by the cylindrical lenses. Figure 3a also shows that the laser speckle originated on the paper surface. Figure 3b presents an image resulting from the processing applied to Fig. 3a, which increased the image contrast. It normalized the pixel intensities to a maximum in the image, and replaced the gray tones with false colors. This picture shows that the maximum irradiance is always in the center of a well, although there is little difference in the peak values among the wells.
The temperature of DMEM was verified by means of a simulated protocol with 1200 sec of irradiation (24 J/cm2) (Fig. 4). In general, the DMEM is heated by no more than 1°C, which attests that this protocol can be used in in vitro cell irradiation experiments. The standard deviation in Figs. 4a and c is higher than in the others; however, these data are associated only with the performance of the digital thermometer during the experiment. It should be noted that the resolution of the digital thermometer is 0.5°C, which is close to the magnitude of heating reached by the culture medium.

Graphs of temperature into culture medium along a low-level laser therapy (LLLT) protocol.
Performance of the LT
Numbers of groups and specimens per group as well as time spent to irradiate one sample from a group are presented in Table 1, in which experimental samples submitted to five LT doses are represented by irradiation time (or energy density). For each dose, three different FBS concentrations were used, totaling 15 experimental groups with 40 specimens per group, totalizing 120 samples that were exposed to the same irradiation time. Table 1 also compares the time spent to irradiate all 120 samples, considering a hypothetic serial procedure with a single laser system and the parallel procedure performed with the LT device. Because of the properties of the LT and the number of specimens per group, the time spent in a serial procedure was 10 times longer than in a parallel procedure. These data revealed that the total time spent to irradiate all 600 specimens was 93 h and 20 min for the serial procedure and 9 h and 20 min for the parallel procedure.
This is also an analysis of time spent irradiating all the samples if a serial or a parallel procedure of irradiation is applied.
Summarized results of the LLLT experiment
There was higher metabolism and total protein expression observed 72 h after the last laser irradiation at the doses of 15 and 25 J/cm2 (Mann–Whitney; p<0.05).
In all irradiated and sham-irradiated groups, the lowest succinate dehydrogenase (SDH) enzyme production was observed when the DMEM was supplemented with 2%, whereas the 5% and 10% FBS concentrations did not differ from each other (Table 2, rows).
Represents the sham irradiation (0 J/cm2), that is, the control cells were maintained in the LASERTable for the same irradiation times used in the experimental groups, although without activating the laser source. As none of the sham irradiation times had statistically significant effects on SDH enzyme production, all controls were compiled in a single control group (n=80).
Values represent median (P25-P75), n=16 (except for the control group, n=80). Values followed by same lowercase letters in columns and uppercase letters in rows did not differ statistically (Mann–Whitney, p>0.05).
As regards the FBS concentrations and irradiation with 2, 4, and 10 J/cm2, a significantly lower total protein expression occurred than in the control group. However, cell irradiation with 25 J/cm2 resulted in significantly higher total protein expression than in the control group for all FBS concentrations evaluated. The energy doses of 2, 4, and 10 J/cm2 did not differ significantly from each other in any of the FBS concentrations. The laser dose of 25 J/cm2 was superior in terms of the stimulus of total protein expression, in comparison with 15 J/cm2 only when the DMEM was supplemented with 5 and 10% FBS. When the medium was supplemented with 2% FBS, these energy doses did not differ significantly from each other (Table 3, columns).
Represents the sham irradiation (0 J/cm2), that is, the control cells were maintained in the LASERTable for the same irradiation times used in the experimental groups, though without activating the laser source. As none of the sham-irradiation times had statistically significant effects on total protein expression, all controls were compiled in a single control group (n=80).
Values represent median (P25-P75), n=16 (except for the control group, n=80). Values followed by same lowercase letters in columns and uppercase letters in rows did not differ statistically (Mann–Whitney, p>0.05).
Unirradiated cells subjected to nutritional deficit exhibited a normal morphology such as was observed when the cells were cultured in DMEM supplemented with 10% FBS (Fig. 5). Similar morphological characteristics were also observed in irradiated MDPC-23 cells subjected to stress conditions. 29
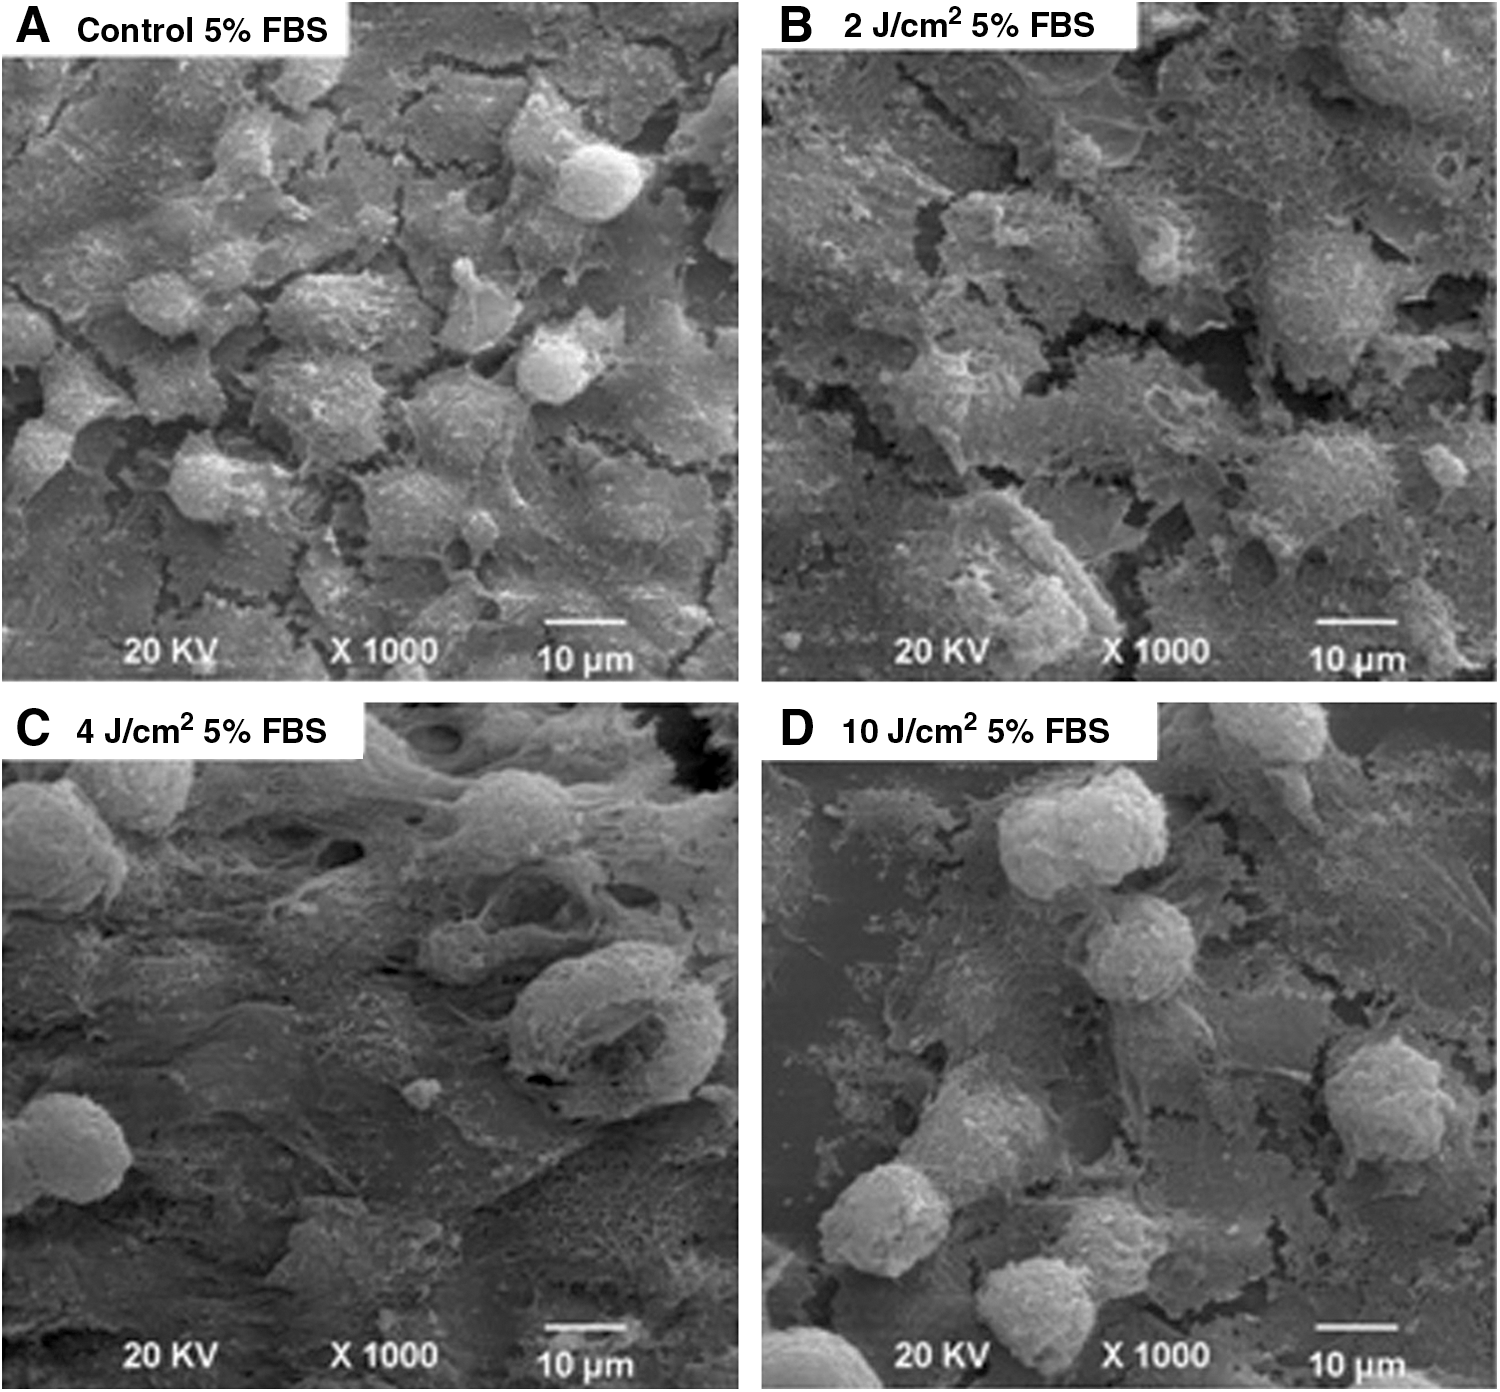
Panel of scanning electron micrographs (SEM) representative of cell morphology in each group.
Discussion
Development of the LT was motivated by the vast amount of data available in the literature about cell biomodulation induced by light irradiation. In general, most of these data are complementary and enhance understanding of the effects of LLLT. On the other hand, sometimes there are contradictory conclusions among experiments that investigate the same cell response, and one reason for that lack of agreement is the absence of standardization of the research protocols used. Moore et al. 12 described that a wide range of protocols and experimental models are important factors that make it difficult to understand the modulatory effects of phototherapy on cultured cells.
The LT was designed to standardize irradiation parameters (wavelength, irradiance, and energy density), so that the results of LLLT experiments could be more reliable. As regards the light beam, it may be detached from the Gaussian-like profile of irradiation on each well of the cell culture test plate. This emission profile is characterized by concentrating more light in the center of the beam than at the periphery, and it is a particular characteristic LEDs and laser systems, even when coupled to a fiberoptic device. This light distribution certainly interferes with cell irradiation. This profile of illumination has even more influence on in vitro phototherapy experiments, in which the light source is displaced from the cell culture to irradiate all areas of the test plate with an expanded light beam (magnitude of tens of centimeters squared). Unexpanded light beams are more attractive for use in in vivo experiments when the light source probe is placed in contact with the target tissue and limits the area of irradiation to the magnitude of millimeters squared. Moreover, even in this specific situation, there are profiles of irradiation on tissue; however, their effects are minimized by expecting the macroscopic effects of phototherapy and irradiation on a set of points across the tissue surface.
As there is a Gaussian-like profile of irradiation, two points should be discussed: (1) distribution of cells inside the well, and (2) consequences of the lighting profile for phototherapy. After being seeded, the cells are distributed homogeneously over the entire area of the well. However, with time, there is a slight tendency of the cells to accumulate and proliferate at its periphery. It is intuitively clear that to increase the efficiency of LLLT experiments using cell culture, a uniform spatial distribution of light should reach the bottom of the wells to which the cells are attached. Therefore, a specific optical assembly should be designed for each diode, which makes the LT more expensive. An alternative to this would be to couple each diode to an integrating sphere. However, apart from the costly system and spatial limitation for adding 12 optical spheres, in this case multiple reflections inside a sphere would minimize the final intensity of the light beam.
Another relevant point of discussion is the light absorbed by the cells subjected to irradiation. It is evident that not all the luminous energy delivered to the well is absorbed by the cells, as there is a significant amount of light that passes through the layer of proliferated cells and dissipates into space. One possible interpretation of this fact is that there is a threshold of light absorption by cells, and that the excess light delivered to cells during irradiation is lost; in this case, the Gaussian-like profile of illumination could be less influential in the experiment than only the threshold of light absorption that was reached by cells in all areas of the well. Unfortunately, to date, there are no published results that demonstrate this hypothesis. However, studies have proven the importance of light power density in modulating the biochemical outcomes of phototherapy. 21,23,29
Statistical analysis of the results has been the best tool to validate the changes in the metabolism of cells subjected to LLLT and the influence of the Gaussian-like lighting on results. When comparing data from Table 2 (MTT assay) and Table 3 (total protein expression), it should be noted that the mean of the control group eventually differs from the mean of the experimental group, revealing differences, as expected, between cells from the control and experimental groups; however, the variance of data in percent is similar, even in the control group, and this behavior was not expected. One possible reason for this magnitude of variance in the control group could have been the response of cells themselves to biochemical tests, especially those whose results depended upon the number of cells in the sample. In general, the process of cell proliferation in cell cultures induces samples with differences in the number of cells, even in the control group. Therefore, it is possible for the variation in the number of cells of a sample to be more significant in MTT and total protein expression experimental results, than in the Gaussian-like profile of illumination.
The LT allows standardization of LLLT experiments from several aspects, especially considering the absorption of visible and infrared radiation by the culture medium and test plate, as well as heating of the culture medium induced by absorption of radiation. Nevertheless, we believe that a significant variation in control and experimental data will be present in the results of in vitro cell culture LLLT whether or not light sources with a Gaussian-like profile of illumination are used.
Conclusions
This report presented a novel 785 nm laser-based system for parallel infrared irradiation of cell cultures. The LASERTable device was designed to provide two configurations of irradiation in cell cultures stored in a 24 well plate. The bottom-up configuration delivers irradiation in the entire bottom the area of twelve wells of a 24 well plate, whereas the top-down configuration delivers unexpanded irradiation. The bottom-up configuration provides 20 mW/cm2 power density per well, whereas the top-down configuration provides 350 mW/cm2 power density per well.
The LT device achieved the objective of providing standardization for infrared cell irradiation, reducing the time spent to irradiate all the experimental samples by approximately 10-fold. LT used in an experimental protocol on odontoblast-like cells attested to the effectiveness of this device, as laser irradiation stimulated the metabolic activity.
Footnotes
Acknowledgments
The authors thank the Conselho Nacional de Desenvolvimento Científico e Tecnológico–CNPq (Grants: Instituto Nacional de Óptica e Fotônica) and the Fundação de Amparo à Pesquisa do Estado de São Paulo–FAPESP (Grants: 2007/50646-3, 2008/08424-6, and 2008/54785-0) for providing financial support.
Author Disclosure Statement
No competing financial interests exist.