
Abstract
Objective:
To evaluate the effect of erbium: yttrium aluminium garnet laser conditioning bond strength of orthodontic brackets on porcelain surfaces.
Background:
There are few studies that evaluate the effect of Er:YAG laser about orthodontic bonding on porcelain surface. The efficacy of Er:YAG laser in porcelain conditioning is controversial.
Materials and methods:
Ninety ceramic specimens were randomly divided into five group, group A: etched with hydrofluoric (HF) acid; group B and C: etched with an energy parameter of 250 mJ, 20 Hz and 300 mJ, 20 Hz by Er:YAG laser instrument; group D and E: etched with an energy parameter of 250 mJ, 20 Hz and 300 mJ, 20 Hz of Er:YAG laser with HF etching. Afterward, two samples selected randomly from each group were evaluated by scanning electron microscopy. Brackets were bonded on the remaining samples, which were stored in distilled water and thermocycled. Each group was measured by shear bond strength (SBS), tensile bond strength (TBS), porcelain fracture index (PFI), and adhesive remnant index (ARI) calculation. Data were statistically analyzed using SPSS software.
Results:
The SBS and TBS in group E were the largest. Comparing SBS and TBS of HF group and other Er:YAG laser group, there were statistically significant difference (p < 0.05). PFI was significantly higher in shear force group than the tensile force group. HF group had higher ARI score than the other groups.
Conclusions:
Porcelain surfaces etched by 250 mJ, 20 Hz of Er:YAG laser combined with HF acid can get enough bond strength and have lower porcelain fracture rate for orthodontic bracket bonding.
Introduction
N
The erbium: yttrium aluminium garnet (Er:YAG) laser, invented by Zharikov in 1974, is the first laser device approved by the U.S. Food and Drug Administration to be applied to hard tissue of human teeth. 10 Its wavelength is 2940 nm, located in the infrared region, and close to infrared absorption peaks of the hydroxyl of hydroxyapatite and water. 11 When Er:YAG laser irradiate at tooth tissues, its energy can be strongly absorbed by water, resulting in a small blasting, which can cut enamel and dentin effectively. For porcelain restoration, Er:YAG laser can destroy the crystal phase and glass phase structure of ceramic materials by using the instantaneous high temperature effect of laser. 12
In view of these characteristics, Er:YAG laser was applied to the surface treatment of porcelain crowns. But the efficacy of Er:YAG laser applied on porcelain is controversial. 9,13,14 Considering the fact that there are few studies that evaluate the effect of Er:YAG laser, the aim of this study was to evaluate whether Er:YAG laser is a suitable and efficient method for porcelain surface treatment in brackets bonding.
Materials and Methods
Ninety ceramic chips with the size of 0.6 × 1.5 × 0.2 cm were prepared by glass ceramic (IPS Group A: The samples were etched with 9% HF acid (Pulpdent) for 2 min, wiped by cotton, rinsed thoroughly with water spray, and then air dried until a frosted appearance was observed. Groups B, Group C: The porcelain surfaces were separately irradiated with Er:YAG laser (Fidelis AT, Fotona, Slovenia) with two energy parameters: 250 mJ, 20 Hz (group B) and 300 mJ, 20 Hz (group C). Groups D, Group E: The porcelain surfaces were separately irradiated with Er:YAG laser with two energy parameters: 250 mJ, 20 Hz (group D) and 300 mJ, 20 Hz (group E), then etched with 9% HF acid for 2 min, wiped and rinsed thoroughly with water spray, and air dried.
Laser energy was delivered in SSP mode on the porcelain surface for 30 sec under 60% water flow and 40% air flow. The pulse duration was 50 msec. The laser optical fiber was placed perpendicularly to the porcelain surface and focused at 7 mm high to the surface. The spot diameter was 0.4 mm. Then treat the porcelain surface with the horizontal movements by handpiece over an area that was 5 mm in diameter. The speed of movement was 1 mm/sec. The power density and energy density of 250 mJ, 20 Hz Er:YAG laser were 3980.89 W/cm2 and 199.04 J/cm2, respectively. The power density and energy density of 300 mJ, 20 Hz Er:YAG laser were 4777.07 W/cm2 and 796.17 J/cm2, respectively. To ensure consistent energy density, distance, and direction, the treatment was operated by the same person and same laser handpiece (noncontact R02, Fotona, Slovenia).
Two samples were randomly selected in each group. The surface morphology was observed by S-4800 scanning electron microscopy (SEM) (HITACHI, Japan) on the surface of the metal spraying samples.
The prepared samples were observed by stereomicroscopy (Aopu Co., China, 10 × magnifier) to check the glaze breakage and microcrack, and then embedded and fixed by fast self-solidifying resin, forming the block samples. One centimeter of the upper end of the ceramic chip was exposed, and the surface should be kept away from the resin.
In accordance with the operating requirements of chemical curing adhesive (3 M, USA) the maxillary central incisor bracket (3 M) was placed in the center of the ceramic chip with certain pression, so that the baseplate was evenly contacted with the ceramic chip surface. The excess adhesive around the bracket was removed with a probe.
Stainless wire (Wilcock Co., Australia) with the diameter of 0.018 inch was cut out as the guiding wire measuring the tensile bond strength (TBS). Afterward, the bracket and guiding wire were conducted with rigid ligation twice by orthodontic stainless steel ligature wire with the diameter of 0.25 mm (Gangyan Co. China).
All samples were placed in thermostatic water bath for 24 h at 37°C. Afterward, the samples were placed in thermocycling instruments at 5°C and 55°C, soaking for 30 sec, respectively. Each cycle lasted 60 sec, and total 500 cycles were executed.
Eight samples in each group were firmly fixed on the workbench of the universal testing machine (AG-X plus, SHIMADZU, Japan) with a clamp. The positions of the cross head and workbench of the universal testing machine were calibrated to make the blade end of the cross head locate at the ligature wing of the bracket. The direction of the downward force is parallel to the baseplate of the bracket. Start the universal testing machine at a speed of 0.5 mm/min. The computer automatically recorded the maximum loading value and fracture value of the bracket (unit:N) (Fig. 1A). According to the pressure intensity formula P = F/S, the baseplate area of the maxillary central incisor bracket is 10.89 mm2, and the antishearing force was converted into shear bond strength (SBS) (unit: MPa).
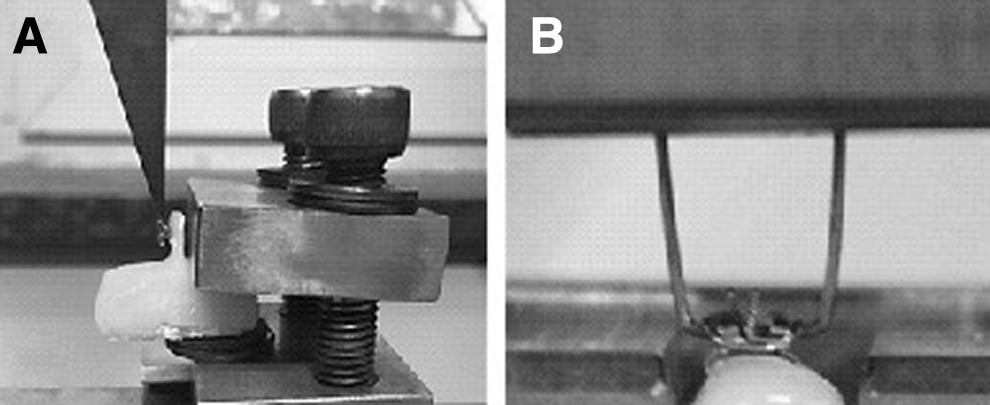
The TBS of the remaining eight samples in each group was measured. The experimental sample was fixed on the lower clamp of the universal testing machine, and the sample position was adjusted so that the baseplate of the bracket was parallel to the horizontal plane. The upper clamp was connected to the cross head of the universal testing machine, and the upper clamp was clamped at the guiding wire 5 mm away from the surface of the bracket (Fig. 1B). The remaining operations were the same with the measurement of SBS.
After measuring the SBS and TBS, the porcelain fracture without bracket was evaluated by microscope. Porcelain fracture index (PFI) proposed by Bourke 15 was scored.
point: The surface completeness is consistent with the surface before cementation.
point: The porcelain fracture is confined to the superficial layer and does not require repair in clinic;
points: The porcelain fracture is deep, and resin repair is required.
points: The porcelain fracture depth is greater than 1 mm. That is, the underlying metal layer is exposed in clinic, and the restoration needs to be removed.
Meantime, the adhesive remnant on the surface of the experimental samples was evaluated, and the adhesive remnant index (ARI) proposed by Artun and Bergland 16 was scored.
point: no adhesive remnant on former bracket site.
point: adhesive remnants covering <50% of the former bracket site.
points: adhesive remnants covering >50% of the former bracket site.
points: all adhesive left behind on the former bracket site.
Statistical analysis
All experimental results were analyzed by SPSS20.0 software. The SBS and TBS of brackets under different surface treatments were conducted with one-way ANOVA analysis. The differences between two random groups were further compared by LSD-t test. The PFI of each group was compared by Kruskal–Wallis rank sum test. The Wilcoxon rank sum test was adopted to evaluate the difference between the SBS group and TBS group in terms of the porcelain fracture. p < 0.05 and p < 0.01 indicate statistical difference.
Results
The porcelain surface of samples without any processing was quite smooth (Fig. 2A, B). In Group A with 9% HF acid only, irregular depressions with large area scattered on the porcelain surface could be found under the 1000 × scanning electron microscope. Small pore structures were irregularly and densely distributed among the depressions (Fig. 2C). Under the 3000 × scanning electron microscope, a plenty of quasi-circular shallow depressions with the diameter of about 10–20 μm distributed on the surface of large depression can be found (Fig. 2D).
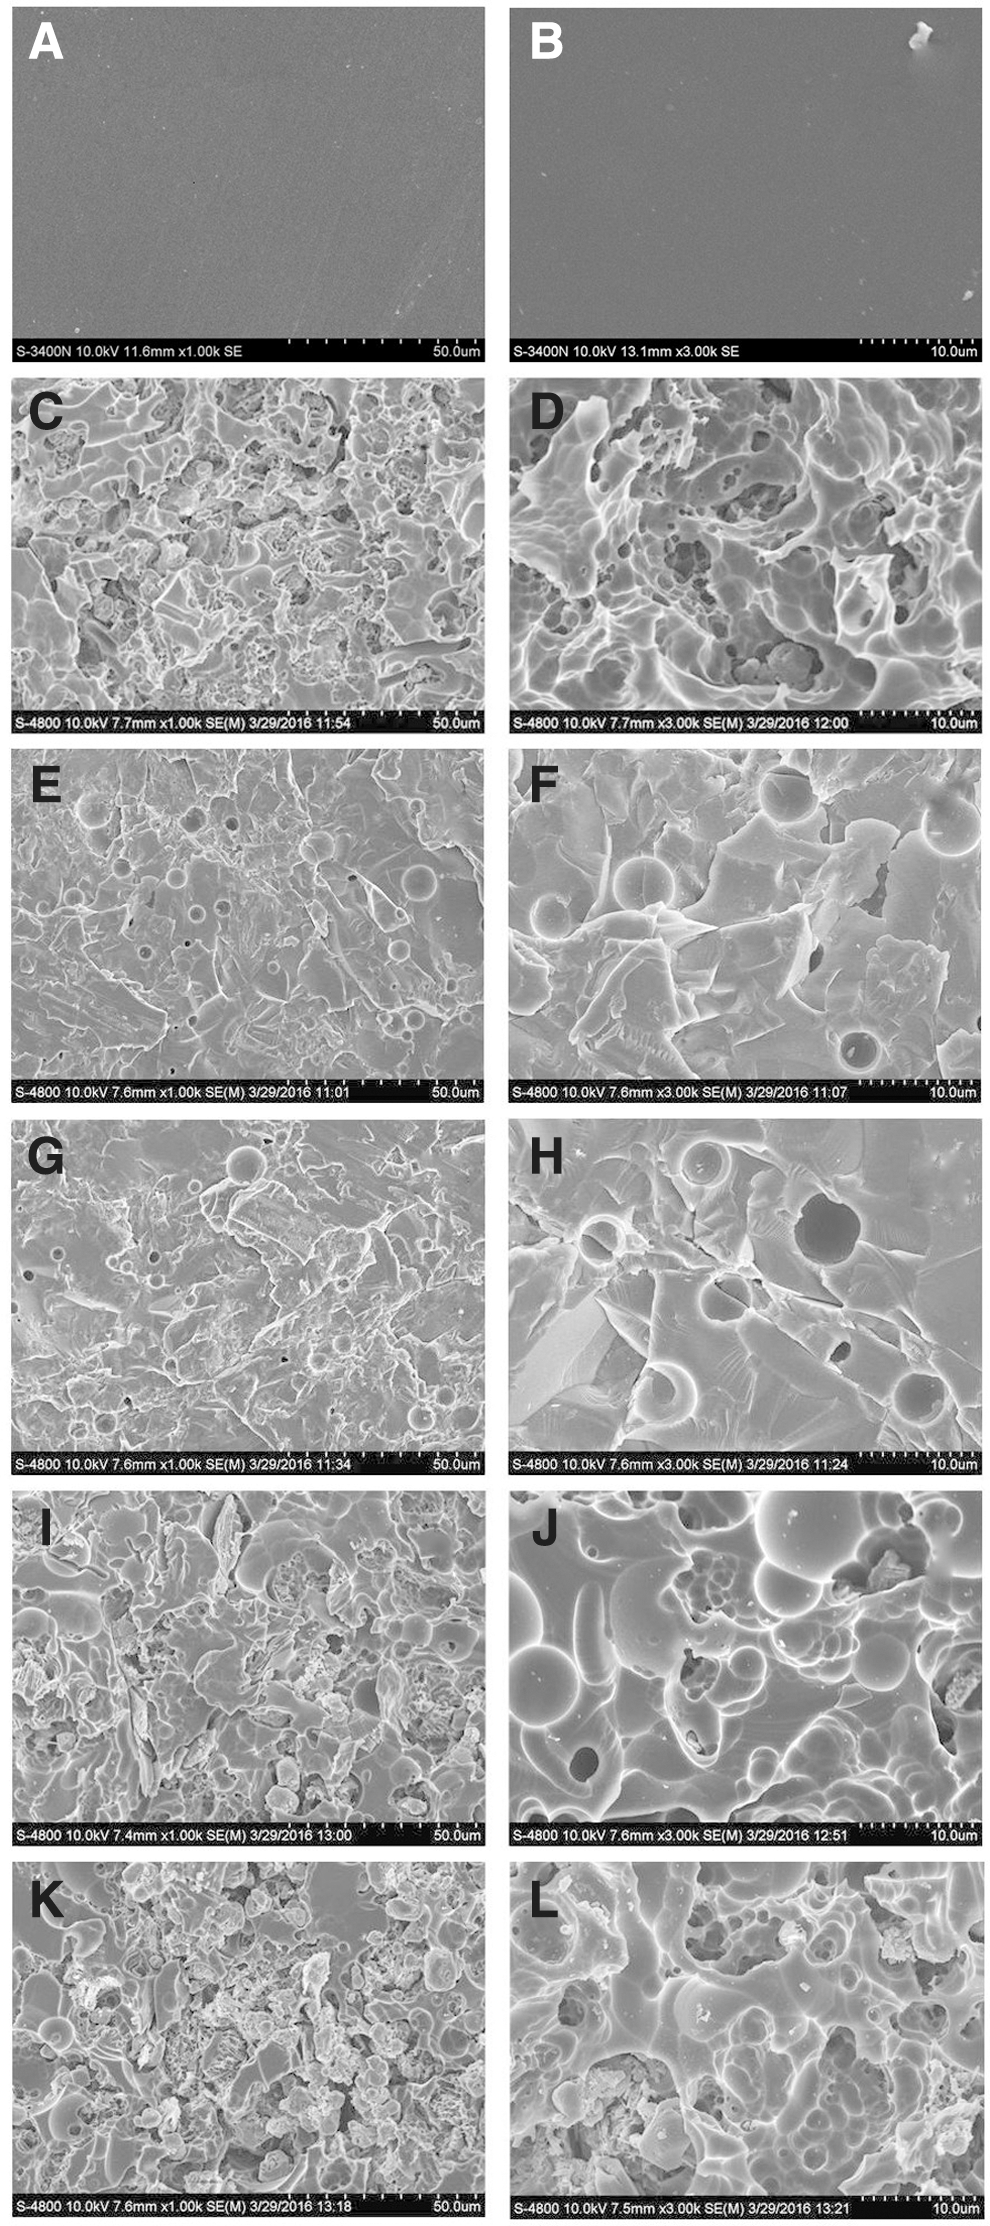
In group B with Er:YAG laser of 250 mJ, 30 Hz, round crater depressions with different sizes distributed on the scratch on the porcelain surface formed by polish could be found under the 1000 × scanning electron microscope (Fig. 2E). Under the 3000 × scanning electron microscope, the edge of the round depression was smooth, and the concretionary accumulated after ceramic crystal fusion can be found (Fig. 2F).
In group C irradiated with Er:YAG laser of 300 mJ, 30 Hz, round depressions with different sizes distributed on the porcelain surface can be observed under 1000 × scanning electron microscope, which is more dense compared with Group B (Fig. 2G). Under the 3000 × scanning electron microscope, cracks with different lengths are formed among the round depressions (Fig. 2H).
In group D, the porcelain surfaces were irradiated by Er:YAG laser with the parameters of 250 mJ, 30 Hz, then etched with 9% HF acid for 2 min. The change of round or oval honeycomb like mesh with different sizes and depths, sharp undercut retention can be observed under the 1000 × scanning electron microscope (Fig. 2I). Under the 3000 × scanning electron microscope, it can be observed that some holes have been fused and formed large sponge holes (Fig. 2J).
In Group E with Er:YAG laser with 300 mJ, 20 Hz and etched with 9% HF, plenty of deep fissures, cavities, and round crater-like structures can be observed on the porcelain surface by 1000 × scanning electron microscope (Fig. 2K). Under the 3000 × scanning electron microscope, it can be observed that round cavities with different sizes from 10 to 20 μm are attached to the bottom and side wall of the structure, forming undercut structures. Also, large solidified crystal packing after fusion can be found (Fig. 2L).
The TBS of Group B and C were lowest, only 3.135 MPa and 3.32 MPa, respectively; it was 5.78 MPa in Group A (HF) (Table 1). They were all smaller than 5.9 MPa, which is safe bonding strength for orthodontic brackets reported by Reynolds IR. 17 While the tensile bond strength of Group D and Group E, treated by both laser and HF, were 6.89 MPa and 7.17 MPa, respectively, much more than 5.9 MPa and group A, B, and C (Table 1). Based on the comparison between Group A and Group B, there is statistical difference in TBS (p < 0.05). By comparing Group A and Group C, the TBS has statistical difference (p < 0.05). The comparison between Group B and Group D indicates the statistical difference in tensile resistance strength (p < 0.05). Moreover, the statistical difference in TBS exists between Group B and Group E (p < 0.05). Finally, there was significant difference between Group C and Group E in terms of TBS (p < 0.05).
Two by Two Comparison of the Mean SBS in All Groups (MPa)
p < 0.05, ** p < 0.01.
SBS, shear bond strength.
The SBS in Group B and C (treated by laser only) were low, only 2.97 and 3.11 MPa, respectively; it was 5.28 MPa in Group A (HF) (Table 2). They were all smaller than 5.9 MPa too. The SBS of Group D and Group E, treated by both laser and HF, were 6.73 and 7.09 MPa, respectively, much more than 5.9 MPa and group A, B, and C. Based on the comparison between Group A and Group B, there is a statistical difference in SBS (p < 0.05). By comparing Group A and Group C, the SBS has statistical difference (p < 0.05). The comparison between Group B and Group D indicates the statistical difference in SBS (p < 0.05). Moreover, the statistical difference in SBS exists between Group B and Group E (p < 0.05), Group C and Group E (p < 0.05).
Two by Two Comparison of the Mean SBS in All Groups (MPa)
p < 0.05, ** p < 0.01.
SBS, shear bond strength.
The analysis on the correlation between SBS and TBS shows that the correlation coefficient is 0.963 (p < 0.0001) (Table 3). The results show that there is a positive correlation between SBS and TBS.
There is a significant correlation.
SBS, shear bond strength; TBS, tensile bond strength.
PFI, collected after removing brackets by shear force, was tested by the Kruskal–Wallis rank sum test (Table 4). PFI in Group B and C are low and has statistical difference between this two groups and the other three ones (p < 0.05). The PFI of Group E is the highest and has statistical difference from the other four groups (p < 0.05). The PFI of the tensile force group was significantly lower than the shear force group (p < 0.05). PFI after removing brackets by tensile force was also tested by the Kruskal–Wallis rank sum test in five groups (Table 5). However, PFI of each group after removing the surface bracket by tensile force has no statistical difference (p = 0.348). The porcelain fracture rates of the tensile force group and the shear force group are 10% and 32.5%, respectively.
Two by Two Comparison of PFI After Removing Brackets by Shear Force
PFI, porcelain fracture index.
p < 0.05.
Descriptive Statistics of PFI Collected After Removing Brackets by Tensile Force
PFI, porcelain fracture index.
The Kruskal–Wallish rank sum test shows that ARI scoring difference between the shear force group and the tensile force group has no statistical significance (p > 0.05) (Table 6). Moreover, ARI of the shear force group and the tensile force group has no statistical significance either (p > 0.05).
Scoring Table of ARI in Shear Force Group
ARI, adhesive remnant index.
Discussion
The processing capacity of Er:YAG laser for the surface of porcelain restoration remains controversial in previous studies. Yassaei et al. 9 found the orthodontic brackets after processing porcelain surface with 1.6 W of Er:YAG laser had higher bonding strength than the HF group, and that Er:YAG laser could replace HF acid in the orthodontic bracket bonding. Yassaei et al. 18 conducted experiments on the zirconia porcelain surface after removing glazed layer, and they found that sandblasting and Er:YAG laser with energy parameter 50 mJ, 20 Hz and 100 mJ, 20 Hz were suitable alternatives to HF acid. By contrast, Poosti et al. 13 found that 2 and 3 W of Er:YAG laser could not replace HF acid, but Nd:YAG laser could achieve the same bonding strength as HF acid. The above researches adopted different porcelain restoration materials, set up different laser parameters, chose different experimental conditions, so they reached different results, and failed to reach unified conclusions.
In this study, SEM showed that there was relatively dense, and uniform quasi-circular hole structure on the surface of porcelain after acid etching for 2 min with 9.6% concentration of HF. The result was similar to the research results of Bona et al., 19 who found a number of irregularly distributed deep micropores formed on porcelain surface after HF etching. The kind of irregular quasi-circular appeared because HF selectively dissolved the glass phase structure of ceramic materials. In the two groups that used only laser treatment, only scattered crater-shaped circular depressions on porcelain surface could make adhesives permeate, and provide limited retention. After the combined processing by Er:YAG laser (with the energy parameters of 250 mJ and 20 Hz) and 9.6% HF, the porcelain surface morphology was very similar to the porcelain surface processed by concentration of 9.6% HF etching. However, deeper cavity formed; there was solidified porcelain crystal after melting piled up near the cavity, which increased the bonding area on the surface of the porcelain, and helped to obtain higher bonding strength than HF acid. After the joint processing by Er:YAG laser with the energy parameters of 300 mJ, 20 Hz and 9.6% HF, many deeper groove cracks, cavities, and scattered round crater sample structure formed on the porcelain surface; a lot of undercut formed on these structure side wall and bottom, which could make adhesive permeate and form good mechanical lock structure.
It was reported that only the bonding strength not lower than 5.9–7.8 MPa could meet the demand of most clinical orthodontic work, 20 and such view has been widely recognized currently. For both the combination processing group of 250 mJ, 20 Hz of Er:YAG laser and 300 mJ, 30 Hz of Er:YAG laser with HF, the shear strength and tensile strength were greater than 5.9 MPa, prompting the combination of laser and HF acid could meet the demand of orthodontic bonding strength. At the same time, the two groups were significantly different from the other group, showing that the combination of Er:YAG laser and HF acid could increase the SBS between porcelain surface and bracket relatively to the exclusive use of HF acid or laser, respectively. Besides, for HF acid group, 250 mJ and 30 Hz of Er:YAG laser group, 300 mJ, 20 Hz of Er:YAG laser group, the SBS and TBS were less than 5.9 MPa, suggesting the exclusive use of HF acid or Er:YAG laser could not obtain satisfactory bonding effect. The combination processing group of 300 mJ, 20 Hz of Er:YAG laser and HF had the largest SBS and TBS, which was consistent with the observation results through SEM. At the same time, it was worth noting that the SBS and TBS within the two laser groups were quite different, possibly because of the difference of the operation of laser etching; the specific reason remained to be studied further.
In this study, the TBS of same group was higher than SBS, being consistent with the research result of Akova et al. 2 According to the correlation analysis results, there was significant positive correlation between SBS and TBS, with the correlation coefficient of 0.426, showing that TBS increased constantly with the continuous increase of SBS within a certain range.
As the bonding strength between brackets and porcelain surfaces increased, the risk of porcelain fracture in the process of bracket removal increased. 17,21 In this study, PFI increased with bonding strength, being consistent with previous research results. 17,21 Group E had the largest bonding strength and PFI. Therefore, porcelain surface processing methods affected PFI. On the one hand, more effective surface processing method of porcelain restoration brought firmer mechanical lock structure; on the other hand, when laser parameters were bigger, the laser irradiation made porcelain surface produce deep cracks, and caused the local stress concentration in the process of orthodontic bracket removal. PFI of shear force group was significantly higher than that of tensile force group. The reason for this result may be that direction of the applied shear stress paralleled to bonding surface, and then bonding surface produced relative movement and the shear deformation formed under the action of local shear stress, causing local stress concentration. PFI was low when tensile force was used for removing brackets. It was possibly because the direction of the applied tensile force was perpendicular to the bonding surface of bracket and porcelain, and adhesives produced relatively uniform deformation after exposure to the force, reducing the stress concentration. PFI was the lowest (10%) when tensile force was used to remove orthodontic brackets. Therefore, the study results suggest it is advisable to use tensile force for the removal of brackets on the porcelain restoration surface so as to reduce the probability of porcelain restoration surface fracture.
Er:YAG laser application has thermal effects on pulpal tissue. It is reported by Zach and Cohen 22 that temperature increase level where 85% of teeth stayed healthy is 5.5°C. According to Nalbantgil et al., 23 the temperature increase generated by Er:YAG laser is 2.36°C ± 0.23°C (300 mJ, 20 Hz) and 1.25°C ± 0.16°C (200 mJ, 20 Hz). The value stayed below the 5.5°C benchmark. In this study, the laser parameters are the safe energy level to be used to avoid any detrimental thermal effects on dental pulp tissues.
Conclusions
The exclusive use of HF acid, or Er:YAG laser could not obtain sufficient bracketing bonding strength. The bonding strength of combination strategy of 250 mJ, 20 Hz Er:YAG laser and HF acid on porcelain restoration surface can be satisfied for orthodontic bracket bonding, and the porcelain fracture rate is lower. The use of tensile forces when debonding the brackets from the surface of the porcelain restoration can reduce the occurrence of fracture on porcelain surfaces.
Footnotes
Acknowledgments
This work was supported by the Capital Health Research and Development of Special [2018-2-1102], and Beijing Natural Science Foundation [7162053].
Authors Disclosure Statement
No competing financial interests exist.