
Abstract
Objective:
This study evaluated the comprehensive and sequential gene expression in laser-ablated bone compared with that in nontreated control bone.
Background:
Bone ablation by Er:YAG laser has shown positive effects on bone healing; however, the gene expression responses that occur during bone healing remain unclear.
Materials and methods:
The calvarial bone of male, 10-week-old Wistar rats was ablated by Er:YAG laser. Gene expression in the laser-ablated bone and nontreated control bone was evaluated at 6, 24, and 72 h using microarray analysis. Messenger RNA (mRNA) expression levels were validated by quantitative reverse transcription–polymerase chain reaction.
Results:
Gene expression of BCAR1/p130Cas (breast cancer anti-estrogen resistance 1/p130 Crk-associated substrate), a mechanotransducer, was gradually increased. Additionally, upstream of the Hippo signaling pathway was enriched according to Kyoto Encyclopedia of Genes and Genomes pathway analysis at 6 h. F-actin mRNA expression was also gradually increased, whereas the Hippo signaling pathway was downregulated from 6 to 24 h. Enrichment of bone formation-related Gene Ontology (GO) terms was observed from an early stage, whereas inflammation-related GO terms, gene sets, and mRNA expression of Nfkb1, Tnf, and Il1b were gradually enriched after 24 h.
Conclusions:
Bone ablation by Er:YAG laser regulated the expression of Bcar1 and Actg1, the main regulators of mechanotransduction in the bone tissue. Additionally, inflammation was gradually increased up to 72 h following bone ablation with Er:YAG laser. Laser influences the expression of genes associated with bone formation immediately after irradiation. Therefore, mechanical stress and the biological effects caused by Er:YAG laser irradiation potentially contribute to wound healing in the laser-ablated bone tissue.
Introduction
Advancements in laser technology have led to their effective and minimally invasive application, resulting in lower time and reduced treatment cost, in various therapies in the medicine and dentistry fields. 1 Laser irradiation has a variety of mechanical and biological effects on the target tissue depending on the power, irradiation time, and wavelength. 2 Er:YAG and Er,Cr:YSGG lasers are superficially absorbed-type lasers that can be applied in both soft and hard tissue ablation. 1 –3
Recently, the potential of laser irradiation in bone ablation has received increased attraction. 4 Especially, recent studies suggest that Er:YAG and Er,Cr:YSGG lasers are the most optimal lasers for bone ablation compared with other lasers, such as CO2 and Nd:YAG, because they produce effective bone ablation with minimal thermal degeneration under water spray. 2 Water molecules at the superficial layer of bone tissue evaporate as they absorb laser energy, increasing intratissue pressure and producing vapor within the tissue to provoke a micro-explosion to cause mechanical breakdown of the tissue, physically contributing to the ablation process. 5,6 Due to its strong absorptivity to water, the bone surface ablated by Er:YAG laser undergoes minimal thermal degeneration 7,8 and the micro-explosion physically creates a specific surface. 9 –11
Since the surface structure of Er:YAG laser-ablated bone has been reported to be favorable for fibrin attachment, 9 –11 Er:YAG laser may be an innovative tool for tissue engineering. Regarding bone regeneration, scaffold is one of the key factors in regenerative medicine. 12 Novel strategies for stem cell attachment 13 and superficial structures of biomaterials 14 have previously been reported. Moreover, combination of nanotechnology within a biomaterial scaffold has shown development in bone regeneration. 15
Previous studies reported that bone healing outcomes following Er:YAG laser ablation were better than those following conventional mechanical bone ablation, including steel bur. 9,10,16 Although the mechanisms of the laser ablation process and bone healing have been determined histologically, 4,7,10,17 the cellular mechanism of bone healing following laser ablation has not been elucidated.
Mechanical stress caused by laser ablation has gained attention for its ability to induce cell activation in the bone tissue, 18 even though the transduction pathway of this phenomenon is unknown. Cellular signaling is evoked by mechanical stress via mechanotransduction, and several biological components, such as p130 Crk-associated substrate (p130Cas) 19 and Yes-associated protein and transcriptional co-activator with PDZ-binding motif (YAP-TAZ), 20 have been reported as the receptors.
We previously observed gene expression in bone healing after Er:YAG laser ablation in a short term 9 ; however, the comprehensive and sequential biological response of bone healing that occurs following Er:YAG laser ablation has never been analyzed. Thus, this study was performed to evaluate comprehensive and sequential gene expression in the Er:YAG laser-ablated bone compared with that in the nontreated control bone.
Materials and Methods
Experimental animals and surgical design
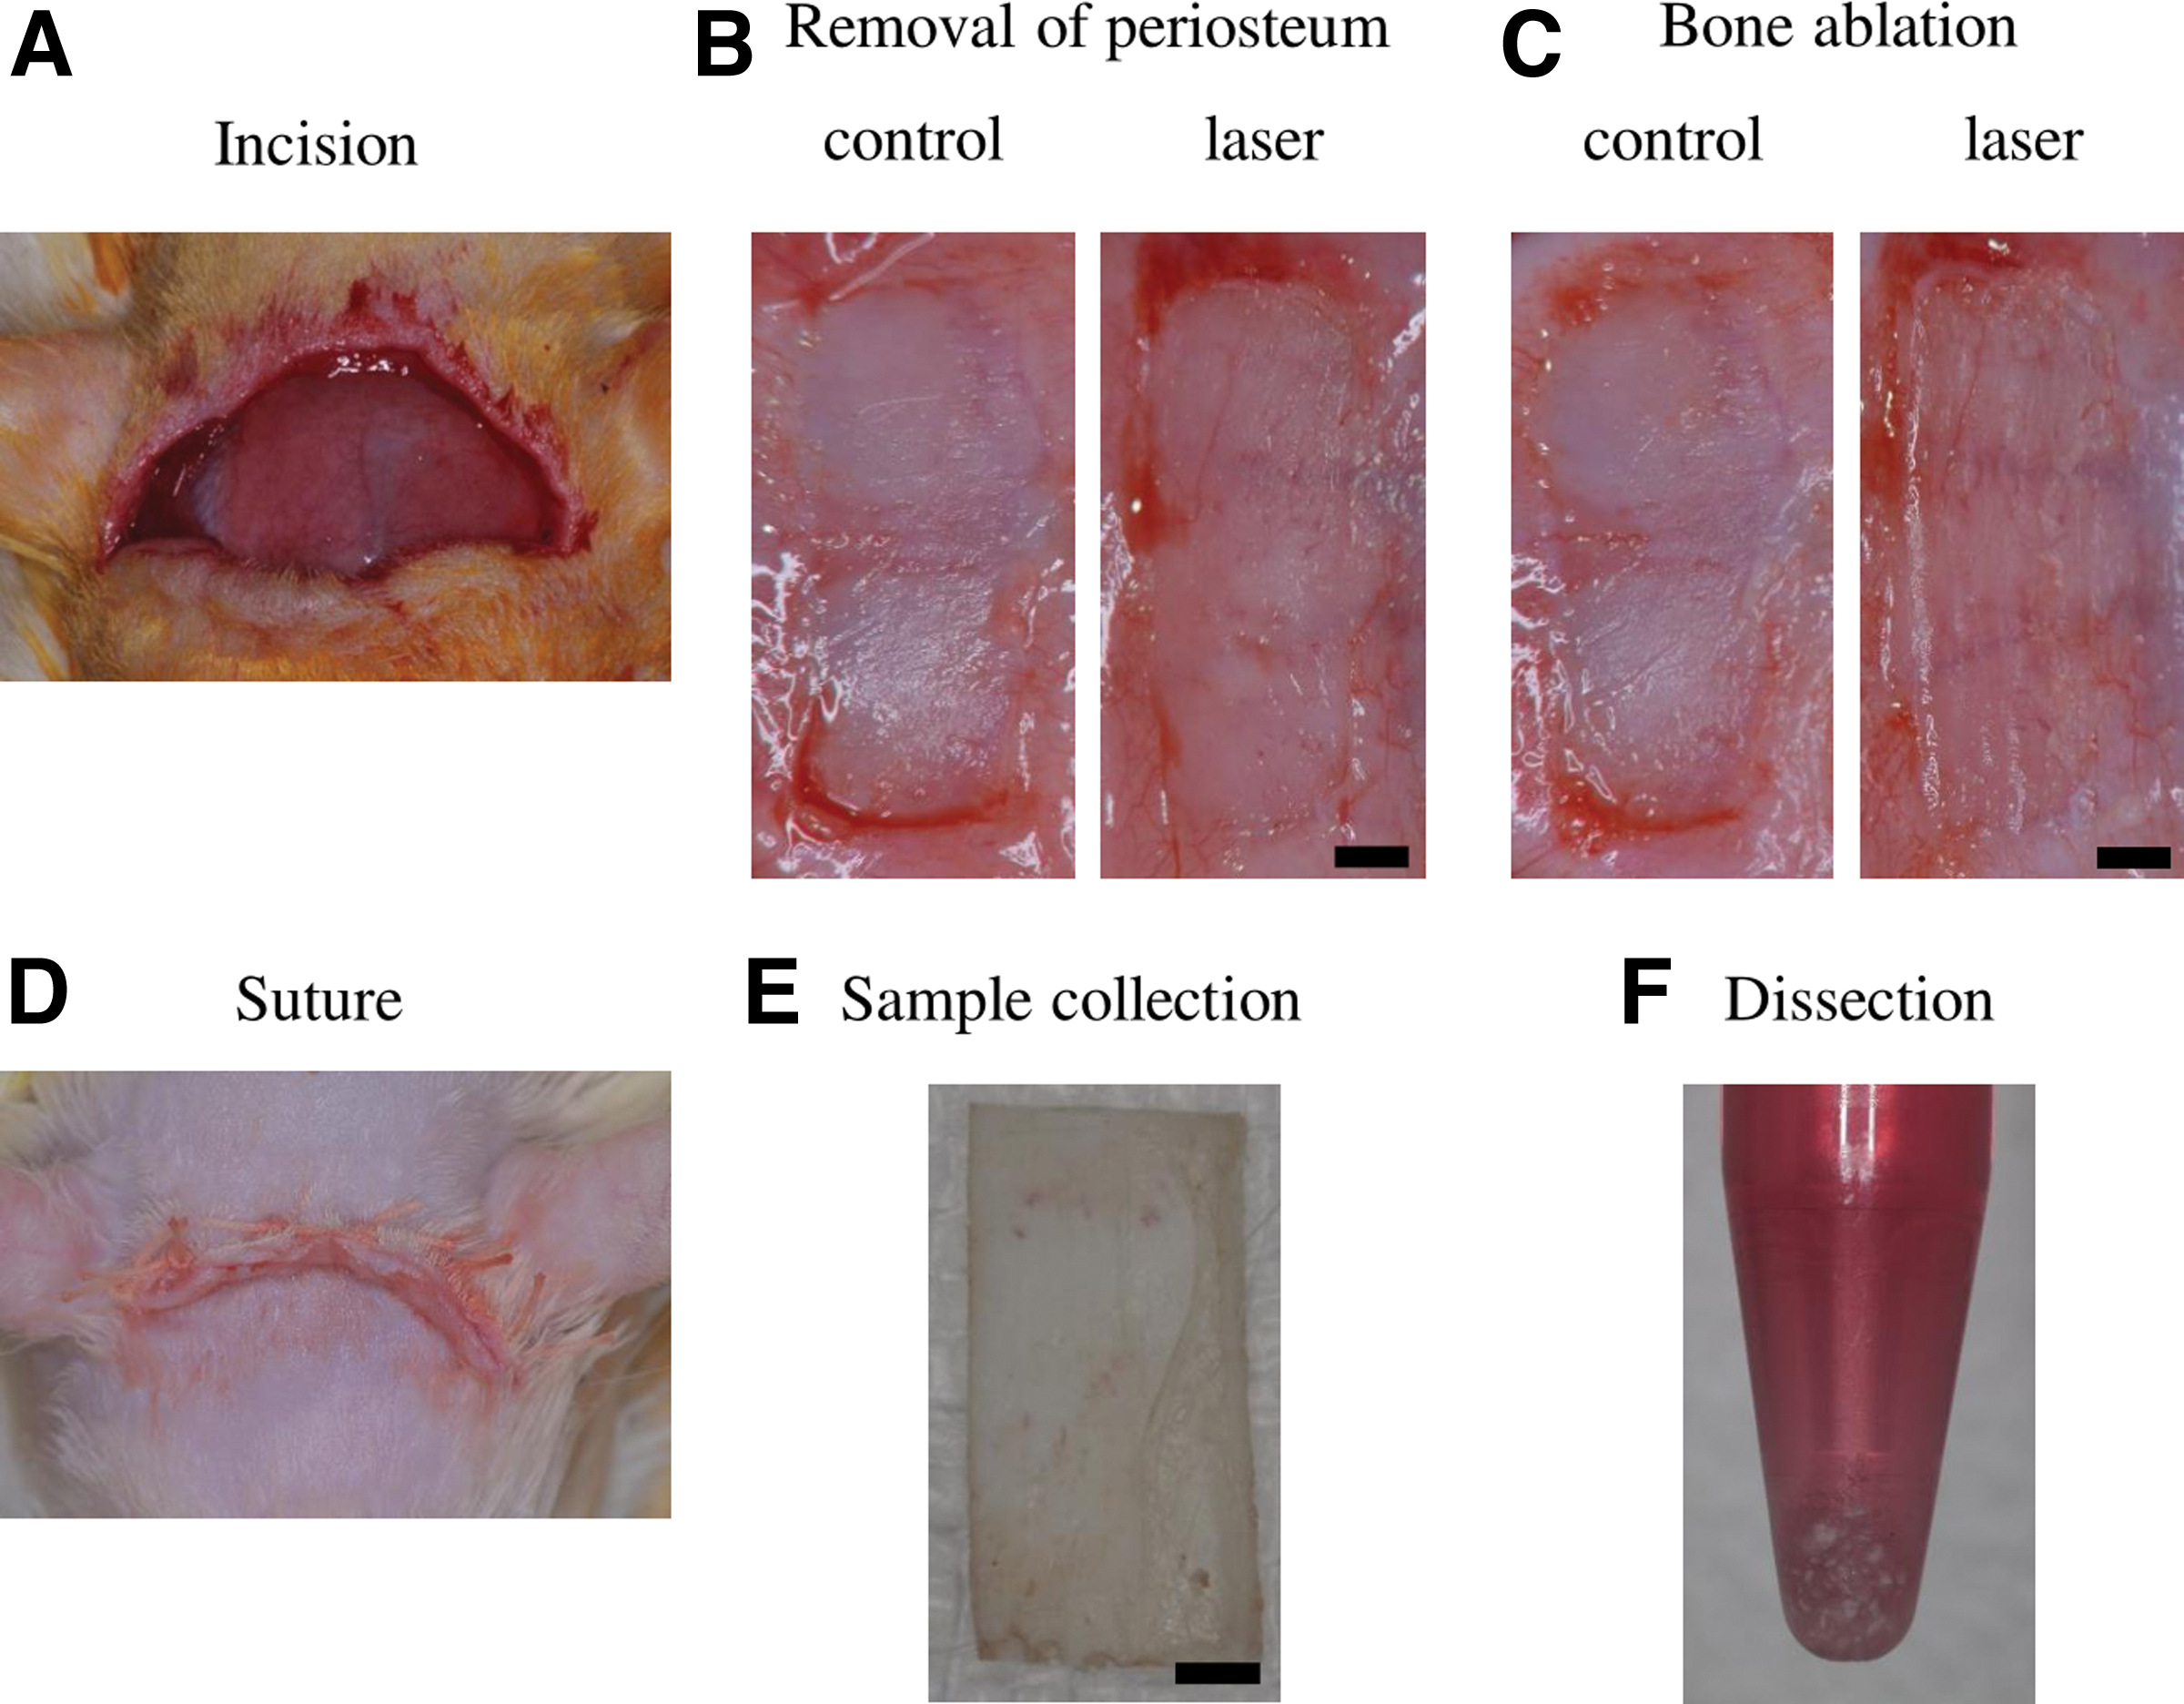
Twelve 10-week-old male Wistar rats purchased from Sankyo Labo Service Corporation (Tokyo, Japan) were used in this study. All animals were fed normal diet and maintained under normal laboratory conditions (24°C ± 1°C, 12L:12D, lights on 8:00 AM–8:00 PM) throughout the experiment. The animals were anesthetized by intraperitoneal injection of ketamine and xylazine (ketamine: 90 mg/kg and xylazine: 10 mg/kg). After making the skin incision (Fig. 1A), the calvarial bone was exposed.
Animal experiment and sampling protocol.
A pulsed Er:YAG laser (wavelength 2.94 μm; pulse duration 200 μsec; DELight; HOYA ConBio, Fremont, CA, USA) was used for uniform and superficial bone ablation to assess gene expression in the bone tissue ablated by Er:YAG laser (n = 4, at each time point).
After removing 3.5 × 10 mm2 of the periosteum from the exposed calvaria (Fig. 1B), bone ablation was performed using Er:YAG laser with an energy output of 127 mJ/pulse (panel setting: 220 mJ/pulse) at a pulse repetition rate of 20 Hz [energy density: 20.2 J/(cm2·pulse)]. The energy output was observed using a power meter (FieldMaster and detector LM-P10i; Coherent, Inc., Santa Clara, CA, USA). A chisel-type contact tip with a rectangular pointed head of 1.40 × 0.45 mm2 was applied for bone ablation (3 × 8 mm2) to the moistened surface at an incident angle of ∼30° in contact mode under saline water coolant (Fig. 1C). The speed of bone ablation by laser application was ∼2 mm/sec. For the nontreated control site, only the periosteum was removed (3.5 × 10 mm2) in the same rat to reduce individual differences among the rats.
The laser-ablated site and the control site were created on the temporal bone and the frontal bone, respectively, in the calvaria of the same rat with enough distance apart to avoid the systemic effect of laser. After hemostasis was confirmed, the skin flap was replaced and sutured at the end of these procedures (Fig. 1D), and then, 15 mg/kg cefalexin (CEFMETAZON®; Daiichi Sankyo Corp., Tokyo, Japan) was proactively injected intramuscularly. No physical deconditioning or death was observed in all cases.
Next, 6, 24, and 72 h after treatment, animals were sacrificed under overdose anesthesia (ketamine and xylazine). Bone tissues (3 × 8 mm2) were collected from nontreated and laser-ablated sites of one rat at each time point (n = 4, at each time point) using an electric saw under water spray to cut the calvaria and scissors to collect the exact size of the sample (Fig. 1E). Blood clot was washed out by saline solution.
All animal experiments were approved by the Institutional Animal Care and Use Committee of Tokyo Medical and Dental University (A2019-098C3).
RNA preparation and quantitative reverse transcription–polymerase chain reaction
The obtained bone samples were collected and dissected in 1 mL of the TRIzol reagent (Invitrogen, Carlsbad, CA, USA) (Fig. 1F). The dissected sample was put into the lysing matrix K (Funakoshi Co., Ltd., Tokyo, Japan) and set in FastPrep 24 Instrument Version 4 (Funakoshi Co., Ltd.). After 20 sec of vigorous vibration, samples were cooled down on ice. Thereafter, 200 μL of chloroform was added and vortex-mixing was performed twice for 15 sec with a 1 min interval at room temperature. Samples were then centrifuged at 15,000 rcf for 10 min at room temperature, and 500 μL of the RNA-containing supernatant was harvested. Total RNA was extracted from the supernatant using a NucleoSpin® RNA kit (TaKaRa Bio, Shiga, Japan) in accordance with the manufacturer's protocol.
Total RNA (100 ng) was reverse-transcribed to synthesize complementary DNA (cDNA) using PrimeScript™ RT Master Mix (TaKaRa Bio), and quantitative reverse transcription–polymerase chain reaction (qRT-PCR) was performed using the Thermal Cycler Dice® Real-Time System II (TaKaRa Bio). PCR mixtures were prepared using TB Green™ Premix Ex Taq™ II (TaKaRa Bio), and PCR conditions were determined according to the manufacturer's protocol. Gene expression levels were normalized to those of the reference gene, 18S ribosomal RNA. Then, delta CT values in control sites for each rat were set as “1,” and relative gene expression levels were evaluated. PCR primers used in this study are listed in Supplementary Table S1.
Microarray and data analysis
To make complementary RNA (cRNA), 50 ng of total RNA sample was labeled with Cy3 (Low Input Quick Amp Labeling Kit; Agilent Technologies, Santa Clara, CA, USA). The cRNA was then hybridized on an Agilent SurePrint G3 Unrestricted Gene Expression 8 × 60 K Microarray. Fluorescence signals from the hybridized microarrays were detected with an Agilent Microarray Scanner System. Feature Extraction Software (version 11.0.1.1; Agilent Technologies) was used to extract the raw microarray data.
Statistical analysis
Quantile normalization and log2-transformation 21 of the microarray data were executed using R (version 3.6.0). To identify the differentially expressed genes (DEGs), the Limma Bioconductor package (version 3.40.6) 22 was used. Principal component analysis (PCA) was conducted to visualize the genetic distance and relatedness among the samples. To account for multiple testing, Benjamini and Hochberg's false discovery rate (FDR) was applied. DEGs were defined having an FDR <0.1 and |fold-change| > 2.0.
Overrepresentation enrichment analyses for DEGs were carried out with the Database for Annotation, Visualization and Integrated Discovery using the Gene Ontology (GO) and Kyoto Encyclopedia of Genes and Genomes (KEGG) pathway databases. Gene set enrichment analysis
23
(GSEA,
Paired t-test was applied for the evaluation of messenger RNA (mRNA) expression levels between control and laser-ablated bones. Unpaired t-test with Bonferroni correction 25 was performed for multiple comparison of gene expression among different time points (at 6, 24, and 72 h) in laser-ablated bones.
Results
DEGs at 6, 24, and 72 h by microarray
To comprehensively compare gene expression during bone healing in the laser-ablated bone and nontreated control bone, microarray expression profiling was performed at different time points. All signals detected by microarray were normalized and annotated.
The gene expression patterns determined by PCA revealed different outcomes at each time point. The patterns clearly differed between control and laser-ablated bones at 6 and 24 h, although the difference was smaller at 72 h (Fig. 2A, D, G).
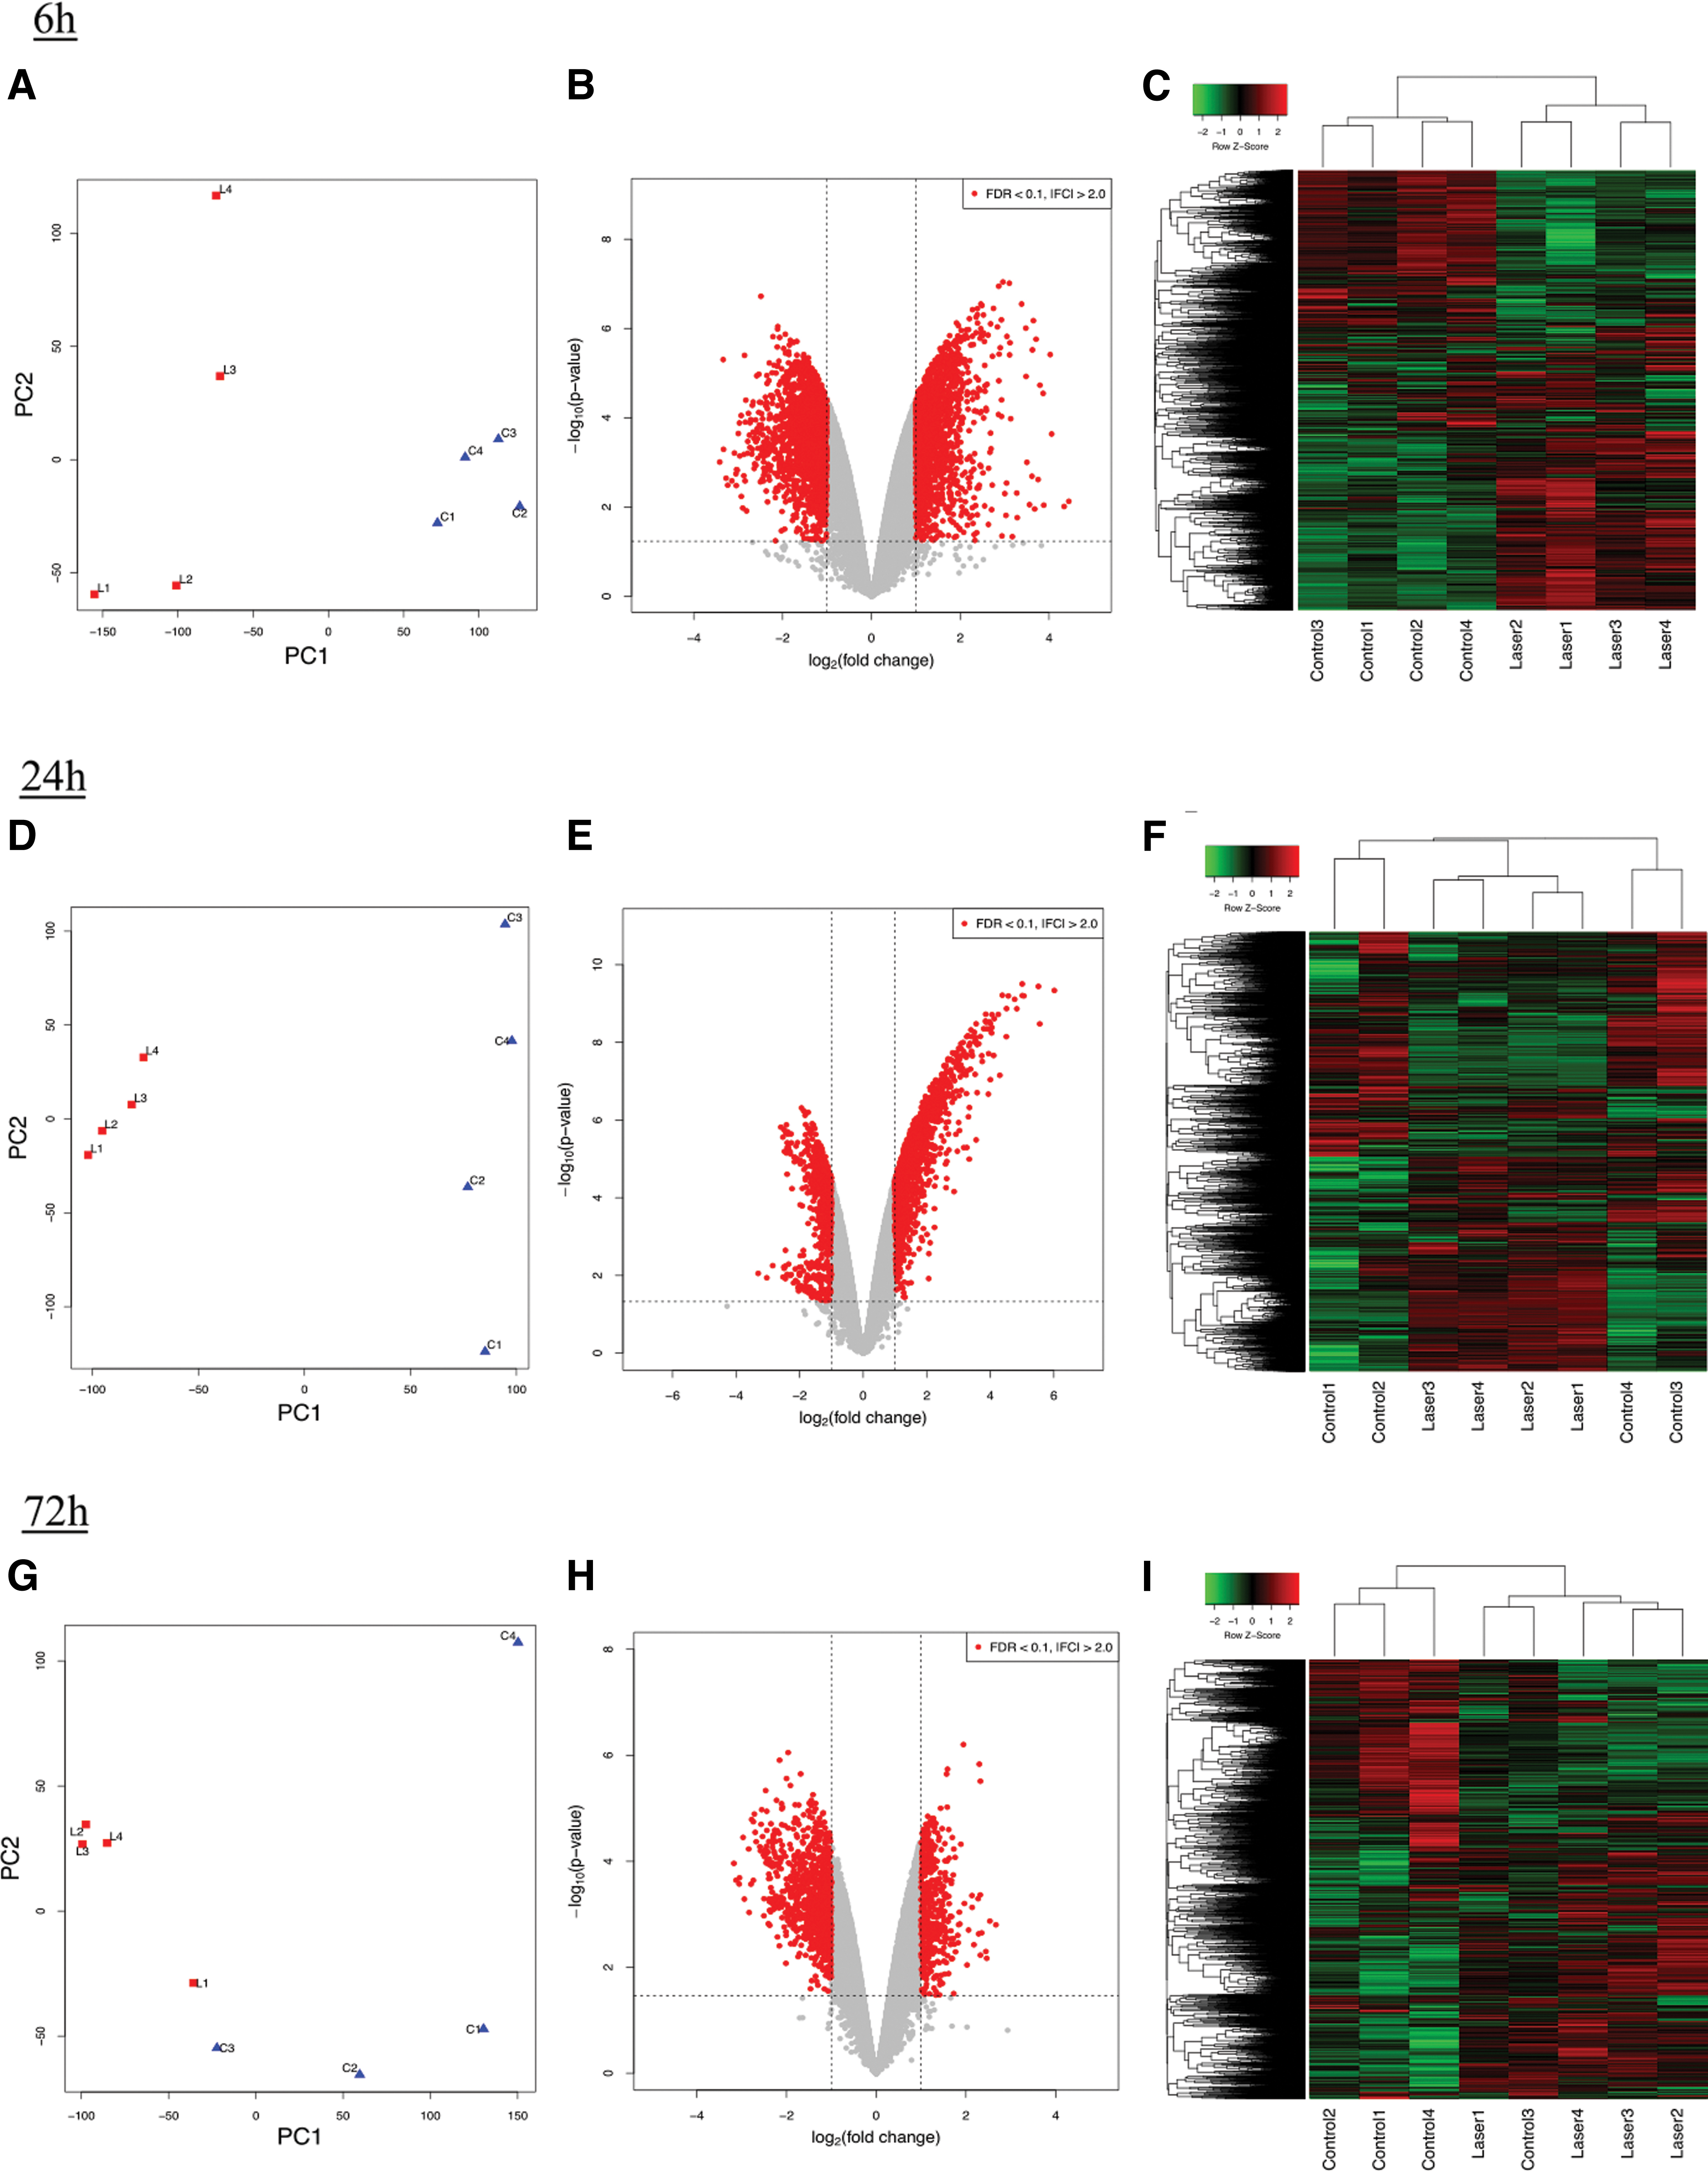
Comprehensive evaluation of gene expression between the laser-ablated bone and nontreated control bone using microarray expression profiling. Volcano plot shows genes with FDRq < 0.1 and |fold-change| > 2 as red points. Heat maps represent the Z-score of each gene expression after the log2-transformation (n = 4; green: low, red: high).
A total of 3323 DEGs were identified at 6 h, of which 1742 were upregulated in the laser-ablated bone. At 24 h, 2062 DEGs were identified, 1385 of which were upregulated. Only 1354 DEGs were observed at 72 h, of which 442 were upregulated. The total number of DEGs and upregulated DEGs in the laser-ablated bone were gradually decreased over the study period.
The volcano plots of the DEGs also resulted in different outcomes at each time point. The numbers of both upregulated and downregulated DEGs were similar at 6 h (Fig. 2B). In contrast, the number of upregulated DEGs was more than twofold higher than that of downregulated DEGs at 24 h (Fig. 2E). However, there were more than twofold downregulated DEGs than upregulated DEGs at 72 h (Fig. 2H).
Heat maps of clusterized whole-gene expression are shown in Fig. 2C, F, and I. At 6 h, the heat maps showed that the gene expression pattern clearly differed between control and laser-ablated bones (Fig. 2C). However, the clusterized heat maps indicated that the difference in the gene expression pattern between control and laser-ablated bones was sequentially reduced (Fig. 2F, I).
KEGG pathway analysis
KEGG pathway analysis was performed to identify enriched pathways in the laser-ablated bone. All enriched pathways with upregulated DEGs in the laser-ablated bone are shown in Supplementary Tables S2, S3, S4. Tables 1–3 show notable pathways with a Benjamini q < 0.1 at each time point.
Notable Kyoto Encyclopedia of Genes and Genomes Pathways in the Upregulated Differentially Expressed Genes at 6 h
KEGG, Kyoto Encyclopedia of Genes and Genomes.
Notable Kyoto Encyclopedia of Genes and Genomes Pathways in the Upregulated Differentially Expressed Genes at 72 h
Mmp3, matrix metalloproteinase-3; TFN, tumor necrosis factor.
The Hippo signaling pathway was significantly enriched (fold-enrichment = 3.0) at 6 h (Table 1) and nonsignificantly enriched at 24 h (q = 0.41, fold-enrichment = 2.1). The upregulated DEGs in the Hippo signaling pathway are shown in Fig. 3. Interestingly, gene expressions at the upstream of the Hippo signaling pathway, the FRMD and Mammalian Ste20-like kinase (MST1/2) genes, were upregulated at 6 h (Fig. 3A). Expression of these genes was not significantly upregulated at 24 h, whereas that of F-actin was significantly upregulated (Fig. 3B). Expression of genes at the downstream of the Hippo signaling pathway was upregulated at both 6 and 24 h (Fig. 3A, B).
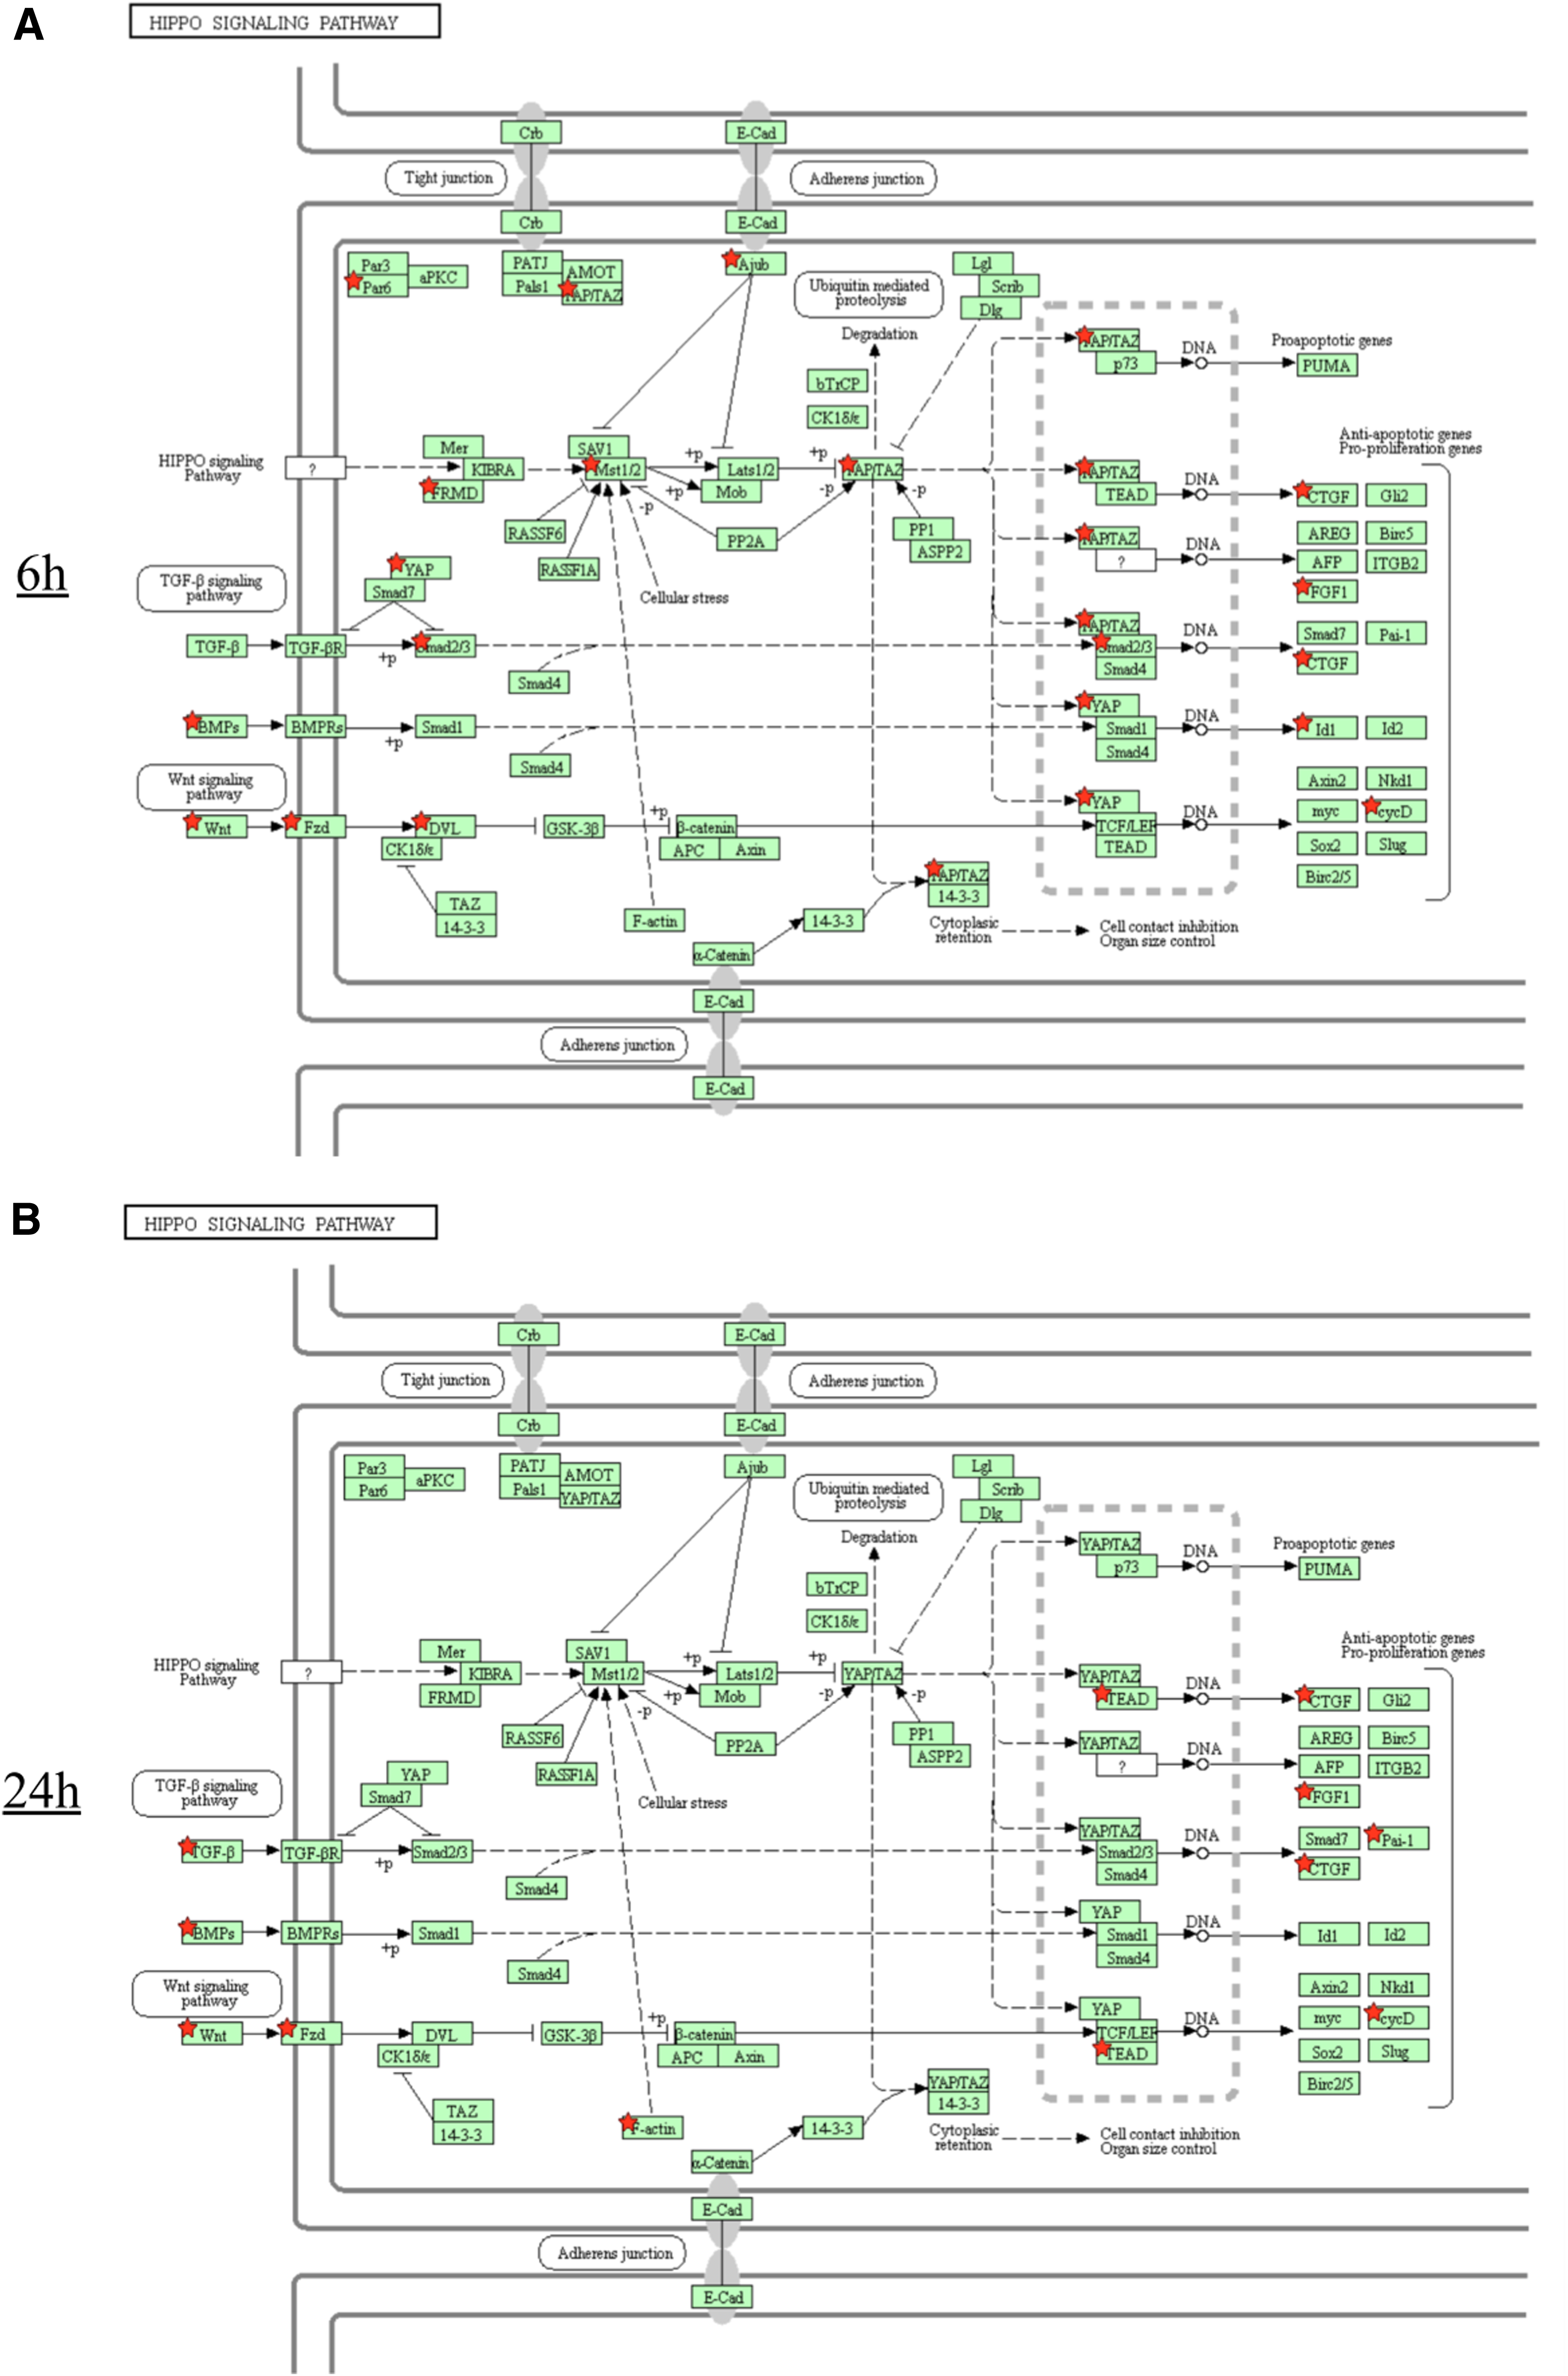
KEGG pathway analysis of upregulated DEGs in the Hippo signaling pathway in the laser-ablated bone. Red stars indicate upregulated gene expression.
Focal adhesion was enriched at all time points, showing sequential increases in fold-enrichment of 2.5, 3.5, and 4.1 at 6, 24, and 72 h, respectively. In focal adhesion, upregulation of Bcar1 was notable at 6 h (Tables 1–3).
Although pathways related to inflammation showed no significant enrichment at 6 h (Table 1), cytokine–cytokine receptor interaction was significantly enriched (fold-enrichment = 2.3) at 24 h (Table 2), followed by enrichment of the chemokine signaling pathway (fold-enrichment = 4.3), cytokine–cytokine receptor interaction (fold-enrichment = 3.8), and tumor necrosis factor (TNF) signaling pathway (fold-enrichment = 5.1) at 72 h (Table 3).
Notable Kyoto Encyclopedia of Genes and Genomes Pathways in the Upregulated Differentially Expressed Genes at 24 h
GO analysis
GO slim was used to evaluate upregulated DEGs in the laser-ablated bone at each time point (Benjamini q < 0.1); the results are shown in Supplementary Tables S5, S6, S7. In the biological process category, GO terms related to bone formation were mainly enriched at all time points (Tables 4–6). Interestingly, the GO term “response to mechanical stimulus” was significantly enriched at 24 h (fold-enrichment = 3.7) (Table 5) and 72 h (fold-enrichment = 4.8) (Table 6). No inflammatory-related GO terms were identified at 6 h (Table 4); however, “cellular response to IL-1” was identified at 24 h (fold-enrichment = 4.0) (Table 5) and 72 h (fold-enrichment = 7.3) (Table 6). Several other inflammation-related GO terms were identified at 72 h (Table 6).
Notable Gene Ontology Terms in the Upregulated Differentially Expressed Genes at 6 h
Notable Gene Ontology Terms in the Upregulated Differentially Expressed Genes at 24 h
Notable Gene Ontology Terms in the Upregulated Differentially Expressed Genes at 72 h
In the molecular function category, the bone formation-related GO terms Wnt-protein binding (fold-enrichment = 6.2), BMP receptor binding (fold-enrichment = 11.2), and frizzled bindings (fold-enrichment = 5.0) were identified at 6 h (Table 4), whereas the inflammation-related GO terms chemokine activity (fold-enrichment = 20.2), CCR chemokine receptor binding (fold-enrichment = 17.7), CXCR chemokine receptor binding (fold-enrichment = 28.0), cytokine activity (fold-enrichment = 4.3), and CCR2 chemokine receptor binding (fold-enrichment = 33.6) were identified at 72 h (Table 6).
Gene set enrichment analysis
GSEA was performed using hallmark gene sets to compare gene expression differences in the laser-ablated bone and nontreated control bone. The gene sets enriched in the laser-ablated bone (FDR q < 0.1) are shown in Table 7.
Gene Set Enrichment Analysis at 6, 24, and 72 h
UV, ultraviolet.
No inflammatory-related gene sets were identified at 6 h. At 24 h, inflammatory response [normalized enrichment score (NES) = 1.68, q = 0.04] (Fig. 4A) and TNF-α signaling via nuclear factor κB (NF-κB; NES = 1.56, q = 0.07) (Fig. 4C) were enriched, and a greater NES value was observed at 72 h for inflammatory response (NES = 1.80, q = 0.003) (Fig. 4B) and TNF-α signaling via NF-κB (NES = 1.95, q = 0.001) (Fig. 4D). In Fig. 4, the peak of the green line was shifted to the left, and more black lines were observed on the left side at 72 h, indicating greater enrichment of these gene sets at 72 h than at 24 h. At 72 h, IL2/STAT5 signaling (NES = 1.58, q = 0.02) and interferon-γ response (NES = 1.37, q = 0.09) were significantly enriched (Table 7).
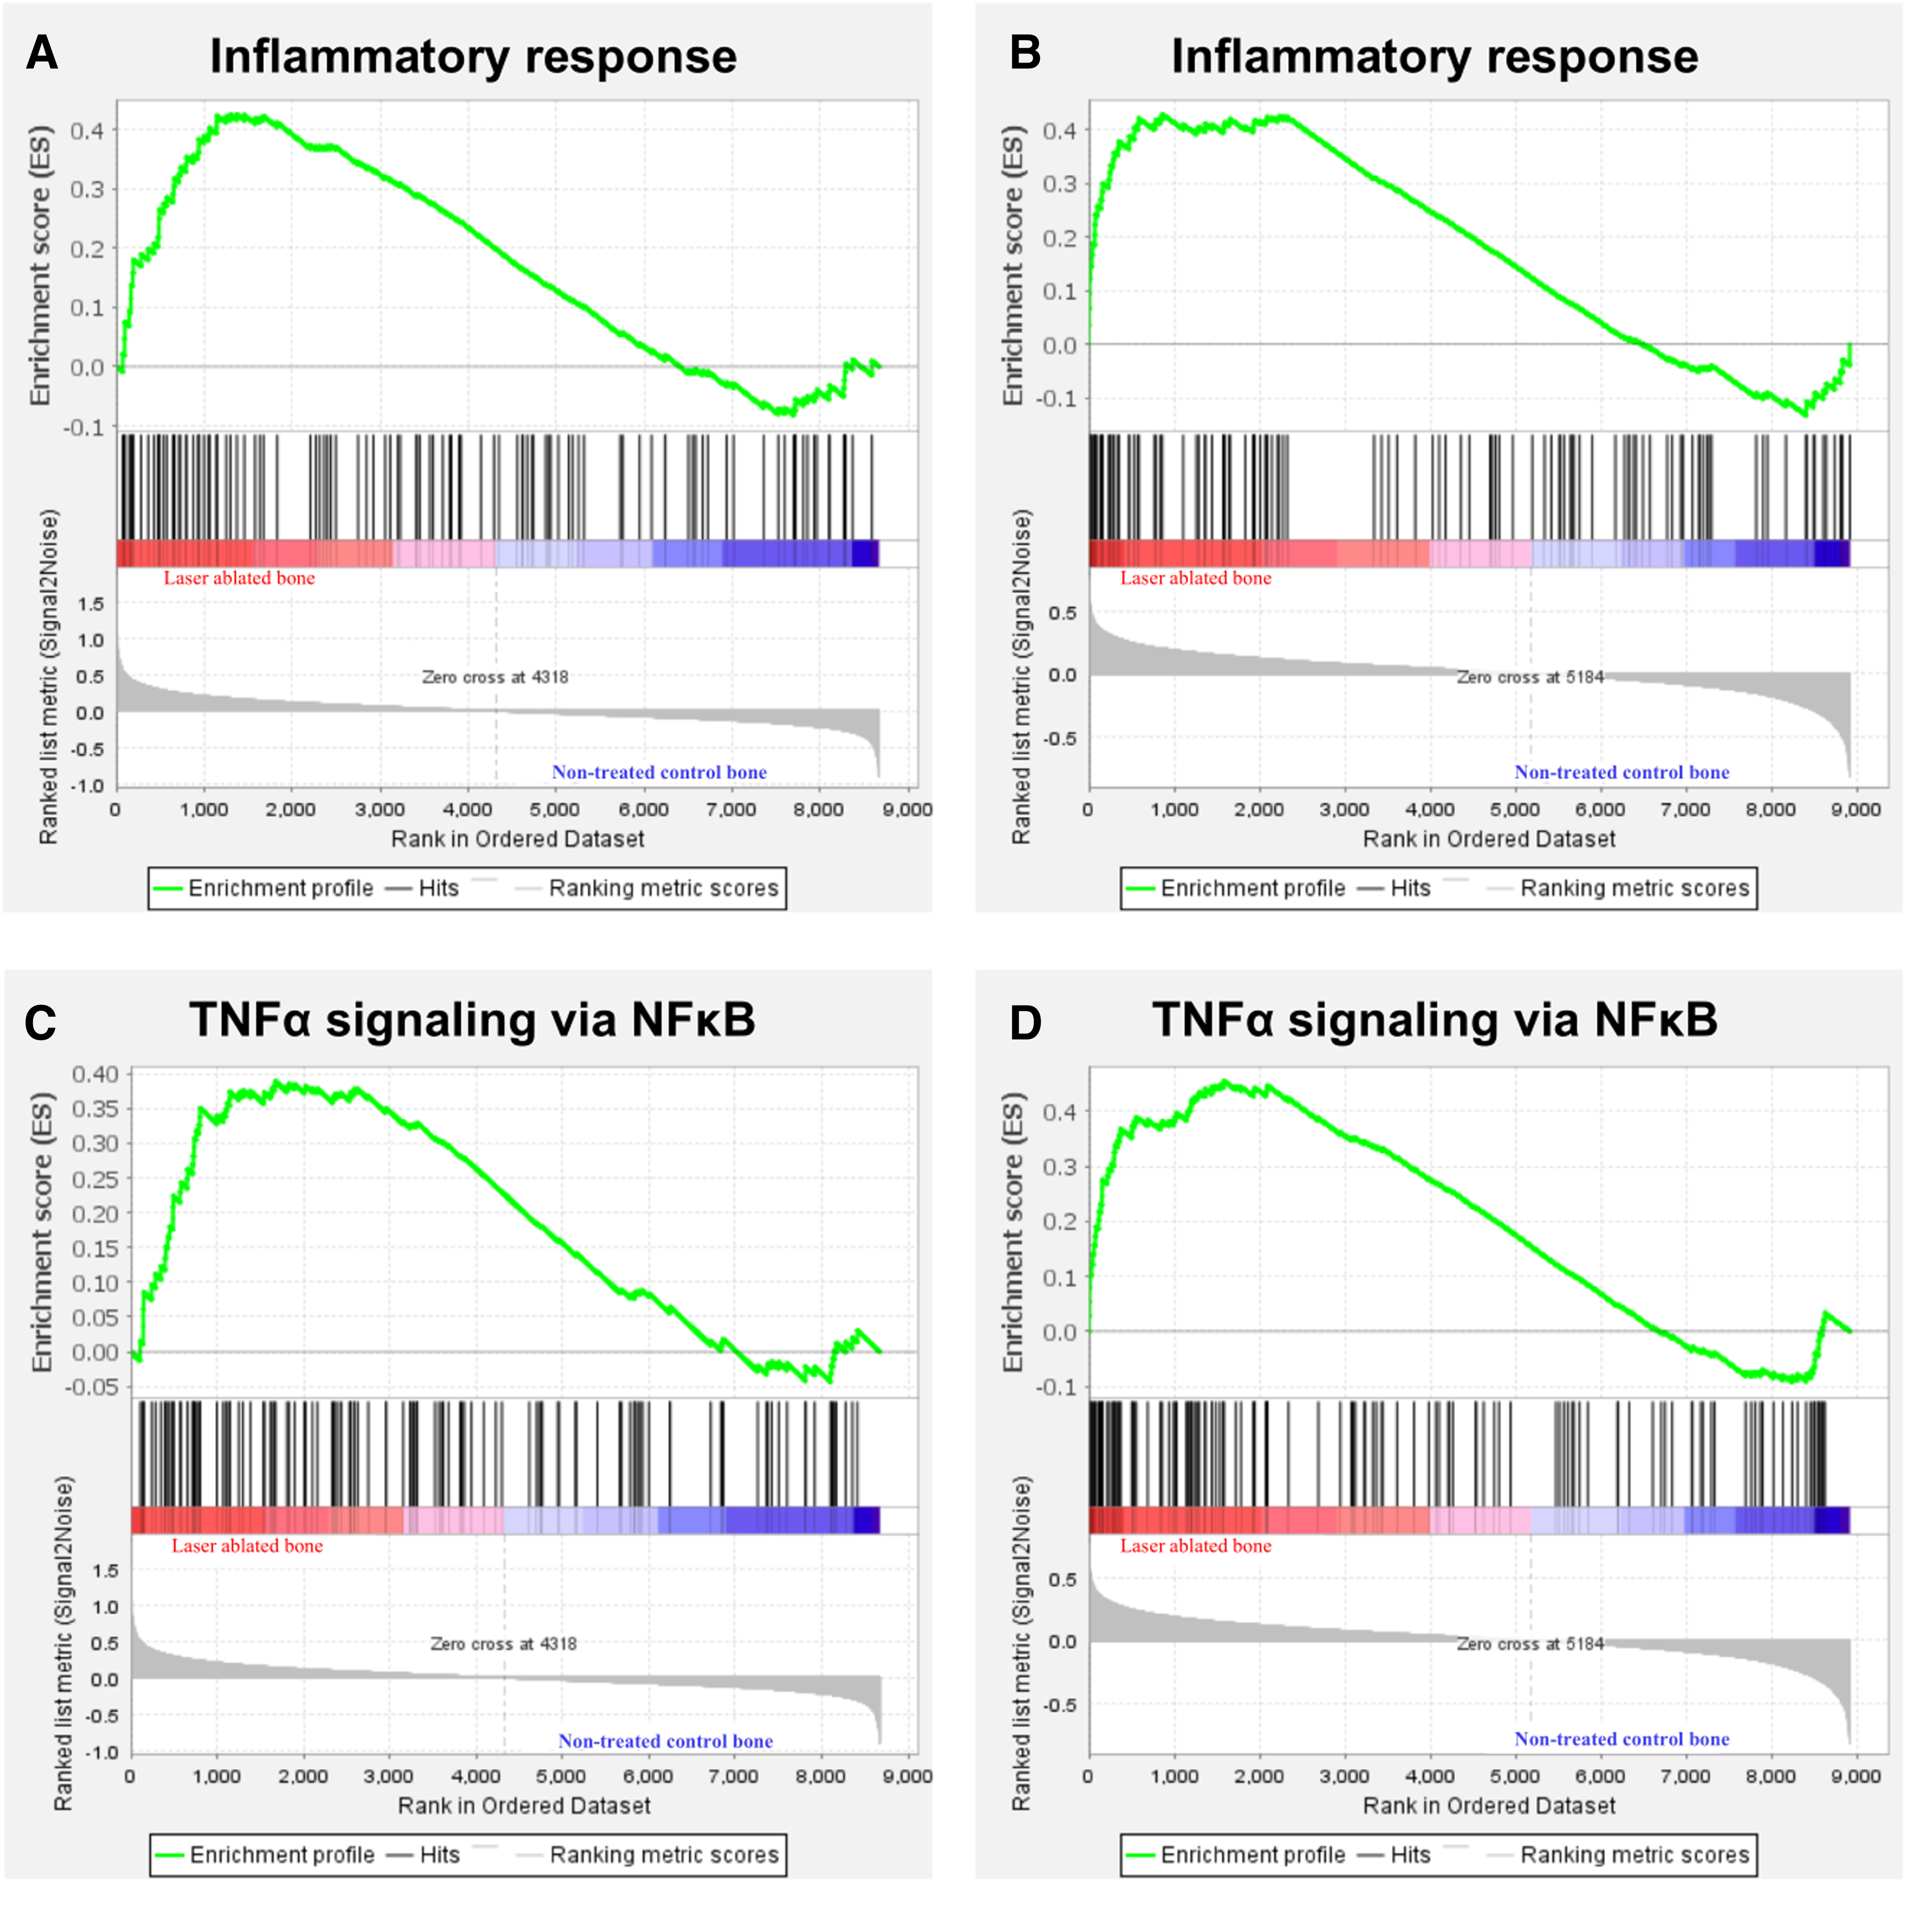
GSEA with hallmark gene sets enriched in the Er:YAG laser-ablated bone compared with the nontreated control bone (n = 4).
Gene expression levels in laser-ablated and nontreated control bones
Based on the results of the microarray analysis, mRNA expression levels of key genes related to mechanotransduction were validated by qPCR. Interestingly, gene expression of Bcar1 in the laser-ablated bone was increased sequentially (Fig. 5A). Additionally, gene expression of Actg1 was increased from 6 to 24 h in the laser-ablated bone (Fig. 5B).
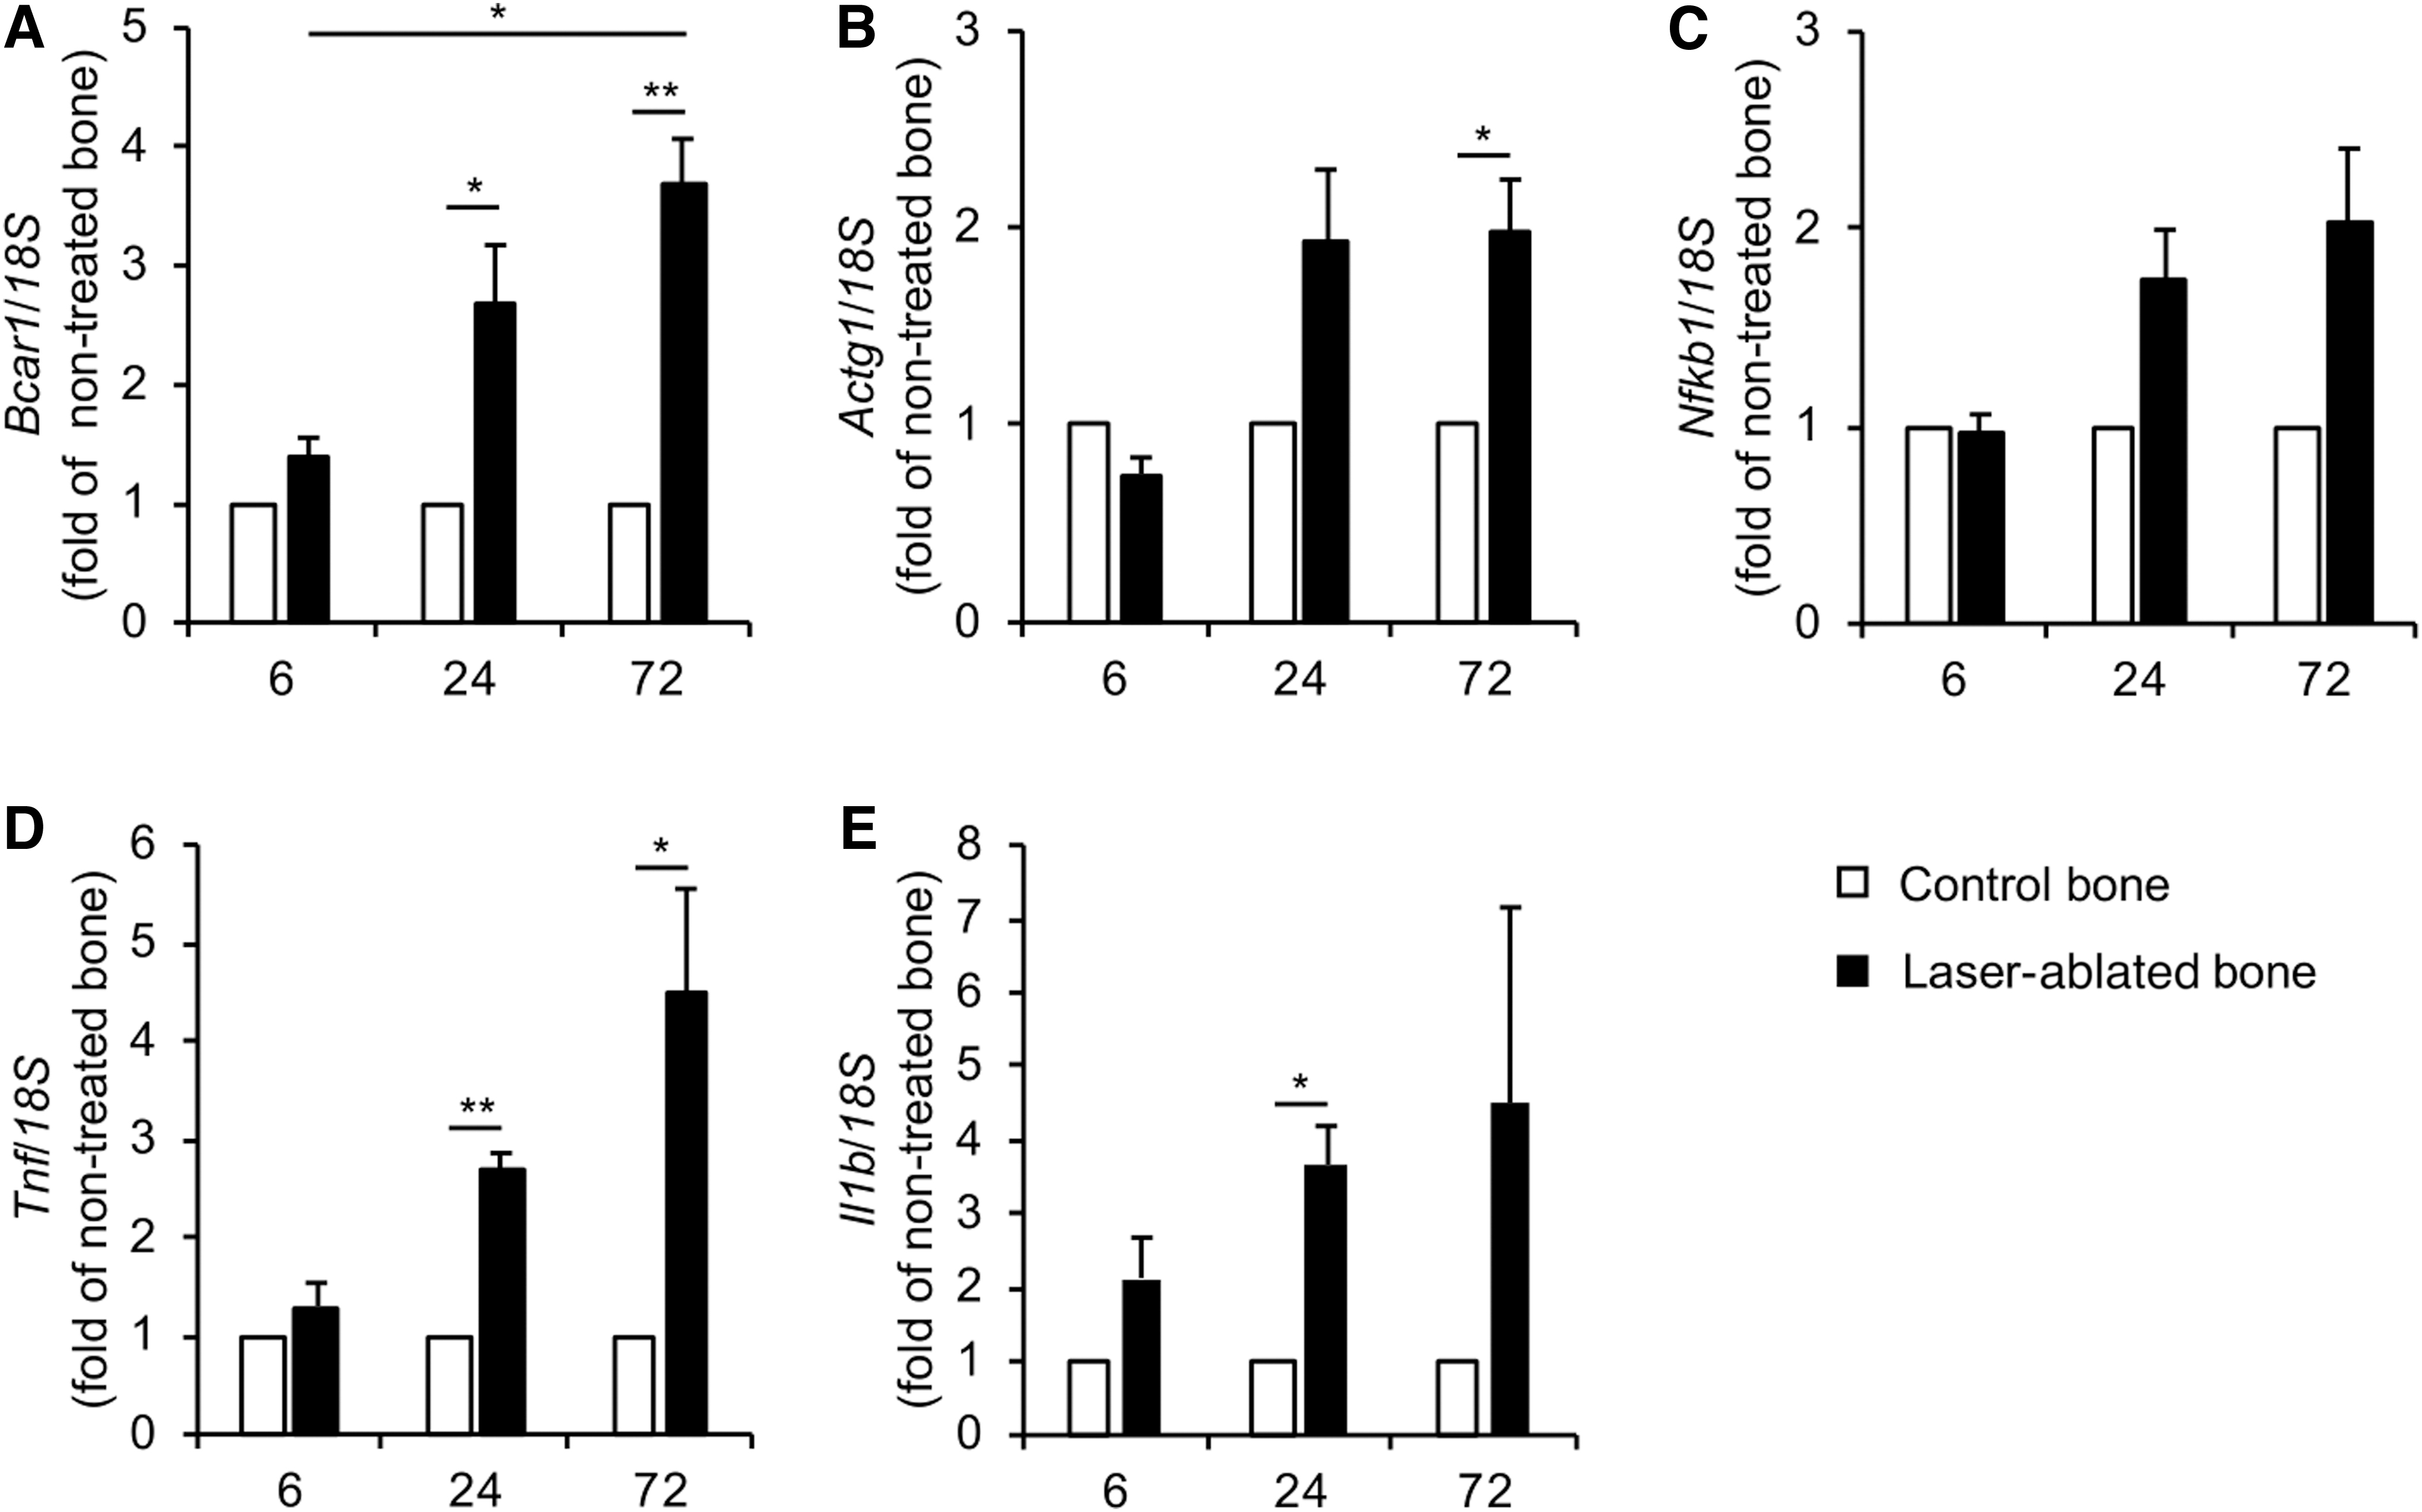
Gene expression by qPCR in bone tissue. qPCR analysis of
The mRNA expression level of the common genes related to inflammation, Nfkb1, Tnf, and Il1b, was also evaluated. Gene expression of those genes did not show significant increase in the laser-ablated bone at 6 h compared with that in the nontreated control bone, although their expressions were gradually increased at 24 and 72 h (Fig. 5C–E).
Discussion
A laser has the potential to induce mechanical stress, 18 and the effects of laser treatment on bone formation have been examined in various studies. 26,27 Some in vitro and in vivo studies showed that mechanical stress positively affects bone modeling; 28 however, the mechanism is unclear. Recent studies of mechanotransduction reported the cellular/molecular mechanism of signaling transduction pathways in response to mechanical stress, but only a few mechanoreceptor molecules, known as mechanotransducers, have been reported to date. 29 –31
Interestingly, our study revealed significant upregulation of Bcar1, which codes breast cancer anti-estrogen resistance 1 (BCAR1); an alias for p130Cas. BCAR1/p130Cas is a mechanotransducer, 32 which is key in mechanical loading-mediated bone homeostasis. 33 When BCAR1/p130Cas in focal adhesion is physically extended, its internal structure is phosphorylated leading to the activation of downstream signaling. 19 In other studies, Cas phosphorylation was reported to be evoked by shear stress, 34 which modulates the cell contractility. 35 Additionally, a pulsed laser has been reported to induce shear stress. 36 Possibly, cells underlying the laser-ablated bone surface have been stimulated by the repulsive force of the micro-explosion caused by Er:YAG laser. From the perspectives described above, our results indicated that Er:YAG laser irradiation enhanced the mechanotransduction by increasing the gene expression of BCAR1/p130Cas.
We also observed enrichment of the Hippo signaling pathway in the laser-ablated bone. Specifically, upregulation of gene expression at the upstream of the pathway, including MST1/2, was detected at 6 h, with upregulation of F-actin gene expression observed at 24 and 72 h.
The Hippo signaling pathway plays a key role in regulating organ size, tissue homeostasis, repair, regeneration, cell metabolism, and tumorigenesis 37 and is reportedly sensitive to mechanical stimulation. 20,38 This pathway can also promote osteogenesis via the core effector Yes-associated protein and transcriptional co-activator with PDZ-binding motif (YAP/TAZ), a known mechanotransducer. 39 When the Hippo signaling pathway is activated, the MST1/2 and LATS1/2 kinases phosphorylate YAP/TAZ, which is sequestered in the cytoplasm. 40 –42 When YAP/TAZ is dephosphorylated, either by inactivation of the Hippo signaling pathway or by the upregulation of F-actin that is induced by mechanical stress, 20 YAP/TAZ translocates to the nucleus and mediates Hippo signaling pathway functions. 43,44
Surprisingly, Actg1 expression was increased from 6 to 24 h after laser ablation. Moreover, translocation of YAP to the nucleus may also occur by nuclear flattening resulting from mechanical force, 45 and there is a possibility that this biological effect occurred in the laser-ablated bone tissue. Accordingly, mechanical stress by Er:YAG laser irradiation may regulate the Hippo signaling pathway by physically affecting F-actin and YAP/TAZ, which possibly leads to the translocation of YAP/TAZ to mediate biological functions. Furthermore, the GO term “response to mechanical stimuli” in the biological process was significantly enriched at 24 and 72 h. A progressive new bone formation was observed in the Er:YAG laser-ablated bone in the previous studies. 9,46
Considering the above, we suppose that cellular signaling in the bone tissue is enhanced by the mechanical stress of Er:YAG laser irradiation, which positively influences progressive new bone formation in laser-ablated bone defects. Although further study is required, our results indicated that the mechanotransducers, BCAR1/p130Cas and F-actin, may be one of the key molecules for Er:YAG laser irradiation.
Generally, healing of injured bone is preceded by an acute inflammation evoked by immune cells in the hematoma. Granulation tissue and new bone are formed after the resolution of inflammation. 47 In contrast, laser is known to exert anti-inflammatory effects by reducing the mediators and number of inflammatory cells in rats. 48 Laser may also be effective for systemic conditions related to the inflammatory response to superinfections, such as oxidative stress. 49 We previously reported that Mmp3 (matrix metalloproteinase-3) and Cxcl6 (granulocyte chemotactic protein-2) were not increased in the laser-ablated bone compared with the nontreated control bone at 6 h. 9
Regarding the effects of laser on bone remodeling, we reported previously that low-level Er:YAG laser irradiation increased the proliferation of osteoblasts. 50 We also observed the increase of Dmp1, which is a marker of osteocytes, 51 and the decrease of Sost, which codes for sclerostin, following bone ablation by Er:YAG laser. 9 Sclerostin is one of the proteins that suppress bone formation. 52
Our present study showed no significant enrichment of KEGG pathways, GO terms, and gene sets related to inflammation in the laser-ablated bone at 6 h, whereas those related to bone formation were significantly enriched at the same time point. At 24 and 72 h, KEGG pathways, GO terms, and gene sets related to inflammation were gradually increased. In fact, mRNA expression of inflammation-related genes, Nfkb1, Tnf, and Il1b, showed the same results. Bone formation-related KEGG pathways and GO terms were also increased sequentially. These results suggested that Er:YAG laser irradiation may suppress inflammatory mediators/cells and also directly and positively affect cells relating to bone formation, but only in the early stage of bone healing.
Therefore, Er:YAG laser irradiation may have an advantageous effect on bone healing immediately after laser irradiation.
Previous reports suggested that enhancement of healing in the Er:YAG laser-ablated bone was partly ascribed to the favorable surface structure for cell attachment. 9 –11 Furthermore, we showed that the gene expression patterns of the laser-ablated bone and nontreated control bone clearly differed at 6 h, whereas the difference between these groups was gradually reduced in a sequential manner. Thus, in addition to the favorable surface structure of the laser-ablated bone, we predicted that laser-specific gene expression was enhanced within 24 h after ablation, which also may have positive effects on bone healing.
These advantageous effects on bone tissue may positively influence the healing of the laser-ablated bone. Er:YAG laser bone ablation and laser stimulation of bone tissue may have advantages in bone remodeling, particularly in the fields of osseous surgery and regenerative therapy.
However, we had some limitations in our study. Although n ≥ 3 is adequate for statistical analysis for microarray data, the number of rats might have been low. Since the microarray chip herein allowed maximum of eight samples to be applied on one chip, we decided on the number of samples (n = 4 in each group).
We focused on the comprehensive and sequential gene expression only in a short term, up to 72 h, by referring to a previous short-term study that investigated gene expression in the bone tissue following mechanical loading. 53 We have also attempted to exclude the influence of granulation tissue, which was formed at least 1 week after bone ablation without periosteum, 9 to evaluate pure biological response in the bone tissue. Thus, we supposed that short-term analysis, up to 72 h, was optimal for evaluating gene expression during the initial phase of bone healing. In addition, long-term analysis is required to evaluate changes in gene expression correlated with histological analysis.
Another limitation was that we could not evaluate protein expression. Evaluation of protein expression in the bone tissue required a relatively large amount of bone samples. 54 Since the bone samples in our present study were only 3 × 8 mm2, evaluation of protein expression was not suitable in this study model. Moreover, we did not have another control bone, such as mechanical bone ablation.
Therefore, additional studies involving long-term and quantitative analysis of key proteins with a mechanical ablation control group are required.
Conclusions and Summary
This is the first study to comprehensively and sequentially evaluate gene expression in ablated bone tissue following Er:YAG laser irradiation compared with that in nontreated control bone. Bone ablation by Er:YAG laser regulated the gene expression of Bcar1 and Actg1, which are the main regulators of mechanotransduction in the bone tissue. In addition, inflammation was gradually increased up to 72 h following bone ablation with Er:YAG laser, and laser influenced the expression of genes associated with bone formation immediately after irradiation. Therefore, mechanical stress and biological effects by Er:YAG laser irradiation may contribute to the wound healing of the laser-ablated bone tissue.
Footnotes
Acknowledgments
The authors would like to thank Mayumi Tamari, Division of Molecular Genetics, Research Center for Medical Science, The Jikei University School of Medicine for support, as well as the staff at Tokyo Medical and Dental University's experimental animal center.
Author Disclosure Statement
No competing financial interest exists.
Funding Information
This work was supported by the Japan Society for the Promotion of Science (16K11825 and 20K09971 to A.A., 17K11982 to S.K., and 20K18501 to Y.O.). This study was supported by Nanken-Kyoten, Tokyo Medical and Dental University.
Supplementary Material
Supplementary Table S1
Supplementary Table S2
Supplementary Table S3
Supplementary Table S4
Supplementary Table S5
Supplementary Table S6
Supplementary Table S7
References
Supplementary Material
Please find the following supplemental material available below.
For Open Access articles published under a Creative Commons License, all supplemental material carries the same license as the article it is associated with.
For non-Open Access articles published, all supplemental material carries a non-exclusive license, and permission requests for re-use of supplemental material or any part of supplemental material shall be sent directly to the copyright owner as specified in the copyright notice associated with the article.