




Abstract
Skeletal muscle fiber generation occurs principally in two myogenic phases: (1) Primary (embryonic) myogenesis when myoblasts proliferate and fuse to form primary myotubes and (2) secondary (fetal) myogenesis when successive waves of myoblasts fuse along the surface of the primary myotubes, giving rise to a population of smaller and more numerous secondary myotubes. This sequence of events determines fiber number and is completed at or soon after birth in most muscles of the mouse. The adult myostatin null mouse (MSTN −/−) displays both an increase in fiber number and size relative to wild type (MSTN +/+), suggesting a developmental origin for the hypermuscular phenotype. The focus of the present study was to determine at which point during myogenesis do MSTN −/− animals diverge from MSTN +/+. To achieve this, we focused on the extensor digitorum longus (EDL) muscle and evaluated primary myotube number at embryonic day (E) 13.0 and E14.5 and secondary to primary myotube ratios at E18.5. We show that primary myotube number and size were significantly increased in the MSTN −/− mice by E14.5 and the secondary to primary myotube ratio increased at E18.5. This increase in the rate of fiber formation resulted in MSTN −/− mice harboring 87% of their final adult fiber number at E18.5, compared to only 73% in MSTN +/+. An accelerated myogenic program in the MSTN −/− mice was further confirmed by our finding of an initial expansion in the myogenic stem cell (identified through Pax7 expression) and myoblast (identified through myogenin expression) cell pools at E14.5 in the EDL muscle of these animals that was, however, followed by a reduction of both populations of cells at E18.5 relative to MSTN +/+. Overall these data suggest that the genetic loss of myostatin accelerates the developmental myogenic program of primary and secondary skeletal myogenesis.
Introduction
The generation of myofibers occurs principally in two phases. The first wave of fusion gives rise to the primary myotubes which extend from tendon to tendon and express slow myosin heavy chain (MHC). 9 This population of myotubes establishes the basic muscle pattern and forms a scaffold for subsequent generations of myoblasts to proliferate, align, and fuse to form secondary myotubes. The phase of secondary (fetal) myogenesis takes place between embryonic day (E) 14.5 and E17.5 and is initiated close to the site of early innervation on the surface of the primary myotube. 10,11 The parent primary myotube and adherent secondary fibers are initially enclosed within a single basement membrane, although with increasing maturity, the secondary fibers acquire their own basement membrane. 10 Secondary myotubes are initially smaller relative to primaries at this developmental phase but gradually increase in size and go on to form mainly IIX/B fibers postnatally in the mouse, although the proportion that do this depends on individual muscles. 11 –13 Primary myotubes co-express embryonic and slow myosin. 14 –17
At present we have only a sketchy understanding of the molecular processes that determine adult fiber number. However, one crucial feature that is emerging is the need to have a regulated transition of cells from the precursor to the differentiated, fusion-competent myoblast state. The molecular basis of these underlying mechanisms is coming to light through the examination of genetically mutant animals.
One intriguing model is the myostatin null mouse (MSTN −/−). 18 Myostatin is a member of the transforming growth factor-β superfamily that has been recognized as a powerful inhibitor of skeletal muscle mass in a wide range of species, including humans. 19 Genetically modified mice lacking myostatin have a hypermuscular phenotype due to both fiber hypertrophy and hyperplasia. 18,20 Recent evidence suggests that myostatin acts in vivo to regulate the balance between proliferation and differentiation of embryonic muscle progenitors by enhancing their terminal differentiation. 21 Our previous work has shown that as well as displaying myofiber hypertrophy, the muscle of MSTN −/− animals is more glycolytic in its metabolic profile, and contains fewer satellite cells compared to that of the wild type (MSTN +/+). 22,23 Given that skeletal muscle is a highly adaptable tissue, the decreased frequency of slow fibers could arise from one of two major mechanisms. The first possibility is that, from the earliest stages of development, mice lacking myostatin have a reduced number of slow fibers. An alternative scenario is that the loss of myostatin leads to the development of slow fibers, but that these undergo a more robust transformation to fast fibers than in MSTN +/+ animals.
One molecular explanation for the hypermuscular phenotype of the MSTN −/− animals is through its ability, at embryonic stages, to induce the cell cycle inhibitor p21 and myogenic determination factor MyoD. Interestingly the outcomes of myostatin-mediated signaling on muscle development are the opposite of Notch signaling. 24 –27 Activation of this pathway leads to the expression of the transcription factor Hairy/Enhancer of Split, which subsequently represses the expression of MyoD. In the absence of MyoD, cells fail to initiate myogenic differentiation and the expression of p21, which normally facilitates cell cycle exit. 28 Notch signaling is associated with maintaining cells as precursors. Genetic loss of either the Notch ligand (Delta) or intracellular components of the cascade (e.g., the co-transcription factor RBP-J) leads to the depletion of the precursor pool and a transient increase in muscle differentiation. However, the long-term consequences of either mutation results in a severe decrease in the total number of myofibers, as well as a loss of satellite cells. 25 –27 The phenotype of the myostatin null argues for the fact that although this signaling molecule normally induces MyoD, in the absence of myostatin, other molecules must be in place that eventually allow MyoD to become upregulated. This could be achieved by dampening Notch-mediated signaling.
In this study, we aimed to determine the developmental origin of the myofiber hypertrophy and hyperplasia characteristic of the myostatin null phenotype. Our data show that primary myotube number was significantly increased in the MSTN −/− mice at E14.5 and the secondary to primary myotube ratio increased at E18.5. This increase in the rate of fiber formation resulted in MSTN −/− mice containing 87% of their final adult fiber number compared to just 73% in MSTN +/+ muscles at E18.5. These changes were accompanied by a decrease in the number of myotubes expressing slow MHC. Overall, these observations suggest that genetic loss of myostatin accelerates the developmental myogenic program of primary and secondary skeletal myogenesis. We suggest that very small changes in fiber number during early phases of primary myogenesis underpin the huge increase in fiber number that occurs prenatally. Furthermore, we propose that these fibers can then undergo expansion in an acellular fashion postnatally, thereby generating the massive degree of muscle hypertrophy displayed by MSTN −/− animals. Last, we show that the expression of Notch, an inhibitor of MyoD expression is reduced in MSTN −/− animals.
Materials and Methods
Animal maintenance
MSTN −/− founder mice on a C57B1/6 background were obtained from Prof. Lee at John Hopkins University School of Medicine. 18 MSTN −/−, MSTN +/−, and MSTN +/+ mice were bred and maintained in the biological resource unit of Reading University. Sibling MSTN −/−, MSTN +/−, and MSTN +/+ littermate embryos were obtained from time-mated females at embryonic days E13.0, E14.5, and E18.5 according to the day where a vaginal plug was found. Noon on the day when a plug was detected was considered as E0.5 postcoitum. Embryos from three to six different litters (for E13.0 MSTN +/+ [n = 4] and MSTN −/−) [n = 4], E14.5 MSTN +/+ [n = 12], MSTN +/−[n = 9], and MSTN −/−) [n = 16] and for E18.5 MSTN +/+ [n = 10], MSTN +/− [n = 15], and MSTN −/− [n = 15]) were included in this study. Embryos were genotyped for MSTN-mutated alleles by employing PCR on genomic DNA extracted from animal tail tips using the following primers: wild-type allele, sense AGAAGTCAAGGTGACAGACACAC, antisense GGTGCACAAGATGAGTATGCGG; knock-out allele, sense GGATCGGCCATTGAACAAGATG, antisense GAGCAAGGTGAGATGACAGGAG. All embryos were weighed prior to analysis.
Specimen collection
Adult animals were killed by cervical dislocation; embryos were killed by cardiac puncture, and the hind limbs were dissected. Specimens were embedded in tissue freezing medium and immersed in liquid nitrogen-chilled melting isopentane and stored at −80°C for further analysis. Serial transverse 9-μm cryosections were obtained from the ankle up to the knee in 70-μm intervals on the same object slide, allowing optimal section choice for the muscle midbelly.
Immunohistochemistry
Transverse midbelly sections from either adult hindlimb muscles or embryonic hind limbs were processed by immunohistochemical staining as previously described. 29 In brief, MHC type I, MHC pan, laminin, Pax7, myogenin, and Notch 1 were identified by using monoclonal A4.840 mouse immunoglobulin M (IgM) (1:1 Developmental Studies Hybridoma Bank, DSHB) (for embryonic tissue the expression of MHC I is an early event in skeletal myogenesis and is expressed concurrently with embryonic myosin 16 ); mouse monoclonal A4.1025 immunoglobulin G (IgG) (1:4 DSHB), rabbit polyclonal anti-Laminin IgG (1:200 Sigma), mouse monoclonal DSHB anti Pax7 IgG (1:1) supernatant, mouse monoclonal DSHB F5-D IgG anti-myogenin monoclonal, and rabbit polyclonal Notch 1 IgG (1:50 Sigma) primary antibodies, respectively. All primary antibodies were preblocked in wash buffer for 30 min prior to use and were incubated overnight at 4°C. Primary antibodies were visualized using Alexa Fluor 633 goat anti-mouse IgM (Molecular Probes, 1:200) for MHC I, Alexa Fluor 488 and 633 goat anti-rabbit IgG (Molecular Probes, 1:200) for laminin and Notch 1, and Alexa Fluor 488 goat-anti-mouse IgG (Molecular Probes, 1:200) for MHC pan, Pax7, and myogenin. Negative control stainings were included by omitting either the primary or the secondary antibodies in every set of immunohistochemical analysis. Slides were mounted using fluorescent mounting medium (Dako Cytomation) containing 2.5 μg/mL 4′,6-diamidino-2-phenylindole (DAPI) for nuclear visualization.
Imaging and analysis
Fluorescent images were captured using a Zeiss Axio Imager fluorescence microscope. Quantification of the total myotube number, percentage of slow MHC I (MHC type I+) and fast (Laminin+/MHC type I−) myotubes, myotube cross-sectional area (CSA), and Pax7+ and Myogenin+ cell counts were performed using Zeiss Axiovision software version 4.7 while blinded for genotype. Myogenin+ unfused cells were counted as those outside of the Laminin+ myofiber membrane on double-stained sections. Myotube number and MHC fiber type were quantified over each entire midbelly section of the embryonic extensor digitorum longus (EDL) muscle. Images of EDL muscle sections stained for Notch-1 from MSTN +/+ and MSTN −/− embryos were captured using the same exposure time. Quantification of the fluorescence intensity was performed using ImageJ analysis software.
Statistics
Data are shown as mean ± standard deviation (SD). Significant differences between groups for dependent variables were detected by using either one-way (MSTN +/+× MSTN +/− × MSTN −/−) analysis of variance (ANOVA), where data were normally distributed, followed by Bonferroni post hoc tests when ANOVA was significant or Student t-tests as appropriate. Where data were not normally distributed, the Kruskal–Wallis test was used along with Dunn multiple comparison analysis. A chi-squared analysis was used for the detection of differences of myotube CSA incidence (frequency of occurrence) between groups. Significant differences were considered as p ≤ 0.05.
Results
Embryo body mass changes at E14.5 and E18.5
There were no obvious morphological differences between MSTN +/+, MSTN +/−, and MSTN −/− mouse embryos at E14.5 (primary myogenesis). Measurements of body weight indicated a slight (7%) increase for the MSTN −/− compared to MSTN +/+ embryos, but this failed to achieve statistical significance (Fig. 1A). However, at E18.5 (secondary myogenesis), body weight showed a genotype-dependent increase according to the following pattern: Both MSTN +/− and MSTN −/− embryos were significantly heavier (18% and 27%, respectively) than the MSTN +/+ embryos, with the MSTN −/− being significantly heavier (11%) than MSTN +/−(Fig. 1B). This finding indicates that myostatin-deficient mice have already diverged from MSTN +/+ with respect to body weight during the late prenatal stages of development.
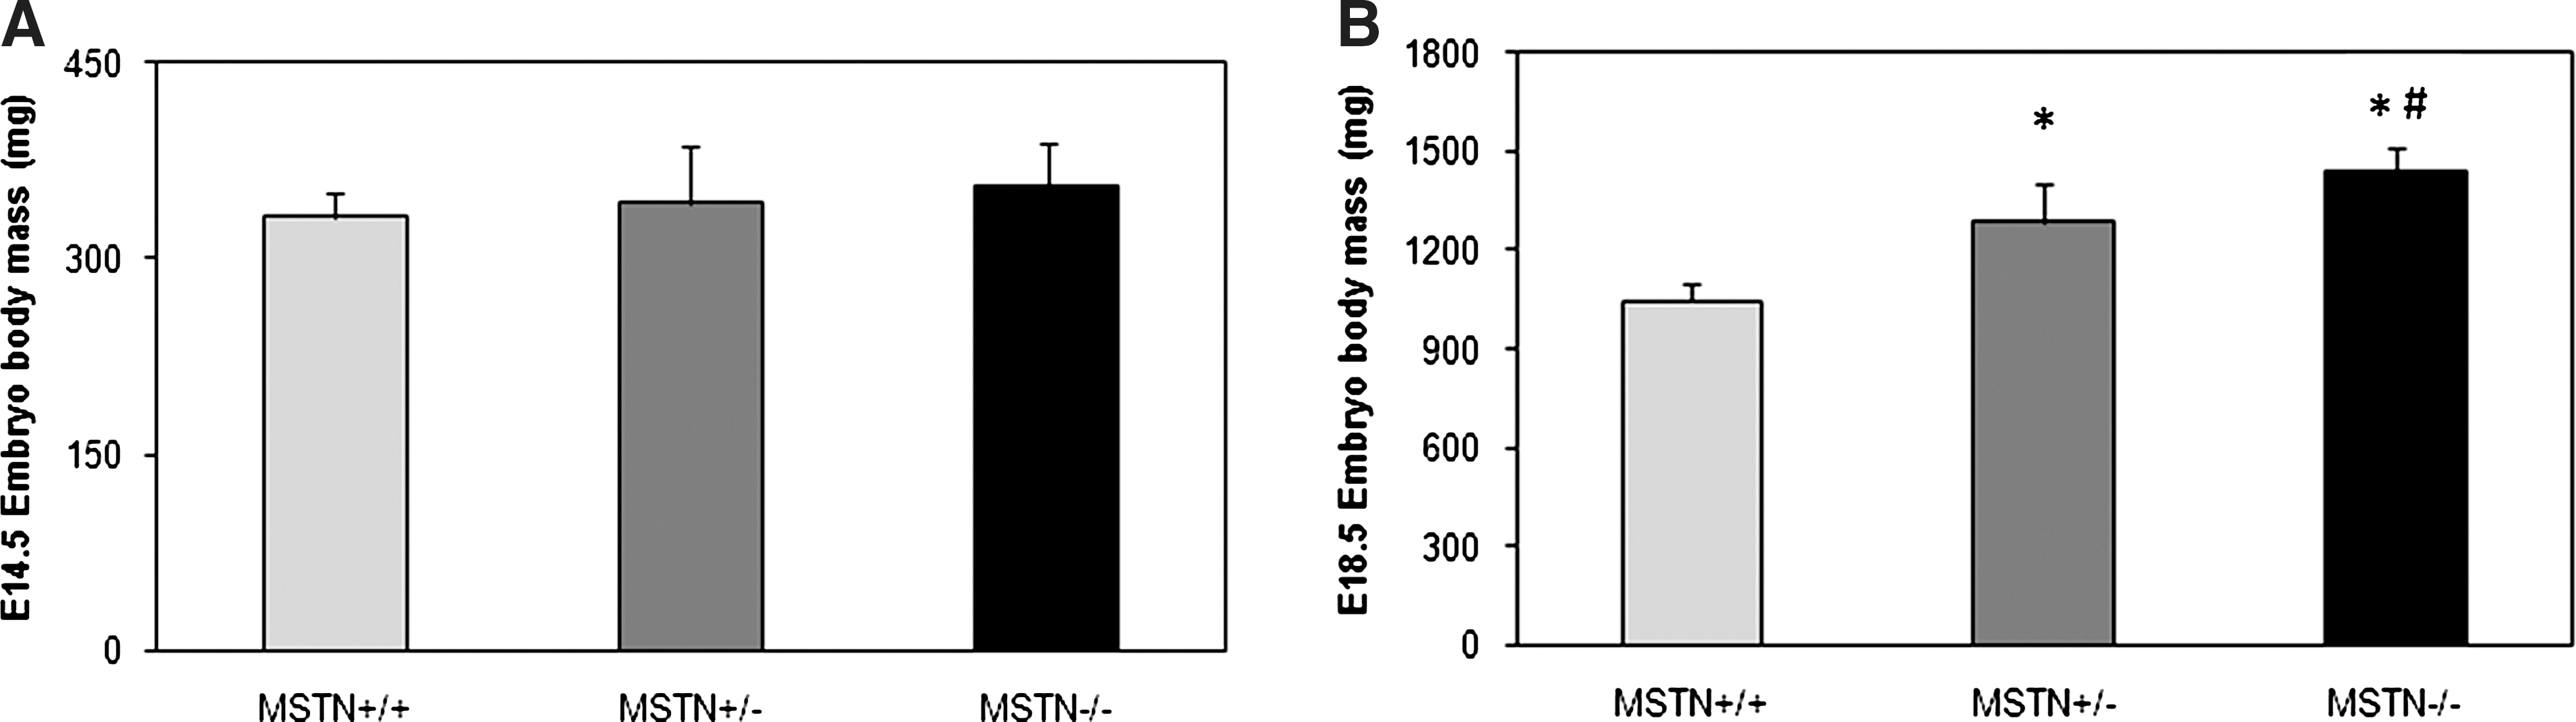
Embryo body mass changes: Body mass changes at (
Myostatin mutant embryos display myotube hyperplasia and hypertrophy of primary myotubes
Hindlimbs of embryos collected at E14.5 were cryosectioned and stained for myosin (using a pan-MHC antibody that stains all MHC isoforms) and laminin. Evaluation of the specimens revealed that the total number of fibers identified by either myosin or laminin staining was the same (data not shown), and thus only laminin was subsequently used to determine the total myotube number of the EDL muscle on transverse sections. We next double-stained specimens for MHC I (slow) and laminin to assess both the primary and total myotube number, respectively, (representative staining Fig. 2). One-way ANOVA revealed that EDL total primary myotube number at E14.5 was significantly higher in both MSTN +/− and MSTN −/− (12 and 20%, respectively) compared with MSTN +/+ embryos (Fig. 3D). In addition, MSTN −/− EDL total fiber number was significantly higher (7%) than MSTN +/−(Fig. 3D). This situation was mirrored in the tibialis anterior (TA) muscle at E14.5 (Fig 3H–I).

Immunohistochemical analysis of myostatin mutant muscle. (

Myotube hyperplasia and hypertrophy in myostatin mutant embryos at E14.5. (
Because MHC I antibodies recognize primary, but not secondary, myotubes, we expected that at E14.5 all fibers should be positive for this marker. However, we noticed that in the MSTN −/− embryos, a number were MHC I−, and quantification revealed that MSTN −/− embryos had significantly higher numbers of MHC I− fibers compared to both MSTN +/− and MSTN +/+ (Figs. 2A and 3E). In addition, the average cross-sectional area of EDL primary myotubes (MHC I+) revealed the incidence of significantly higher numbers of larger fibers in both MSTN +/− and MSTN −/− groups compared to MSTN +/+. Furthermore, MSTN −/− animals tended to have larger myotubes compared to MSTN +/−(Fig. 3F,G). Again, analysis of the TA muscle revealed similar increases in the number of MHC− myotubes and myotube size in MSTN −/− compared to MSTN +/+ embryos (Fig. 3J–K).
To pinpoint the exact developmental time point where the loss of myostatin induces initial myotube hyperplasia and hypertrophy, we performed a similar analysis of the EDL muscle from E13.0 embryos. We found no increases in primary myotube numbers in MSTN −/− muscles when compared to MSTN +/+ as defined by MHC I+ staining (Fig. 3A). Moreover, no significant increases in myotube diameter were apparent in MSTN −/− embryos when compared to MSTN +/+ at this stage (Fig. 3B,C). Comparison of the primary myotube population between E13.0 and E14.5 for each genotype revealed that MSTN +/+ embryos had the same number of primary myotubes at both stages (221 ± 9 vs. 226 ± 15 for E13.0 and E14.5, respectively). In contrast, the primary myotube number had increased from E13.0 to E14.5 in the MSTN −/− embryos (227 ± 30 vs. 258 ± 20, p = 0.02). These data indicate that the point of divergence between the MSTN −/− mice and control embryos is between E13.0 and E14.5.
Evidence of fiber type conversion at the end of secondary myogenesis in the MSTN−/− mouse
E18.5 fetal hindlimb transverse sections were stained for slow MHC type I and laminin. We detected a significant increase in total myotube number in the EDL muscle of both MSTN +/− and MSTN −/− animals compared to MSTN +/+. Furthermore, the EDL total myotube number was higher in MSTN −/− mice compared to MSTN +/− (Figs. 2B and 4A). In addition, the slow MHC type I fiber proportion was reduced in both MSTN +/− and MSTN −/− transgenic EDL muscle, with MSTN −/− mice showing an even lower percentage compared to MSTN +/− (Figs. 2B and 4B). Moreover, the MHC type I absolute fiber population of the EDL muscle at E18.5 was significantly lower in the MSTN −/− mice compared to both MSTN +/− and MSTN +/+ (134 ± 13 vs. 176 ± 8 vs. 176 ± 12, respectively, p < 0.01, data not shown). Interestingly, the relative percentage of slow type I fibers in the EDL at E18.5 compared to E14.5 revealed a significant reduction for both the MSTN +/− and MSTN −/− embryos compared to MSTN +/+ (Fig. 4C). It is worthy of mention that at this developmental stage, MSTN −/− EDL muscles harbor a myotube number that is much closer to the total fiber number observed in adult mice compared to MSTN +/+ (87% vs. 73%, respectively; Fig. 4E,F).

Myotube hyperplasia, hypertrophy and impaired oxidative fiber phenotype at E18.5. (
Examination of the average myotube CSA from the EDL at E18.5 showed the presence of significantly more large myotubes in MSTN −/− animals compared to both MSTN +/− and MSTN +/+, and also in MSTN +/− compared to MSTN +/+ (Fig. 4D). However the degree of EDL myotube hypertrophy in both developmental stages was much lower than that observed in the EDL myofibers from adult MSTN −/−) mice (19% and 14% vs. 43%; E14.5 and E18.5 vs. adult, respectively, Fig. 4G).
Estimation of the myonuclei/fiber ratio at E14.5 and secondary myotube formation potential
We next estimated the ratio of myonuclei/fiber in the EDL muscle at E14.5. An increased myonuclear number per myotube was apparent in both MSTN +/− and MSTN −/− compared to MSTN +/+ animals, and MSTN −/− tended to have higher values when compared to MSTN +/− animals (Fig. 5A). Examination of the total myonuclei number per myofiber in single fibers isolated from the EDL muscle at the postnatal day P1 revealed that MSTN −/− mice had significantly higher values than MSTN +/+ animals (51 ± 12 vs. 41 ± 7; p = 0.02, data not shown). Furthermore, to get an insight into the scaffolding potential of the primary myotubes at E14.5, we estimated the ratio of total primary fibers at E14.5 (when it is considered that primary myogenesis has largely been completed) to total myotube population at E18.5 (when it is considered that secondary myogenesis is well advanced). Intriguingly, we found that MSTN −/− mice had a significantly higher ratio compared to both MSTN +/+ and MSTN +/− animals (Fig. 5B), suggesting that the increased surface area of the primary myotubes was associated with the adherence of a greater number of secondary myotubes.
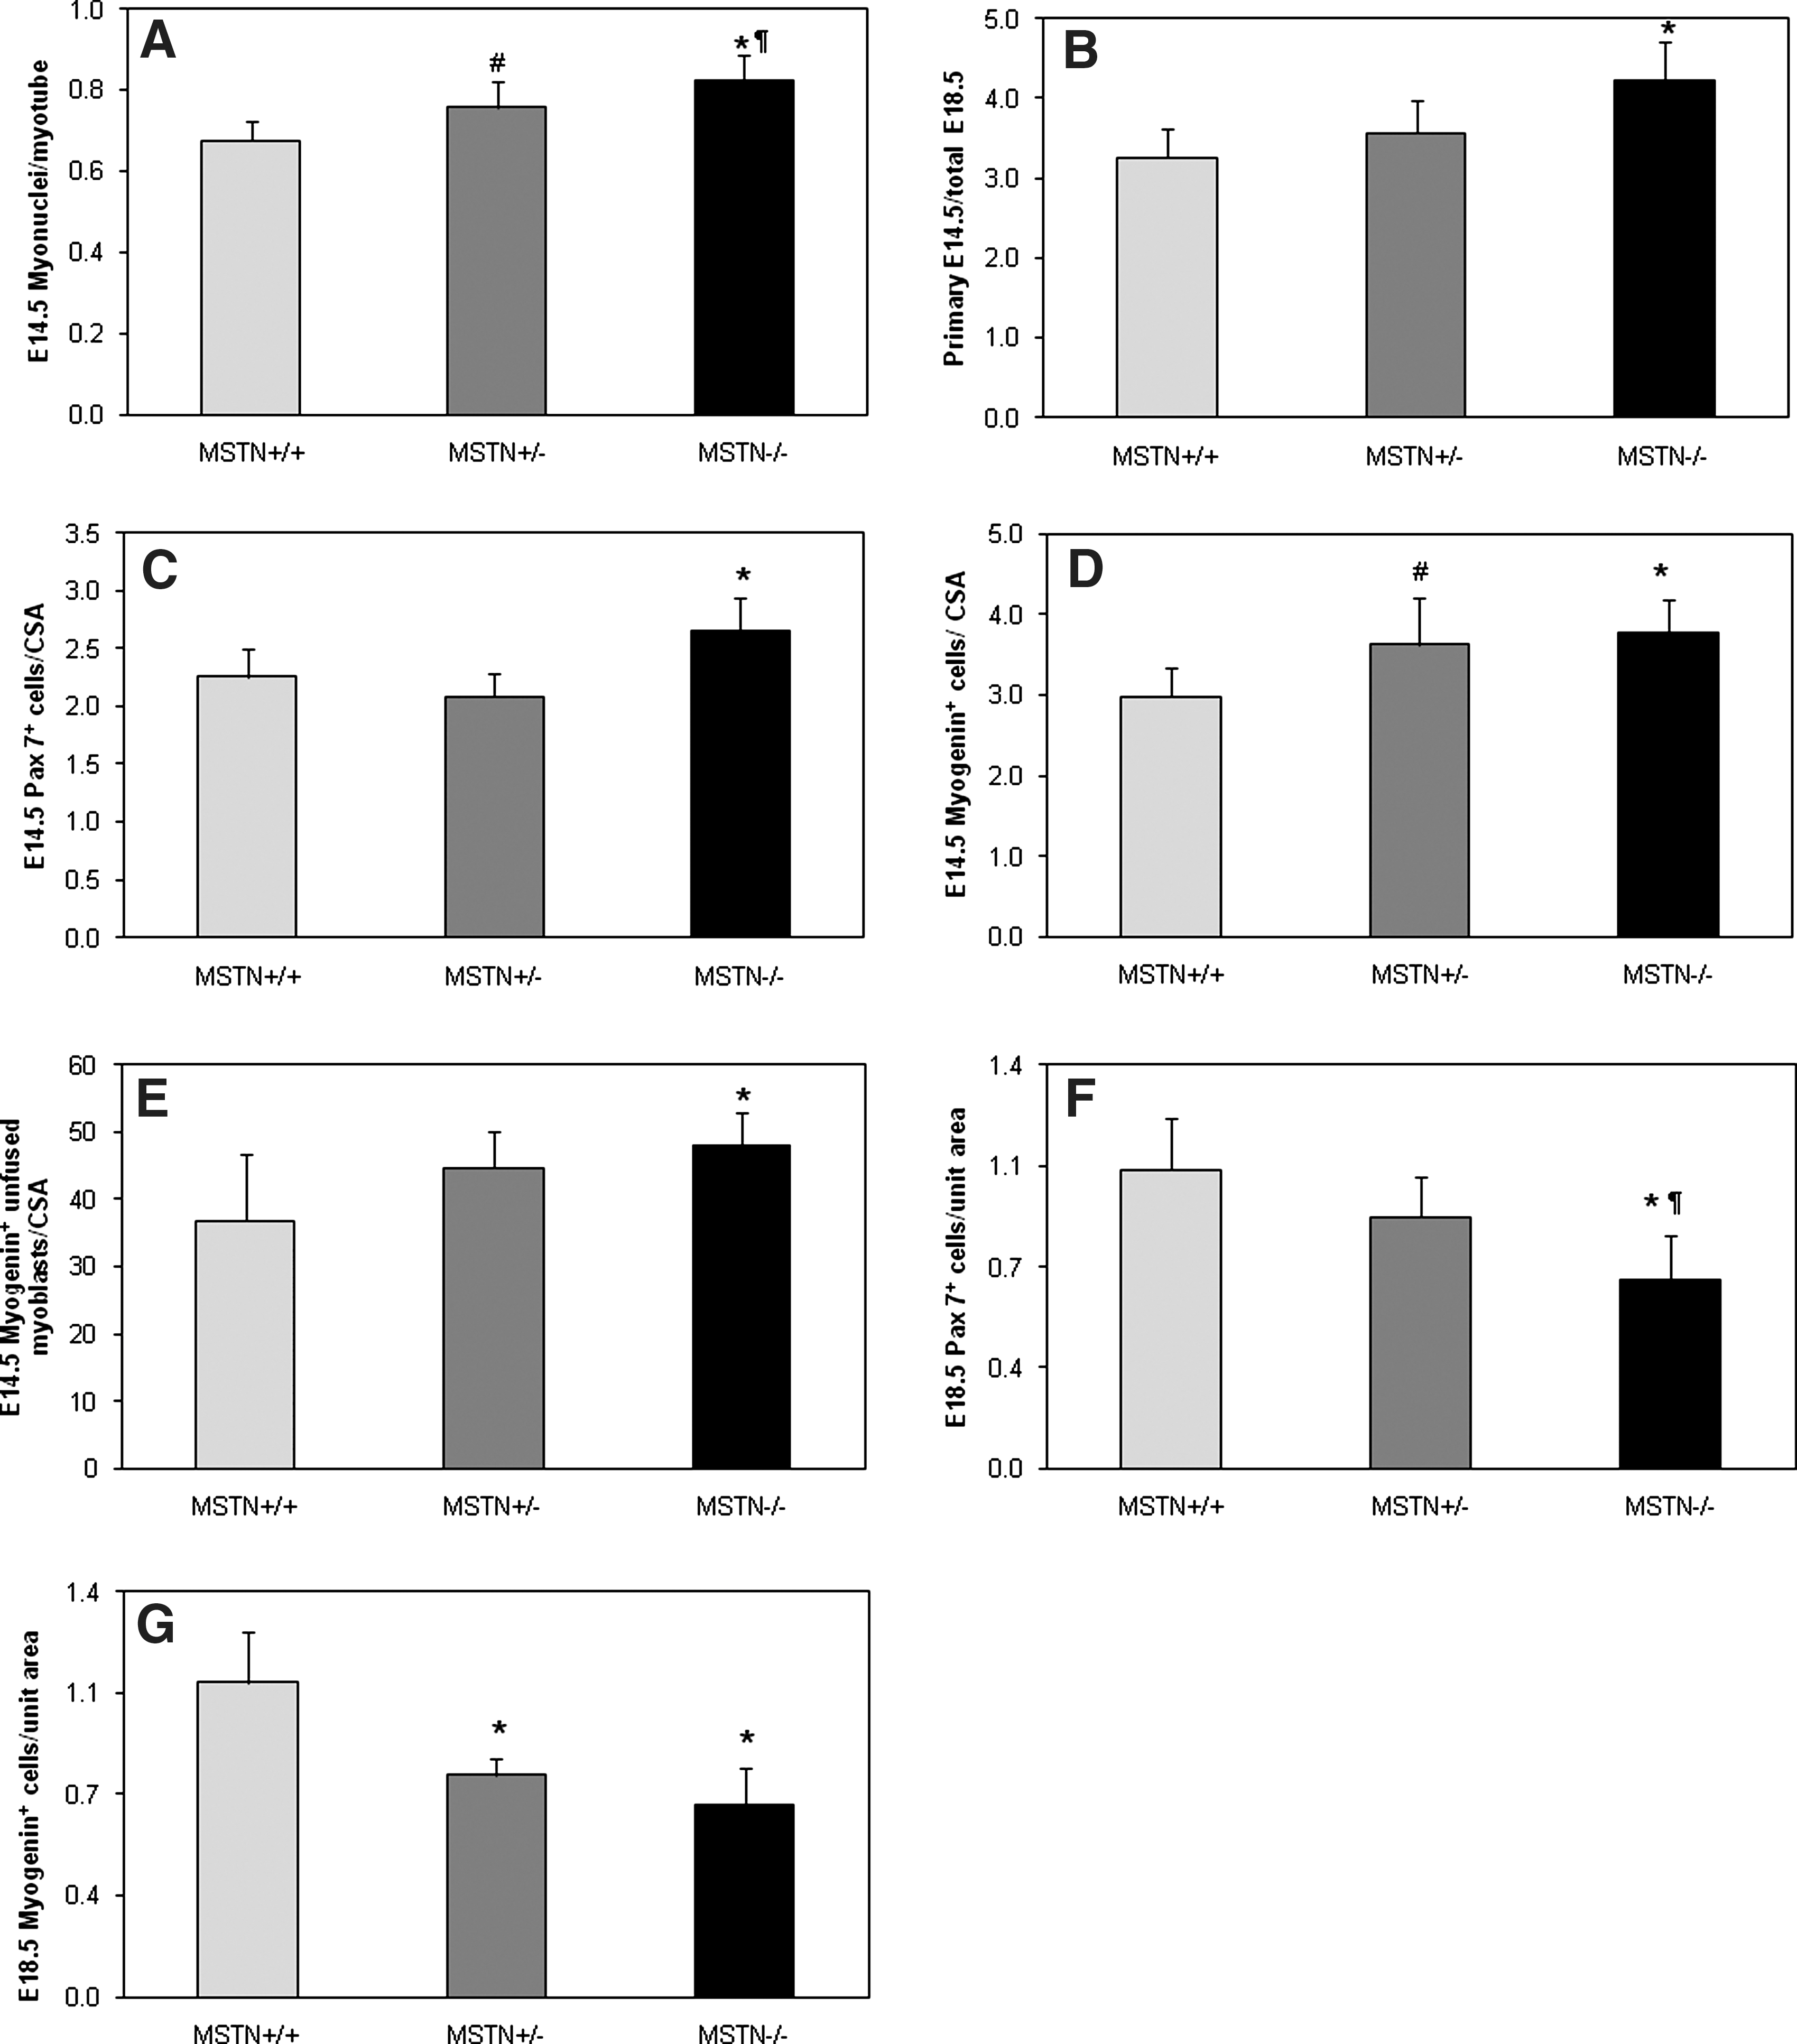
Effects of the genetic loss of myostatin on the rates of embryonic myogenic proliferation and differentiation and fiber budding potential. (
Genetic loss of myostatin induces increased Pax7+ and myogenin+ cell numbers at E14.5
Profiling of fiber number at the end of primary and secondary myogenesis suggested that during the primary phase there was increased myogenic activity in the MSTN −/− embryos, whereas by the end of the secondary phase, the MSTN −/− muscles have prematurely approached their final fiber number. To determine the cellular mechanisms underpinning these findings, we examined the EDL at the same stages to profile the precursor and committed cell populations that drive fiber formation. Serial transverse sections of E14.5 embryos were double-stained for Pax7 and Laminin or Myogenin and Laminin, and the ratio of either Pax7+ or Myogenin+ cells per muscle CSA in the EDL muscle were determined. The Pax7+ cells/CSA ratio was increased by >17% in MSTN −/− compared to either MSTN +/− or MSTN +/+ (Figs. 2A and 5C). Accordingly, the Myogenin+ cells/CSA ratio was significantly higher in MSTN −/− compared to MSTN +/+ animals, without any difference between MSTN +/− and MSTN −/− (Figs. 2A and 5D). Moreover, we show that the number of unfused Myogenin+ myoblasts in the EDL muscle was significantly higher in the MSTN −/− when compared to the MSTN +/+ (Fig. 5E). These findings demonstrate enhanced myogenic proliferation and differentiation at E14.5 in myostatin-deficient mice in a genotype-specific manner, a finding that is concomitant with increased myotube hyperplasia and hypertrophy shown in Figs. 2 and 3.
Genetic loss of myostatin is followed by reduced Pax7+ and myogenin+ cells at E18.5 compared to MSTN+/+
Double-staining for Pax7 and laminin or myogenin and laminin was performed on serial transverse limb sections at embryonic day E18.5. The Pax7+ cells/unit area (80 μm2) was significantly lower in both MSTN +/− and MSTN −/− compared to MSTN +/+ EDL muscles and, in addition, tended to be lower in MSTN compared to MSTN +/− mice (Figs. 2B and 5F). Furthermore, a similar result was found for Myogenin+ cells (Figs. 2B and 5G). These findings suggest that both the population of myogenic stem cells and differentiating myoblasts in the EDL muscle of mouse embryos lacking myostatin are depleted at E18.5 in a genotype-specific manner, suggesting that a greater proportion of the myogenic precursor cell pool has been driven down the myogenic program toward myotube formation.
It is well established that Notch signaling plays a key role in the maintenance of skeletal muscle precursors in a stem cell state. To further explain the reduction in Pax7+ precursor cells we observed at E18.5 in the absence of myostatin, we examined the immunohistochemical intensity of Notch 1 on transverse sections from MSTN
+/+ and MSTN
−/− animals. Notch 1 immunohistochemical staining levels were significantly lower in MSTN
−/− compared to MSTN
+/+ animals at both E14.5 and E18.5 (Supplementary Fig. 1A,B; Supplementary Data are available online at
Discussion
Studies performed by a number of groups have detailed the phenotypic changes that occur as a consequence of deleting the myostatin gene. 18,22,30 Alterations can be either quantitative or qualitative. Following the loss of myostatin, muscles not only contain an increased number of fibers but often the individual fibers present an augmentation in size. 18,22 Conversely to these increases, we have noted that the nuclear-to-cytoplasmic ratios and the number of satellite cells that decorate individual fibers are decreased in the MSTN −/− mouse. 23 Furthermore, we have reported a qualitative change in the composition of the contractile proteins in the mutant mice; these animals exhibit a fast MHC profile. 22 In this study, we concentrated on the temporal onset of these phenotypic changes with the ultimate aim of formulating a mechanistic rationale to explain the origin of these characteristics.
The majority of fibers present in an adult skeletal muscle are formed during two prenatal phases. During primary myogenesis, myoblasts fuse to form primary myotubes that express slow MHC and are enveloped within a well-defined basement membrane. 11,17,31 Following this phase, myoblasts use the primary fiber as a scaffold on which to align and fuse to form secondary myotubes. The parent primary myotube and adherent secondary myotubes are all initially enclosed within a single basement membrane, and, as time progresses, the secondary fibers separate and attain their own basement membrane. During the early stages of their formation, secondary fibers are distinguishable from the parent primary myotube on the basis of size and their expression of MHC isoforms. 11 The temporal onset and completion of these two phases is not only dependent on muscle identity, but also on the species and strain. We initially demarcated these phases for the EDL muscle in the C57/BL6 strain. Comparisons of primary myotube number at E14.5 showed a significant increase in the MSTN −/− muscles relative to MSTN +/+, indicative of myotube hyperplasia. Whereas primary myogenesis only accounts for a relatively small number of fibers present in the adult muscle, these fibers act as a scaffold from which many secondary fibers develop. Therefore, an alteration in their numbers will be amplified during subsequent stages of myotube formation. An estimation of the secondary to primary myotube ratio at E18.5 further showed an increase in the MSTN −/− mice relative to MSTN +/+, which indicated that secondary myotube formation was also enhanced in the EDL muscle compared to both MSTN +/− and MSTN +/+ animals. Importantly, we determined that no significant differences in EDL myotube number or size were observed between MSTN +/+ and MSTN −/− muscles at E13.0, thus suggesting that the phenotypic result of increased myogenic proliferation and differentiation is not manifested until primary myogenesis. The accelerated program continued until at least the end of secondary myogenesis. Therefore, the absence of myostatin is associated with primary and secondary myotube hyperplasia.
It is particularly noteworthy that the number of fibers in the MSTN −/− EDL muscle at E18.5 is very close (87%) to the number found in the adult animal. This is in contrast to the situation in MSTN +/+ animals, where only 73% of adult numbers are present at the end of secondary myogenesis. This means that the accelerated myogenic program in the MSTN −/− animals must then decelerate to a greater degree than in the MSTN +/+ animals. We suggest that the deceleration in fiber development in the MSTN −/− animals is brought about by a lack of mononucleated cells able to participate in fusion. Our analysis of the Pax7- (precursor population) and Myogenin- (committed population) expressing cells support this line of thought. At the end of primary myogenesis, we detected significantly more precursor and committed cells in the MSTN −/−, whereas by the end of secondary myogenesis both these cell populations were smaller than those of the MSTN +/+. We suggest that, in the absence of myostatin, a large number of myoblasts are generated between primary and secondary myogenesis and that these cells become incorporated into fibers. However, the rate of myoblast generation is not maintained at high levels after secondary myogenesis.
The loss of myostatin in the embryonic context has been shown to increase the number of myogenic precursors. Moreover, myostatin has been shown to not only induce MyoD but also to initiate cell cycle arrest through the expression of p21. 21 Therefore, a key question is to determine how the loss of myostatin allows for a greater expansion of the proliferating precursor cell pool but nevertheless eventually permits the release of these progenitor cells from cell cycle and to initiate MyoD expression permitting muscle differentiation. Our data show that, in the absence of myostatin, the proliferation phase is enhanced but cells differentiate eventually. It is possible that ensuing increases in myogenic cell density promote differentiation, a property well described in muscle cell lines. 32 The molecular mechanism responsible for the initiation of differentiation is not known. However, our immunohistochemical data indicate that the expression levels of Notch 1 on EDL muscle from MSTN −/− mice are significantly lower than that of MSTN +/+. Previous studies have shown that Notch signaling leads to the transcription Hairy/Enhancer of Split, which represses the expression of MyoD. It is possible the loss of Notch-mediated signaling leads the downregulation in the expression of Hairy/Enhancer of Split, thereby alleviating the repression of MyoD expression. Once MyoD expression is initiated, this transcription factor not only amplifies its own expression 33 but also leads to the expression of p21, 28 as well as factors that promote cell fusion. 34 We suggest that once MyoD expression has been initiated in the MSTN −/−, its action is more robust than in normal conditions, leading to too many precursor cells exiting the cell cycle. This leads to a decrease in the precursor population at the end of the secondary myogenic phase.
However, we have to consider that an equal inhibition (via loss of Myostatin) and induction (loss of Notch signaling) of MyoD/p21 expression would leave the myogenic program unaffected, which is not the case in the MSTN −/− animals. We have shown that accelerated myogenesis is in place before 14.5 days postcoitum (dpc) in the MSTN −/− animals. We suggest that the corrective action of Notch signaling takes place after the myogenic programme has been accelerated in MSTN −/− animals. This explanation at present is speculative but will be tested in future by means of enhancing Notch signaling in the MSTN −/− animals at exactly the same time we see increased fiber development.
Our study sheds light on the development of fiber hypertrophy displayed by MSTN −/− mice. We show that fiber enlargement is a relatively early event and is evident in primary myotubes. Increase in fiber size could simply arise due to an increase in the number of myoblasts fusing to make a myotube. However, we have previously documented that the number of nuclei within each myofiber from a MSTN −/− adult animal is actually lower than in MSTN +/+ animals. 23 Therefore, we believe that myonuclei accretion alone is insufficient to drive the hypertrophic phenotype. Development of a hypertrophic phenotype can be brought about by an increased rate of protein synthesis, a decrease in the rate of protein degradation or increasing the half-life of mRNA. Recent studies provide evidence that myostatin signaling regulates hypertrophy through its ability to inhibit the activation of the Akt/mTOR protein synthesis pathway 35 and intriguingly leads to a disproportionate buildup of mRNA relative to the muscle DNA content, 36 implying stabilization of transcripts available for translation. Of late, myostatin has been shown not to increase the expression of genes associated with muscle atrophy. 35
We are currently investigating which mechanism is responsible for the embryonic hypertrophy uncovered in this study. Our data provide evidence for the existence of early hypertrophy of primary myotubes at an average of 19% at E14.5 and of 14% of total myotubes (primary and secondary) at E18.5 compared to MSTN +/+ EDL muscle. However, substantial increases in myofiber size occur in later postnatal stages, resulting in an average increase in myofiber area of the EDL muscle, which is more than double (43%) the levels seen in prenatal developmental stages in adult MSTN −/− muscles. The myonuclear domain size is a direct indication of the history of myoblast fusion events within the fiber itself. We and others have previously shown that 1-day postnatal MSTN −/− animals show an increase in myonuclear number per myofiber when compared to MSTN +/+, but conversely adult MSTN −/− myofibers harbor reduced numbers of myonuclei per myofiber. 22
Given these data, we suggest that initial muscle size increase in the absence of myostatin occurs in a cellular manner through the incorporation of the expanded precursor and myoblast cell pools between E14.5 and E18.5. However, our data suggest that the further myofiber size increases observed postnatally, in the absence of myostatin, relies more on an increased rate of protein synthesis rather than a mechanism involving nuclei incorporation.
Data from this study also shed light on the issue regarding the fiber composition of muscle in the MSTN −/− animals. We and others have shown that there is a decrease in the number of slow and also an increase in the number of fast fibers. 22,37 This circumstance could have arisen through one of two developmental routes. First, the deletion of myostatin could have simply inhibited the development of slow fibers leading to a situation where the null always had a fast phenotype. Alternatively, there could have been a conversion of slow fibers to a fast phenotype. We show here that the loss of myostatin does not initially prevent the development of slow fibers. Both MSTN −/− and MSTN +/+ EDL muscles developed primary fibers that express slow MHC. We show that in both MSTN +/+ and MSTN −/− EDL muscles there is a subsequent conversion of slow fibers into fast fibers, with the caveat that the MSTN −/− muscles undergo a more robust switching process, resulting in approximately 50% fewer slow fibers at E18.5 when compared to E14.5.
Recent work has shown that members of the myocyte enhancer factor-2 (MEF2) family of transcription factors are key regulators of fiber-type development. In particular, an elegant study from the Olson group has shown that MEF2C and MEF2D expression induce expression of slow MHC, and the deletion of these genes leads to loss of slow fibers and development of fast fibers. 38 This has led them to propose that fast muscle development is a default pathway. Indeed, most of the adaptive processes involve converting fast muscle to slow. Furthermore, inactivity leads to slow muscle becoming fast (reviewed in ref 1). Relevant to our study has been the recent report that myostatin acts to promote the expression of MEF2C. 39 We suggest that during normal development of the EDL muscle, a regulated program of fiber conversion mediated by myostatin controls the rate of fast fiber development. However in the MSTN −/−, this program is considerably accelerated, although an important distinction needs to be drawn between initial slow-fiber formation, which is independent of myostatin action, and the subsequent fast-fiber conversion program, which is dependently regulated by myostatin.
Our results show that during early myogenesis, myostatin acts to severely limit the proliferation of muscle precursors. These findings could be exploited to reverse the effects of muscle-wasting conditions, for example, age-related sarcopenia. However, we have shown that the muscle stem cells from the EDL express very low levels of the myostatin receptor. 23 This result, together with our previous study demonstrating muscle hypertrophy in the absence of muscle hyperplasia following postnatal Myostatin antagonist application in the EDL, suggests that the signaling molecule is not repressing proliferation. However a recent study has shown that there are considerable molecular variations in satellite cell from differing sources. 40 Therefore, it is possible that some muscles maintain the myostatin receptor on their stem cells during adult life and that these in the absence of the signaling molecule could proliferate at enhanced rates with obvious therapeutic outcomes. Therefore, it is worthwhile investigating myostatin receptor expression in a spectrum of muscles.
In summary, our data show that the increased skeletal muscle size observed in the absence of myostatin is initiated after E13.0. We show that during primary myogenesis in MSTN −/− muscles, increased stem and myoblast cell numbers cause the increased growth of primary myofibers, as well as the accelerated induction of secondary myofibers. Moreover, we demonstrate that the glycolytic phenotype of adult MSTN −/− muscles is induced through an increased switch of type I+ myotubes toward MHC type I− during secondary myogenesis. Importantly, we show that MSTN −/− muscles reach their adult myofiber number faster than their MSTN +/+ littermates.
Footnotes
Acknowledgments
We would like to thank the Wellcome Trust (078649), the Egyptian Ministry of Higher Education, and the University of Reading for generous funding permitting the execution of this work.
References
Supplementary Material
Please find the following supplemental material available below.
For Open Access articles published under a Creative Commons License, all supplemental material carries the same license as the article it is associated with.
For non-Open Access articles published, all supplemental material carries a non-exclusive license, and permission requests for re-use of supplemental material or any part of supplemental material shall be sent directly to the copyright owner as specified in the copyright notice associated with the article.
