




Abstract
Background:
Testosterone biosynthesis gradually decreases with age. Impaired redox homeostasis-related oxidative damage in cellular macromolecules has a high risk for the development of renal insufficiency. Our aim was to study the effects of testosterone replacement therapy on redox homeostasis.
Methods:
We investigated various oxidative damage biomarkers in kidney. Experimental animals were separated into three groups—naturally aged rats, testosterone-administered naturally aged rats (single dose of 25 mg/kg testosterone enanthate), and their respective young controls.
Results:
Our results showed that the testosterone-administered naturally aged group shared significant similarities with the young rats with respect to their redox status. In testosterone-administered naturally aged rats, kynurenine, protein carbonyl, advanced oxidation protein products, lipid peroxidation markers, and xanthine oxidase activities were significantly lower and Cu-Zn superoxide dismutase activities and testosterone levels were higher than naturally aged rats. In testosterone-administered naturally aged rats, catalase activities, ferric reducing anti-oxidant power, and testosterone levels were significantly lower and dityrosine, N-formyl kynurenine, protein carbonyl, and protein hydroperoxides were significantly higher than in young rats. On the other hand, in naturally aged rats, Cu-Zn superoxide dismutase, catalase activities, ferric reducing anti-oxidant power, and testosterone levels were lower and dityrosine, kynurenine, protein carbonyl, protein hydroperoxide, advanced oxidation protein products, lipid peroxidation markers, advanced glycation end products, and xanthine oxidase activities were higher than controls.
Conclusions:
Our results showed that a single dose of testosterone administration has a positive effect on the redox status of the aged kidney. Future studies are needed to clarify the exact molecular mechanism(s) involved in the action of testosterone in maintaining kidney redox homeostasis.
Introduction
T
Oxidative damage may affect certain post-mitotic tissues/organs, such as kidney, heart, brain, and skeletal muscle. The optimal level of redox homeostasis may significantly affect the maintenance of health with advancing age. 2 Reduction in the number of Leydig and Sertoli cells, diminished capacity of testosterone biosynthesis, thickening of the basal membrane of the seminiferous tubules, and accumulation of lipofuscin granules by oxidative stress are commonly observed during aging. 6,9 Testosterone is also considered as a modulator of redox balance in different tissues. 7,10
Renal insufficiency is a progressive problem in the elderly population. Reduced glomerular filtration rate (GFR) coupled with oxidative damage related to impaired redox homeostasis in the kidney increases the risk for the development of age-associated renal insufficiency. 4,6,11 This disorder leads to physical insufficiency and a decrease in quality of life for elderly people. 12 Glomerulosclerosis increases with the aging process, especially with non-concomitant tubular atrophy and interstitial fibrosis. Male rats experience a more rapid reduction in GFR and a higher incidence of renal injury associated with aging compared to females. However, the reduction in GFR cannot be fully reflected in the level of glomerular injury. 13,14 Increased renal ROS is known to be involved in renal vasoconstriction, renin release, activation of renal afferent nerves, augmented contractions, myogenic responses of afferent arterioles, enhanced tubulo-glomerular feedback, dysfunction of glomerular cells, and proteinuria. 15
Testosterone biosynthesis is known to decrease progressively in men in an age-dependent manner. 6,16 Testosterone replacement therapy could be beneficial as a neuroprotectant for elderly individuals with low oxidative stress. In men from the age of 35, there is a progressive decline in serum testosterone levels by 1% per year due to attrition in testicular Leydig cells and slowing of the hypothalamic gonadotropin-releasing hormone (GnRH) pulse generator. Men with primary hypogonadism (congenital or acquired) or hypogonadotropic hypogonadism are often candidates for testosterone replacement therapy. 17 This treatment has shown great efficiency by its ability to improve brain functions and decrease the cardiovascular risk.
Successful management of testosterone replacement therapy requires an appropriate evaluation and understanding of the benefits and risks of treatment. 4,18 The long-term benefits of higher systemic testosterone levels in older men remain controversial. 19 Potential risks include erythrocytosis, edema, gynecomastia, prostate stimulation, and suppression of sperm production. 18 It has also been shown that a supra-physiological dose of testosterone decreases the expression of endothelial nitric oxide synthase (eNOS) and consequently the formation of nitric oxide (NO), which could be explained by oxidative stress. 20 Higher doses of androgen administration in elderly men may also lead to the peripheral aromatization of testosterone to estrogen. 19,21,22 Hwang and colleagues have reported that low-dose testosterone administration prevents cells from oxidative stress–induced damage and cell death. 4 Furthermore, humans and rats with low testosterone levels showed an improvement in the cardiac functions after the therapy. 7 Testosterone enanthate is formed by esterification of the 17β-hydroxyl group of testosterone with heptanoic acid. The bulky cypionate and enanthate esters of testosterone have a duration of action up to 2–4 weeks. 21 The present study focused on the acute effect of testosterone enanthate replacement therapy on renal redox homeostasis of cellular macromolecules in elderly subjects.
Materials and Methods
Chemicals and equipment
The chemicals employed were of the highest analytical grade available. All chemicals and reagents were purchased from Merck (Darmstadt, Germany) and Sigma-Aldrich (St. Louis, MO). Deionized water was used in the analytical procedures. All reagents were stored at 4°C. The reagents were brought to room temperature for 20 min before use. Centrifugation procedures for the analysis of various oxidative stress biomarkers were performed at 4°C with a Sigma 3–18 KS centrifuge (Sigma Laborzentrifugen GmbH, Osterode am Harz, Germany). Oxidative damage biomarker profiles of kidney tissue samples were analyzed by spectrophotometric and spectrofluorimetric manual methods with a Biotek Synergy™ H1 Hybrid Multi-Mode Microplate Reader (BioTek US, Winooski, VT). The early stage of lipid peroxidation in supernatants was assessed by using second derivative spectroscopy technique on the same device. The baseline and post-injection levels of testosterone were estimated by the enzyme-linked immunosorbent assay (ELISA) method.
Animal model and treatment protocol
The current study was performed with 24 male Sprague-Dawley rats. All of the experimental studies were conducted in accordance with the national laws of Republic of Turkey. Ethical protocol of the current research was approved by Ethics Committee of Istanbul University, Istanbul, Turkey (Ethics Committee Issue Number: 2012/67).
Animals were housed in a temperature-controlled room (25±5°C) with 12-hr light–dark cycles. All rats were fed with a rodent pellet containing standard nutrients and had free access to tap water. After a 1-week adaptation period, the experimental animals were separated into three groups. Group 1 included young control rats (YC) (n=8; 5 months old) and group II comprised naturally aged rats (NA) (n=8; 24 months old) that were only given a single dose of peanut oil intramuscularly. Group III was naturally aged rats (n=8; 24 months old) and were also intramuscularly administered a single physiological dose of testosterone enanthate in peanut oil as the vehicle (25 mg/kg body weight) (testosterone-administered naturally aged rats [TANA]). 23 All animals were sacrificed 15 days after the following testosterone administration. 24
Homogenization and preparation of supernatant fractions
The kidney samples that were extracted from the rats were washed in cooled 0.9% NaCl and placed on an ice-cold plate. The tissue samples were then immediately frozen in liquid nitrogen until they were homogenized. Kidney tissue samples (200 mg) were homogenized manually in 2 mL of homogenizing buffer (100 mM KH2PO4–K2HPO4, pH 7.4, plus 0.1% [wt/vol] digitonin). Homogenates that were obtained from the tissues were centrifuged at 5000×g for 10 min, and various analytes of the supernatant fraction were assayed. 11
During aliquot preparation, supernatant fractions were maintained at 4°C in dim light. The supernatant fractions were divided into aliquots (one for each assay) and immediately stored at −80°C (2-week maximum) for assays such as dityrosine (DT), kynurenine (KYN), N-formylkynurenine (NFKYN), protein carbonyl groups (PCO), total thiol groups (T-SH), protein thiol groups (P-SH), non-protein thiol groups (NP-SH), advanced oxidation protein products (AOPPs), malondialdehyde (MDA), protein-bound advanced glycation end products (prb-AGEs), ferric reducing/anti-oxidant power (FRAP), Cu-Zn superoxide dismutase (Cu-Zn SOD), catalase (CAT), and xanthine oxidase. Our preliminary assays were carried out with both fresh and thawed supernatant specimens for protein hydroperoxides (P-OOHs), lipid hydroperoxides (L-OOHs), and conjugated dienes (CDs), and our experimental results showed that prolonged periods of storage had significant effects at the analytic reliability of the test results (data not shown). The assays for the last three aforementioned parameters were performed with fresh supernatant samples.
Analytical Methods
Assay of aromatic amino acid–derived oxidation markers
Assay of tyrosine-derived oxidation marker
Analysis of protein-bound DT was performed using the spectrofluorimetric method according to Sadowska-Bartosz et al. 25 with some modifications in the pre-analytical step. The pre-treatment of supernatant samples was done to avoid the possible fluorescence interference derived from tissue constituents that were processed in the following way. Proteins of the supernatant samples were precipitated with 30 mM perchloric acid for 20 min on ice. After centrifugation for 15 min at 5000×g, the pellets were re-dissolved and diluted (1:20) in phosphate-buffered saline (PBS) buffer (pH 7.4), and then used for fluorescence spectroscopy. Fluorescence intensity was expressed in fluorescence units (FU), and the results were expressed as FU/mg protein. Supernatant fractions were diluted (1:20) with PBS (pH 7.4), and fluorescence intensity was recorded at the emission maximum (415 nm) upon excitation at 330 nm. The coefficients of intra- and inter-assay variations for DT assay were 4.2% (n=8) and 5.6% (n=8), respectively.
Assay of tryptophan-derived oxidation markers
KYN and N-FKYN contents were analyzed using the spectrofluorimetric method according to Sadowska-Bartosz et al. 25 with some modifications in the pre-analytical steps. The pre-treatment of supernatant samples was to avoid the possible fluorescence interference derived from tissue constituents. It was performed as follows. Supernatant proteins of the homogenates were precipitated with 30 mM perchloric acid for 20 min on ice. After centrifugation for 15 min at 5000×g, the final protein pellets were re-dissolved and diluted (1:20) in PBS buffer (pH 7.4), and they were used for fluorescence spectroscopy. Fluorescence intensity was recorded at the emission maximum (480, 434 nm) upon excitation at 365, 325 nm, respectively. Fluorescence intensity was expressed in FU, and the results were given as FU/mg protein.
Assays of global biomarkers of protein oxidation
Protein carbonyl groups
The PCO assay was performed as previously described by Reznick and Packer 26 with some slight modifications to apply small volumes of supernatant samples. PCO groups react with 2,4-dinitrophenylhydrazine (DNPH) reagent (100 μL of supernatant:400 μL of DNPH) to form chromophoric dinitrophenylhydrazones. DNPH was dissolved in HCl, and after the DNPH reaction proteins were precipitated with an equal amount of 20% (wt/vol) trichloroacetic acid (TCA) and washed three times with 400 μL of an ethanol/ethyl acetate mixture (1:1). The washing procedure was performed by mechanical disruption of pellets, and the re-pelleting process was accomplished by centrifugation at 3000×g for 5 min. Finally, the protein precipitates were dissolved in a 200 μL of 6 M guanidine-HCl solution. The final absorbance values were recorded at 360 nm using the molar extinction coefficient of DNPH, ε=22,000 M−1cm−1 The coefficients of intra- and inter-assay variations for the modified PCO assay were 3.6% (n=8) and 6.1% (n=8), respectively. The PCO-BSA–positive control and un-treated BSA were both prepared according to the method of Lenarczyk et al. 27 and tested according to the PCO assay protocol.
Protein hydroperoxides
P-OOHs were analyzed with the ferric-xylenol orange (FOX) method, which was established by us. Our P-OOH assay is based on the oxidation of Fe2+ by P-OOHs in the presence of the dye xylenol orange (XO) that gives a colored complex with the Fe3+ ions. The Fe++–XO complex can be analyzed in the visible absorbance range (560 nm). Proteins were precipitated from 25 μL of supernatant by adding 125 μL of 30 mM ice-cold perchloric acid. Precipitated samples were kept on ice for 5 min and centrifuged at 5000×g. The protein pellet was then washed twice with chloroform containing 4 mM butylated hydroxytoluene solution. The precipitated proteins were then dissolved in 150 μL of PBS. Fifty-microliter aliquots of dissolved proteins were transferred into microcentrifuge reaction vials. The FOX reagent was prepared as previously described, 28 950 μL was added to the tubes, and the samples were mixed by vortexing. After incubation with FOX2 (ferrous oxidation with xylenol orange, version 2) reagent at room temperature for 30 min, the samples were centrifuged at 3000×g at 20°C for 10 min. The resulting supernatant was carefully transferred into microplate wells. Absorbance values were recorded at 560 nm against a reagent blank. The molar concentration of P-OOHs in the final medium was calculated from the standard curve prepared by hydrogen peroxide (H2O2) in methanol. The coefficients of intra- and inter-assay variations for P-OOH assay were 3.0% (n=8) and 4.9 % (n=8), respectively. The P-OOH-BSA–positive control and untreated BSA were both prepared in vitro according to the method of Peskin et al. 29 and analyzed according to the assay protocol.
Advanced oxidation protein products
Spectrophotometric analysis of AOPP concentrations was performed with modifications of the Hanasand method. 30 Samples were prepared as in the following way. A 1-μL amount of supernatant and 200 μL citric acid (20 mmol /L) were mixed in a microplate. After 1 min, 10 μL of 1.16 M potassium iodide was added to the microplate wells, and the absorbance of the reaction mixture was recorded at 340 nm against a reagent blank. All readings were performed within 2 min after potassium iodide addition to avoid uncontrollable color development, which leads to possible deviation from the chloramine standard curve. The absorbance of chloramine-T standards was run in duplicate to increase precision of the AOPP assay at 340 nm. The related absorbance values were linear within the range of 0–100 μmol/liter. AOPP concentration was expressed as micromoles per liter of chloramine-T equivalents. The coefficients of intra- and inter-assay variations were 1.3% (n=8) and 2.0% (n=8), respectively. The AOPP-BSA–positive control and untreated BSA were both prepared in vitro and tested according to the AOPP assay protocol. 31
Protein thiol groups
The concentration of the thiol (–SH) group containing redox status biomarkers such as T-SH, NP-SH, and P-SH was analyzed by using the 5,5-dithiobis(2-nitrobenzoic acid) (DTNB) method as described by Sedlak and Lindsay. 32 We made some slight modifications from previously described –SH methods to apply small volumes of supernatant samples. A 20-μL amount of the supernatant was mixed in a 1.5-mL test tube with 400 μL of 0.2 M Tris buffer (pH 8.2) and 20 μL of 0.01 M DTNB for the determination of T–SH groups. Samples for NP-SH determination were assayed as follows. A 20-μL amount of supernatant was mixed in 400 μL of 50% TCA. The tubes were mixed intermittently for 10 min and centrifuged at 3000×g for 15 min. Supernatant fractions were assayed as for T-SH. The absorbance values of the resulting samples were recorded at a 412-nm wavelength against a reagent blank. The value of molar extinction coefficient of –SH groups at wavelength 412 nm is ε=13,100 M−1 cm−1. The P-SH groups were calculated by subtracting the NP-SH from T-SH. The coefficients of intra- and inter-assay variations were 1.5% (n=8) and 3.4% (n=9), respectively.
Assays of lipid peroxidation markers
Malondialdehyde
MDA is considered as one of the major secondary reactive products of lipid peroxidation. MDA, along with other by-products, reacts with thiobarbituric acid (TBA) to generate a colored product, which absorbs maximally at 535 nm, representing the color produced by all the TBA-reactive substances. The rate of lipid peroxidation was determined by the procedure of Buege and Aust with slight modifications comprising only volumetric changes proportionally. 33 The pre-treatment of supernatant samples to avoid the possible interference derived from tissue constituents was performed according to Lykkesfeldt. 34 Ten microliters of supernatant was placed in a microcentrifuge tube; 500 μL of 42 mmol/L H2SO4 was added and mixed gently, after which 125 μL of 100 g/L phosphotungstic acid was added and mixed by vortexing. After 5 min at room temperature, this mixture was centrifuged (3 min at 6000×g). MDA is associated with the lipoprotein and consequently was contained in the pellet. The resulting pellet was re-suspended in 750 μL of 0.75 % TBA and 500 μL of 30% TCA boiled for 15 min at 95°C and cooled. The mixture was centrifuged at 3000×g for 5 min, and the absorbance of supernatant was read at 532 nm against a reagent blank. Intra-assay variation of the MDA assay is controlled by duplicate samples so that more precise test results can be obtained. The concentration of MDA in supernatant was calculated using the molar extinction coefficient (ε=31,500 M−1cm−1) and it is expressed as μmol /mg protein. The coefficients of intra- and inter-assay variations for MDA assay were 3.4% (n=10) and 4.2% (n=10), respectively.
Lipid hydroperoxides
L-OOHs levels were determined spectrophotometrically by the method that uses the oxidation of ferrous ions with xylenol orange FOX2. 28 L-OOHs oxidized ferrous to ferric ions selectively in dilute acid, and the resultant ferric ions were determined by using ferric-sensitive dye, which represents the concentration of L-OOHs. XO binds to ferric ions with high selectivity to produce a colored (blue–purple) complex. Fifty-microliters aliquot of homogenates were transferred into microcentrifuge reaction vials. FOX2 reagent (950 μL) was then added, and the samples were mixed by vortexing. After incubation with FOX2 reagent at room temperature for 30 min, the samples were centrifuged at 3000×g at 20°C for 10 min, the final supernatant was carefully transferred into microplate wells and absorbance was recorded at 560 nm against reagent blank The coefficients of intra- and inter-assay variations were 2.1% (n=8), and 2.0% (n=11), respectively.
Conjugated dienes
CD levels were determined with the CDs method of Francesco and Sebastiano.
35
We made some volumetric modifications of the previously established method that gave increased sensitivity and high reproducibility to the CD assay. At first, tissue lipids were isolated from kidney tissue samples according to the method of Folch et al.
36
The supernatants were mixed with chloroform/methanol (2v/1v) reagent to a final volume 20 times the volume of the sample at first. Then the whole mixtures were placed in an orbital shaker at room temperature for 15 min. Resulting samples were centrifuged to recover the liquid phase. The solvents were washed with 4 mL of 0.9% NaCl. After vortexing for a few seconds, the mixtures were centrifuged at 2000×g to separate two phases. Upper phases were removed, and the lower chloroform phases containing lipids were evaporated under a nitrogen stream. After the evaporation stage, the samples were dissolved in cyclohexane. All of the samples were subjected to spectral scanning between 230 and 250 nm to determine wavelength peaks between 230–260 nm. Both CDc,t and CDt,t present distinct absorbance at 242 nm and 233 nm, respectively. CDs detected in tissue lipid extracts were improved by second derivative spectrophotometry by using the following formula:
expressing: n, derivative order; nDxλ or nDx,v, value of an order derivative of an analyte (x); λ, analytical wavelength; v, wavelength number; and A, absorbance. The second derivative spectra showed fine spectral structures with at least three negative peaks. The wavelengths of their minima are different for the geometric isomers CDc,t and CDt,t, allowing determination of each individual isomer in a mixture without any separation.
Assay of glycoxidation adducts
Protein-bound advanced glycation end products
Determination of protein-bound AGEs (i.e., some fluorescent products from the family of AGEs) was realized on the basis of the spectrofluorimetric method according to Munch et al. 37 The pre-treatment of supernatant samples was done to avoid the possible fluorescence interference derived from tissue constituents as follows. Supernatant proteins of the homogenates were precipitated with 100 grams/L TCA for 20 min on ice. After centrifugation for 15 min at 5000×g and three washing steps with 100 grams/L TCA, the pellets were re-dissolved and diluted (1:20) in PBS buffer (pH 7.4) and then used for fluorescence spectroscopy. Fluorescence intensity was expressed in FU, and the results were given as FU/mg protein. Supernatant was diluted (1:20) with PBS (pH 7.4), and fluorescence intensity was recorded at the emission maximum (440 nm) upon excitation at 350 nm. The coefficients of intra- and inter-assay variations for protein- bound AGE assay were 3.8% (n=8) and 5.3% (n=8), respectively. The AGE-BSA–positive control and untreated BSA were both prepared according to the method of Wrobel et al. 38 and tested according to the assay protocol.
Estimation of non-enzymatic redox homeostasis biomarkers
Ferric reducing anti-oxidant power assay
The anti-oxidant status of supernatant was evaluated using the ferric reducing anti-oxidant power (FRAP) assay. 39 The modified FRAP assay uses reductant anti-oxidants in a redox-linked colorimetric method. In this assay, at low pH, a ferric–2,4,6-tripyridyl-s-triazine (FeIII–TPTZ) complex was reduced to the ferrous form, which was blue in color and monitored by measuring the change in absorption at 593 nm. The change in absorbance is directly proportional to the reducing power of the electron-donating anti-oxidants present in the sample. Three hundred mmol/L of acetate buffer (pH 3.6), 10 mmol/L TPTZ in 40 mmol/L HCl, and 20 mmol/L FeCl3 ċ 6H2O in the ratio of 10:1:1 give the working FRAP reagent. Fe(II) standards were used. Fe(II) (1000 μmol/L) is equivalent to 1000 μmol/L of FRAP. A 750-μL amount of working FRAP reagent was mixed with 25 μL of supernatant or standard in a test tube. The absorbance at 593 nm was recorded against the reagent blank. The absorbance change was converted into a FRAP value as mM by relating the change of absorbance at 593 nm of the test sample to that of a standard solution of known FRAP value (3–0.375 mM). The coefficients of intra- and inter-assay variations for modified FRAP assay were 1.6% (n=8) and 2.8 % (n=8), respectively.
Enzymatic redox homeostasis biomarkers
Cu-Zn SOD activity
Cu-Zn SOD activity (Cu-Zn SOD) (EC 1.15.1.1) activity was measured by using the method of Sun and Oberley 40 with some volumetric modifications. This method involves the inhibition of nitroblue tetrazolium (NBT) reduction, with xanthine oxidase used as a superoxide anion generator. Enzyme activity was determined by measuring the inhibition rate of substrate hydrolysis in the assay mixture containing 0.3 mmol/L xanthine, 0.6 mmol/L Na2EDTA, 150 μmol/L NBT, 400 mmol/L Na2CO3, and 1 gram/L BSA. The pH value of the assay mixture was adjusted to pH 10.2. A 972-μL amount of assay mixture and 13 μL of xanthine oxidase (167 U/L) were added into 25 μL supernatant sample. At the end of the 20-min incubation period, 250 μL of 0.8 mmol/L CuCl2 was added to the microplate wells to terminate the reaction. The final absorbance was recorded at 560 nm against a reagent blank. The percent inhibition rate was calculated according to the following equation: Ablank − Asample/Ablank.100. One unit of Cu-Zn SOD is defined as the amount of enzyme needed to exhibit a 50% dismutation of superoxide radical anion. The coefficients of intra- and inter-assay variations for modified Cu-Zn SOD assay were 3.8% (n=8) and 4.2% (n=8), respectively.
Catalase activity
CAT activity (E.C.1.11.1.6) was determined by the method described by Aebi. 41 The decomposition rate of the substrate H2O2 was monitored at 240 nm. A molar absorptivity of 43.6 L mol−1 cm−1 was used to calculate the activity. One unit is equal to 1 μmol of H2O2 decomposed/min. CAT activity was expressed as U/mg protein.
Xanthine oxidase activity
Xanthine oxidase (E.C.1.17.3.2) activity was measured by using the method of Prajda and Weber. 42 This assay was based on oxidation of xanthine to uric acid by xanthine oxidase. The amount of uric acid was stabilized by using 100% TCA, and the absorbance was reading at 293 nm. The supernatant was pre-incubated for 40 min at 37°C and then added to the reaction mixture, which contained in final concentrations xanthine (0.17 mM), phosphate buffer (33 mM, pH 7.5), and a suitable amount of enzyme (supernatant). The reaction was carried out at 37°C and was stopped at 0 and 20 min by addition of 0.1 mL of 100% (wt/vol) TCA. The mixture was centrifuged at 10,000×g for 15 min. In the clear supernatants, the uric acid produced from the substrate, xanthine, was measured by the increase in absorbancy at 293 nm.
Estimation of total protein content
Protein determinations were carried out fluorometrically by Qubit analyzer (Invitrogen, Carlsbad, CA).
Estimation of basal and post-drug serum testosterone levels
Testosterone concentrations of the serum samples were determined by using an enzyme-linked immunosorbent assay (ELISA) detection kit (Abnova, Taipei, Taiwan).
Estimation of basal and post-drug serum creatinine levels
Creatinine determinations were carried out colorimetrically by an assay kit (Cayman, Ann Arbor, MI)
Data processing
Statistical calculations were performed using SPSS software (v. 20.0, SPSS, Chicago, IL). Data were expressed as the mean±standard error of the mean for each group. A Kruskal–Wallis non-parametric analysis of variance (ANOVA) test was used to compare samples. Post hoc tests were conducted by the Bonferroni–Dunn test. The degree of association between related samples was evaluated by means of the Spearman correlation test. p values<0.05 were regarded as statistically significant. Second-derivative calculations were performed using MATLAB software (MathWorks 2010: Natick, MA).
Results
Aromatic amino acid-derived oxidation biomarkers
The aromatic amino acid-derived oxidation biomarkers profile of YC, TANA, and NA rats are given in Fig. 1, A–D. DT contents were significantly higher in TANA and NA rats than in YC rats (p<0.01 for both). N-FKYN contents were higher in TANA rats than in YC rats (p<0.05), but there was no difference in comparison to NA rats (p>0.05). KYN contents were lower in TANA and YC rats than in NA rats (p<0.01 and p<0.05, respectively) and there were no differences between TANA and YC rats.

Aromatic amino acid-derived oxidation biomarkers in kidney tissue of naturally aged rats (NA; n=8), testosterone-administered naturally aged rats (TANA; n=8), and their corresponding young controls (YC; n=8). Results are expressed as mean±standard error of the mean (SEM). Data are statistically different between groups. (+p<0.05; ++ p<0.01 YC vs. TANA), (*p<0.05; **p<0.01 YC vs. NA), (xx p<0.01 TANA vs. NA). FU, fluorescence units; DT, dityrosine; N-FKYN, N-formylkynurenine; KYN, kynurenine; pr, protein.
The global protein oxidation biomarkers
The global protein oxidation biomarkers profile of YC, TANA, and NA rats are given in Fig. 2, A–D. PCO concentrations were higher in TANA and NA rats than in YC rats (p<0.01 and p<0.001, respectively). PCO concentrations were significantly lower in TANA rats than in NA (p<0.001). P-OOH concentrations were higher in TANA and NA rats than in YC rats (p<0.05 and p<0.01, respectively). AOPP concentrations were significantly lower in TANA rats than in NA (p<0.01). AOPP concentrations were significantly higher in NA rats than in YC rats (p<0.001). P-SH concentrations were not significantly different between each group.
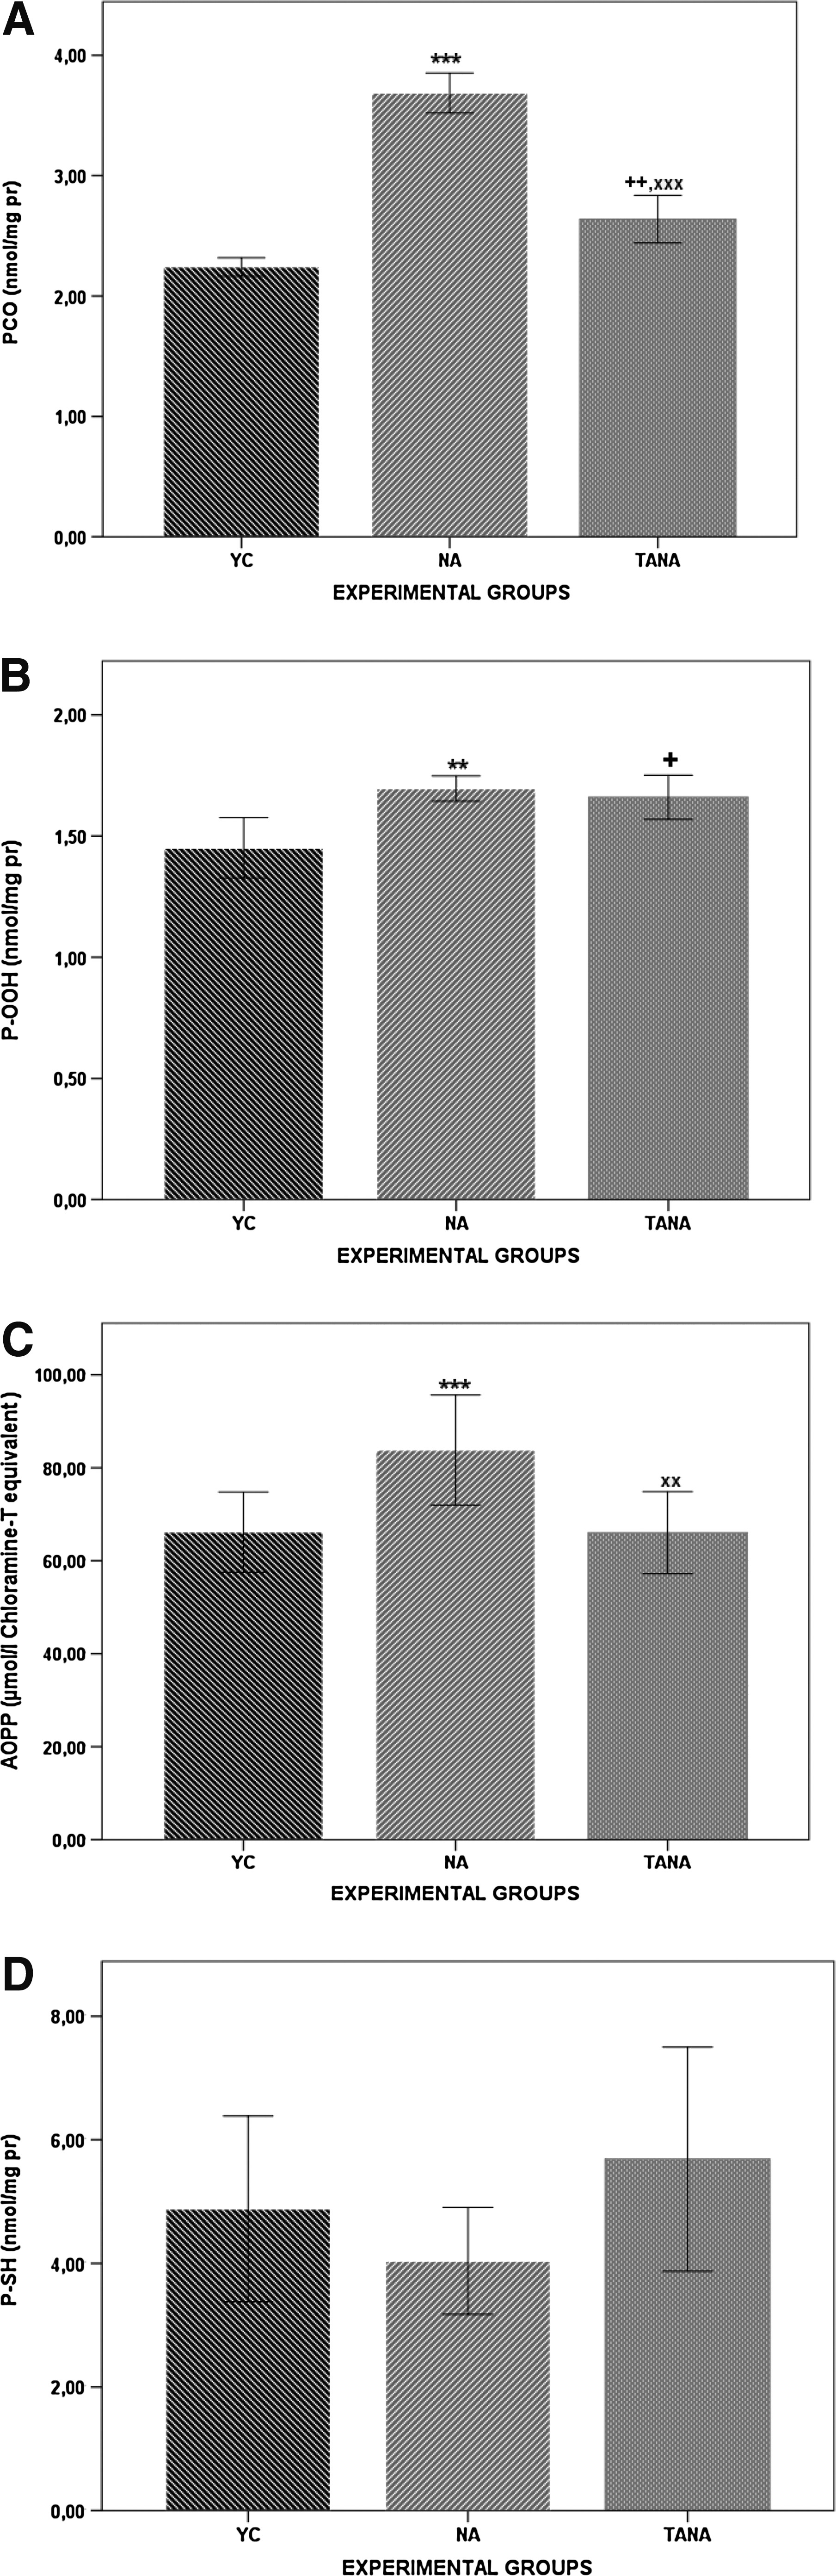
Global biomarkers of protein oxidation biomarkers in kidney tissue of naturally aged rats (NA; n=8), testosterone-administered naturally aged rats (TANA; n=8), and their corresponding young controls (YC; n=8). Results are expressed as mean±standard error of the mean (SEM). Data are statistically different between groups, (+p<0.05; ++ p<0.01 YC vs. TANA), (**p<0.01; ***p<0.001 YC vs. NA), (xx p<0.01,xxx p<0.001 TANA vs. NA). PCO, protein carbonyl; P-OOH, protein hydroperoxides; AOPP, advanced oxidation protein products; P-SH, protein thiol fraction; pr, protein.
The lipid peroxidation biomarkers
The lipid peroxidation biomarkers profile of YC, TANA, and NA rats are given in Fig. 3, A–C. MDA concentrations in TANA and YC rats were significantly lower than in NA rats (p<0.01 for both). There were no significant differences between TANA and YC rats. L-OOHs and CD concentrations showed similar characteristics (p<0.01 and p<0.001, respectively, for both).

Lipid peroxidation biomarkers in kidney tissue of naturally aged rats (NA; n=8), testosterone-administered naturally aged rats (TANA; n=8), and their corresponding young controls (YC; n=8). Results are expressed as mean±standard error of the mean (SEM). Data are statistically different between groups, (**p<0.01; ***p<0.001 YC vs. NA), (xx p<0.01 TANA vs. NA). MDA, malondialdehyde; LHP, lipid hydroperoxides; CD, conjugated dienes; pr, protein.
The glycoxidation adducts biomarkers
The glycoxidation adducts biomarkers profile of YC, TANA, and NA rats are given in Fig. 4. prb-AGEs were significantly higher in NA rats than in YC rats (p<0.01). Although there was a trend toward lower prb-AGEs in TANA rats, these biomarkers were not found to be significantly lower when compared with those in NA rats. Additionally, there were no significant differences between TANA and YC rats.
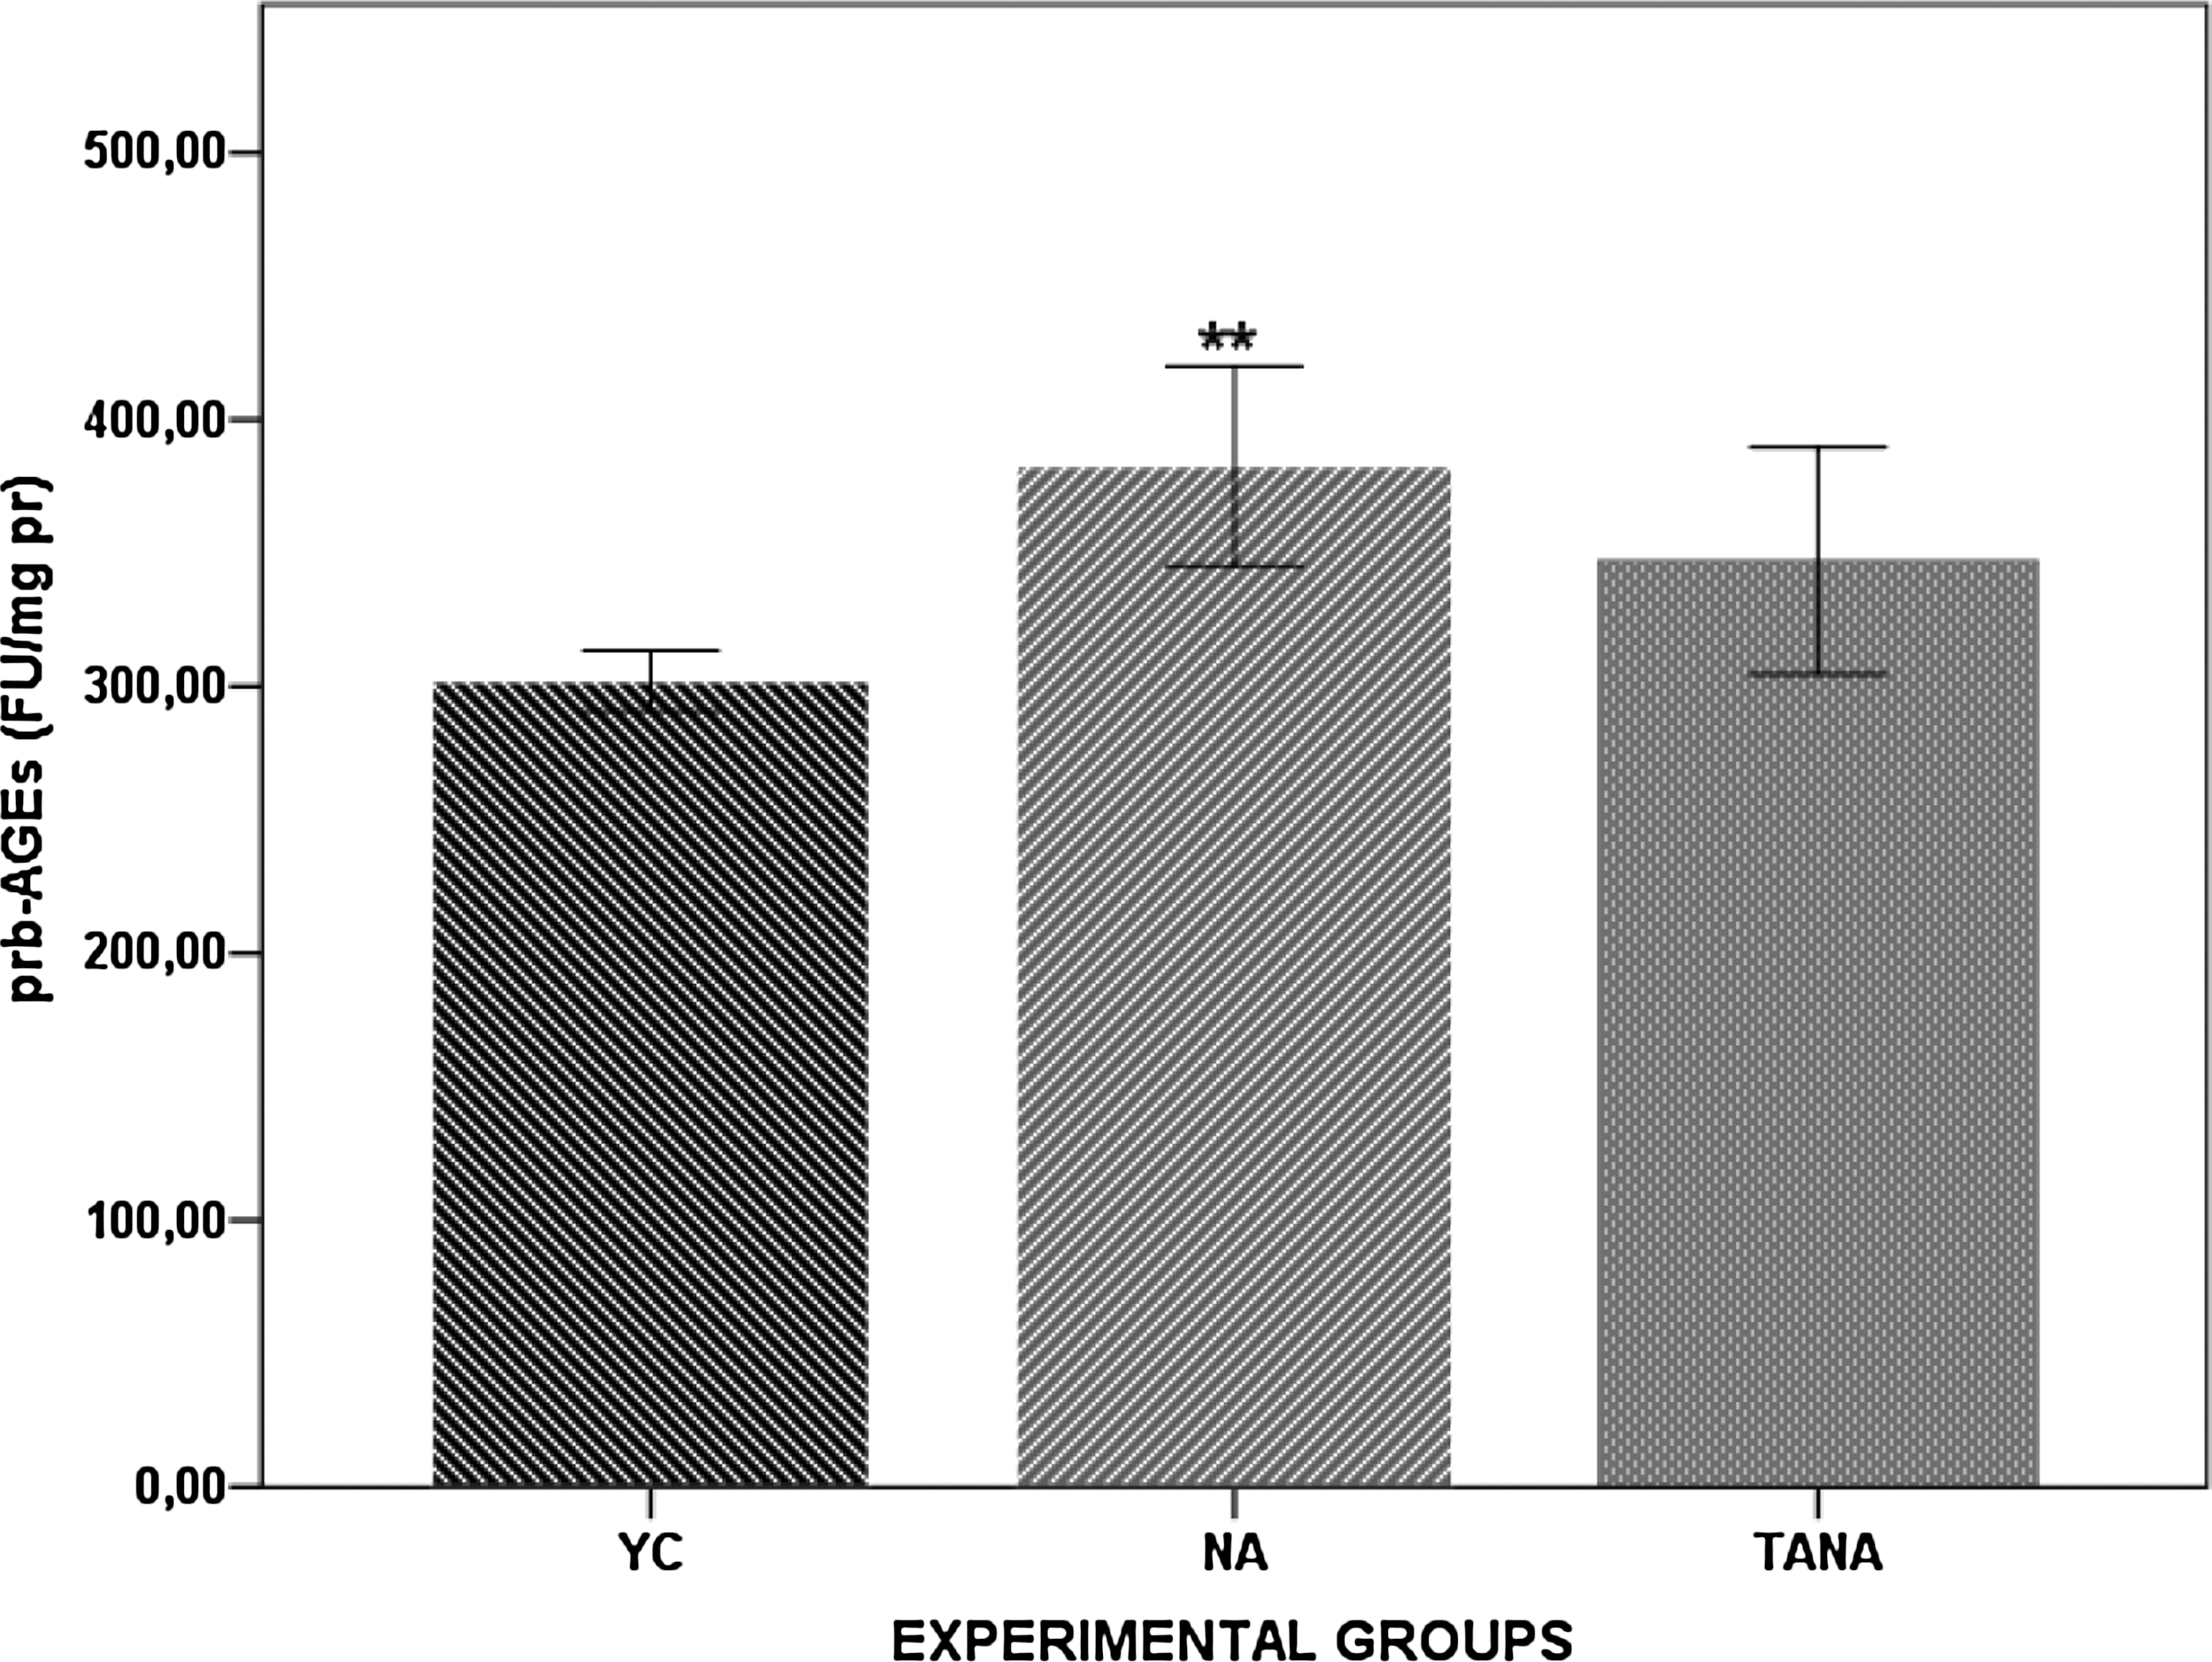
Glycoxidation adducts biomarker in kidney tissue of naturally aged rats (NA; n=8), testosterone administered naturally aged rats (TANA; n=8), and their corresponding young controls (YC; n=8). Results are expressed as mean±standard error of the mean (SEM). Data are statistically different between groups, (**p<0.01 YC vs. NA). prb-AGEs, protein-bound advanced glycoxidation end products; FU, fluorescence units; pr, protein.
The non-enzymatic redox homeostasis biomarkers
The non-enzymatic redox homeostasis biomarkers profiles of YC, TANA, and NA rats are given in Fig. 5, A–C. FRAP levels were significantly higher in TANA and NA rats than in YC rats (p<0.05 and p<0.001, respectively). There were no significant differences for each group for thiol fraction parameters.

Enzymatic redox homeostasis biomarkers in kidney tissue of naturally aged rats (NA; n=8), testosterone-administered naturally aged rats (TANA; n=8) and their corresponding young controls (YC; n=8). Results are expressed as mean±standard error of the mean (SEM). Data are statistically different between groups, (++ p<0.01 YC vs. TANA), (**p<0.01; ***p<0.001 YC vs. NA), (xxx p<0.001 TANA vs. NA). Cu-Zn SOD, Cu-Zn superoxide dismutase; CAT, catalase; XO, xanthine oxidase; pr, protein.
The enzymatic redox homeostasis biomarkers
The enzymatic redox homeostasis biomarkers profile of YC, TANA, and NA rats are given in Fig. 6, A–C. Cu-Zn SOD activities were significantly higher in TANA and YC rats than in NA rats (p<0.001 for both). CAT activities were significantly lower in TANA and NA rats than in YC rats (p<0.01) xanthine oxidase activity in TANA and YC rats was significantly lower than in NA rats (p<0.001 for both).

Non-enzymatic redox homeostasis biomarkers in kidney tissue of naturally aged rats (NA; n=8), testosterone-administered naturally aged rats (TANA; n=8) and their corresponding young controls (YC; n=8). Results are expressed as mean±standard error of the mean (SEM). Data are statistically different between groups, (+p<0.05 YC vs. TANA), (***p<0.001 YC vs. NA). FRAP, ferric reducing anti-oxidant power; T-SH, total thiol fraction; NP-SH, non-protein thiol fraction; pr, protein.
The baseline and post-injection testosterone levels
The baseline and post-injection testosterone levels at the 15-day post-drug time when rats were euthanized are given in Fig. 7. Basal serum testosterone levels were found to be lower in NA and TANA rats when compared to the respective young controls. On the other hand, testosterone levels in TANA rats were significantly higher than NA rats.
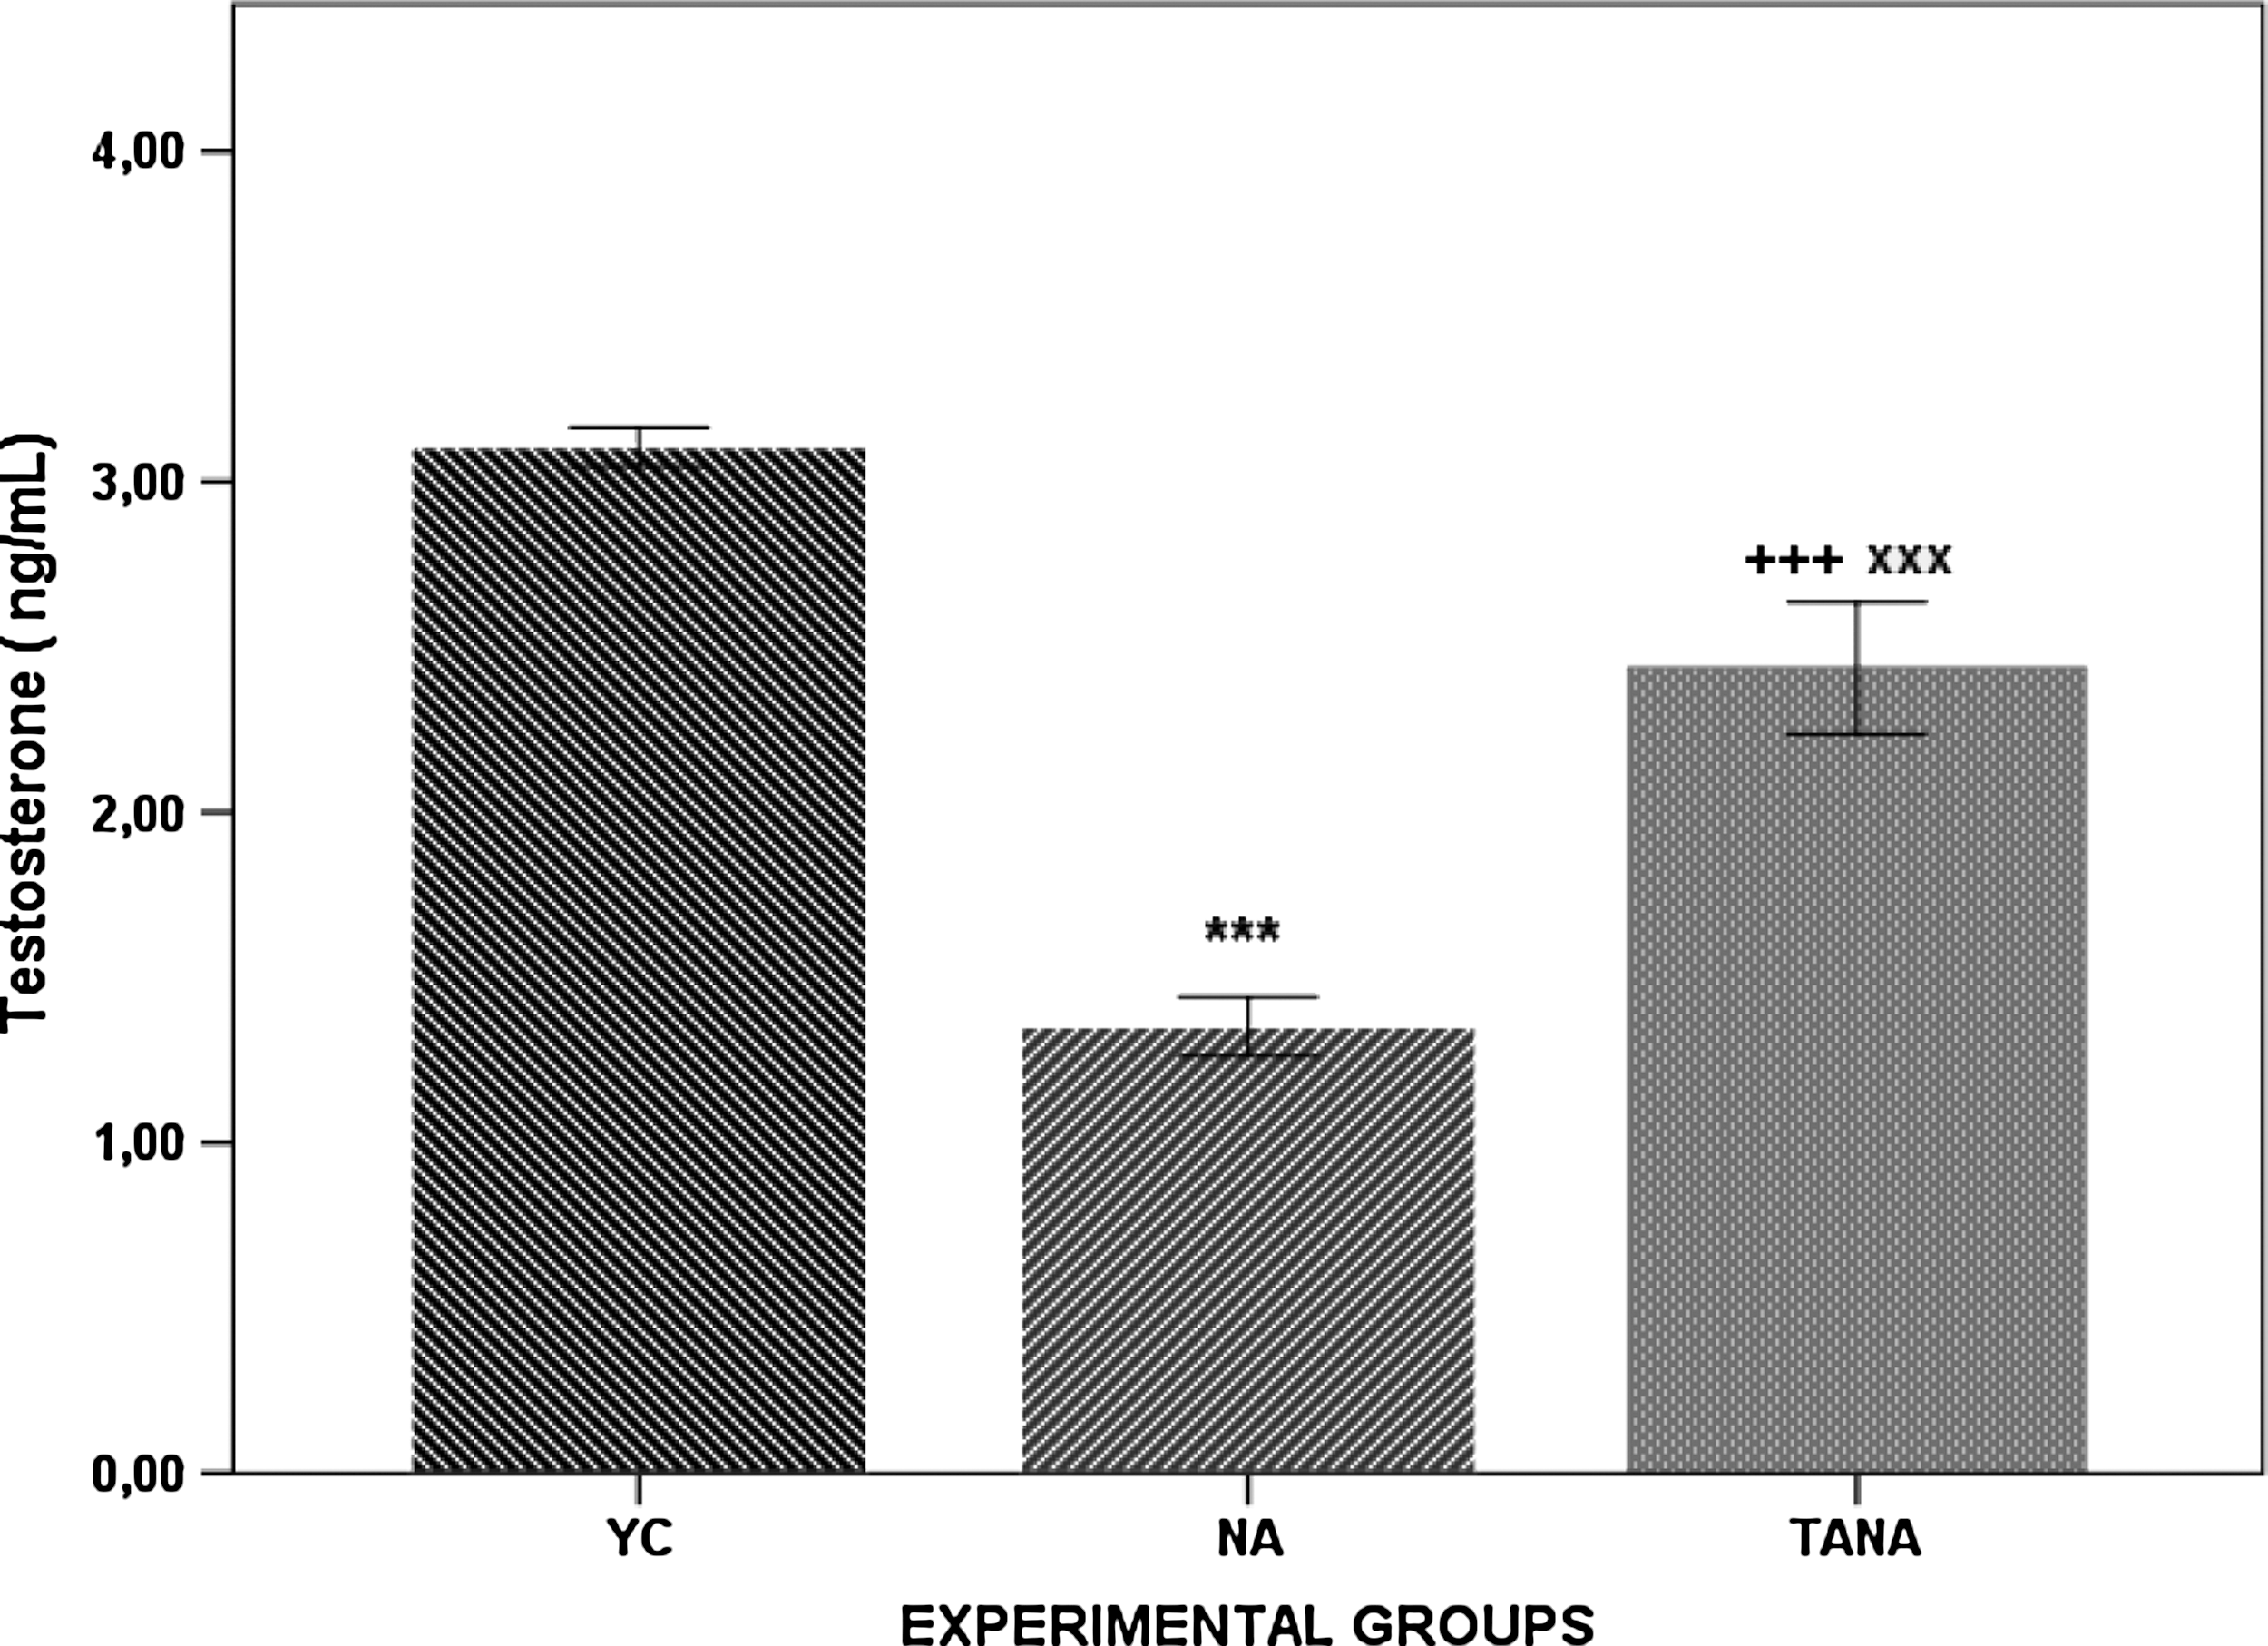
The baseline and post-injection testosterone levels at the 15-day post-drug time in naturally aged rats (NA; n=8), testosterone-administered naturally aged rats (TANA; n=8), and their corresponding young controls (YC; n=8). Results are expressed as mean±standard error of the mean (SEM). (+++p<0.001 YC vs. TANA), (***p<0.001 YC vs. NA), (xxx p<0.001 TANA vs. NA).
The baseline and post-injection creatinine levels
The baseline and post-injection creatinine levels at the 15-day post-drug time when rats were euthanized are given in Fig. 8. Basal serum creatinine levels were not changed in both NA and TANA rats when compared to the respective young controls.
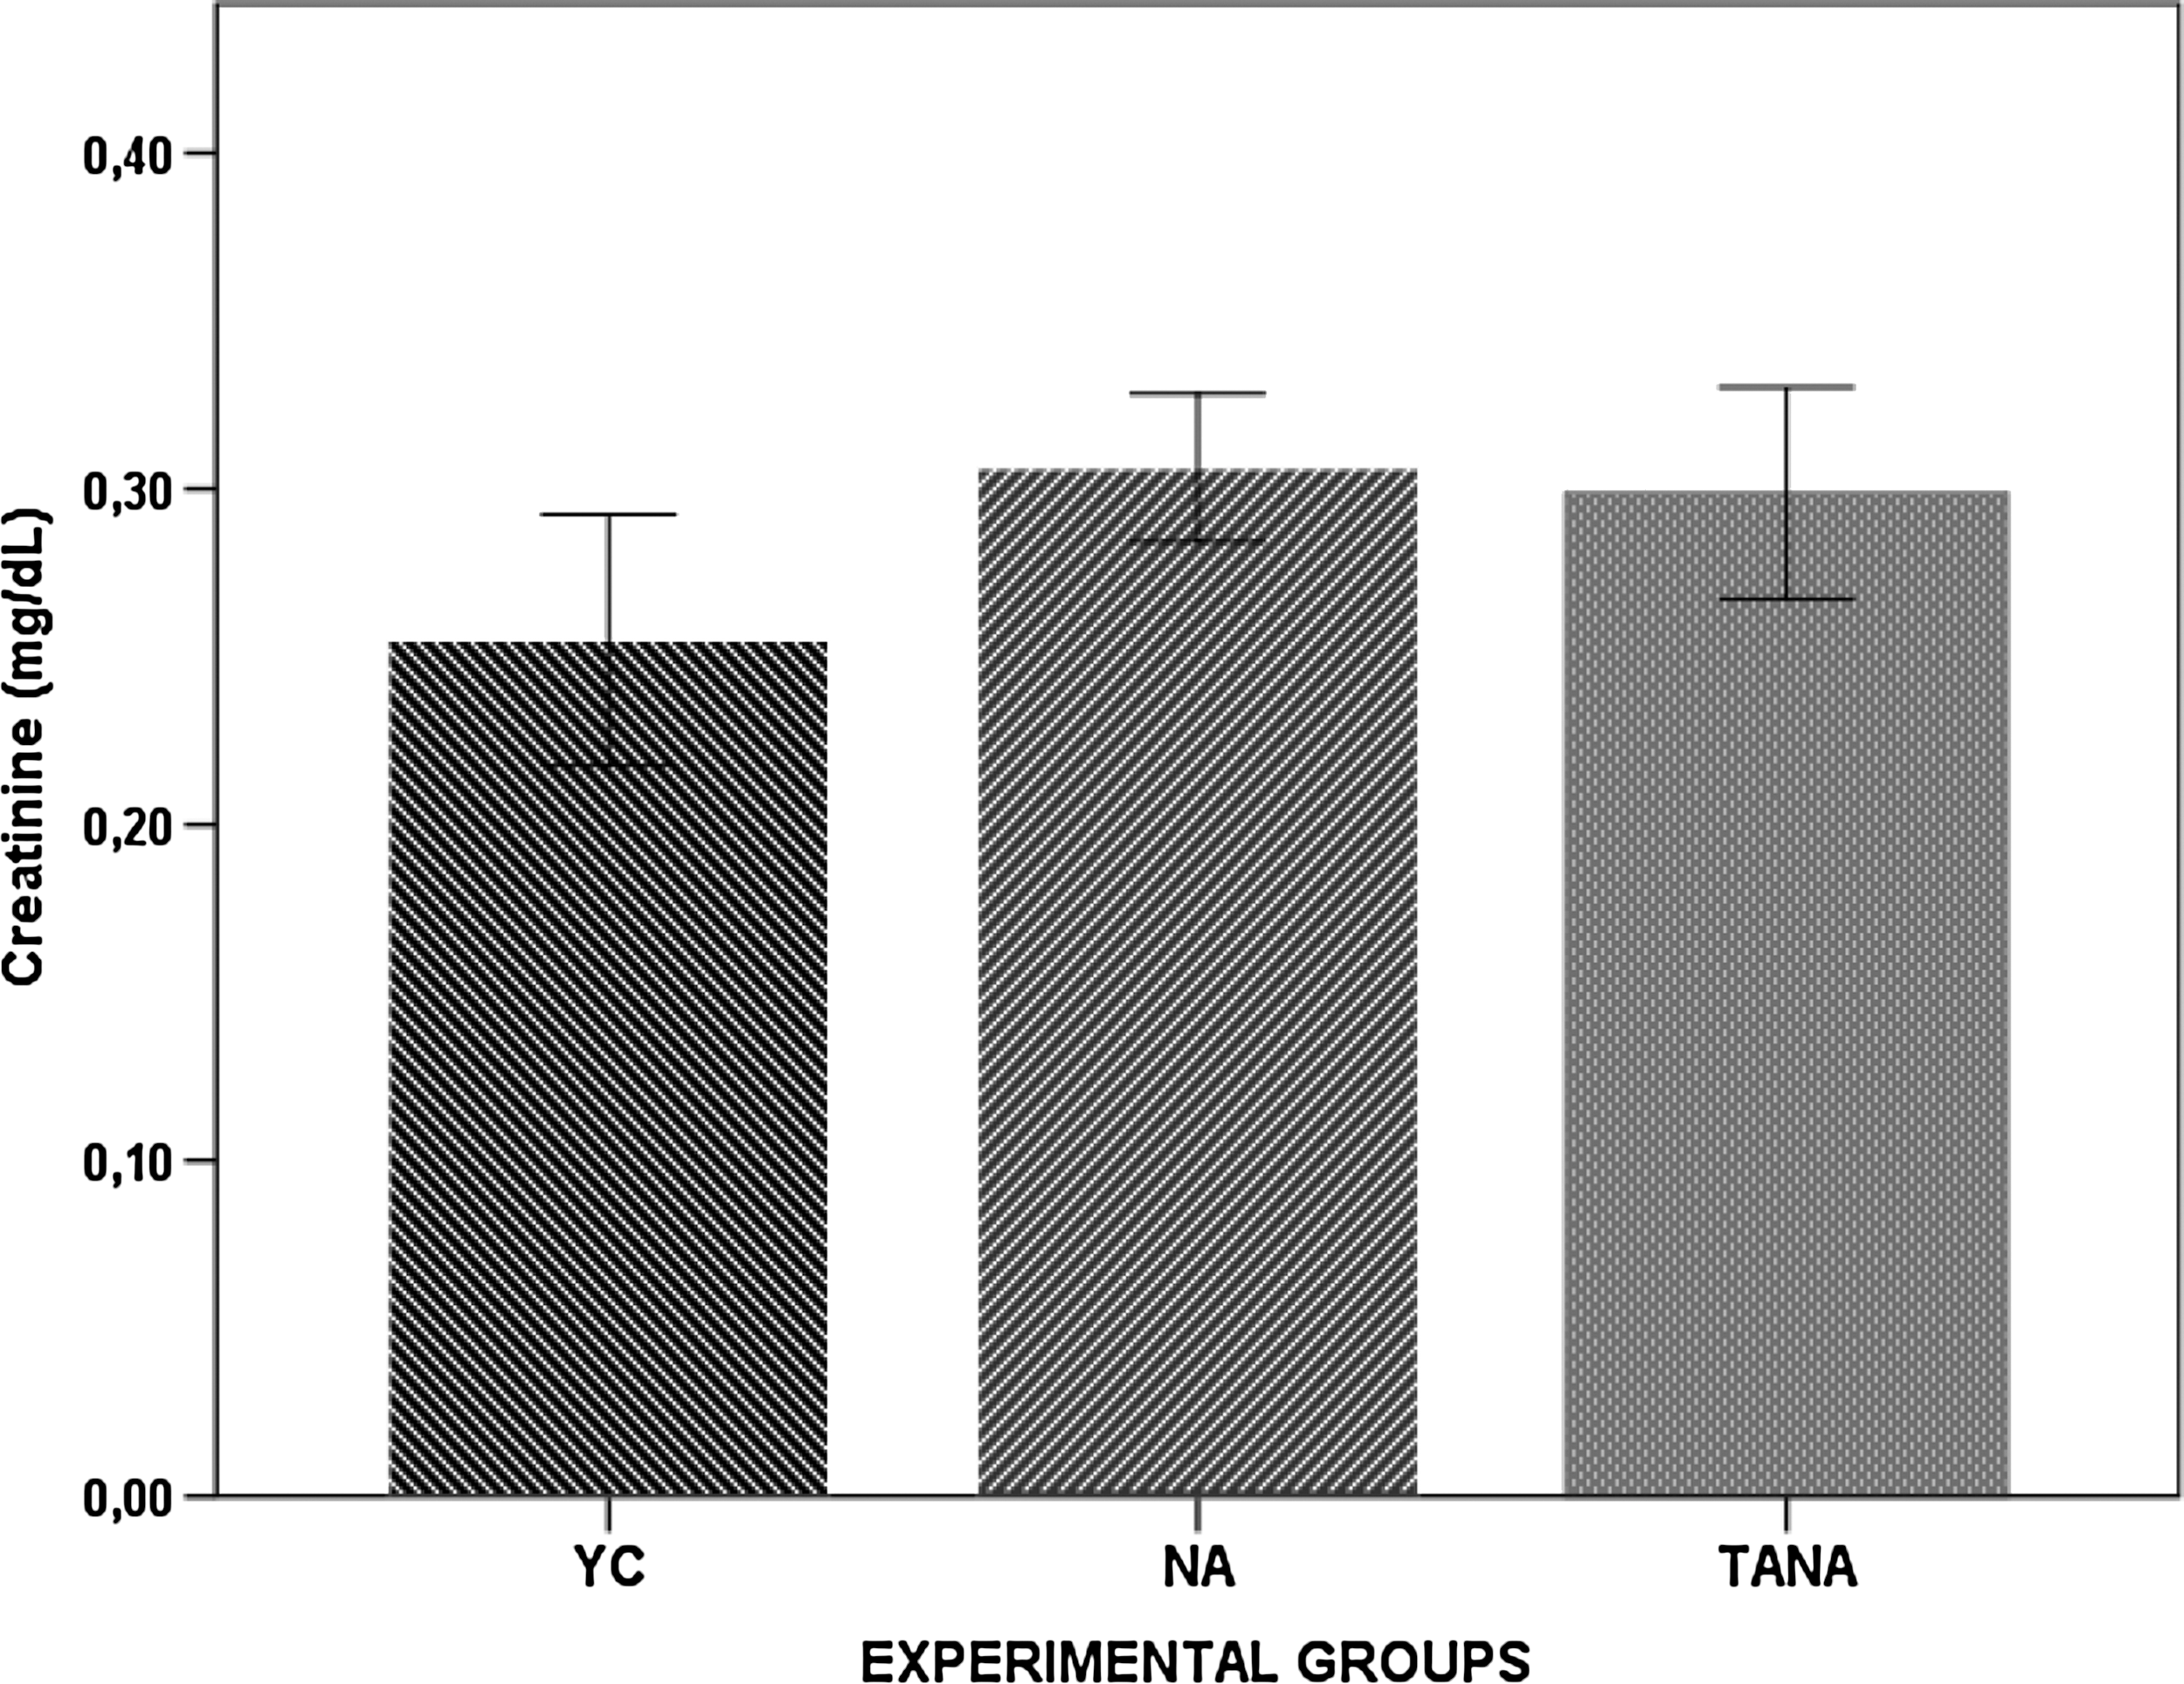
The baseline and post-injection creatinine levels at the 15-day post-drug time in naturally aged rats (NA; n=8), testosterone-administered naturally aged rats (TANA; n=8), and their corresponding young controls (YC; n=8). Results are expressed as mean±standard error of the mean (SEM).
Discussion
The aging process of an organism is characterized by a gradual and progressive functional decline of all vital organs/tissues. 43 It is well known that the extent of the generalized systemic oxidative stress is considered to be the main risk factor for the occurrence and progression of macromolecular damage of plasma constituents 44,45 and mitotic 46 and post-mitotic tissues. 47,48,49 Post-mitotic organs, such as kidney, are at greater risk of being damaged by free radicals due to their high energy demands. Post-mitotic tissues are generally much more vulnerable to oxidative protein damage than the mitotic cells. 2 The signs of oxidative damage of cellular macromolecules usually appear early at these body sites. 2
It has been demonstrated that testosterone leads to an increase in expression of the renal anti-aging klotho gene via an androgen receptor-mediated pathway. 50 Testosterone levels decline with aging due to a decrease in its biosynthesis 16 and increased metabolic consumption. 17 In females, it is well known that estrogen has protective effects against oxidative stress, 5 but the possible modulatory effect related to anti-oxidant effects of testosterone is still not fully clarified. Kidney tissue is highly vascularized, and it is impacted by aging of the vascular system. Renal functions decline and glomerulosclerosis increases with aging. However, the effect of decreased androgen levels on renal health is controversial. 51 It is unknown whether renal dysfunction or renal protection by testosterone is associated with direct effects of testosterone on the renal cells or indirect effects of the hormone (e.g., in renal vasculitis). Because human renal proximal tubule and cortical collecting duct cells express enzymes involved in androgen synthesis 52 as well as androgen receptors, 53 one may speculate that testosterone regulates renal function by a direct mechanism. 54
Age-related renal failure has previously been shown to be associated with impaired redox homeostasis in plasma
51
and kidney tissue.
49
Imbalance in redox homeostasis leads to macromolecular damage in cellular macromolecules, such as proteins, lipids, and DNA. Oxidative modifications in aromatic amino acid residues of tissue proteins can be assessed with various biomarkers, such as DT, KYN, NFKYN, and global biomarkers of oxidative protein modifications, such as PCO, AOPP, P-OOH, and P-SH. The formation and accumulation of all of these oxidative products lead to protein dysfunction in plasma
45
and vital organs during senescence.
46,48,49
In the present study, we observed that testosterone administration did not show any anti-oxidative effects on the aromatic amino acid–derived oxidation biomarkers except KYN. Kynurenine formamidase, also known as arylformamidase and formylkynurenine formamidase, efficiently catalyzes the hydrolysis of N-formyl-
Additionally, testosterone administration resulted in a small decrease in the levels of protein oxidation biomarkers in kidney tissue. We found that PCO and AOPP concentrations in TANA rats were significantly lower compared to NA rats. P-OOH and PCOs are considered to be early oxidative biomarkers for oxidative protein damage in various tissues and plasma. 45 AOPP corresponds to highly oxidized proteins, not only for plasma albumin, 45 but also for other tissue proteins, 48,49 and it may be formed during a later phase of oxidative damage. It also contains a variety of oxidation products, such as PCOs, prDT, and AGE-pentosidine. 57 On the other hand, when we compared prb-AGEs levels between the TANA and NA groups, we found prb-AGEs were slightly decreased in TANA rats (although not statistically significant). Keeping in mind the trends observed in our study, we hypothesize that decreased PCO levels may be related to decreased levels of AOPP.
Aging is associated with chronic inflammation, which is characterized by progressive accumulation of lymphocytes and macrophages in the renal interstitium. 58 Acute kidney injury-induced inflammation and oxidative stress can also promote renal senescence. Redox imbalance in kidney tissue can worsen inflammation and injuries by enhancing the release of pro-inflammatory cytokines and altering enzymatic function. AOPPs are mainly formed by chlorine oxidants (hypochlorous acid and chloramines) resulting from myeloperoxidase activity. 59 AOPPs appear to act as true inflammatory mediators because they are able to trigger the oxidative burst in neutrophils as well as in monocytes. 59 Beyond evidence that AOPPs represent an exquisite marker of oxidative stress, their role in the pathophysiology of chronic renal failure and dialysis-related complications needs further attention. 59 Our current study found a tendency of AOPP to decrease in the kidney tissue of the TANA rats. Lack of measurement of the pro-inflammatory markers for supporting AOPP-related experimental findings represents one of the limitations of the current study. The role of specific pro-inflammatory mediators in the aging kidney and their relationship to acute kidney injury are areas that require more attention.
The formation of L-OOHs and CDs are generally accepted as important initial products in the progression of lipid peroxidation. They are formed when omega-6 polyunsaturated fatty acids react with ROS. 28,60 The reactivity of L-OOHs could be defined as the damaging ability of tissue proteins. It is also possible that L-OOHs modifying renal proteins cause renal dysfunction and probably accompany the renal aging process. 61 Reactive aldehydes are transformed into reactive aldehyde–protein adducts, producing PCOs by secondary modification reactions. 62 In our research, a significant decrease was observed in the TANA rats concerning MDA, which is the final reactive product of lipid peroxidation. We conclude that testosterone administration has a positive effect on lipid peroxidation, and increased MDA levels may be partially related to increased levels of PCO.
In TANA rats, non-enzymatic anti-oxidants tend to increase in comparison to NA rats, although the effect was not statistically significant, except for FRAP levels. Cu-Zn SOD and xanthine oxidase activities were both affected by testosterone administration in a positive manner. We conclude that decreased superoxide formation by xanthine oxidase and the effective removal of the superoxide anion radical by Cu-Zn SOD in TANA rats could both be related to the beneficial effects of testosterone administration. On the other hand, we did not observe any differences between TANA and NA rats in CAT activity; however, we did observe slightly higher activity in TANA rats in terms of mean value compared to NA rats.
It is clearly seen that the decrease in P-SH in the NA group is more sharp when compared to other groups as a thiol fraction. Although it is not statistically significant, the tendency of P-SH to decrease in the NA group shows that a naturally aged group is susceptible to oxidative stress. As is well known, protein disulfide oxidoreductases, such as thioredoxin, glutaredoxin, and thioredoxin-dependent oxidoreductases, as well as methionine sulfoxide reductase, work synergistically with mechanisms related to these systems to regulate the levels of oxidized proteins and to mildly repair oxidative proteins. This activity plays an important role in keeping a balanced redox potential required for maintaining the function of aging cells. 2 There were no significant changes in P-SH levels in NA rats compared with their corresponding YC group in our study. To be able to maintain the critical functions of thiol groups mentioned above, our finding related to the thiol status may be explained by the importance of strict maintenance of redox homeostasis in NA group.
Several assays could be made to improve this study: Plasma constituents can be modified oxidatively by a variety of free radicals and oxidants that originate from different tissues and organs in aged subjects. 45 Currently, it is still difficult to find globally accepted systemic biomarkers of aging for the assessment of organ-specific risk factors for the probability of occurrence of various age-related disorders. Basal serum creatinine levels were not found to be changed in NA and TANA rats when compared to the respective young controls. Serum creatinine may not accurately reflect the actual GFR. In the early stages of acute kidney injury, serum creatinine may be low, even though the actual levels cannot estimated. 63 The variations in serum creatine levels or GFRs may not reflect the age-related acute kidney injury. At present, whether there is any correlation between tissue-specific sensitive biomarkers of aging, such as senescence-associated β-galactosidase and systemic biomarkers of oxidative stress, remains a limitation.
The serum level of estrogen needs to be determined for chronic administration studies because testosterone could be converted to estrogen via an aromatase enzyme. It has been reported that testosterone administration of higher doses in elderly subjects may also lead to the peripheral aromatization of testosterone to estrogen. 19,21,22 Hence, we did not use long-term testosterone administration in our elderly rats. On the other hand, it is still obscure whether the effects of testosterone on renal redox homeostasis are mediated directly or secondarily to its beneficial effects on cell senescence. Further studies should be done to clarify this issue in orchiectomized young rats with or without testosterone supplementation. Nonetheless, this study is novel because it shows that single-dose administration of testosterone ameliorates redox homeostasis in the renal tissue of aged subjects. However, it not clear which testosterone-sensitive mechanisms are collaborating to restore the redox homeostasis in aged kidney after a single-dose testosterone administration. Correction of oxidative damage in kidney tissue of aged males provides a potential target for effective testosterone-based therapeutic strategies to prevent or treat age-related renal disorders.
Footnotes
Acknowledgments
This study was supported partially by Istanbul University research grants (YÖP 21261, YÖP 36675)
Author Disclosure Statement
No competing financial interests exist.
P.A., U.Ç, S.A, and K.Y. made primary contributions to the conception or experimental design of the work. U.Ç. is a consultant author for the analytical methods used in this work. The optimization of the analytical methods for the determination of tissue oxidative stress parameters was accomplished by P.A, K.Y., S.A., and A.B., who received research grants from Istanbul University and controlled the integrity of the work of other group authors. T.C., T.O., A.D.K., S.D., V.G., and A.K. also took responsibility for housing, care, and maintenance of experimental animals and made contributions to work at the laboratory. K.Y. performed the statistical analysis and prepared the figures. S.I.R. has made substantive intellectual and scientific contributions to a paper and provided final approval of the paper.