




Abstract
It has been proposed that muscle power is more effective to prevent falls than muscle force production capacity, as rapid reactions are required to allow the postural control. This study aimed to compare the effects of strength and power training on lower limb force, functional capacity, and static and dynamic balance in older female adults. Thirty-seven volunteered healthy women had been allocated into the strength-training group (n = 14; 69 ± 7.3 years, 155 ± 5.6 cm, 72 ± 9.7 kg), the power-training group (n = 12; 67 ± 7.4 years, 153 ± 5.5 cm, 67.2 ± 7 kg), and control group (n = 11; 65 ± 3.1 years, 154 ± 5.6 cm, 70.9 ± 3 kg). After 12 weeks of training, the strength-training and power-training groups increased significantly maximum dynamic strength (29% and 27%), isometric strength (26% and 37%), and step total time (13% and 14%, dynamic balance), respectively. However, only the power-training group increased the rate of torque development (55%) and the functional capacity in 30-second chair stand (22%) and in time up and go tests (−10%). Empirically, power training may reduce the risk of injuries due to lower loads compared to strength training, and consequently, the physical effort demand during the training session is lower. Therefore, power training should be recommended as attractive training stimuli to improve lower limb force, functional capacity, and postural control of older female adults.
Introduction
A
Resistance training (i.e., low movement speed and large loads) has shown effectiveness to improve muscle strength, 11,12 functional capacity, 13 and the rate of torque development (RTD). 14,15 Studies have reported that strength and power training (i.e., high movement speed and low resistance) may provide similar neuromuscular improvements in older adults, 16,17 while others have indicated that power training is more efficient than strength to enhance older adults' functional capacity. 18,19
It has been proposed that muscle power is more suitable to prevent falls than muscle force production capacity, 20 as rapid reactions are required to allow repositioning of the lower limb to reestablish postural control. 21 Skeletal muscle power (the product of the force and muscle contraction velocity) has been declined earlier and faster than muscle strength with older adults. 22 Indeed, older adults having a fall history present lower limb muscle power 23 and RTD 15 when compared to their counterparts without a fall history. 6,24 Therefore, the ability to rapidly generate large amounts of torque seems to play a relevant role when an unexpected disturbance occurs (e.g., tripping or slipping), as it determines the time required to change the lower limbs position on the ground and reestablish the postural control. 25,26 Power training at low intensity (20%) of one-repetition maximum (1RM) has been shown to be more successful to improve balance in older adults than when high-intensity load stimulus was applied (80% of 1RM). 27
There is paucity of data regarding strength and power training effects when considering the ability to recover balance after a controlled disturbance (i.e., dynamic balance). Cross-sectional studies have suggested that power training is effective to improve balance after a disturbance in older adults, 28,29 but they are limited to determine to which extent different training programs are effective to improve postural control. In addition, power-training benefits may improve the ability to recover balance after a disturbance more than strength training due to the difference between the training stimuli. Finally, testing balance in static conditions may not be as specific as in dynamic conditions. Indeed, some studies concluded that static balance tests are not able to differentiate balance control between fallers and nonfallers or between trained and sedentary older adults. 30
Therefore, the present study aimed to compare the effects of strength and power training on lower limb force, functional capacity, and static and dynamic balance in older female adults. It was hypothesized that the power training would cause larger enhancements on functional capacity and postural control than strength training.
Methods
Experimental approach to the problem
To compare the effects of strength and power training, we chose the variables that have a known influence after the training protocol: muscle force, balance, and functional capacity. The variables were assessed at pretest (PRE) and at post-test (POST) by the maximal voluntary isometric test (peak and RTD), maximal dynamic strength (1RM test), functional capacity (6-minute walking test, chair sit and reach test, 30-second chair stand test, and time up and go test), and postural control (static and dynamic tests). The participants were randomly assigned (using a computer-generated list) to two experimental groups that performed 12 weeks of strength (ST) or power training (PT), and one control group (CG) that was requested not to change their physical activity routine. Experimenters were not blinded about group allocation, as they were involved in the training programs.
Participants
Figure 1 shows the steps to recruit and allocate the participants to the groups. Older female adults (ranging from 60 to 80 years old) living in the local community and who were able to perform daily life activities without assistance were invited to participate in the study by flyers and verbal invitations. Recent studies have reported that greater likelihood of falls occurs among female older adults. 31 Eighty women registered to participate in the study and were screened according to the following inclusion/exclusion criteria: free of cardiovascular problems, osteoarthritis, severe visual impairment, neurological disease, pulmonary disease, uncontrolled hypertension, hip fracture, and current participation in structured exercise during the past 6 months. After applying the inclusion/exclusion criteria, 55 women were informed about the procedures, the benefits and risks of the investigation, and signed a written informed consent to participate in this study, which was approved by the University Ethics Committee. Participants were required to complete all familiarization sessions, tests, and training sessions, having at least 80% of training attendance. Participants would be excluded from study if they could not complete 80% of training attendance (n = 0). To control for possible learning effects, all tests were randomized.

Flow diagram of recruitment and experimental procedures.
Procedures
Peak torque and RTD
The procedures to evaluate the peak torque and RTD were similar to those previously described elsewhere. 32 In short, participants were positioned in a recumbent position with joints positioned at ∼90°. 32 In an attempt to reduce test-learning effects, one familiarization session had been performed 1 week before the test session. In the familiarization and test sessions, participants were encouraged to perform three maximal voluntary isometric contractions during 3 seconds in the dominant segment for the extensor and flexor muscles of the hip, knee, and ankle. Force–time traces were measured by a calibrated load cell (model IK-1C; Kratos) with a resolution of 0.1 kg and maximal capacity of 500 kgf. 15 The data were transmitted to an A/D converter (model NI USB 6218; National Instruments), sampled at 1 kHz using a specific software LabVIEW SignalExpress 3.0. Raw torque data were low-pass filtered with a Butterworth second-order recursive filter set at 20 Hz.
The peak torque was determined as the highest torque value obtained after the onset of voluntary contraction. The RTD was development as the slope of the force–time curve from 20% to 80% of the peak-torque values. 15 The RTD was calculated in the trial of the largest peak torque. One-minute rest interval was imposed between trials. Variables were calculated using a customized routine (MATLAB 2007; MathWorks, Inc.).
Maximal dynamic strength test
The 1RM test was obtained, according to the procedures suggested by Brown & Weir, 33 through weight stack machines: regular horizontal leg press, knee extensor and flexor exercises (Nakagym). The participants followed two familiarization sessions, conducted at least 1 day apart. In the first session, participants performed two sets of 10 repetitions using a light load (between 10 and 30 kg). In the second session, participants were requested to perform three submaximal repetitions to estimate 1RM and use it to the next session. 34 Participants attended the third session (1RM test), in which they were allowed to warm-up during 5 minutes in a treadmill and requested to execute one set of eight repetitions performed with a load that corresponded to 50% of the estimated 1RM. Then, after 2 minutes of resting, a second set of five repetitions was performed with a load that corresponded to 70% of the estimated 1RM. Finally, a maximal dynamic voluntary trial was performed with a maximal load that could be lifted one or two repetitions using a full range of motion. 33 If the participant could complete more than two repetitions, the weight was increased until a failed repetition occurred, which corresponded to not lift the weight.
Static and dynamic balance tests
For static and dynamic balance tests, a force platform (model OR 6–7; AMTI) was used to measure the three-dimensional ground reaction forces data, sampling at a frequency of 100 Hz. The static balance tests involved three experimental conditions that included (C1) double support with eyes opened, (C2) double support with eyes closed in a quiet erect posture, and (C3) tandem position with eyes opened during 60 seconds, which were randomly performed. The tests were performed barefoot, and during the open eyes conditions, participants were instructed to stare to a point placed at eye level, positioned 2 m away. Force and moment data were filtered (second-order Butterworth low-pass filter, cutoff frequency 10 Hz) and used to calculate the mean velocity and the center of pressure (COP) area sway in each condition by using a customized MATLAB routine (version 7.0; MathWorks, Inc.). The COP area was estimated by 95% confidence ellipse. 35
The dynamic balance test was performed according to the step test. 36 Participants were positioned on the force platform in a double support condition and requested to perform a step forward, as fast as they could, immediately after a small tapping applied to the heel of the dominant segment (posterior aspect of the calcaneus bony prominence). Three trials were recorded after a brief period of practice. The faster trial performed was considered for further analysis. The force–time data allowed the determination of four temporal movement phases duration: (1) step initiation, (2) preparation phase, (3) swing phase, and (4) step total time. 36
Functional capacity tests
The functional capacity was assessed through tests according to the battery proposed by Rikli and Jones. 37 It consists of four tests, including aerobic endurance (6-minute walking test), flexibility (chair sit and reach test), lower body strength (30-second chair stand test), and dynamic balance (time up and go test). The tests were performed in a randomized order with a rest period of 3 minutes. A detailed description of these tests is presented elsewhere. 37
Strength and power training interventions
The training was undertaken three times per week (Mondays, Wednesdays, and Fridays), during 12 weeks (36 training sessions). Training sessions lasted ∼60 minutes, were separated by a minimum of 2 days, and were performed under the direct supervision of an exercise instructor to ensure safety and maintenance of the exercise protocol. Briefly, training consisted of a 5-minute warm-up (walking in a treadmill at 5 km/h), seven resistance-training exercises (horizontal leg press, bilateral knee extension, bilateral knee flexion, plantar flexion in the step, abductor and adductor machines), and another 5 minutes of cool-down (stretching exercises). Following pretests, participants undertook an 1RM testing session (see Maximal Dynamic Strength Test section), with the 1RM value used to calculate the individual's resistance training load.
Power-training group
The PT group performed the concentric phase as fast as possible and the eccentric phase at ∼2 seconds of duration, with a 3-minute rest interval between sets. The participants performed three to four sets of eight to six repetitions. The training load started at 40% of 1RM and it was ∼6%–8% increased every 2 weeks. 16 The load at the end of training session corresponded to 80% of the 1RM test performed in the pretest.
Strength-training group
The concentric and eccentric phase durations of the ST group were ∼2 seconds each, with 1-minute rest interval between sets. Participants completed three sets of eight repetitions of each exercise. The training started at 60% of 1RM through two initial sessions, and the workload was progressively increased every 2 weeks. The resistance was increased when the number of repetitions that a participant could complete was greater than eight in their final set, 21 then adjusted to continue performing eight maximal repetitions.
Statistical analysis
A descriptive statistical analysis (mean, mean difference [MD], and standard deviation [SD]) was followed by the Shapiro–Wilk and Levene tests confirming data normality and variance homogeneity, respectively. The similarities of participants' characteristics were checked through one-way ANOVA to body weight, height, and body–mass index variables. The effects of training programs (ST and PT) at different instants (pre- and post-test) on peak torque, RTD, functional capacity, 1RM, and balance were assessed by applying mixed-model ANOVA. The Tukey test was used to determine where differences occurred. In addition, partial eta squared (η 2 p) effect size was determined when time and training interactions occurred. 38 The level of significance was set at p < 0.05.
Results
The physical characteristics of the PT, ST, and CG groups were similar (p > 0.05) (Table 1). The CG remained unchanged (p > 0.05) from pre- to post-tests for all dependent variables. There was time and group interaction to the 1RM of horizontal leg press [F (2,34) = 5.07; p = 0.012; η 2 p = 0.23], knee flexor [F (2,34) = 11.91; p < 0.001; η 2 p = 0.41], and knee extensor [F (2,34) = 16.12; p < 0.001; η 2 p = 0.48] (Fig. 2). The PT and ST groups increased from pre- to post-test the 1RM to horizontal leg press (PT: MD = 14.66, SD = 9.73 kg, 95% CI: 0.44 to 1.49; ST: MD = 15.47, SD = 8.19 kg, 95% CI: 0.49 to 1.17), knee flexor (PT: MD = 8.88, SD = 6.10 kg, 95% CI: 0.48 to −1.56; ST: MD = 10.67, SD = 4.39 kg, 95% CI: 0.47 to 1.33), and knee extensor (PT: MD = 16.86, SD = 11.25 kg, 95% CI: 0.42 to 1.46; ST: MD = 17.78, SD = 5.32 kg, 95% CI: 0.64 to 1.58). In addition, the PT group presented greater 1RM to knee flexors (MD = 63.21, SD = 9.13 kg, 95% CI: −2.43 to 0.55) than the CG group at post-test instant (MD = 51.59, SD = 5.86 kg).
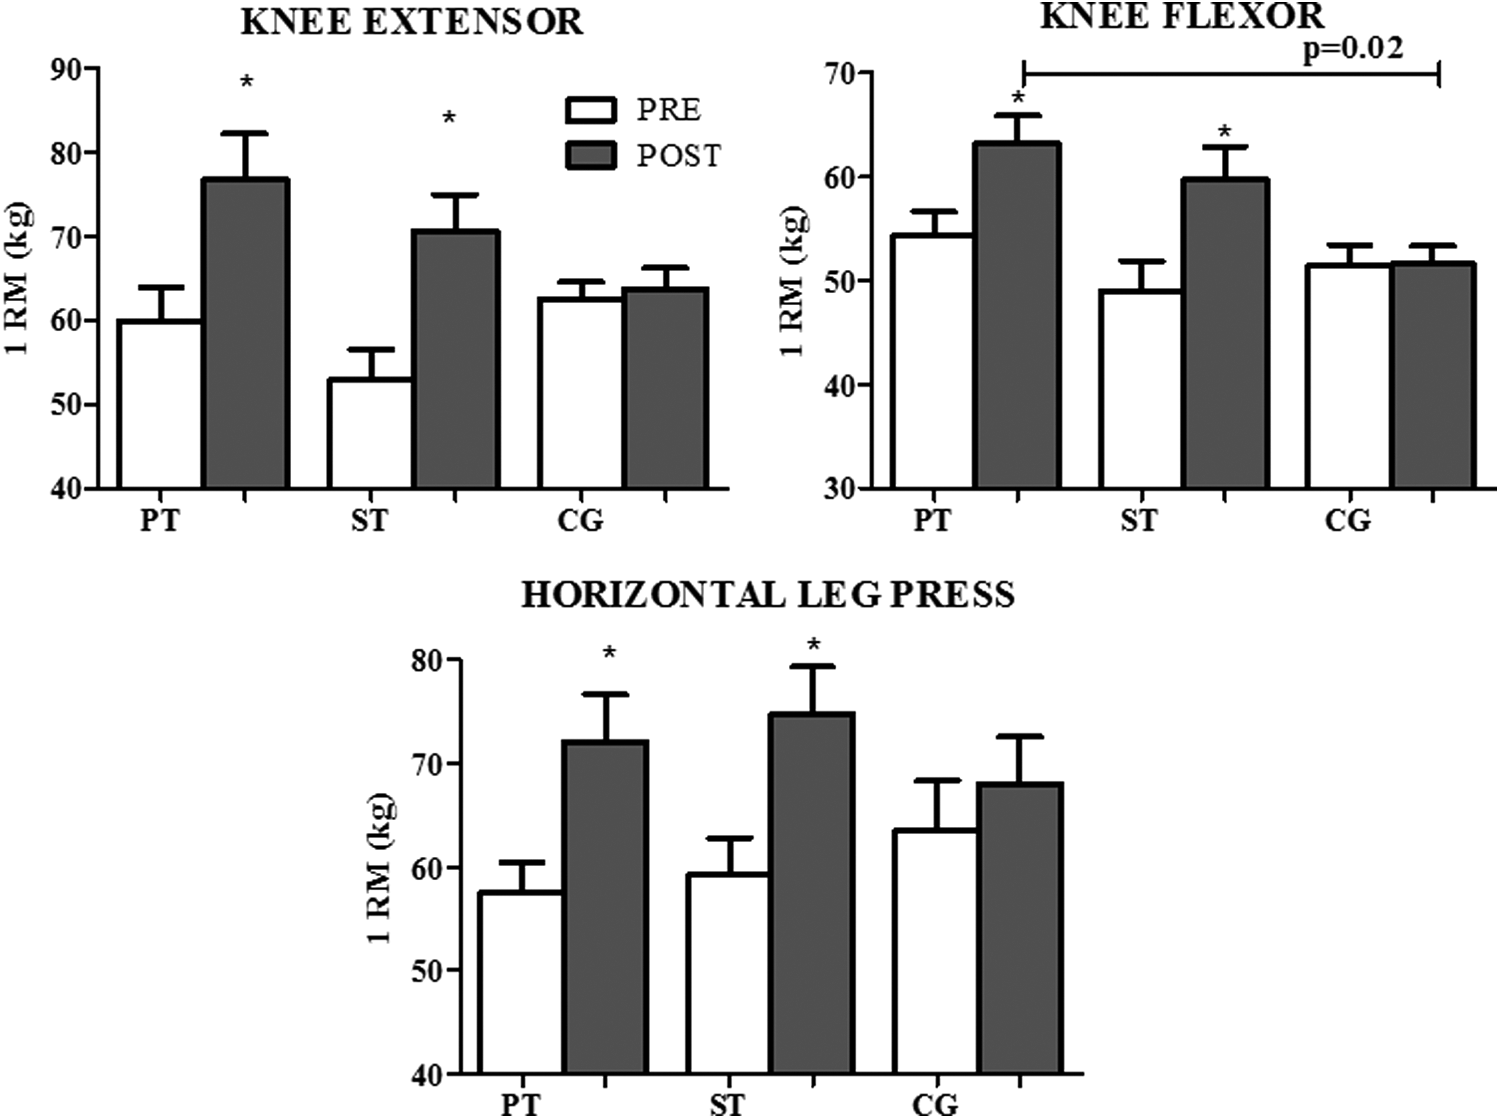
Mean and SD of 1RM test of knee extensor, knee flexor, and horizontal leg-press exercises of the PT, ST, and CG pre- and post-test. *Significantly different from pretest instant. The horizontal line presents significant difference between PT and CG groups at post-test. 1RM, one-repetition maximum; CG, control group; PT, power training; SD, standard deviation; ST, strength training.
BMI, body–mass index.
There was time and group interaction to the peak torque of hip extensor [F (2,34) = 7.30; p = 0.002; η 2 p = 0.30], hip flexor [F (2,34) = 26.18; p < 0.001; η 2 p = 0.60], dorsi flexors [F (2,34) = 5.29; p = 0.010; η 2 p = 0.23], knee flexor [F (2,34) = 17.82; p < 0.001; η 2 p = 0.51], and knee extensor [F (2,34) = 7.60; p = 0.002; η 2 p = 0.30] (Fig. 3). Both training groups increased significantly their peak torque from pre- to post-test instants to hip extensor (PT: MD = 34.75, SD = 22.12 N.m, 95% CI: 0.7 to 2.6; ST: MD = 20.58, SD = 27.54 N.m, 95% CI: 0.15 to 1.05), hip flexor (PT: MD = 16.34, SD = 3.97 N.m, 95% CI: 1.4 to 3.6; ST: MD = 11.22, SD = 8.17 N.m, 95% CI: 0.4 to 1.4), dorsi flexors (PT: MD = 3.39, SD = 2.79 N.m, 95% CI: 0.3 to 1.2; ST: MD = 3.68, SD = 4.06 N.m, 95% CI: 0.21 to 1.03), knee flexor (PT: MD = 12.37, SD = 5.24 N.m, 95% CI: 1.1 to 2.91; ST: MD = 7.5, SD = 5.17 N.m, 95% CI: 0.7 to 2.1), and knee extensor (PT: MD = 17.19, SD = 8.49 N.m, 95% CI: 0.5 to 1.6; ST: MD = 15, SD = 13.31 N.m, 95% CI: 0.4 to 1.7). In addition, PT and ST groups presented greater peak torque to hip extensor (PT: MD = 37.24, SD = 3.27 N.m, 95% CI: 1.87 to 3.59; ST: MD = 23.07, SD = 8.69 N.m, 95% CI: 0.78 to 1.68), hip flexor (PT: MD = 19.26, SD = −2.61 N.m, 95% CI: 1.48 to 2.88; ST: MD = 14.13, SD = 1.57 N.m, 95% CI: 1.03 to 2.03), knee flexor (PT: MD = 11.51, SD = 2.45 N.m, 95% CI: 1.54 to 2.98; ST: MD = 6.63, SD = 2.38 N.m, 95% CI: 1.26 to 2.46), and knee extensor (PT: MD = 11.51, SD = 2.45 N.m, 95% CI: 1.1 to 2.22; ST: MD = 6.63, SD = 2.38 N.m, 95% CI: −3.41 to 7.01) than the CG group at post-test instant. There was main time effect to the dorsi flexors (PT: 95% CI: −1.93 to −0.14; ST: 95% CI: −0.66 to 0.21).
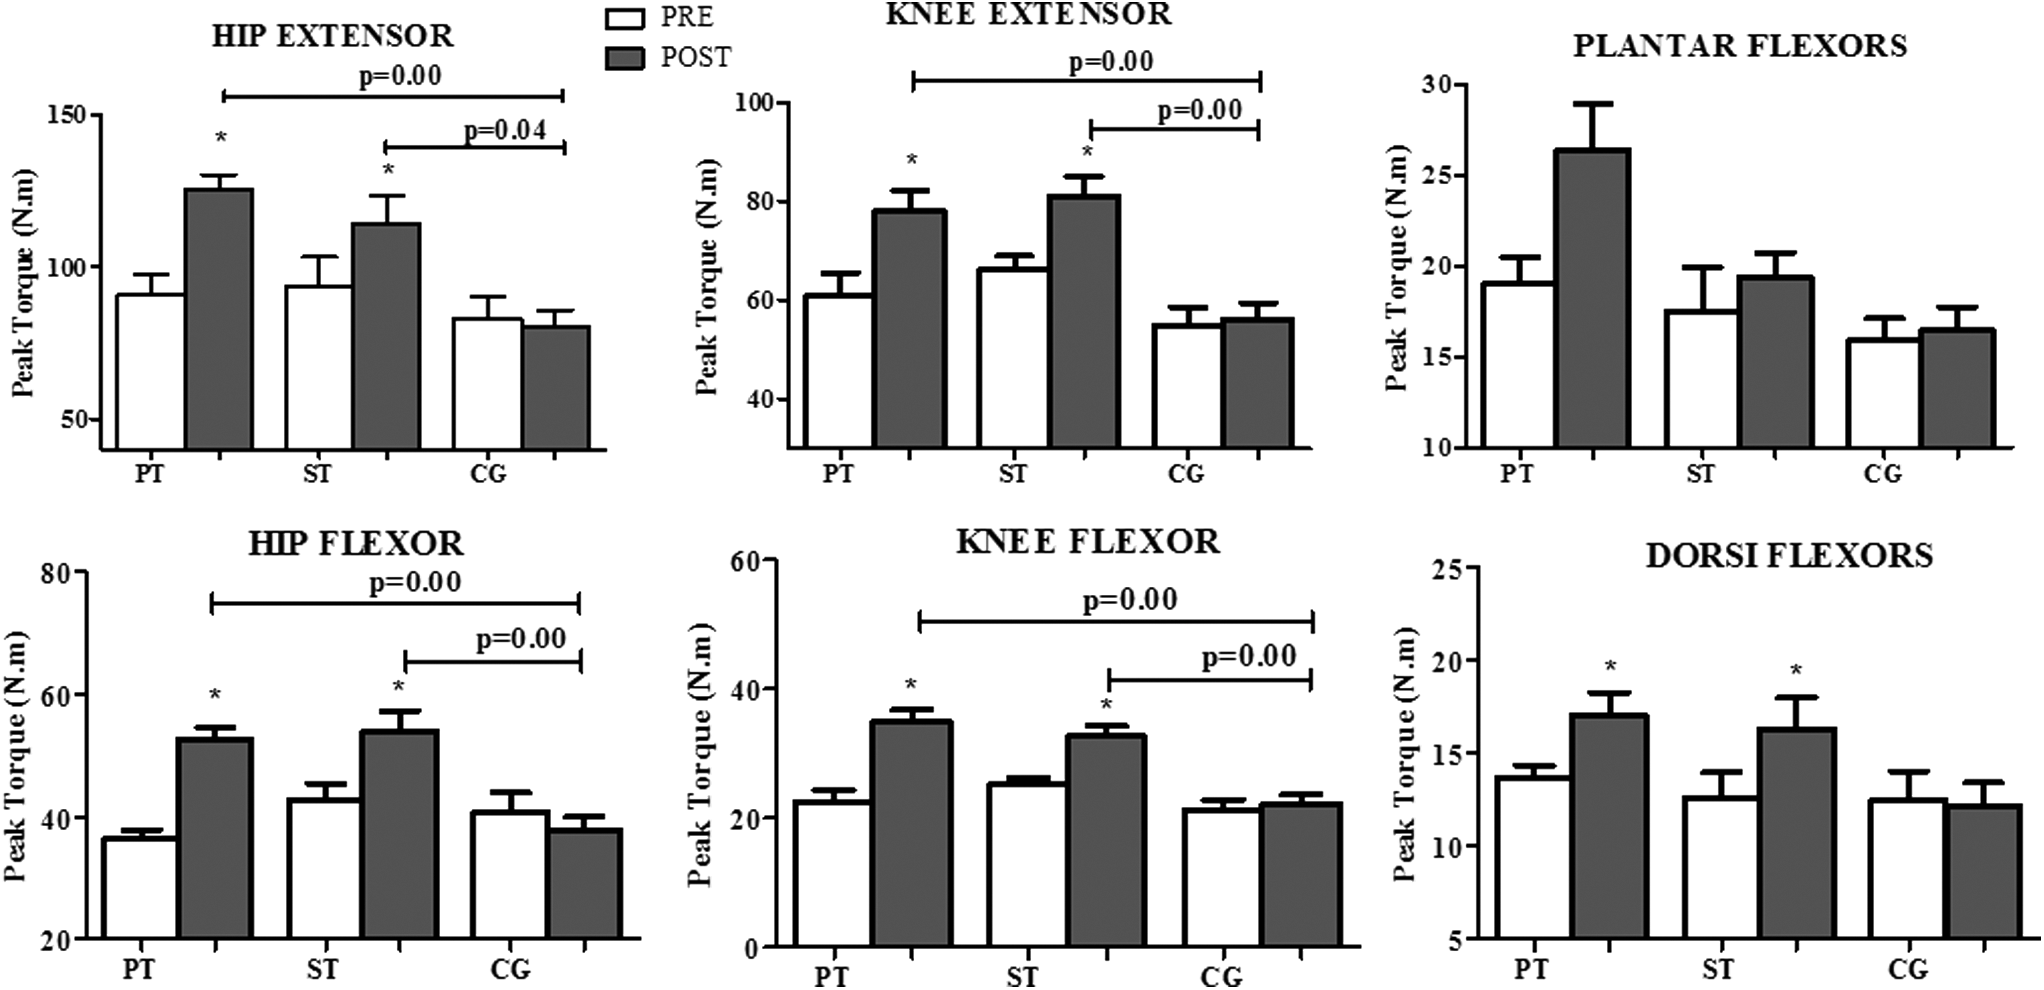
Mean and SD of the peak torque during an MVIC of the hip and knee extensors and flexors, plantar flexors, and dorsiflexors to PT, ST, and CG pre- and post-test. *Significantly different from pretest instant. The horizontal lines indicate significant difference (p < 0.05) between groups at isotime. MVIC, maximal voluntary isometric contraction.
There was time and group interaction to RTD of hip flexor [F (2,34) = 4.18; p = 0.024; η 2 p = 0.19] and hip extensors [F (2,34) = 2.31; p = 0.049; η 2 p = 0.16]. The PT and ST groups increased the RTD of hip flexor from pre- to post-test (PT: MD = 0.071, SD = 0.09 N.m.s−1, 95% CI: 0.13 to 1.33; ST: MD = 0.06, SD = 0.07 N.m.s−1, 95% CI: 0.06 to 1.14). Only the PT group increased hip extensor RTD from pre- to post-test (PT: MD = 0.15, SD = 0.12 N.m.s−1, 95% CI: 0.58 to 2.38). There was main time effect to the knee extensors (PT: 95% CI: 3.90 to 1.10; ST: 95% CI: −1.23 to 0.11) (Fig. 4).
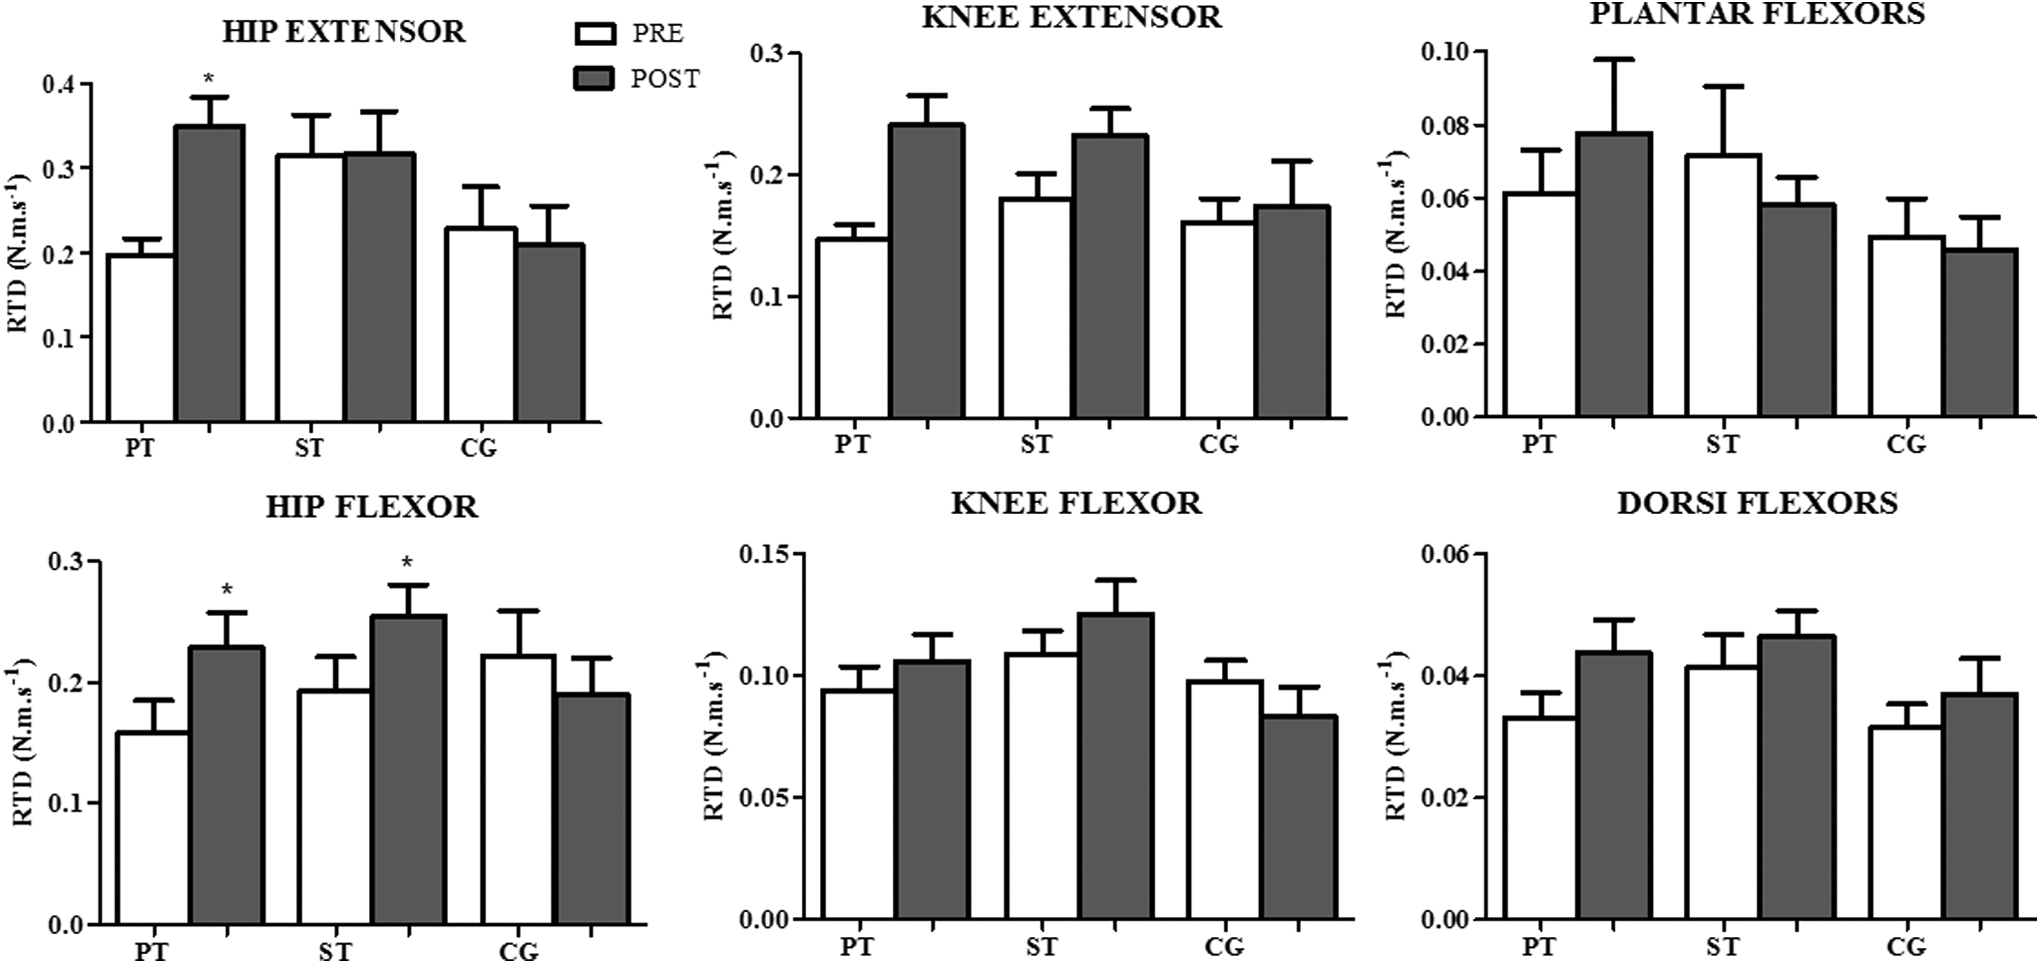
Mean and SD of the RTD of the hip and knee extensors and flexors, plantar flexors, and dorsiflexors to the PT, ST, and CG pre- and post-test. *Different from pretest instant (p < 0.05). RTD, rate of torque development.
There were no significant changes in the static balance for all groups. The dynamic balance (step test) showed main time effect to preparation phase (PT: MD = −0.09, SD = 0.06 ms, 95% CI: 0.71 to 2.60; ST: MD = −0.04, SD = 0.11 ms, 95% CI: −0.30 to 0.98), swing phase (PT: MD = −0.04, SD = 0.07 ms, 95% CI: 0.39 to 0.62; ST: MD = −0.06, SD = 0.09 ms, 95% CI: −0.06 to 1.34), step total time (PT: MD = −0.23, SD = 0.24 ms, 95% CI: 0.26 to 1.77; ST: MD = −0.25, SD = 0.35 ms, 95% CI: −0.07 to 1.44) (Fig. 5).

Mean and SD of the dynamic balance in the step test to the step initiation, preparation phase, swing phases, and step total time to the ST, PT, and CG pre- and post-test.
Functional capacity presented time and group interaction to 30-second chair stand [F (2,34) = 6.72; p = 0.003; η 2 p = 0.28] and time up and go test [F (2,34) = 4.69; p = 0.016; η 2 p = 0.21]. Only the PT group improved performance on 30-second chair stand (MD = 2.66, SD = 1.87rep, 95% CI: 0.6 to 2.1) and time up and go test (MD = −0.64, SD = 0.80 seconds, 95% CI: 0.18 to 1.26) (Fig. 6).
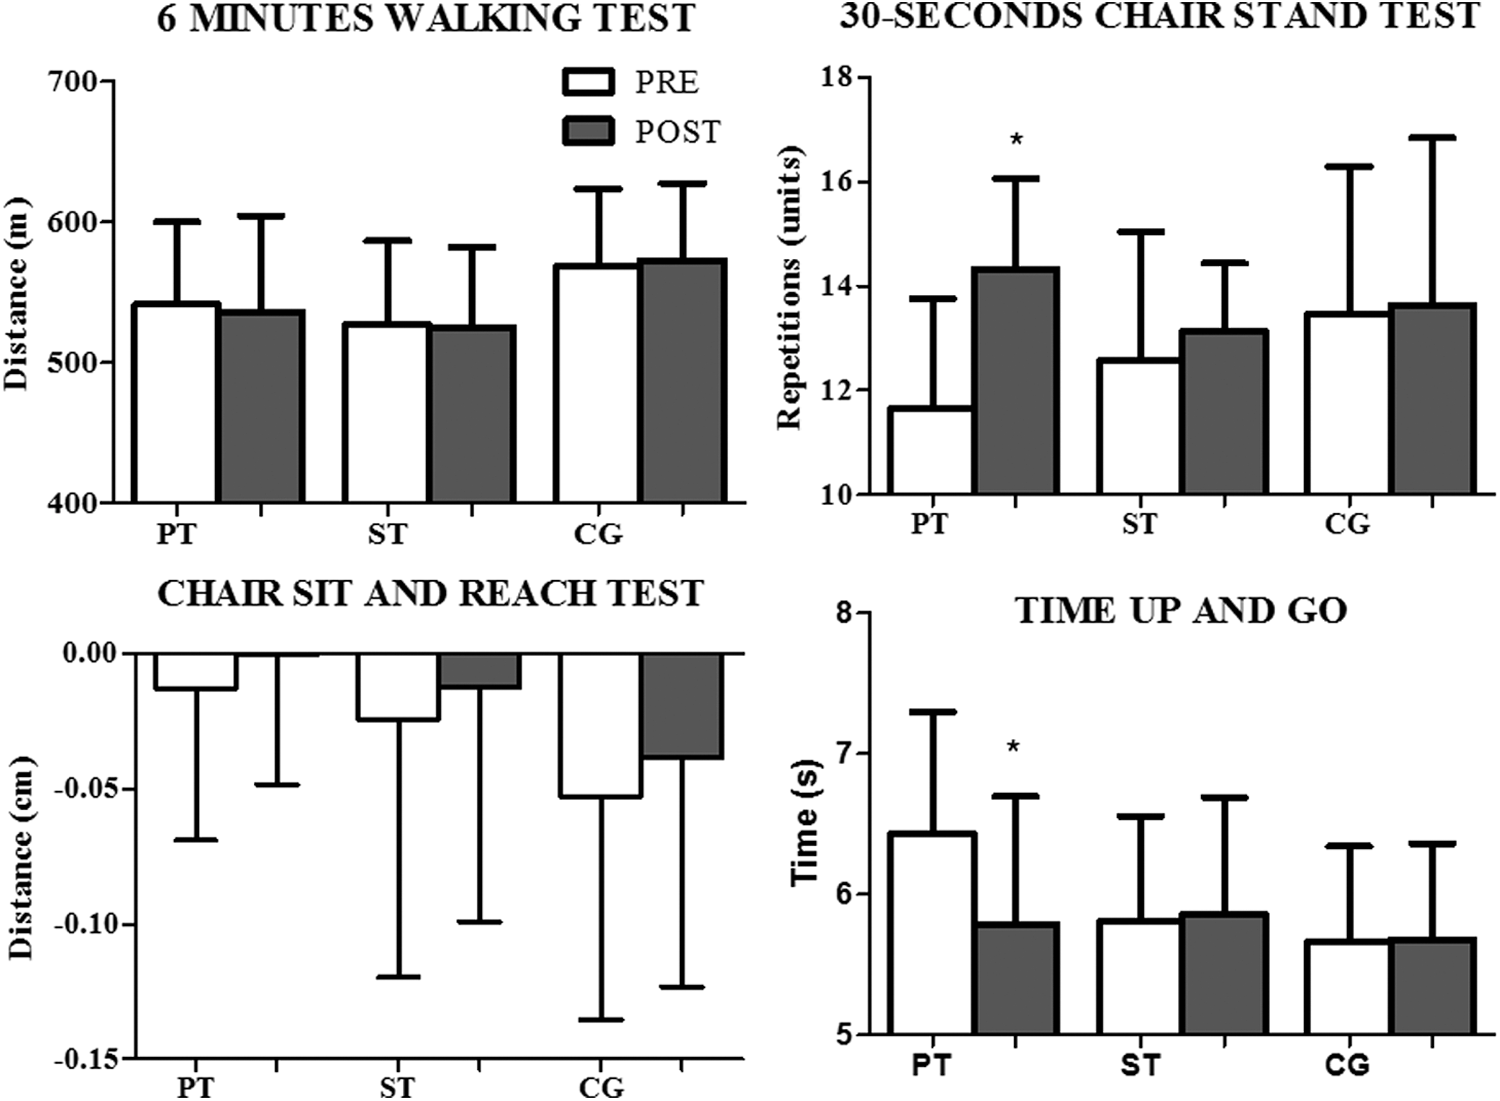
Mean and SD of the functional tests (6-minute walking, 30-second chair stand, chair sit and reach and time up and go) to the ST, PT, and CG pre- and post-test. *Significantly different from pretest instant (p < 0.05).
Discussion
The aim of this study was to compare the effects of ST and PT on lower limb force, functional capacity, and static and dynamic balance after an external stimulus (i.e., heel tapping) in older female adults. The main findings indicated that both training stimuli increased lower limb force. However, the PT induced higher gains on RTD, functional tests, and dynamic balance than ST.
The lower limb force improvements were similar to the findings reported in previous studies. 14,16,25 It has been suggested that ST and PT provide similar improvements on muscle force production capacity, despite the large differences between training stimuli. 16,25,39 However, adaptations in response to training may differ between ST and PT. High-velocity and low-load training may have induced neural changes in muscle recruitment that were transferred to isometric and dynamic exercises. 40 In addition, PT has been reported to be more efficient to improve RTD 41 and muscle power 42 than ST. Changes in the PT group may have occurred by greater activation increases in the motor units than the ST, which is likely to exert a large influence on type II muscle fiber adaptation and RTD improvements. 43 Power training (performing repetition as fast as possible) is feasible, well tolerated, and can effectively improve lower extremity muscle power in healthy older adults. 44 The ability to generate torque rapidly is an essential requirement to change the lower limb position on the ground, which is a key component to improve the ability to recover balance, to perform daily living activity, and to reduce the risk of falls. 45
No changes in static balance were found in the present study. These results are similar to others 9,46 and may be explained by the static nature of the test, which may not have challenged the participant's ability to recover balance after a perturbation. Older adults present no difficulties in maintaining an erect static posture even in the tandem position. Indeed, the center of pressure in static condition may not require a large amount of muscle strength and/or power. 23
The dynamic balance test induced similar improvements on the step total time (ST = 13% and PT = 14%) in both groups, whereas the preparation phase improved only in the PT (20%) and ST only during the swing phase (24%). The faster preparation phase in the PT group may be associated with the preparation phase/anticipatory postural adjustments. This increase in the PT may be related to the improvements in the RTD 45 and improved coordination during gait initiation. 36 However, the faster swing phase in the ST group is mainly dependent on neuromuscular mechanisms related to the build-up of muscle force and power to execute the step. 47 The improvements in the ST may be related to the increase in the isometric and dynamic strength. Therefore, the decrease in the step total time after training represents a quick step execution, which is an important skill to alter the base of support, preserve stability, and prevent falls in older adults. 48
Functional capacity improvement was only found in the PT group. The results are similar to other studies 19,25,44 that power training is associated with greater improvements in functional capacity performance compared to strength training. 44 In fact, the 30-second chair stand test is related to the muscle strength and power components of the lower limbs. 49 In contrast, the time up and go test is a composite measure of functional mobility, which includes transfer tasks, walking, and turning, and therefore incorporates neuromuscular components such as power, agility, and balance. 50 Furthermore, the functional capacity improvement in the PT group may be associated with improved preparation phase, muscle strength, and RTD. Power training seems to decrease the activation threshold of fast-twitch motor units and increase their initial firing rates. 51 The adaptations in motor-units are likely to improve power production and the RTD that is related to the older adults' functional capacity. 43 Therefore, isometric and dynamic strength and RTD enhancements are important for functional capacity improvement. Thus, the PT seems to present more efficiency to improve functional capacity than the strength training. This is an important finding of the study, since recent systematic review has found that muscle power is a more discriminant predictor of functional capacity performance in older adults than muscle strength. 44
This study has some limitations that should be addressed. The present study involved participants with a good physical conditioning at the baseline, which may have reduced the magnitude of the training effects. Applying the same protocol in the frail elderly may produce a larger impact on balance parameters even in static balance tests. 52 The small sample size of the study might be a limitation of the study too.
In conclusion, power training presented neuromuscular adaptations that changed the lower limb force, functional capacity, and postural control of older female adults, even though they have lifted less weight per training session than the ST group. It suggests that power training may improve the strength of older female adults. The physical effort demand imposed during the power training sessions was lower than that observed in strength training.
Practical Applications
The strength and power training presented effectiveness to improve the dynamic and isometric strength, whereas power training was effective for increasing the RTD and functional capacity. Moreover, strength and power training presented improvements in the ability to recover balance in the step total test. Possibly, the lifted less weight may attract older female adults to maintain their training status for longer. Hence, the results indicate that exercise recommendations should also consider power training as an attractive training to older female adults.
Footnotes
Acknowledgment
The present study was financially supported by the Federal University of Paraná and CAPES.
Author Disclosure Statement
No competing financial interests exist.