




Abstract
Aging is accompanied by a progressive decline of muscle mass and strength and also higher levels of circulating cytokines such as growth differentiation factor 15 (GDF15). Studies evaluating the association of GDF15 with muscle mass and strength are rare. In this analysis, we investigated GDF15 concentrations and their relationship with muscle mass and strength in older men compared with women. GDF15 serum concentrations were measured in 103 (60 years and older) hospital patients and an age-matched control group with an immunosorbent assay. Skeletal muscle mass was determined with the bioelectrical impedance analysis. Grip strength and knee extension strength were assessed and normalized for height. Associations between GDF15 concentrations and muscle mass and strength were evaluated with general linear models. Male patients showed higher levels of GDF15 compared with female patients (p = 0.021). Elevated GDF15 concentrations were associated with lower measures of muscle mass, exclusively in men, after adjustment for age and number of drugs per day. Our results indicate sex differences between associations of GDF15 with muscle mass and strength parameters in a cohort of older hospital patients.
Introduction
Growth differentiation factor 15 (GDF15) was first isolated in 1997 and is a member of the transforming growth factor (TGF) β superfamily. 1,2 GDF15 is involved in inflammatory and apoptotic pathways and is associated with all-cause mortality in humans. 3,4 Recent studies show that GDF15 is induced, for example, in skeletal muscle under cellular stress conditions, and additionally, after vigorous exercise, an increase of circulating GDF15 has been observed. 5,6 Increased expression of GDF15 has been associated with reduced expression of microRNAs involved in muscle growth regulation in patients with intensive care unit-acquired weakness. 7 These findings suggest a role of GDF15 as a suppressor of muscle growth and a potential contributor to loss of muscle mass and functional decline. Just recently, an association of elevated GDF15 with lower physical performance was observed in healthy adults aged between 22 and 93 years. 8 With the discovery of its receptor glial cell line-derived neurotrophic factor (GDNR) family receptor alpha like (GFRAL), which is exclusively expressed in the brain stem, anorexic properties of GDF15 were revealed. 9
The progressive decline in skeletal muscle mass and strength with age is associated with an increased likelihood of adverse outcomes, including falls, fractures, physical disability, and mortality. 10 –12 The etiology of decline in skeletal muscle mass and function is multifactorial, including hormonal and neuromuscular changes, mitochondrial dysfunction, and reduced postprandial protein synthesis, as well as factors related to lifestyle, such as physical inactivity. 13,14 In addition, malnutrition, disease, polypharmacy, or inflammation further exacerbates loss of muscle mass. 15,16 Various studies also indicate a sex-specific pathogenesis for the loss of muscle mass. 17 –19 For example, in men, the decline of fat-free mass is the result of missing anabolic stimuli such as insulin-like growth factor 1 or testosterone, while it is driven by an increase of proinflammatory cytokines such as interleukin-6 (IL-6) in women. 18 IL-6 has been associated with inflammaging and also with lower grip strength. 20,21
However, studies in older adults are rare 4,8,22,23 and there are no studies in sick older adults. Previous studies have investigated GDF15 in healthy older adults, without the burden of age-related and chronic diseases. However, GDF15 values are anticipated to be further increased in the presence of multimorbidity, and simultaneously, muscle strength and function are acutely impacted by disease.
Therefore, we examined the relationship of GDF15 concentrations and measures of upper and lower extremity muscle strength and muscle mass in a cohort of older, hospitalized multimorbid patients. We hypothesized that GDF15 is differently associated with muscle mass and strength in older women and men.
Materials and Methods
Subjects
This is an analysis of a prospective cross-sectional study that was conducted at the Department of Geriatrics at the Charité - Universitätsmedizin Berlin.
24
Hospitalized patients aged 60 years and above were consecutively recruited on admission to hospital. A healthy, age-matched control group was recruited through the Internet and flyers. To avoid confounders on muscle strength, only patients without severe neurodegenerative diseases (e.g., amyotrophic lateral sclerosis or Huntington's disease) were considered. Further exclusion criteria were cognitive impairment (mini-mental state examination score <24) and the inability to understand verbal or written German. Patients with implanted cardiac devices were also excluded as bioelectrical impedance analysis is not recommended in these patients. Furthermore, patients on bed rest were not considered for the study since study participants had to be able to execute the functional assessments. All participants signed a written informed consent. The study was approved by the ethics committee of the Charité - Universitätsmedizin Berlin. This trial was registered at
Blood collection and analysis
Blood was drawn between 7 and 8 am after an overnight fast. Serum was obtained after 30 minutes of incubation and centrifugation at 2250 g for 15 minutes. Serum samples were stored at −80°C until further analysis. GDF15 concentrations were determined by an ELISA according to manufacturer's instructions using commercial kits (R&D, Minneapolis, MN), with an intra- and interassay coefficient of variability (CV) range of 1.8%–2.8% and 4.7%–6.0%, respectively. IL-6 was measured as an inflammation parameter with an electrochemiluminescence assay (U-Plex Biomarker Group 1 Human kit, Meso Scale Discovery, Rockville, MD), with an intra- and interassay CV range of 2.9%–4.5% and 5.9%–12.9%, respectively.
Muscle mass and strength assessment
Body impedance was measured by a 4-electrode, bioelectrical impedance analysis using Nutriguard M (Data Input, Darmstadt, Germany) according to a standardized protocol. On the day before the analysis, patients were asked to refrain from vigorous exercise. Analysis was conducted in edema-free patients in fasting state in the morning. Patients were instructed to remain calm in a supine position for 10 minutes before the analysis was started. The equation by Scafoglieri et al. was used to calculate skeletal muscle mass and the skeletal muscle mass index (SMI, kg/height 2 ). 26 Sarcopenia was defined using current cutoffs for low muscle strength and muscle mass suggested by the European Working Group on Sarcopenia in Older People 2 (EWGSOP2). 27 Maximum grip strength was measured using the JAMAR hand dynamometer (Preston Bissell Health Care Co., Jackson, MI). Maximum knee extension strength was measured with the Commander Muscle Tester dynamometer (JTech Medical, Midvale, UT), which was hand-held by the investigator, who resisted the force generated by the patient. The highest value of three attempts with the dominant hand or leg was recorded. Gait speed was assessed with a four-meter walking test.
Statistical analyses
Statistical analyses were performed with SPSS (IBM version 20, SPSS, Inc., Chicago, IL) and figures were generated using GraphPad Prism (version 8.00 for Windows, GraphPad Software, La Jolla, CA). The Kolmogorov–Smirnov analysis was used to test for normal distribution. Normally distributed variables are expressed as means ± standard deviations and displayed as bar graphs. Non-normally distributed variables are shown as median and interquartile range (IQR) and are visualized as box plots. For calculating differences between groups, Student's t-test was used for normally distributed variables and Mann–Whitney U test for non-normally distributed variables (GDF15 and IL-6). Grip strength and knee extension strength were normalized for height (ht) since strength varies as a function of body size. 28 GDF15 and IL-6 concentrations were logarithmized for normalization in the correlation analysis. Pearson's correlation coefficients with adjustment for age were calculated to identify relationships between variables. The general linear model (GLM) regression analysis was used to evaluate associations between GDF15 and sex, adjusted for age and number of drugs/day as a measure of disease severity. Subsequently, sex-stratified GLM regression analyses were conducted to assess associations between GDF15 concentrations and measurements of muscle strength and mass as dependent variables. Models were adjusted for age, number of drugs/day, and IL-6 as a marker of inflammation as GDF15 is associated with activation of immune and inflammatory responses. 2,3,29 In a second step, associations between elevated GDF15 levels, defined as GDF15 concentrations >1.2 ng/mL as described previously, 30 and measurements of muscle strength and mass were analyzed.
Results
One hundred three hospitalized patients and a control group of 56 healthy older adults were recruited at the Department of Geriatrics of the Charité - Universitätsmedizin Berlin. Orthopedic disorders constitute the most frequent reason for admission, accounting for 49.5% of the study cohort, followed by cardiovascular disease in 16.5% patients. Patients' characteristics are shown in Table 1. As expected, patients had higher GDF15 concentrations than the healthy control group (Fig. 1, 719 vs. 1751 pg/mL). Within the patient group, GDF15 serum concentrations were higher in men than in women (Table 1). Subsequently, a general linear regression model showed that higher GDF15 concentrations were associated with the male sex (β = 491 ± 228, confidence interval [CI]: 38.8; 945, p = 0.034) when adjusted for age and number of drugs per day. As anticipated, men had higher gait speed and were stronger in terms of muscle strength; 65.9% of women and 46.5% of men were considered sarcopenic. Only in men, GDF15 concentrations were higher in patients with sarcopenia (1797 pg/mL IQR: 1280 vs. 2151 pg/mL IQR: 1567 pg/mL; p = 0.008). In women, there was no difference in GDF15 concentrations of patients with and without sarcopenia (1521 pg/mL IQR: 893 vs. 1663 pg/mL IQR: 1181 pg/mL; p = 0.328).

GDF15 (ng/mL) concentrations in the control group (n = 56) and patients (n = 87). Box plots represent medians and 25th and 75th percentiles. Whiskers represent 1.5 × IQR; significant differences between groups were determined with the Mann–Whitney U test; °represents outliers (more than 1.5 times the IQR above the upper quartile); and *represents extreme values (more than 3 times the IQR above the upper quartile). GDF15, growth differentiation factor 15; IQR, interquartile range.
Demographic, Clinical, and Functional Characteristics of the Study Cohort
Values are presented as mean ± SD, and Student's t-test was used to calculate differences between patients, p < 0.05.
Test between female and male patients.
Test between patients and control group.
Values are presented as medians (IQR).
Mann–Whitney U test.
ADL, activities of daily living; BMI, body–mass index; GDF15, growth differentiation factor 15; IL6, interleukin-6; IQR, interquartile range; SD, standard deviation; SMI, skeletal muscle mass index.
We obtained significant, although low to moderate, correlations between GDF15 and IL-6 as well as knee extension strength/ht and SMI only in men (Table 2). In women, GDF15 merely correlated with the number of drugs per day. Interestingly, high IL-6 levels were associated with lower SMI (r = −0.378, p = 0.018) only in women.
Correlations Between logGDF15 Concentrations and Skeletal Muscle Mass Index, logIL6, Hand and Knee Extension Strength/Height, Gait Speed, and Drugs per Day Adjusted for Age
r, regression coefficient.
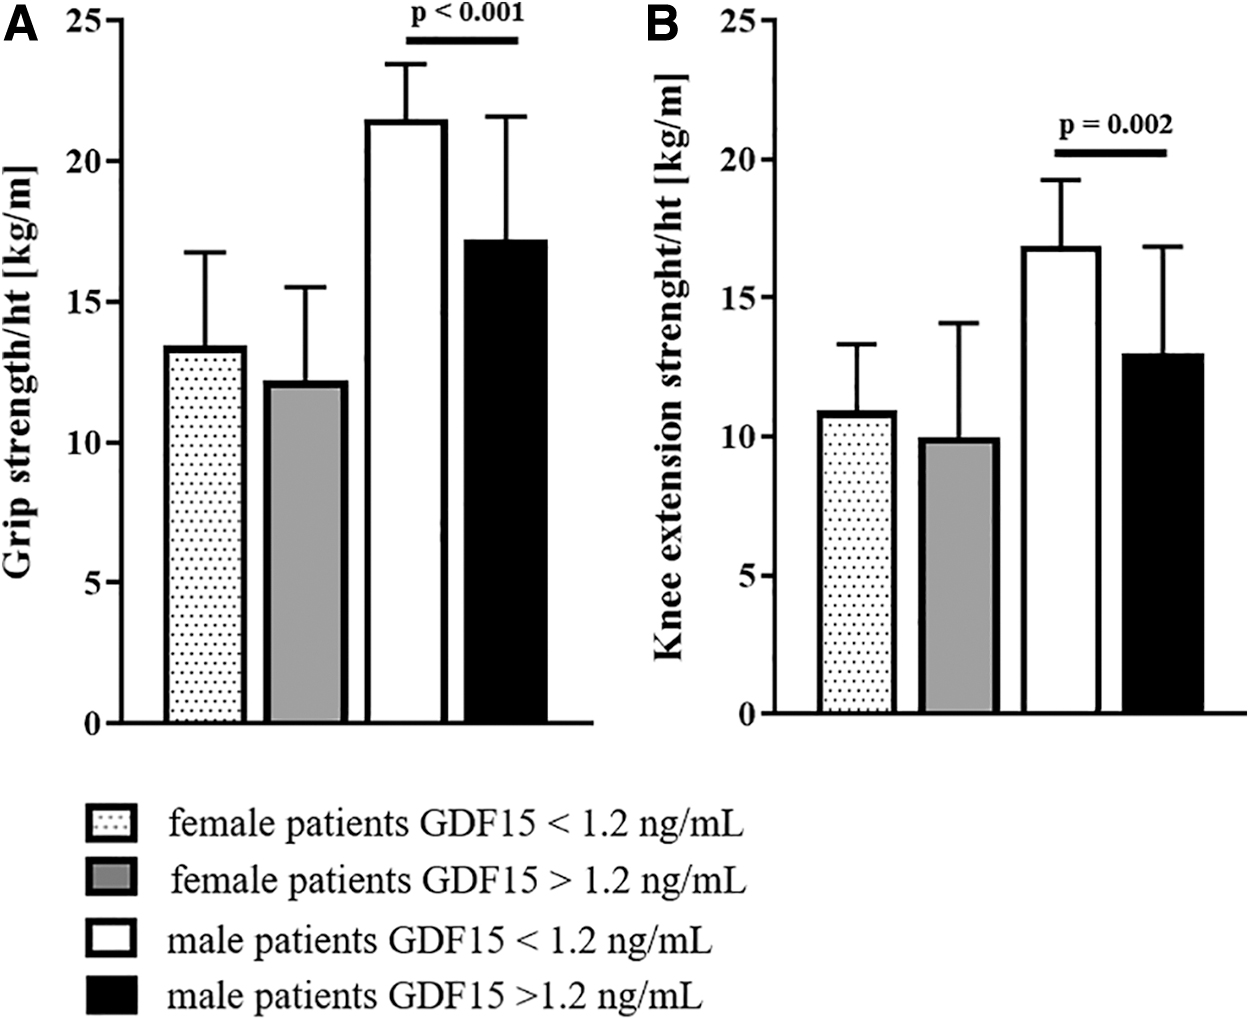
In sex-stratified regression analyses, GDF15 was associated with SMI (β = −0.174 ± 0.78, CI: −0.333; −0.015, p = 0.033) only in men. In contrast, IL-6 was associated with both grip (β = −0.029 ± 0.011, CI: −0.05; −0.01, p = 0.016) and knee extension strength (β = −0.024 ± 0.010, CI: −0.044; −0.004, p = 0.021) in men as well as gait speed (β = −0.139 ± 0.047, CI: −0.234; −0.044, p = 0.005). To test the effects of elevated GDF15 levels on muscle mass and strength, we repeated the regression analysis with elevated (>1.2 ng/mL) GDF15 concentrations versus concentrations below 1.2 ng/mL (Table 3). Elevated GDF15 levels were significantly associated with lower muscle mass and muscle strength, but again not in women. If disease category was introduced in the model, the significant association of grip strength and GDF15 was lost, but remained borderline significant, p = 0.069. The association of knee extension strength and SMI with GDF15 remained significant, even when adjusting for disease category. Men with elevated GDF15 concentrations had significantly lower muscle strength than men with normal concentrations. In women, there was no difference between patients with elevated and normal GDF15 levels (Fig. 2).
Associations Between Elevated GDF15 and Muscle Mass and Strength
General linear model. All models were adjusted for IL6, age, and drugs per day.
Beta, β coefficient; CI, confidence interval.
Discussion
GDF15 is suggested to contribute to the loss of muscle mass and to functional decline, 7,31 but studies in older patients with a potentially higher loss of muscle mass and strength are missing.
In this study, we observed higher GDF15 concentrations in old hospital patients compared with an older, healthy control group, and men exhibited significantly higher concentrations than women. Moreover, associations between GDF15 and muscle mass and strength parameters were found only in men. While the association between GDF15 and muscle mass and strength parameters has been reported previously in healthy older adults, 4,8,22,23 to our knowledge, sex-specific differences have not been shown so far.
Recently, Conte et al. 22 showed an exponential increase of GDF15 with age and its association with worsened grip strength and decreased survival in healthy adults. In a subgroup of adults aged between 61 and 79 years, GDF15 levels were slightly, but significantly, higher in men compared with women (1100 pg/mL vs. 1000 pg/mL, p = 0.001), but the reasons for this difference were not discussed. Another study performed solely in older women reported correlations between GDF15, grip strength, and muscle mass, 23 but these results were not confirmed in a subsequent regression analysis. When adjusted for risk factors, age, but not GDF15, emerged as a predictor of decreased muscle mass and strength. Whether this is due to GDF15 not having the same effect on muscle mass and strength in women remains to be elucidated.
The reasons for potential sex-specific differences regarding the effect of GDF15 on muscle physiology are not yet known. Similarly, higher levels of myostatin, another member of the TGF-β superfamily, were associated with a higher risk for low muscle mass in community-dwelling older men, but not in women. 19 Sex-specific differences in the pathophysiology of muscle mass changes and muscle protein synthesis have also been described before. 19,32,33
The age-related mechanisms leading to increased GDF15 levels also remain largely unknown and data on the molecular mechanisms of how GDF15 affects muscle are still scarce.
Mitochondrial dysfunction, which increases with age and is linked to endoplasmic reticulum stress and reactive oxygen species production in the muscle, 34,35 might contribute to the elevated GDF15 concentrations observed in older adults. Mitochondrial diseases, a congenital and extreme form of mitochondrial dysfunction, for example, are associated with drastically increased GDF15 concentrations. 36
In patients with intensive care unit-acquired weakness, both plasma GDF15 and GDF15 mRNA from rectus femoris muscle biopsies were associated with reduced expression of miRNAs essential for muscle homeostasis. These results imply a role of GDF15 in muscle wasting through increased tissue sensitivity to TGF-β signaling. 7 Since GDF15 has anorexigenic properties and its receptor GFRAL is merely expressed in the brain, it cannot be excluded that GDF15 also has an indirect effect on muscle mass through reduced dietary intake. 37
Our findings are subject to limitations, such as the small sample size and the cross-sectional design, which do not allow conclusions regarding cause and effect. We used bioelectrical impedance analysis (BIA) to assess body composition since it is a recommended and noninvasive bedside method for research use in older adults, 27 but BIA is limited when it comes to estimating muscle mass and its validity to determine muscle mass depends largely on the equation used as well as the hydration status of patients. Moreover, some drugs are known to influence muscle mass and strength either negatively such as statins or positively such as angiotensin converting enzyme inhibitors. However, due to multimedication and overlap of intake of these drugs in our study cohort, we were not able to study the effect of the type of drug in our models. 38 In addition, as muscle biopsies were not possible in our study population, we were not able to investigate molecular mechanisms.
In conclusion, in these multimorbid patients from a geriatric hospital setting, GDF15 concentrations were generally increased and higher in older men than in women. In addition, elevated GDF15 levels were negatively associated with muscle mass and measures of muscle strength only in older male patients.
Footnotes
Authors' Contributions
Concept and design of the study were developed by M.O., U.M.-W., and K.N.; recruitment and measurements of all data were done by K.F., C.H., M.O., and V.C.; the first draft was done by C.H. and K.N.; and critical advice was given by M.O., S.K., L.O., and U.M.-W. All authors commented on previous versions of the manuscript and approved the final manuscript.
Author Disclosure Statement
No competing financial interests exist.
Funding Information
This work was supported by the Focus Area DynAge “Disease in Human Aging” (5.1.: July 2016–June 2017), a collaboration of the Charité—Universitätsmedizin Berlin, the German Institute of Human Nutrition Potsdam—Rehbrücke, the Freie Universität Berlin, and the Robert Koch Institute.