
Abstract
Metabolic proteomics has been widely used to characterize dynamic protein networks in many areas of biomedicine, including in the arena of tissue aging and rejuvenation. Bioorthogonal noncanonical amino acid tagging (BONCAT) is based on mutant methionine-tRNA synthases (MetRS) that incorporates metabolic tags, for example, azidonorleucine [ANL], into newly synthesized proteins. BONCAT revolutionizes metabolic proteomics, because mutant MetRS transgene allows one to identify cell type-specific proteomes in mixed biological environments. This is not possible with other methods, such as stable isotope labeling with amino acids in cell culture, isobaric tags for relative and absolute quantitation and tandem mass tags. At the same time, an inherent weakness of BONCAT is that after click chemistry-based enrichment, all identified proteins are assumed to have been metabolically tagged, but there is no confirmation in mass spectrometry data that only tagged proteins are detected. As we show here, such assumption is incorrect and accurate negative controls uncover a surprisingly high degree of false positives in BONCAT proteomics. We show not only how to reveal the false discovery and thus improve the accuracy of the analyses and conclusions but also approaches for avoiding it through minimizing nonspecific detection of biotin, biotin-independent direct detection of metabolic tags, and improvement of signal to noise ratio through machine learning algorithms.
Introduction
Metabolic proteomics revolutionized biomedicine, by enabling the shift from static analyses of proteomes to monitoring their dynamics. Stable isotope labeling combined with mass spectrometry (MS) analysis is a powerful technology, which allows one to precisely measure changes in protein levels over time and between different treatments. 1 However, they do not reveal the proteins that are produced just by one cell type in an organism, or the proteins that are produced by young animal in heterochronic parabiosis because the entire proteome is metabolically labeled.
Bioorthogonal noncanonical amino acid tagging (BONCAT) enables such cell-fate or age-specific detection of proteomes in mixed biological environments and at a specific experimental time. Moreover, coupling the downstream technologies, BONCAT MS and BONCAT antibody arrays have demonstrated the potential for generating important data on cell-specific and age-specific changes in de-novo synthesized proteomes. 2,3
BONCAT revolutionizes metabolic proteomics, because mutant methionine-tRNA synthases (MetRS) transgene allows one to identify cell-type-specific proteomes in mixed biological environments. 4 This is not possible with other methods, such as stable isotope labeling with amino acids in cell culture, isobaric tags for relative and absolute quantitation, and tandem mass tags. 5,6 In BONCAT-MS, the tagged proteome is purified with clickable dibenzocyclooctyne (DBCO) beads or by biotin-affinity, after azide-alkyne ligation (“click chemistry”) between biotin and the amino acid analog's (azidonorleucine [ANL]/azidohomoalanine [AHA]/homopropargylglycine) azide moiety. 3,7,8
BONCAT-MS has been used to identify the cell-type-specific proteins, exemplified by the proteome of hippocampal excitatory neuron, as well as protein determinants of neural regeneration, spatial memory formation and age-specific proteomes in settings of heterochronic parabiosis. 9 –14 Alternative to MS methods developed by us and recently adapted by others are antibody arrays that use a biotin Click instead of protein biotinylation. 2,15,16
It has been assumed that all proteins after affinity purification are tagged with the noncanonical amino acids. However, there is no confirmation in the BONCAT-MS data that only tagged proteins are detected, and it is not feasible to profile ANL/AHA tagged proteins directly, because the salt-adducts of methionine make its molecular weight very similar to the tag (Supplementary Fig. S1a). 14 In MS, the negative controls of ANL administered to wild-type (WT) mice or cells are lacking and the results do not clearly discern the degree of nonspecific binding of unlabeled proteins to the DBCO, or avidin, etc. affinity columns. 9,17,18
An unknown degree of false positives complicates the analysis, reducing reproducibility and introducing potentiating erroneous conclusions and interpretations. The approaches to enhance the accuracy of BONCAT-MS results start from statistical analysis and algorithmic improvement that assume that the data themselves are on the metabolically tagged proteins, for example, ignoring the possibility that the results are already contaminated by the noise of untagged proteins. 19 –21
In this work, we focused on revealing and minimizing the false discovery of BONCAT-MS and BONCAT-antibody array. Our results uncover and characterize problematic false positives of BONCAT-MS, for example, broad classes of proteins could be misinterpreted as being tagged and show that this false discovery rate is not affected by protein molecular weight or methionine content, but that protein abundance might increase it. Our data show that there are also false positives in BONCAT-antibody arrays, which are due to physiologically biotinylated proteins and can be reduced with biochemical approaches.
Moreover, we describe the antibody array application of biotin-independent direct detection of ANL/AHA-tagged proteome (termed Cy3-direct BONCAT), which eliminates the false positives and greatly increases the resolution, and dynamic range of the metabolic proteomics. Finally, we developed a novel computational image segmentation platform, which reduces the artifacts and increases the sensitivity of comparative proteomics. Together these technologies enable accurate studies with capacity to distinguish even subtle proteome changes, as needed for early diagnosis of pathology, the detection of age-imposed, genetically, or environmentally induced alterations, and for monitoring responses to treatments in clinic or to various experimental conditions in the laboratory.
Materials and Methods
Mouse genotyping
All procedures were performed in accordance with the administrative panel of the Office of Laboratory Animal Care. The protocol was approved by the UC Berkeley Animal Care and Use Committee. Genotyping was performed as previously described. 2 Genomic DNA from ear clips was extracted by using the digestion buffer (100 mM Tris-HCl (pH 8.5), 5 mM ethylenediaminetetraacetic acid (EDTA), 0.2% sodium dodecyl sulphate (SDS), 200 mM NaCl, 100 μg/mL proteinase K) for 1 hour at 95°C. Then DNA samples were precipitated with isopropanol and then dissolved in Tris-EDTA buffer.
PCR conditions consisted of denaturing at 95°C for 5 minutes; 30 cycles at 95°C for 30 seconds, 60°C for 30 seconds, and 72°C for 30 seconds; with a final extension of 72°C for 5 minutes. PCR products and DNA Ladder (N0467S; New England BioLabs, Ipswich, MA) were separated on an 1.5% agarose gel stained with ethidium bromide for 50 minutes at 100 V. Gel images were acquired using a ChemiDoc™ XRS imaging system (Bio-Rad Laboratories, Hercules, CA). Primer synthesis was by Elim Biopharmaceuticals Inc. (Hayward, CA).
Click-Western blot
To identify the ANL-labeled proteins, Click-western blotting was performed. ANL was purchased from Jena Biosciences (Cat. No. CLK-AA009). ANL was intraperitoneal (IP) injected into mice at the indicated dose. Blood samples were collected by heart puncture. The blood was allowed to clot for 30 minutes at room temperature before centrifugation at 5000 g for 5 minutes, then blood serum was aliquoted and stored at −80°C. For in vitro experiment, Primary mouse tail fibroblasts were derived from MetRSL274G mice or C57/B6 mice. In brief, tail snips were incubated for 0.5 minutes in 70% ethanol, then minced and digested with collagenase for 2 hours at 37°C. The tissue was filtered through a 100 μm cell strainer (BD Falcon™ 352360) and washed with Dulbecco's modified Eagle's medium (DMEM) (D5796; Sigma-Aldrich).
The cell pellets were resuspended, cultured, and expanded in DMEM containing 10% Bovine Growth Serum (BGS), 1% penicillin-streptomycin (PS) at 37°C with 5% carbon dioxide (CO2), and cells were passaged with 0.05% trypsin when culture reaches around 70%–80% confluency (days 6–7 of culture). The second passage of fibroblasts was used in this experiment. The cells were treated with 2 mM ANL (6-zaido-L-lycine HCL; Cat. No. CLK-AA009-500; Jena Bioscience GmbH) for 2 days, and the medium was refreshed daily.
Serum and fibroblasts were clicked with biotin labeled alkyne according to manufacturer's protocol (Click-iT® Protein Reaction Buffer Kit, Molecular Probes C10276, Thermo Fisher Scientific). The Click-iT reaction was carried out for 20 minutes at room temperature and then the proteins were precipitated from the reaction mixture by methanol/chloroform following the manufacturer's instruction.
After air dry, the resulting pellet was solubilized in Laemmli buffer and boiled at 100°C for 10 minutes, then separated through SDS-polyacrylamide gel electrophoresis (PAGE) on 4%–20% Mini-PROTEAN TGX Precast Gels (Cat. No. 456-1095; Bio-Rad). Transferred polyvinylidene difluoride membranes were blocked with AdvanBlock™-PF Protein-Free Blocking solution (R-03023-D20; Advansta, San Jose, CA) and Peroxidase Labeled Streptavidin (474-3000; KPL, Gaithersburg, MD) were applied, bands were visualized using the WesternBright™ ECL (Cat. No. K-12045-D50; Advansta) following manufacturer's protocols.
BONCAT-mass spectrometry
For in vivo experiment, ANL was I.P. injected into MetRS mice (6 months old) or C57/B6 mice (6 months old) for 7 days at 0.2 mmol/kg. Protein extraction was carried out by homogenizing liver samples in cell lysis buffer (Cat. No. 90408; Thermo Scientific) with Protease Inhibitor (Halt™ Protease and Phosphatase Inhibitor Cocktail), then different methods (Methods 1–4, Supplementary Data) were used for protein purification, reduction, alkylation, and digestion.
For in vitro experiments, primary mouse tail fibroblasts were derived from MetRSL274G mice or C57/B6 mice. In brief, tail snips were incubated for 0.5 minutes in 70% ethanol, then minced and digested with collagenase for 2 hours at 37°C. The tissue was filtered through a 100 μm cell strainer (BD Falcon 352360) and washed with DMEM (D5796; Sigma-Aldrich). The cell pellets were resuspended, cultured, and expanded in DMEM containing 10% BGS, 1% PS at 37°C with 5% CO2, and cells passaged at 70%–80% confluency with 0.05% trypsin. The cells were treated with 2 mM ANL (6-zaido-L-lycine HCL; Cat. No. CLK-AA009-500; Jena Bioscience GmbH) for 3 days, and the medium was refreshed daily.
Protein extraction was carried out by homogenizing cells in cell lysis buffer (Cat. No. 1863073; Thermo Scientific) with Protease Inhibitor (Halt Protease and Phosphatase Inhibitor Cocktail), then 10 mM dithiothreitol (DTT; SC-29089; Santa Cruz Biotechnology) was added to 1 mL homogenates and kept at room temperature for 20 minutes, following with 100 mM chloroacetamide (Cat. No. C0267; Sigma-Aldrich) at room temperature for 30 minutes in the dark. Twenty-four micromolar sulfo-DBCO-biotin (Cat. No. 760706; Sigma-Aldrich) was added to the lysates with 15 minutes shaking at room temperature. Then 100 mM ANL was added to quench the reaction for 30 minutes at room temperature.
The biotinylated protein samples were incubated with Streptavidin Magnetic Beads (Cat. No. S1420S; New England BioLabs) at room temperature for 1 hour with mixing. Beads were collected with a magnetic stand, then beads were washed five times with IP-MS wash buffer (Cat. Nos. 1863056 and 1863058; Thermo Scientific), after elution, the samples were dried in a speed vacuum concentrator. Then 100 μL 6 M freshly made urea solution was added to the sample and vortex to denature protein, followed by adding 2 μL 500 mM DTT for 30 minutes at 60°C. Solution was cooled before adding 6 μL 500 mM iodoacetamide (IAA) for 45 minutes in the dark at room temperature. For digestion, 100 ng trypsin/LysC (V5073; Promega) was added and incubated at 37°C overnight.
Mass spectral data were acquired by the QB3/Chemistry Mass Spectrometry Facility at the University of California, Berkeley.
Data analysis of BONCAT-MS
Five different previously published methods of BONCAT MS were tested: Methods 1–4 compared proteins found in vivo in ANL-treated B6 mice with those found in ANL-treated MetRS mice and Method 5 compared proteins found in vitro in ANL-treated B6 fibroblasts with those found in ANL-treated MetRS fibroblasts. The ANL-treated C57/B6 mice and fibroblasts are referred to as the negative control and the ANL-treated MetRS mice and fibroblasts are referred to as the experimental group. Every protein was analyzed in six replicates. The Normal Spectral Count (NSC) values of each replicate were given. The p-value of the statistical difference between the NSC values of the experimental group and the negative control group were calculated using a two-tailed heteroscedastic t-test.
For each protein analyzed, the mean was taken of the NSC values of the experimental group to yield an Average Spectral Count Value (ASCV) of the experimental group. The same was done with the negative control's NSC values. Proteins with a negative control ASCV equal to 0, an experimental group ASCV >0, and p < 0.05 (and separately, p < 0.01) were assigned to the experimental group in Venn diagrams. Proteins with a negative control ASCV >0, an experimental group ASCV equal to 0, and p < 0.05 (and separately, p < 0.01) were assigned to the false positive group in Venn diagrams. Proteins that were found in both the negative control and the experimental groups with above determinations of p < 0.05 (and separately, p < 0.01) were shown in the Venn diagrams’ overlap.
The overlapping proteins (between the negative control and the experimental BONCAT MS) were subsequently analyzed, as described below. It is important to note that the magnitude of false-positive discovery in BONCAT MS supersedes just these overlapping protein pools, for example, there were hundreds to thousands false positive putatively ANL-tagged proteins in the negative control C57/B6 tissues and cells.
In the false-positive group with Venn diagrams overlays between the MetRSL274G and C57.B6, we found 162 peptides that correspond to 118 genes; these contributed to the false discovery in all methods of BONCAT tag-enrichment before MS. Gene Ontology (GO) open-source Enrichment Tool was used to determine the Biological Processes ascribed to these 118 genes, with the 10 largest Fold Enrichment values being generated using the Python data science library. The Molecular Function and the Cellular Component were also found for these common false positives.
To examine whether there is a preference in false-positive discovery for larger proteins and/or those with more methionine residues, 162 peptides were profiled through the UniProt database and by FASTA for their molecular weights and methionine content (as a percent of the amino acid chain). The FASTA sequences of these proteins were inputted into BlastKOALA for Kyoto Encyclopedia of Genes and Genomes (KEGG) analysis. The molecular weight and methionine content were also compared between the 162 common false-positive proteins and all BONCAT MS-yielded proteins by UniProtKB, using an iterative algorithm. The molecular weight and methionine content data for all proteins were aggregated and compared to the molecular weight and methionine content data of the common false-positive 162 proteins, using histograms (Molecular weight—Fig. 1d, Methionine content—Fig. 1e).
False-positive discovery of BONCAT MS.
Finally, we analyzed the degree of false-positive discovery that comes from tissue abundant proteins. The liver protein database from PAXdb lists the 460 proteins most abundant in the liver. For Methods 1–5, we determined how many of the false-positive proteins of each method were present in the top 460 most abundant liver proteins; and this process was repeated with the 162 commonly found false-positive proteins (Fig. 1f).
BONCAT antibody array
Antibody arrays (Mouse L308 Array; RayBiotech AAM-BLG-1-2) were used to profile the proteins circulating from mouse samples. The samples were run on three different arrays. The experiment was performed by following by manufacturer's protocol with modifications below. The mean values for each of the 308 proteins were compared between the mutant and the WT results for all proteins; and those found to be elevated by twofold in the mutant with p < 0.05 were considered to be significant.
Heart tissue was clashed using grinder using liquid Nitrogen for 3 minutes. Then tissue was homogenized from heart tissues with Lysis buffer (50 mM Tris-HCl, pH 8.0, 150 mM NaCl, 1% Triton X-100, 0.5% Sodium Deoxycholate, with protease inhibitor) using grinder. The protein extracted was homogenized using homogenizer for 2 minutes. Proteins (100 μg) were clicked with biotin labeled alkyne as indicated above with fresh Click reagents.
After the methanol precipitation, precipitated protein was dissolved in Lysis buffer with 0.2% TritonX-100 and 3M Urea (Protein solution 1). After centrifuge, the protein Ppt was again dissolved with Formic acid and this solution was mixed with protein solution 1. The total protein solution was dissolved again with sonication completely. The bicinchoninic acid assay analysis was used to quantify the clicked product. These protein solutions were dialyzed with 1 × phosphate buffered saline with 0.2% Triton X-100 and 0.1% Glycerol for overnight. After dialysis, the protein solution was again solubilized using sonication and also pH was adjusted to pH 8.5 with 2M Tris to dissolve the precipitation.
The protein solution was analyzed using Click western blot and after confirmation of the Click reaction, the arrays were blocked with blocking solution overnight. Array was incubated with clicked protein (33 μg), washed and detected with Cy3 labeled streptavidin (SA), as recommended by the manufacturer. Arrays were scanned using genePix 4000B scanner (Molecular Devices, Sunnyvale, CA) at 532 nm.
Feature extraction was done using genePixpro6.1 software (Molecular Devices). The normalization method Opening of GenePix software was used to subtract the fluorescence background, after which, for each protein, duplicate spots on each array were averaged, local background fluorescence was subtracted, and resulting fluorescence signal was normalized by the internal positive controls on the arrays. Average signals from all 4 arrays (4 experiments for positive and negative samples) were set to 1.
Molecular weight and methionine content analysis
Text files containing the primary data were processed using Microsoft Excel. Each of the 644 spots on the array slide represents an antibody ligand site, and each antibody has a duplicate, summing up to a total of 308 antibody sites that bind uniquely to a protein. First, each protein value was divided by the geometric mean of the Total Intensity of Array-built negative controls. Then, these values were averaged by their array duplicates and further normalized, as geometric mean of Array-built Positive 2 values. These normalized by assay internal negative and positive controls data were then used for comparing the protein expression levels between the cohorts.
We selected the proteins with a normalized fold change >2 and a p-value of <0.01 from the two-tailed Student's t-test, and looked up their molecular weights and amino acid sequences on UniProt database. With this information, we used GraphPad Prism (version 8.4.3, San Diego), normalized the molecular weight, and calculated methionine content level separately by setting the maximum value as 100% and the minimum value as 0%, and presented in frequency histograms and pie diagrams.
Streptavidin magnetic beads treatment
Streptavidin magnetic beads (S1420S; New England Biolabs) were washed by lysis buffer for three times and then after the removal of buffer, protein lysis solution was mixed together and rotated for 1 hour at room temperature. After purification of biotin labeled proteins, using magnetic stands, the SA beads were removed. For isolation of biotin-labeled proteins, beads were boiled with 2 × SDS-sample buffer for 5 min for 95°C.
In-gel detection of newly synthesized cell proteome
To verify the feasibility of Cy3-direct method, we detected ANL-labeled proteins by conjugation to Cy3-Alkyne and subsequent SDS/PAGE–in-gel fluorescence scanning. MetRSL274G or C57BL/6 mouse myoblast were treated with 2 mM ANL for 4 days. Cells were washed with PBS for three times and lysed with radioimmunoprecipitation assay (RIPA) buffer and protease inhibitor cocktail (Thermo Fisher Scientific). Lysates collected were analyzed for protein concentration by BCA assay. Then, a click chemistry reaction was performed using the Click-iT Protein Reaction Buffer Kit (C10276; Thermo Fisher Scientific) to bind the protein with Cy3-alkyne following manufacturer's instructions. After separation by SDS-PAGE, gel images were acquired using Typhoon FLA 9500 (GE Healthcare).
Cy3-direct antibody array
Myoblasts were treated/untreated with 2 mM ANL for 4 days. The cells were lysed with RIPA buffer. Then, cell lysate was reacted with biotin-alkyne using the Click-iT Protein Reaction Buffer Kit (Cat. No. C10276; Thermo Fisher Scientific) following the manufacturer's protocol, and dialysis against PBS buffer were performed twice afterward. The array slides were blocked in blocking buffer at room temperature for 1 hour. After aspirating the blocking buffer, the sample is placed on each subarray and incubated at 4°C for 16 hours with gentle shaking. The array slides were then washed with washing buffer.
After washing, the slides were dried in the hood for 1 hour and then the signals were detected using genePix 4000B scanner (Molecular Devices) at 532 nm. To show the positive spots in the array slides after washing, 1× Cy3-conjugated SA supplied in the Antibody Array kit was added to each subarray and incubated at room temperature for 2 hours with gentle shaking. After washing, the slides were dried in the hood for 1 hour and then the signals were detected using genePix 4000B scanner (Molecular Devices) at 532 nm.
K-means multilevel thresholding/Otsu thresholding
Otsu's method for image thresholding has the objective of minimizing intraclass variance. This can be expressed mathematically as minimizing the variance contained within the filters (cluster centers).
ω0 and ω1 are the probabilities of 2 classes separated by threshold t. σ0 and σ1 are the variances of these 2 classes.

Objective of k-means (minimize J):

Supplementary Figure S8c shows the raw images parsed with just the green channel, and Supplementary Figure S8d shows the sample output of the k-means intensity threshold segmentation. 22
Machine learning applied to image segmentation filters (trainable segmentation)
First, we will discuss the procedure used to process the raw antibody array image.
Top and left padding is automatically computed based on the distance from the top and bottom to the first significant well (which is defined after k-means quantization).
Around 644 40 × 40 patches are obtained by applying a 40 × 40 identity kernel with a stride of 40.
For each 40 × 40 patch, apply standard image segmentation filters, such as scale-invariant feature transform, to compute feature the image.
Split the entire dataset into 80/20 for training/test (with random shuffling).
If doing trainable segmentation: Flatten each 40 × 40 patch into a 1600-size 1-dimension vector, and apply a classification algorithm (e.g., random forest) to classify whether each pixel is considered signal or background.
Using Python-skimage, pixelwise features are computed, such as Gaussian blurring, Sobel filters, Hessian, and Difference of Gaussians.
These pixelwise features are then used to train a vanilla classifier, such as random forest (50 trees, depth of 2). In this random forest classifier, we seek to minimize the gini impurity between our labels (from the ground truth mask) and projected inference in each tree of the forest. The sample output of the trainable segmentation pipeline is shown in Supplementary Figure S8e.
Deep convolutional network (U-Net architecture inspired)
Please refer to Supplementary Figure S8b and e. A deep convolutional network with residual connections was used to generate a pixel-by-pixel mask.
Results
Well-controlled BONCAT MS uncovers a large number of false positives
The most popular methods for profiling ANL, AHA, and so on, methionine analog-tagged proteins are based on biotin-SA (or similar high affinity) interactions following click chemistry tagging of biotin to ANL, AHA, and other noncanonical amino acids in polypeptides. 11,23 After this purification, the protein pool is digested and subjected to MS, assuming that all the recovered peptides are metabolically labeled, as there is no independent confirmation in the MS step that the profiling is performed only on the ANL- or AHA-tagged proteome.
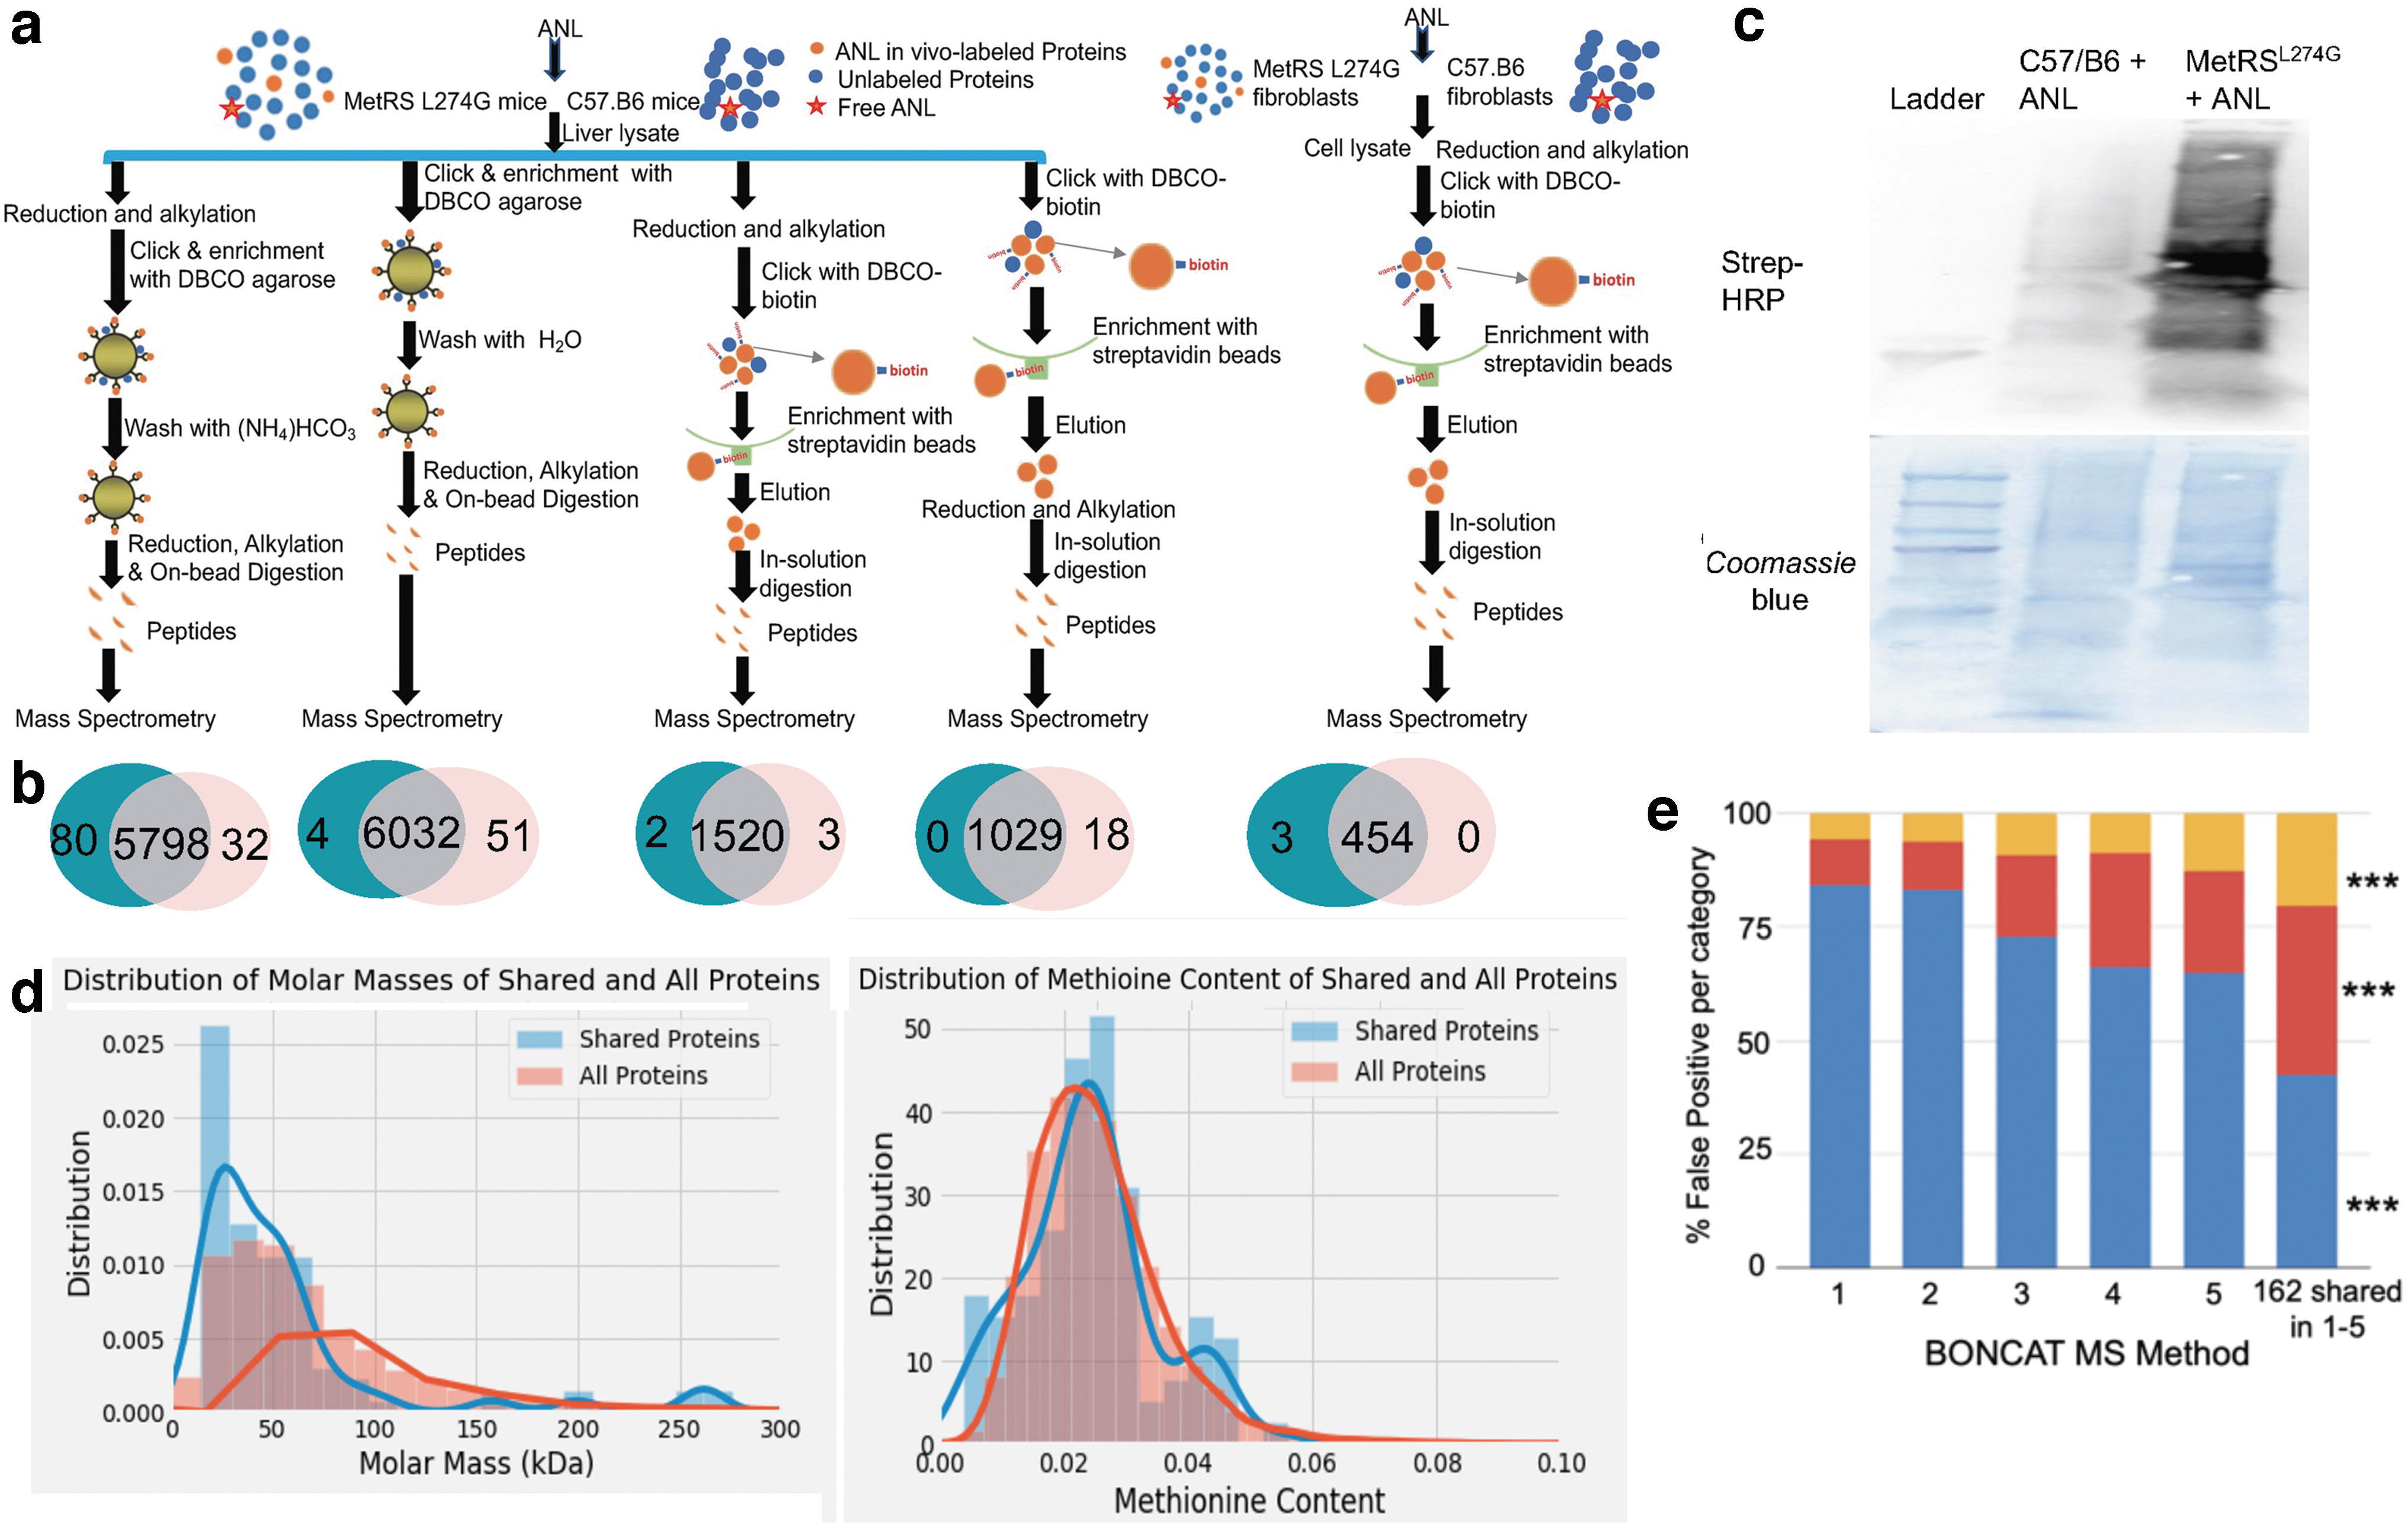
To test if there could be unlabeled proteome detected by this method, we used the appropriate negative control: ANL that was administered to C57.B6 mice or their derived cells, where there is no MetRSL274G and no capacity to incorporate ANL, and all tested current methods of affinity purification (DBCO-based and biotin-based) yielded high levels of false positives by MS (Fig. 1a, b). Click western blotting comparing homozygous transgenic MetRSL274G and C57.B6 cells (Fig. 1c) and mice (Supplementary Fig. S1b–d) that were treated with ANL confirmed a good signal to noise ratio (MetRSL274G to C57.B6).
Thus, the problem of false-positive discovery does not stem from the efficiency of ANL-tagging, but from the enrichment and downstream MS steps, for example, affinity enrichment and an erroneous assumption that all column-eluted proteins are metabolically tagged. In this regard, a nonspecific background in Click westerns is typically detected (Fig. 1c; Supplementary Fig. S1) in agreement with the recorded false positives from biotin-clicked enriched MS analysis. 2,12
We next performed bioinformatics and computational analysis of the false-positive proteins using five reported BONCAT MS methods. We identified several hundreds to several thousands of false-positive proteins that were present in all five methods. While the false-positive proteins varied, we found 162 specific proteins that were determined to be false positive in all the tagged proteome purification methods. GO and KEGG analysis demonstrated that the false-positive proteins for each method tended to be involved in genetic information processing, cellular processes, environmental information processes, and carbohydrate metabolism (Supplementary Fig. S2), in other words, a variety of functions.
To examine whether there is a preference in false-positive discovery for larger or smaller proteins or those with more or less methionine residues, the molecular weights and methionine content (Fig. 1d) of the false positives were analyzed. It was found that the average molecular weights of the 162 shared false-positive proteins were lower than the molecular weights of all false-positive proteins, with a significance of p < 0.01. There was no statistically significant difference between the methionine content of the 162 shared and all false-positive proteins.
Finally, we looked for a correlation between false-positive discovery and protein abundance in a given tissue. Namely, for Methods 1–5, we determined how many of the false positives (total and the shared 162) were in the top 460 most abundant overall and most abundant liver proteins (PAXdb) (Fig. 1e). Of the 162 shared false-positive proteins, 20.34% were in the top 460 most abundant overall mouse proteins compared to 5.65%, 6.22%, 9.10%, 8.77%, and 12.68% for Methods 1, 2, 3, 4, and 5, respectively, with a statistical significance of p < 0.01. Of the 162 shared false-positive proteins, 37.29% were in the top 460 most abundant mouse liver proteins compared to 10.14%, 10.52%, 18.09%, 25.23%, and 22.46% for Methods 1, 2, 3, 4, and 5, respectively, with a statistical significance of p < 0.01.
The 162 proteins that are false positives for all 5 methods are significantly more abundant than the overall false positives, both in terms of the whole mouse proteome and the mouse liver proteome. In general, therefore, and perhaps not surprisingly, the more abundant proteins are more likely to be seen as false positive.
Summarily, biotin purification-based MS yields a large fraction of false-positive proteins of variable molecular weight and methionine content, and which have a variety of protein functions in different cell processes.
False positives of BONCAT antibody arrays
The detection of specific proteins-of-interest is more straightforward and needs much less starting sample with antibody arrays than MS. We were the first to adopt antibody arrays for metabolic proteomics in the ANL-MetRSL274G system, and reported statistically significant differences between ANL-tagging the C57.B6 strain (the negative control that reveals the false positives), and ANL-tagging the MetRSL274G transgenic strain (the experimental data). 2 Here, we rigorously investigated the false discovery of metabolic antibody arrays in both AHA and ANL labeling set-ups.
Several negative controls were applied to the BONCAT arrays: Hank's balanced salt solution (HBSS), FPLC-purified mouse serum albumin, lysates of C57.B6 primary myoblasts treated with ANL, different protein concentrations, and Click and no-Click detection. Interestingly, each of these controls demonstrated false-positive detection, even though C57.B6 does not express MetRSL274G and is not capable to incorporate ANL during translation; some of the controls had no tag at all (Fig. 2).

False-positive discovery of the BONCAT antibody arrays.
The false positives were defined as twofold SA Cy-3 signal intensity over the array-built negative control, the same cutoff for the data in the antibody array experiments. 24 –26 Eighteen false positives out of 308 array proteins were found in 7 independent control experiments (no-tag and C57.B6+ANL). The number of false positives varied between individual control experiments (Fig. 2; Supplementary Fig. S3).
There were false positives that appeared in all negative controls, including HBSS (FS-7-associated surface protein; Matrix metalloproteinase-24 protein; Fig. 2) apparently array-specific artifacts. Not only the prevalence but also the identity of the false positives was variable between the experiments, and as expected, more was seen with increased photomultiplier tube (PMT) settings of the laser slide scanner and or increasing the brightness of acquired images (Fig. 2; Supplementary Fig. S3). Proteins with a molecular weight between 10 and 50 kDa contributed to 66.67% of the false positive, 60–100 kDa to 27.78%, and 110 kDa and above to only 5.55% (Fig. 2b). The methionine content frequency distribution was found to be roughly symmetric, with peak centered at 1.5% (Fig. 2b).
These results demonstrate a ∼5% false-positive discovery rate of antibody arrays, which is similar to typical optical protein profiling methods, fluorescence-activated cell sorting and immunofluorescence microscopy, for example.
Mechanism of the false positives of BONCAT antibody arrays
The false positivity of the antibody arrays is surprising, because the samples are applied to the arrays directly (no biotin enrichment columns), and only AHA or ANL residues are capable of linking biotin through Click chemistry (total protein biotinylation is omitted in the BONCAT array), and only Clicked biotin can be detected by SA-Cy3. So how was the false-positive signal generated?
We postulated that antibody arrays detect physiologic naturally biotinylated proteins, which reacts with the SA-Cy3 and are misinterpreted as experimentally biotinylated or AHA/ANL tagged. 27 The variable presence of these proteins in different samples might account for the variability of the false-positive detection (Fig. 3a). Removal of the naturally biotinylated proteins with SA-beads before the Click of biotin to AHA or ANL residues should reduce this false-positive background (Fig. 3a).

False positives of the biotin-based BONCAT are largely due to the presence of naturally biotinylated proteins.
To characterize the naturally biotinylated proteome, we used Streptavidin magnetic beads to enrich for these proteins in tissue lysates that were derived from C57.B6 brain, heart, liver, and blood serum. Moreover, young and old animals were compared in their naturally biotinylated proteomes, considering our long-standing scientific interest in comparative age-specific protein analyses. 28 –30
Western blotting on the purified naturally biotinylated proteins were performed, using horseradish peroxidase-SA detection, without biotinylation or Click chemistry (Fig. 3b). The physiologic biotinylated proteome was detected in all tissues studied; the levels of naturally biotinylated proteins were variable from sample-to-sample but were elevated in the brains of old mice, compared to young (Fig. 3b).
Click westerns on ANL tagged proteins have notorious nonspecific band(s), the identity of which was not previously explained. 2,9 In agreement with our hypothesis, such nonspecific bands were diminished after removal of naturally biotinylated proteins with streptavidin magnetic beads, and even more so by also adding IAA, which blocks nonspecific Click reactions at cysteine thiols (Fig. 3c). 31,32
Moreover, removal of the naturally biotinylated proteins with SA beads significantly reduced the false positives in the in vivo tagged proteome of MetRSL274G and C57.B6 mice. Multiple independent experiments with AHA/ANL tagging of MetRSL274G and C57.B6 mice and profiling the de novo synthesized heart tissue proteome demonstrated that removal of naturally biotinylated proteins before Click greatly reduces false positives and background noise in the no-tag and C57.B6+ANL negative controls (Fig. 3d, e). As expected, out of the 308 profiled proteins, only some were expressed and tagged during the AHA/ANL treatment.
In this regard, we focused BONCAT arrays and the characterization of false positives on the heart, because of the highly efficient metabolic labeling of this tissue, compared with blood, brain, skeletal muscle, and liver (Supplementary Fig. S3 and previous publication). 2
As expected, removal of naturally biotinylated proteins resulted in a clearer pattern of proteins that are resolved by the BONCAT arrays and reduced experimental noise (Fig. 3a, d, e). These results also confirmed that AHA incorporation into the newly synthesized proteins by the WT MetRS in C57.B6 mice is more robust than ANL tagging by the MetRSL274G (Fig. 3d, e).
Interestingly, while in the more robust AHA method, the removal of naturally biotinylated proteome reduced the number of hits, in the weaker orthogonal MetRSL274G+ANL tagging system, the number of de novo synthesized proteins that are detected became increased when the background was reduced, due to a better signal to noise resolution (Fig. 3e).
in addition, the resolution of the antibody arrays was improved and artificial variability between the samples was reduced, through improving the methods of sample preparation, such as enhancing the solubility of proteins with formic acid, urea, pH adjustment, and sonication (Supplementary Fig. S4). It was found to be prudent to test the starting sample by Click westerns for protein quantity, quality, and tagging efficiency before applying to the arrays (Supplementary Fig. S4).
These data provide an explanation for false-positive discovery in the antibody arrays, suggest that varying sample levels, tissue levels, and age-specific abundance of a naturally biotinylated proteome might introduce variation in the data, and provide chemical and biochemical steps for improving the quality of the starting samples. Finally, these results compare the side-by-side BONCAT efficiency between the AHA-C57.B6 and ANL-MetRSL274G.
Cy3-direct BONCAT arrays eliminate false positives and improve resolution of comparative proteomics
In published approaches, biotin-tagged proteins are purified on their SA-affinity, or bind to cognate antibodies on the arrays, which is followed by their detection with MS and/or SA-conjugated fluorescent dye on the Arrays. 2,4,9,16,33,34 As established above, these methods have inherent false positives stemming from natural biotinylation, which is not completely solved by removing the physiologically biotinylated proteins, because this also discards the proteins, which are both experimentally tagged and naturally biotinylated.
To eliminate the biotin-reliance of comparative proteomics, we replaced the biotin-alkyne click chemistry (Biotin-SA) with directly clicked to ANL/AHA Cy3-alkyne (termed, Cy3-Direct). The effects of this approach on the minimization of false positives and on the resolution of metabolic proteomics were examined with Click westerns and BONCAT arrays (Fig. 4).
Cy3-direct eliminates false positives and enhances the resolution of comparative proteomics
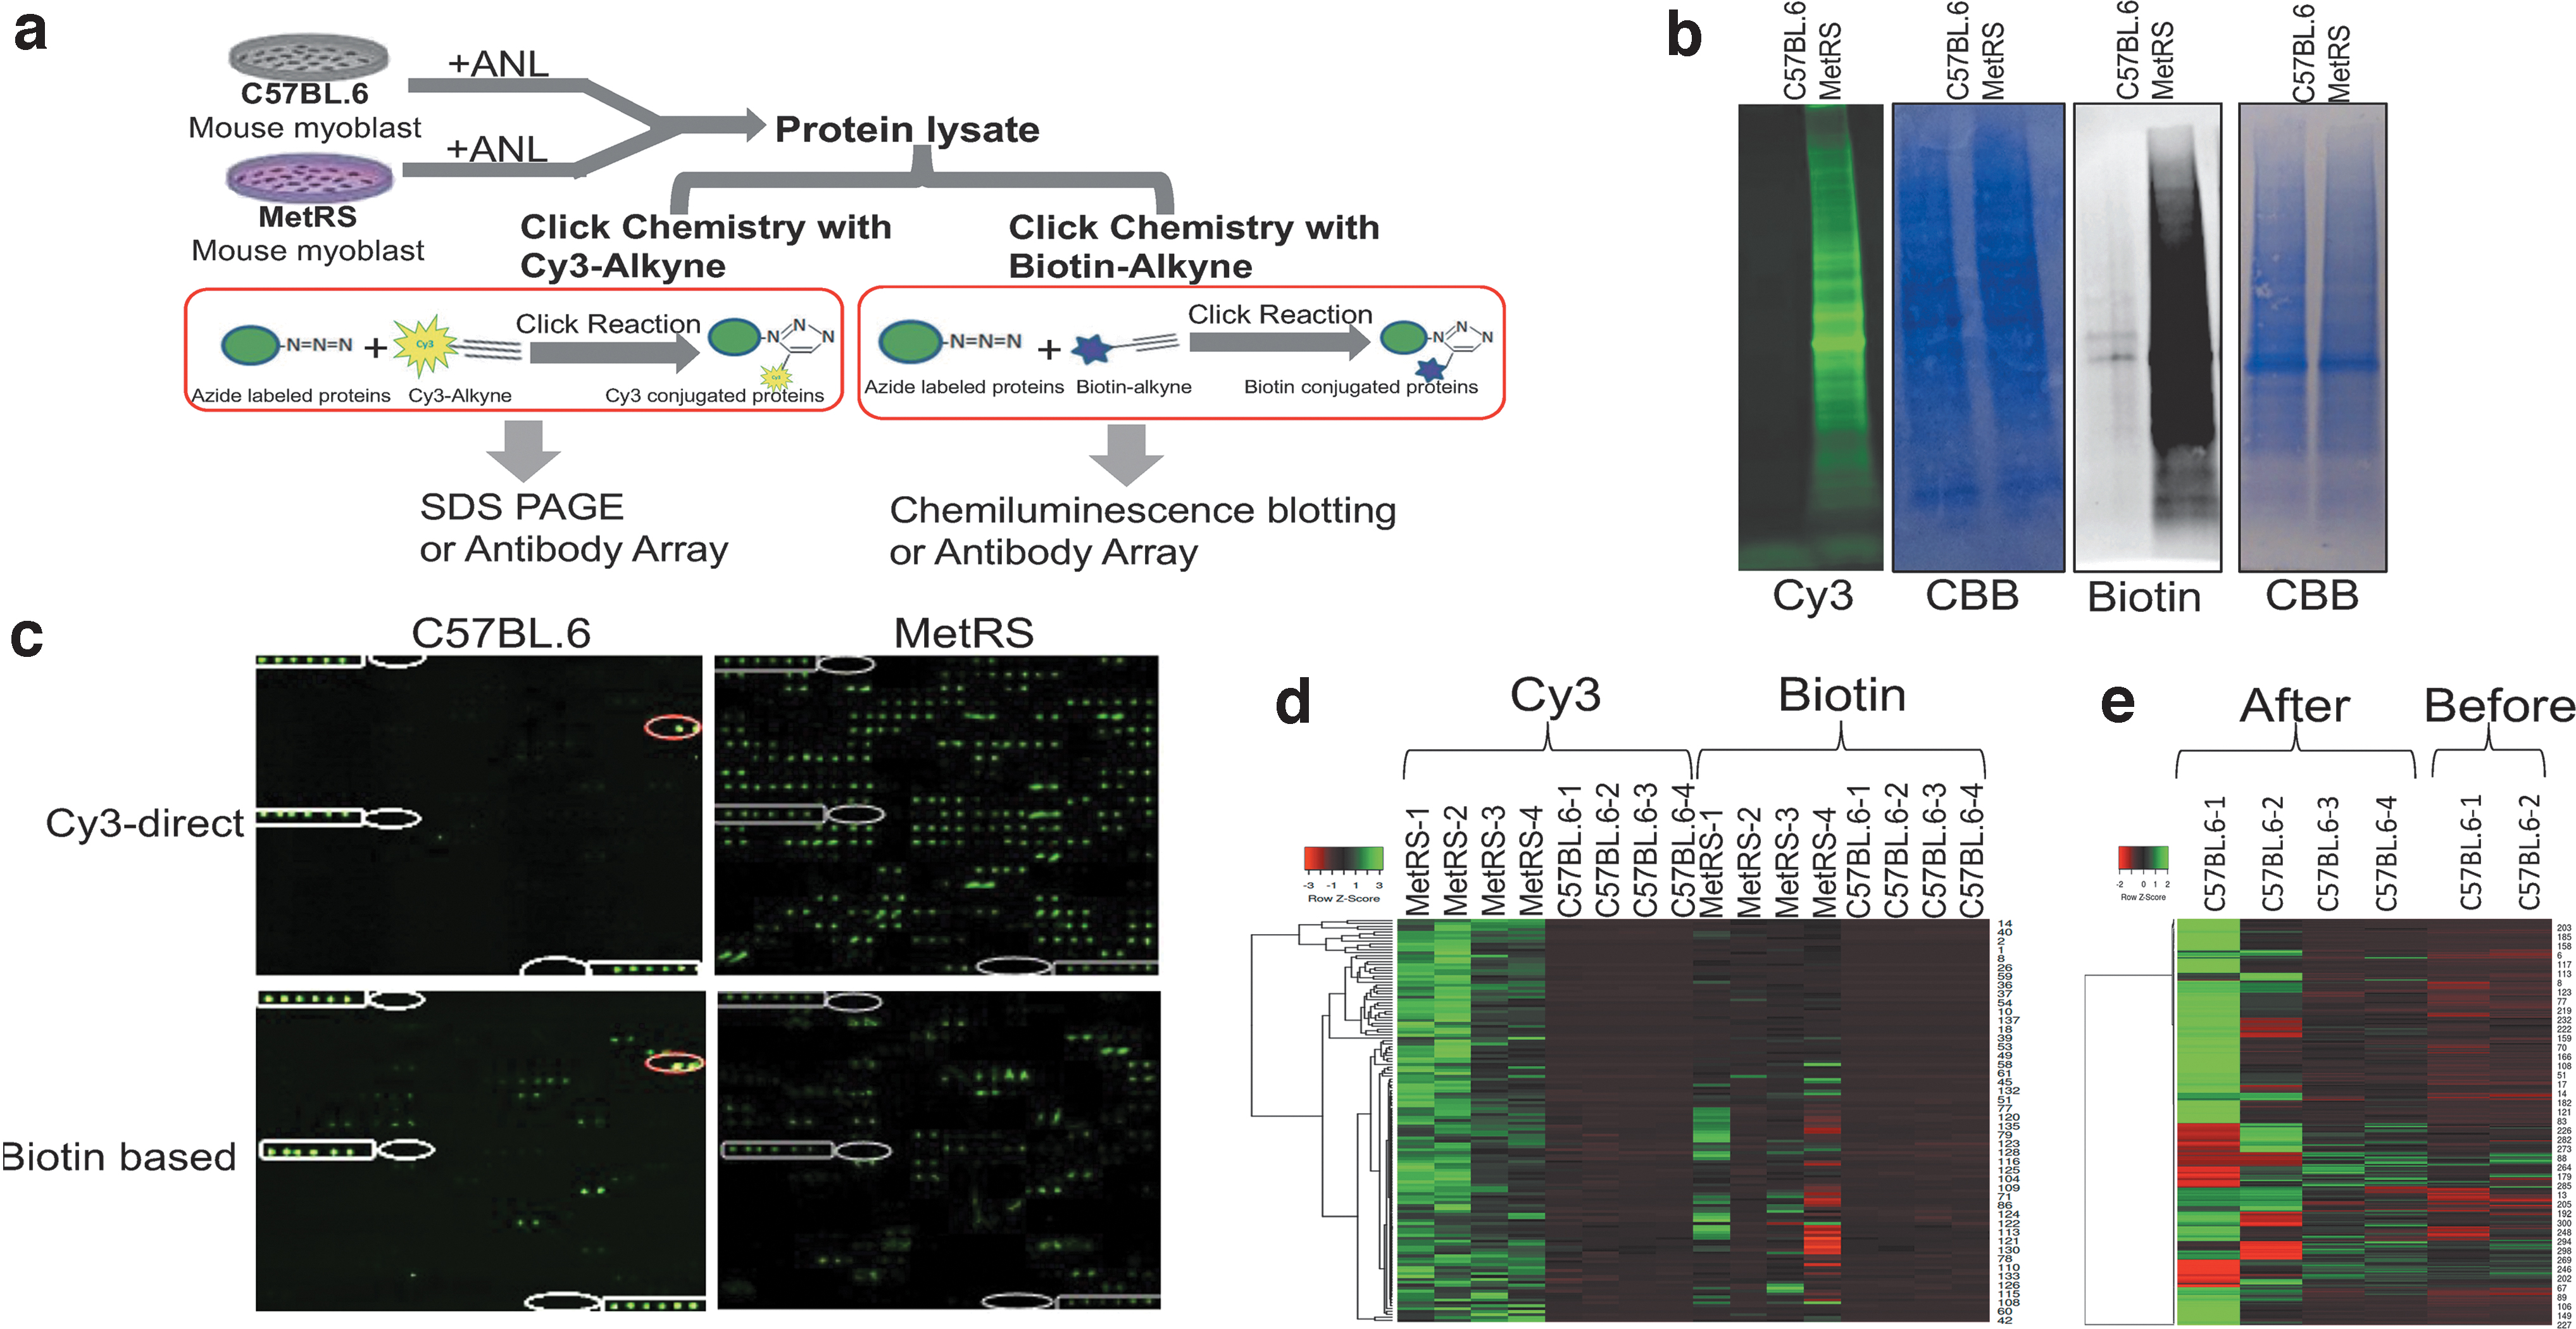
Primary myoblasts were derived from MetRSL274G and C57BL/6 mice and all the cells were metabolically labeled with ANL in culture (4 days, 2 mM ANL). Protein lysates from these MetRSL274G and the negative control, C57BL/6, myoblasts were clicked with either Cy3-Alkyne or biotin-Alkyne, as described in Materials and Methods section. The tagged proteome was resolved with in-gel fluorescence (Cy3-Alkyne click) or chemiluminescence (biotin-Alkyne click) and with BONCAT arrays (Fig. 4a schematically depicts this study).
Cy3-Direct robustly detected the azido-labeled proteins with low-to-no background, when comparing MetRSL274G cell lysate to the negative control, for example, C57/B6 cell lysate, after identical administration of ANL to all the cells (Fig. 4b). The nonspecific bands and other background noise that are typical for the biotin-based Click westerns and are present in the biotin-SA Chemiluminescence blotting were eliminated with the Cy3-Direct (Fig. 4b). 2,4,11,34 –36 Similar results were seen for the AHA labeling system (Supplementary Fig. S5).
Next, we compared the Cy3-Direct and biotin-SA in multiple independent experiments that culminated with the BONCAT antibody arrays (Figs. 4c, d). These studies demonstrated that in BONCAT arrays, Cy3-Direct resolves ninefold more proteins than the biotin-SA (Fig. 4c, d). This much improved resolution was simultaneous with the greatly diminished false positives (Fig. 4c, d; Supplementary Fig. S6).
Specifically, 197 proteins were resolved by the Cy3-Direct BONCAT arrays, compared to only 18 by the biotin-SA BONCAT arrays. Thirty-five false positives (C57/B6+ANL proteins) were detected with the biotin-SA BONCAT arrays, compared to four false positives in the Cy3-Direct method.
Confirming that naturally biotinylated proteins are a major source of false positives, SA-Cy3 array reagent that is added after the Cy3-Direct protein lysates are incubated with the arrays, increases the false positives of the C57/B6 samples, which become at the same level, as in the biotin-SA method (Fig. 4e; Supplementary Fig. 7). This is self-explanatory, because SA-Cy3 binds to all biotin-containing proteins, be they naturally biotinylated or clicked. In contrast, when this SA-Cy3 array reagent is added first to highlight the arrays-built positive controls; for example, before any proteins are present, and the Cy3-Direct protein lysates are added after the SA-Cy3 is washed away, the false positives are greatly minimized (Fig. 4c–e; Supplementary Figs. S6 and S7).
These data establish the Cy3-Drect BONCAT array method, which eliminates the reliance on biotin, consequentially increasing the accuracy of signal detection and minimizing the false positives, while also decreasing the experimental time and simplifying the assay.
Semantic image segmentation for noise reduction in optical outputs
Another persistent problem with the optical detection of antibody arrays’ data is the noise of nonspecific fluorescence that at times significantly masks specific signals. To address this problem and thus increase the reliable interpretation of the antibody array experiments, we used computational analysis and computer vision approaches.
The problem of denoising antibody array images can be reduced to a semantic image segmentation problem. There are many approaches available for image segmentation, including Otsu's intensity thresholding and pixel-by-pixel or segment feature extraction. 22,37,38 Here, we applied different data segmentation methods (Supplementary Fig. S8) and compared their efficiencies in clarifying the results of antibody arrays, using the Jaccard overlap metric score. 39
Moreover, several computer vision approaches were used, including utilizing baseline models, to compare efficacy. 40,41 One unsupervised learning approach was k-means intensity thresholding, an extension of Otsu's method. 22 The threshold was varied based on the relative intensities of all other pixels in a 40 × 40 patch.
All other approaches involved pixel masks, for example, the manual content of signals—dots, that were generated as input labels for weakly supervised learning. Traditional machine learning methods, such as a random-forest classifier, were used to learn the mask from the input image pixel-by-pixel. The results were compared against deep learning methods to learn the same problem. In self-supervised learning, Gaussian noise was introduced into the input image, and the algorithm objective was for an autoencoder to reconstruct the original image from the deliberately noisy one. Figure 5a shows the supervised training pipeline.

Antibody array image segmentation.
In Figure 5b, we see a representative image of a noisy antibody array where nonspecific fluorescence interferes with the positive and negative array-built controls and with the experimental signals. The image segmentation and machine learning approaches visibly reduced this nonspecific fluorescence.
The Jaccard scores are computed for all the methods and are compared between training and validation data for detecting the signal and the background (Fig. 5c). The Convolutional Neural Network (CNN) architecture is described in Supplementary Figure S8, which also provides the overall workflow, additional examples of arrays with nonspecific fluorescence and their denosing through our machine learning approaches.
In Figure 5d, saliency maps were computed by taking the absolute value of the gradient of our CNN model scores with respect to the input for every pixel. As can be seen from this figure, the model is the region of pixels, which estimates the location of the signal, in agreement with the published work. 42 These results, as well as the compressed representations of antibody arrays (Fig. 5e; Supplementary Fig. S8c), demonstrate that our residual CNN and Deep Convolutional Generative Adversarial Network (DCGAN) are the best models for this task. The residual CNN architecture is outlined in Supplementary Figure S8b. The main structure of this network is developed from U-Net, with modifications made to the number of hidden layers for a faster and more lightweight model, which is suitable for our problem.
Our trained CNN model has a validation Jaccard accuracy score of 71% and DCGAN of 66.5% in coverage of identifying positive signals. This vastly improves on a simple k-means thresholding and other traditional computational and machine learning approaches. Note that k-means thresholding is additionally used as a baseline (30% accuracy against the user-defined mask), which can be valuable in evaluating the accuracy of the user-defined mask.
Summarily, these novel computer vision approaches denoise the raw optical data of the antibody arrays, enabling more accurate interpretation of the results of comparative proteomics.
Discussion
MS and antibody arrays are two analytical tools that are commonly used to profile proteomes, but as this study shows, in application to BONCAT, both have inherent false-positive tendencies. The false discovery is more obvious in the antibody arrays, which have internal positive and negative controls and where the signal of the external negative controls (HBSS, no tag, etc.) can be compared with the experimental outcome, setting up a detection threshold, for instance, twofold higher with p < 0.05. In contrast, the false discovery of BONCAT MS is not as obvious for AHA tagging, and while some error is revealed through comparing with the MetRS274G ANL labeling, there is no easy way to objectively distinguish the binding artifacts of the biotin affinity steps from the experimental outcomes, for example, the true metabolically tagged proteome.
Indeed, our results uncover that BONCAT MS generates hundreds to thousands of cryptic false positives using published methods, which we found by applying appropriate negative control of tagging C57.B6 mice with ANL (Fig. 1). Proteins with diverse biological functions, sizes, and methionine contents were revealed as false positive, cautioning the interpretations in various fields of research. As expected, the higher abundance proteins are more likely to contaminate the enrichment columns.
The main sources of data contamination appear to be the naturally biotinylated proteome and the nonspecific binding of untagged proteins to the biotin affinity purification, DBCO beads, etc. columns. In support of this conclusion, a clear signal to noise increase, yet, still some background, are typically detected after the biotin Click step in Click western (Fig. 1, Supplementary Figs. S1 and S3, and in published work). 2
In this regard, another proteomics method using aptamers also relies on biotin and affinity-based enrichment for specific protein-aptamer complexes. Thus, controls for nonspecific binding might be prudent, particularly because even low false-positive discovery in aptamer proteomics will be amplified in the NextGen sequencing, and there are no negative controls like nonspecific IgG, which even in case of antibody-antigen interactions that have much higher affinity, typically yield some false-positive nonspecific binding. 43,44
BONCAT antibody arrays offer a feature of increasing PMT exposure during the scans and/or increasing the image brightness/contrast, which better reveals the false positives, that otherwise might appear as faint dots (Fig. 2 and previous publication). 16 Such no-tag signal is a given consequence of the naturally biotinylated proteome and our data demonstrate that preclearing with SA beads reduce these false positives (Fig. 3). 27
Importantly, even though some proteins that were naturally biotinylated and metabolically tagged are expected to be diminished, the number of ANL tagged experimentally detected proteins were increased when the nonspecific noise and artificial variability between the samples were reduced. Rigorous profiling of proteins in comparative proteomics relies on the signal-to-noise sensitivity, thus approaches which increase the distinction between the true signal and nonspecific signal allow one to identify more proteins (Fig. 3; Supplementary Fig. S4).
In another interesting observation, a side-by-side comparison between the AHA and ANL tagging demonstrated that the bioorthogonal transgenic MetRSL274G does not perform as effectively as the native MetRS (Fig. 3). Thus, while the bioorthogonal transgenic metabolic labeling enables many more experimental possibilities for specific cell-fate, cell age, and so on, proteome labeling might miss some of the newly synthesized proteins, compared to the WT-based AHA system. 9,23,31,45,46
At the same time, MetRSL274G ANL tagging helps to avoid a potential caveat of comparative proteomics that follows blood heterochronicity or administration of proteins into host animals and tracing these to different organs. In contrast to MetRSL274G approach, where WT animals are incapable of integrating ANL into their proteome, biotinylation, or AHA/biotin click, etc., similar methods do not distinguish between primary and secondary (after protein degradation and amino acid recycling) incorporation of the labels into the host proteome. 47 –50
Strengthening the conclusion of misinterpreting naturally biotinylated proteome for the metabolically labeled proteins, we demonstrate that Cy3-Direct BONCAT eliminates the false positives of the biotin-reliant Click Chemistry proteomics. Cy3-Direct BONCAT technology greatly improves the accuracy and resolution of protein detection, enhances the sensitivity and dynamic range of comparative proteomics (Fig. 4; Supplementary Figs. S5–S7), and in addition, makes the assays simpler and faster. In confirmation of the paradigm, SA-Cy3 reagent that highlights the naturally biotinylated proteins on the arrays and negates the biotin-independence, increases the nonspecific noise.
To further improve the signal to noise resolution, our computational analysis (computer vision) uses machine learning and data segmentation to significantly reduce the nonspecific fluorescence, thereby increasing the resolution and accuracy of BONCAT arrays (Fig. 5; Supplementary Fig. S8). This computational paradigm can be applied to any optical data, such as conventional antibody arrays, quantitative immunofluorescence, in situ sequencing, and so on.
Conclusions
Summarily, this work provides comprehensive characterization of false discovery of the BONCAT metabolic proteomics, and it establishes the technologies for minimizing and avoiding these undesirable outcomes.
Footnotes
Authors’ Contributions
C.L. and E.W. planned and performed the experiments with results shown in Figures 1
–4 and 5b, Supplementary Figures S1–S7 and cowrote the article. N.W. planned and performed the studies that are shown in Figure 5 and Supplementary Figure S8 and cowrote the article. W.H. performed the antibody array experiments, provided Figure 2b, and formatted the references. L.B. provided Figure 1b, d, e, and Supplementary Figure S2. K.A. and J.D. provided ![]() and discussion of proteomics’ methods. M.M. provided Supplementary Figure S1b and c. M.J.C. conceived and planned the work on the naturally biotinylated proteins and cowrote the article. I.M.C. designed and directed the study, interpreted, and integrated the results and wrote the article.
and discussion of proteomics’ methods. M.M. provided Supplementary Figure S1b and c. M.J.C. conceived and planned the work on the naturally biotinylated proteins and cowrote the article. I.M.C. designed and directed the study, interpreted, and integrated the results and wrote the article.
Acknowledgments
We thank Leran Mao for Click-Westerns. We also thank Katheryn Zhou, Natalie Celt, Crystal Gong, Alina Su, and Alexandra Benoni for providing technical help with these studies. We thank Dr. Lori Kohlstaedt at QB3/Chemistry Mass Spectrometry Facility at UC Berkeley for the assistance in MS analysis.
Author Disclosure Statement
The authors declare no conflict of interests.
Funding Information
This work was supported by the Open Philanthropy and NIH RO1 grants to I.M.C.
Supplementary Material
Supplementary Figure S1
Supplementary Figure S2
Supplementary Figure S3
Supplementary Figure S4
Supplementary Figure S5
Supplementary Figure S6
Supplementary Figure S7
Supplementary Figure S8
References
Supplementary Material
Please find the following supplemental material available below.
For Open Access articles published under a Creative Commons License, all supplemental material carries the same license as the article it is associated with.
For non-Open Access articles published, all supplemental material carries a non-exclusive license, and permission requests for re-use of supplemental material or any part of supplemental material shall be sent directly to the copyright owner as specified in the copyright notice associated with the article.