




Abstract
This study aims to investigate the association between sleep duration and osteoporosis. In addition, sleep-related gene methylation was also detected in this study and we explored its relationship with osteoporosis. The epidemiological investigation section of this study was designed as a retrospective cross-sectional study. We gathered 148 postmenopausal women from two communities and used questionnaires to collect data of sleep duration and other sleep patterns. Biochemical variables were tested, and bone mineral density was measured by dual-energy X-ray absorptiometry. In addition, sleep-related gene (PER2 and PER3) methylation was tested, and the association with osteoporosis was further studied. Twenty-nine of the 148 participants (aged from 65 to 86 years) who suffered from osteoporosis were tested for osteopenia. A significant difference was observed in the association between sleep duration and osteoporosis; the p-value was 0.013. In addition, in our study, we found that short sleep duration (<7 hours) may increase the risk of osteoporosis compared with longer sleep duration. Moreover, sleep-related genes such as PER2 and PER3 and their CpG island methylation were tested, and there was no significant difference between PER2 and PER3 CpG island methylation and osteoporosis. Short sleep duration may increase the risk of osteoporosis. However, the association between sleep-related gene methylation and osteoporosis was not found.
Introduction
Osteoporosis is a global problem, causing severe economic burden, physical disability, and impaired quality of life. The major complication of osteoporosis is fracture, which is associated with an increase in rates of morbidity and mortality, especially in elderly men and women. 1,2 At present, osteoporosis, diabetes, and cardiovascular disease have been listed as the three major causes of the decline in health of the elderly by the World Health Organization (WHO).
Sleep is a fundamental biological process that plays an important role in varieties of metabolic and endocrine functions. 3 Long or short sleep duration is likely to cause a series of health problems, such as cardiovascular disease, diabetes, obesity, and even an increase in all-cause mortality. 4 –9 Previous studies focusing on the association between sleep duration and osteoporosis revealed that long sleep duration 2,10 –13 or short sleep duration 10,14 may increase the risk of osteoporosis.
The mechanism remains unknown, but estrogen may be a potential factor between sleep duration and bone health. Estrogen is known as a crucial factor for maintaining bone mineral density. 15 –17 A meta-analysis that collected results from good quality studies demonstrated that the postmenopausal decline in estrogen contributed to sleep disturbance in women and that timely treatment with estrogen therapy improved overall sleep quality. 18 Therefore, we conducted this study to investigate the association between sleep duration and osteoporosis.
Lots of biochemical varieties have been proven to be connected with bone metabolism. 25(OH)D, tropocollagen type 1 N-terminal propeptide (P1NP), β-crosslaps of type I collagen containing cross-linked C-telopeptide (β-CTX), and parathyroid hormone (PTH) are markers of bone turnover. In addition, balance of calcium and phosphorus affects bone metabolism. 19,20 Moreover, many studies have proposed the relationship between uric acid, 21 alkaline phosphatase, 22 creatinine, 23 glucose, 24 high-density lipoprotein (HDL), 25 and low-density lipoprotein (LDL). 26
The circadian clock has been shown to regulate many important physiological processes such as the sleep–wake cycle, hormone release, and even bone metabolism in recent research. 27 –29 Many studies have presented that the genes, PER2 and PER3, play a role in primary circadian rhythm maintenance in the brain, and the relationship between sleep problems and genotypic and genetic diversity of PER2 and PER3 was studied. 30 –34
Moreover, one study indicated that polymorphisms in period genes of PER2 and PER3 seemed to relate to bone health. 35 In addition, PER2 inhibits the Wnt/β-catenin signaling pathway and shows synergistic effects on proliferation and differentiation of bone marrow mesenchymal stem cells (BMSCs) 36 and other pathways as well. 37 –39 In addition, one study showed that knocking down endogenous miR-181a expression in immortalized bone marrow derived stromal cell (iBMSC) has a profound inhibitory effect on iBMSC adipogenesis through its regulation of PER3. 40
On the other hand, gene methylation of m6A, 41,42 BMP2, 43 TBC1D8, 44 and even lncRNA-AK137033 45 was found to be associated with osteoporosis, as studied previously. However, few studies have investigated the relevance between circadian gene methylation and sleep problems and the relationship with osteoporosis.
Thus, we conducted a study on the association between sleep duration and osteoporosis, and we detected biochemical varieties and PER2 and PER3 gene CpG island methylation. We studied whether there is a correlation between sleep duration and osteoporosis and verified the correlation at the genetic aspect.
Methods
Sample collection
We used questionnaires to collect data from Han Chinese postmenopausal women aged >50 years in two communities (Zhen-Ming community and Ying-Feng community, Haishu District, Ningbo). The questionnaire contained questions on age, sleep duration, nap time, insomnia, age at menopause, hypertension history, diabetes history, fracture history, regular use of calcium, and history of smoking and drinking.
Ethics approval was obtained from the Ethics Committee of Ningbo University-Affiliated First Hospital, China. The methods in the study were in accordance with relevant guidelines and the Declaration of Helsinki. All participants gave informed consent.
Biochemical measurements
We obtained fasting blood samples from the individuals after 30 minutes of rest in the morning. Serum calcium (Ca), serum phosphorus (P), serum uric acid, serum alkaline phosphatase, serum creatinine, and glucose (Glu) levels were all measured using kits from Roche Diagnostics. HDL and LDL levels were tested using kits from Olympus Co., Ltd.
We also detected bone turnover markers, such as PTH, P1NP, and β-CTX, using kits from Roche Diagnostics. 25-Hydroxyvitamin D3 [25(OH)D] was measured using kits from Meikang Biological Tech.
Bone mineral density testing
Bone mineral density (BMD) measurement by dual-energy X-ray absorptiometry (DXA) is an internationally accepted standard-of-care screening tool used to assess fragility-fracture risk. And in our study, BMD was tested by dual-energy X-ray absorptiometry on a Lunar Prodigy GE densitometer (Lunar Corp., Madison, WI). Lumbar spine (L1–L4), left femoral neck, and total hip were all assessed in the tests.
Diagnosis of osteoporosis was made based on the criteria followed by WHO (1994): participants with a T-score <−2.5 SD were classified as having osteoporosis; those with a T-score <−1.0 SD, but >−2.5 SD, were classified as having low bone mass; and those with a T-score >−1.0 SD were classified as normal. Besides, body–mass index (BMI) was calculated as height divided by the square of weight.
DNA extraction and methylation sequencing
DNA was extracted from peripheral blood samples following routine methods (DNeasy Blood & Tissue, Qiagen). We measured the DNA concentration using a NanoDrop 100 spectrophotometer (Aosheng, Hangzhou city, China). Extracted DNA was combined with sodium bisulfate DNA conversion (EpiTect, Bisulfite Kits, Qiagen). DNA sequencing primers were designed using Methyl Primer Express (version 1.0), as shown in Table 1.
Primers Used for the DNA Methylation Assay
The polymerase chain reaction (PCR instrument; Thermal Scientific Co., Ltd., Wilmington) was applied to achieve amplification of objective strips. DNA methylation was evaluated by applying capture sequencing (Illumina Co., Ltd., San Diego).
Statistical analyses
All statistical analyses were performed using the SPSS package (version 23.0) or GraphPad software (version 6.0). The chi-square test was performed to compare rates in different groups and sleep duration in different bone mass groups. Analysis of variance was used to test for differences in means across multiple samples, contrasting biochemical variables and bone mineral density levels in different sleep duration groups.
A two-sample independent t-test was used to investigate differences in PER2 and PER3 CpG island methylation levels between cases and controls. Besides, a linear regression was applied to evaluate the association between PER2 and PER3 CpG island methylation levels and biochemical variables in cases and controls, respectively. All p-values were two-sided, and the level of significance was set at <0.05, unless explicitly stated otherwise.
Result
We collected 148 samples (aged from 65 to 86 years) from the communities of Zhen-Ming and Ying-Feng. Among the participants, we discovered 29 osteoporosis patients, and the prevalence rate of osteoporosis was 19.6%. In addition, osteopenia was detected in 65 participants.
There was no significant difference for sleep time, afternoon nap, insomnia, and osteoporosis, but sleep duration showed a significant difference, between groups.
The contrast of clinical characteristics between different sleep duration groups is shown in Table 2. We used the chi-square test to calculate differences in daily habits, and analysis of variance was performed to compare differences in age, BMI, and menopause rates in different sleep groups. There was no statistically significant difference in age, BMI, menopause age, history of fracture, taking calcium tablets regularly, smoking, alcohol drinking, whether there was diabetes or hypertension, and exercise time.
Contrast of Clinical Characteristics in Different Sleep Duration Groups
In addition, for biochemical variables, contrasts of biochemical variables and bone mineral density levels in different sleep duration groups are shown in Table 3. In addition, the statistical analysis was performed using analysis of variance. Different sleep groups had significant differences in HDL and LDL levels, and a further statistical analysis showed that individuals in the group with 6–7 hours of sleep per night had a higher HDL level.
Contrast of Biochemical Variables and Bone Mineral Density Levels in Different Sleep Duration Groups
p < 0.05, it is significant statistical difference.
BMD, bone mineral density.
Other groups had lower HDL levels, and there was a significant difference between the groups with more than 8 hours and less than 6 hours of sleep; the statistical p-values were 0.001 and 0.033, respectively. For LDL testing, participants who sleep for 6–7 and 7–8 hours had lower LDL levels, and the difference was significant between groups with 6–7 hours of sleep and less than 6 hours of sleep.
Furthermore, we divided participants into three groups according to BMD testing: osteoporosis, osteopenia, and normal bone mass subgroups. The details are shown in Table 4. The chi-square test was used to compare the different sleep patterns in different bone mass groups. In the three groups, we found that individuals with different bone mass levels had different sleep duration, and the difference was statistically significant. Short sleep duration was more likely to be associated with an increased risk of osteoporosis.
Contrast of Different Sleep Patterns of Individuals in Osteoporosis, Osteopenia, and Normal Bone Mass Groups
p < 0.05, it is significant statistical difference.
In addition, individuals with osteopenia were more likely to report sleep duration of between 6–7 and 7–8 hours. In addition, further variance analysis showed that the group with less than 6 hours of sleep had lower BMD levels in 1–4 lumbar vertebrae. The difference was statistically significant. Sleep time ranged from before 8 pm to before 12 pm, and majority of the participants went to bed before 10 pm. We also performed a further comparison between the three groups, and no statistical difference was found. The same conclusion was found for whether to take a nap and insomnia.
PER2 and PER3 CpG island methylation levels were tested. Distributions of CpG island methylation in the promoter regions of PER2 and PER3 genes in osteoporosis, osteopenia, and normal bone mass groups are shown in Figures 1 –3. In addition, we analyzed the connection between PER2 and PER3 gene methylation and osteoporosis.
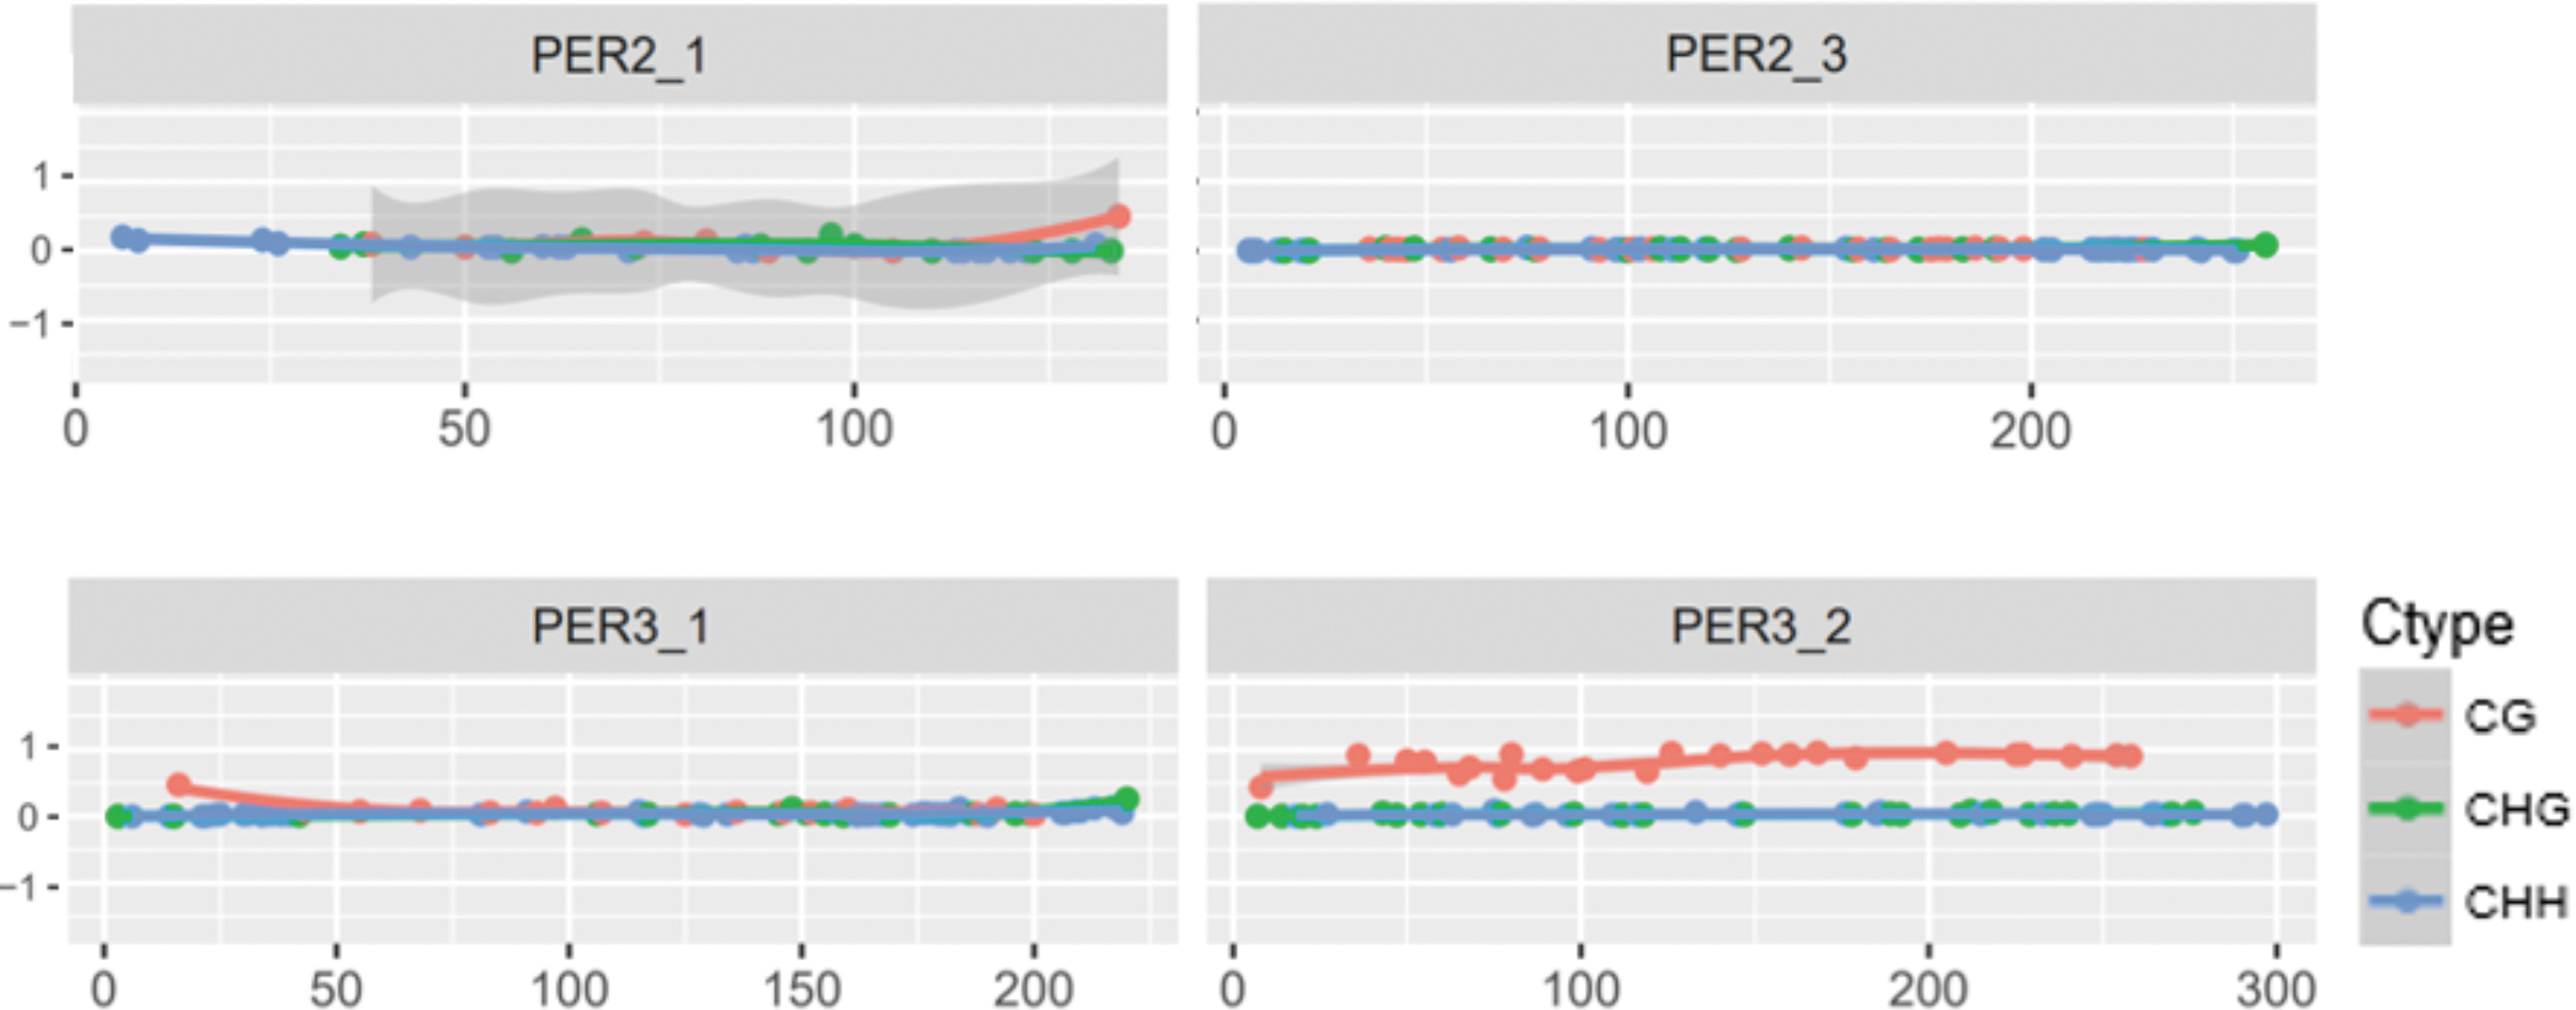
Distribution of CpG island methylation in the promoter regions of PER2 and PER3 genes in the osteoporosis group (taking sample S1 as an example).

Distribution of CpG island methylation in the promoter regions of PER2 and PER3 genes in the osteopenia group (taking sample S2 as an example).

Distribution of CpG island methylation in the promoter regions of PER2 and PER3 genes in the normal bone mass group (taking sample S3 as an example).
In the three groups of osteoporosis, osteopenia, and normal bone mass, we performed a further comparison of PER2 and PER3 gene CpG island methylation. We found that in the pairwise comparisons of groups, no statistical significances were found. In the analysis of PER2 gene methylation, the p-values compared between the two groups were 0.345, 0.176, and 0.052, respectively. And the p-values were 0.147, 0.678 and 0.579 respectively, in the analysis of PER3 gene methylation.
Furthermore, we detected an association between BMD of different regions and CpG island methylation of PER2 and PER3. For the association between lumbar 1–4 BMD and methylation of the genes, PER2 and PER3, correlation coefficients were 0.037 and 0.154 and p-values were 0.780 and 0.240. For the BMD of the neck of femur, correlation coefficients were 0.141 and 0.027 and p-values were 0.282 and 0.836. In addition, for the BMD of the total hip part, correlation coefficients were 0.107 and 0.034 and p-values were 0.416 and 0.798.
There was no significant difference between all the different bone regions and methylation of the genes, PER2 and PER3.
Discussion
The present study showed that sleep duration was associated with osteoporosis. In addition, longer sleep duration was associated with a higher incidence rate of osteopenia. Other sleep disorders such as insomnia, sleep timing, and afternoon nap were not found to be statistically related to osteoporosis. In multitudinous literature, sleep disorders, including insomnia, 46 taking a daytime nap, 11,47 and early sleep timing, were found to affect bone metabolism. 13 The relationship was controversial between different sleep patterns and osteoporosis.
The exact mechanisms have not yet been explained, especially in the association between sleep duration and osteoporosis. Three, Chinese, cross-sectional cohort studies, with participants from Henan, Fujian, and Hubei provinces, reported that longer nocturnal sleep duration was associated with a higher risk of osteoporosis. 11,13,48 In a Japanese study, those individuals with self-reported sleep duration of more than 8 h (long sleepers) appeared to have higher odds of osteoporosis compared to the progressively shorter sleepers. 12
On the contrary, data from National Health and Nutrition Examination Survey 49,50 and a cohort study in Asians 47 demonstrated that short sleep duration may lead to an increased risk of osteoporosis, which was similar to our results. There are several hypotheses that may explain why shorter sleep duration leads to osteoporosis.
First, sleep duration was associated with endocrine disturbance, which was found to be associated with osteoporosis. It was proven that sleep restriction may increase endogenous glucocorticoid secretion and inhibit release of growth hormone. 51,52 In addition, longer sleep duration may have a positive influence on regulation of insulin metabolism. The mechanisms to reduce insulin resistance, improve insulin sensitivity, and regulate glucose metabolism were found in several studies, 53 –55 all of which proposed a benefit to bone health. 56,57
Second, a network meta-analysis of 43 randomized controlled trials in menopausal women supported combined estrogen–progesterone therapy for menopausal sleep disturbance. 58 Another randomized, double-blind crossover trial in postmenopausal women was performed, which showed that estrogen replacement therapy improved objective sleep quality by alleviating the frequency of nocturnal movement arousals. 59 It also reflected that estrogen may be an important factor affecting sleep.
Similar conclusions on declining estrogen and sleep disruption reciprocal causation were drawn in two other studies. 60,61 Thus, shorter sleep duration would decrease estrogen, especially in postmenopausal women. As is known, estrogen played an important role in bone metabolism. Estrogen inhibited differentiation of osteoclasts and decreased their number, reducing the number of active remodeling units at the cellular level. 62 A previous study demonstrated that the estrogen level had a contrary association with osteoporosis and fracture of the hip and vertebra. 63 The mechanism remains unclear.
One study showed that estrogens binded to estrogen receptor ERα and ERβ, and the roles of each of these receptors were beginning to be elucidated through whole body and tissue-specific knockouts of the receptors. In vitro and in vivo experiments showed that ERα and ERβ antagonized each other in bones. 64 Another review showed that estrogen reduction contributed to a decline in bone and skeletal muscle function, thereby resulting in osteoporosis and sarcopenia. 65
A previous study showed that the PER2 gene may regulate aging of mouse BMSCs through the Wnt/β-catenin pathway. 36 In addition, a study on postmenopausal women in Korea showed that the PER2 and PER3 gene polymorphisms studied were not associated with bone mineral density. 66 There are few studies that show the association between PER2 and PER3 gene methylation and osteoporosis.
As previously mentioned, PER2 is a primary canonical clock gene that shows synergistic effects on proliferation and differentiation of mouse BMSCs by modulating the Wnt/β-catenin pathway. 36 In addition, another literature showed that PER1 gene polymorphism may be associated with the risk of nonresponse to hormone therapy and it may be the genetic factor affecting the lumbar spine BMD in postmenopausal women in Korea, but the same conclusion was not drawn for PER2 and PER3. 35,66 On the other hand, the PER3 allele status had an effect on mood states and thereby interacts with sleep duration. 67
Other studies mentioned that the genes, PER2 and PER3, were associated with sleep quality and sleep structure, 32,34,68,69 and one study showed that the PER2 gene methylation level was associated with shorter sleep duration. 70 There are few studies that investigate the association of PER2 and PER3 gene methylation with osteoporosis. In our study, the findings did not show an association between methylation of PER2 or PER3 and osteoporosis.
Nevertheless, some limitations existed in our study. First, we had a limited number of researchers. We collected more than 148 participants, but some participants gave up in the part of BMD tests or blood drawing. Therefore, we lost the complete data of some participants. Second, the sleep duration of all participants was self-reported, so there could be some statistical errors.
Third, we selected two genes and tested the CpG island methylation of these genes. Even though the two genes were associated with sleep duration and sleep patterns, as reported in many studies before, we found no statistical association between methylation of these genes and osteoporosis. However, we couldn't explain that gene methylation is not related to osteoporosis. We could only say that our research suggested that methylation of these two genes does not seem to be associated with osteoporosis.
In conclusion, our study showed that a significant association exists between sleep duration and osteoporosis. The present evidence indicated that short sleep duration (less than 7 hours) increased the risk of osteoporosis compared with sleep duration of more than 7 hours. In addition, we detected CpG island methylation of genes (PER2 and PER3), which was associated with sleep duration. Furthermore, we found no relationship between methylation of PER2 and PER3 genes and osteoporosis.
Footnotes
Authors' Contributions
Q.M. and T.L. wrote the main manuscript text. Y.L. and Q.X. collected the samples from the community. H.X. and Q.Y. performed the experiments. All authors reviewed the manuscript.
Author Disclosure Statement
The authors declare that we have no conflict of interest.
Funding Information
This study was supported by the Zhejiang Medical and Health Technology Project (grant 2021KY985).