
Abstract
NQO1 disruption enhances susceptibility to oxidative stress during hyperglycemia and is a significant contributor to the development and progression of diabetes. Oxidative stress has been linked to several symptoms, including hyperglycemia, reactive oxygen species buildup, high blood pressure, and the expression of inflammatory markers. Therefore, the present research aimed to evaluate the genetic abnormality of NQO1 (rs1800566, C609T) gene polymorphism, expression, and vitamin-D level assessment among Type 2 diabetes mellitus (T2DM) patients. The study included 100 newly diagnosed T2DM cases and 100 healthy individuals as healthy controls. Total RNA was extracted from the whole blood using the TRIzol method, and further cDNA was synthesized, and expression was evaluated.
There is a significant difference in NQO1 (rs1800566, C609T) genotype distribution among the T2DM patients and healthy controls (p = 0.04). Compared with the NQO1 CC wild-type genotype, the NQO1 CT heterozygous genotype had an odds ratio of 1.96 (1.08–3.55), and the NQO1 TT mutant type genotype had an odds ratio of 3.31 (0.61–17.77). Significantly decreased expression of NQO1 mRNA was observed with heterozygous CT (p < 0.0001) and homozygous mutant TT genotype (p = 0.0004), compared with homozygous wild-type CC genotype. NQO1 mRNA expression level was also compared with vitamin D levels among the T2DM patients. T2DM patients with vitamin D deficiency had 1.83-fold NQO1 mRNA expression, while vitamin D insufficient and sufficient T2DM cases had 3.31-fold (p < 0.0001) and 3.70-fold (p < 0.0001) NQO1 mRNA expression.
It was concluded that NQO1 (rs1800566, C609T) CT and TT genotypes played a significant role in the worseness of type II diabetes mellitus, and decreased expression of NQO1 mRNA expression could be an essential factor for disease worseness as well as hypermethylation could be a factor for reduced expression leading to disease severity. The decreased NQO1 mRNA expression with heterozygous CT and mutant TT genotype associated with vitamin D deficiency may contribute to disease progression.
Introduction
Type 2 diabetes mellitus (T2DM) is a metabolic disorder characterized by insulin resistance and polyuria, polyphagia, and polydipsia as main symptoms. 1 According to WHO, globally, 422 million people are affected with diabetes and associated comorbidities. The Kingdom of Saudi Arabia is undergoing rapid development and has several health challenges. Socioeconomic, climatic, and cultural factors influence DM prevalence and early diagnosis. 2 Diabesity epidemic is a major contributing risk factor for T2DM and cardiovascular mortality and morbidity. 3 Obesity accounts for 80% of diabetic cases, and a family history of hyperglycemia, hypertension, and dyslipidemia plays a significant role. 4 Therefore, metabolic and genetic factors are responsible for the development of T2DM. 5 The pathway Keap1-Nrf2-ARE (Kelch-like ECH-Associating protein 1) nuclear factor erythroid two-related factor 2-antioxidant response element) has a significant contribution to the expression of genes that encode crucial mediators in cellular defense against oxidative stress, such as the NQO1 gene that encodes NAD(P)H quinone oxidoreductase 1 (NQO1). 6 The cytosolic enzyme, NQO1 or DT-diaphorase (gene located on the 16q22.1) catalysis the two-electron reduction reaction of quinone compounds, which inhibits the formation of reactive oxygen species and semiquinone free radicals and protect cells by oxidative damage. 7 NQO1 role in oxidative stress and its polymorphism (C609T) were thoroughly investigated in many types of research, such as mentioned by Malik MA et al., who suggested that NQO1 (609C>T) gene polymorphism is linked with a higher risk of esophageal cancer in the Kashmir population. 8 A study by Fan Y et al. showed that individuals carrying the NQO1 C609T polymorphism were linked with hepatocellular carcinoma in Asians. 9 Yadav U et al. reported that the NQO1 C609T polymorphism is a risk factor for digestive tract cancer, gastric cancer, and colorectal cancer. 10 Gorący J et al. also suggested that the TT genotype of the NQO1 polymorphism increases the risk for colorectal cancer patients. 11
Epidemiology and functional research have recently begun to demonstrate that vitamin D is critical in treating type 1 and type 2 diabetes. Vitamin D controls insulin secretion in pancreatic islets and insulin sensitivity in several peripheral metabolic organs by acting through the vitamin D receptor (VDR). Vitamin D can enhance glucose homeostasis by boosting insulin secretion, lowering inflammation, reducing autoimmunity, conserving beta cell mass, and sensitizing insulin action in T2DM animal model screening study suggested that vitamin D deficiency has been shown to impact increasing T2DM incidence. 12 The active form of vitamin D, 1,25 (OH)2D, binds to VDR and activates genes involved in glucose transport and insulin secretion 13 and β cell growth. 14 However, vitamin D may indirectly influence intracellular calcium concentrations to control insulin secretion. Calcium stimulates insulin release by encouraging the mobilization of insulin vesicles and their exocytosis. 15 Low plasma 25(OH)D levels are also proposed as a risk factor for T2DM. 16 A decrease in insulin resistance and increased insulin secretion has been reported with vitamin D supplementation. 17 However, NQO1 gene alteration was not explored in the Saudi Arabian diabetic population; therefore, the present research study aimed to evaluate the role of NQO1 (rs1800566) gene polymorphism, hypermethylation, and mRNA expression, status, and also its association with vitamin D level among Saudi Arabia-based T2DM patients.
Methodology
Subject’s selection
The present study included 200 individuals (100 newly diagnosed T2DM patients and 100 healthy controls using 95% power for sample size) after the ethics approval by the Research Ethics Committee (H-2023-014) at the University of Hail, Saudi Arabia. The patient’s inclusion criteria were newly diagnosed T2DM patients; obese and nonobese T2DM; hypertensive and nonhypertensive T2DM, and the exclusion criteria included type 1 diabetes; any malignancy; and kidney and cardiac-related disorder. Informed consent was obtained from all the participants. Furthermore, 5 mL of peripheral blood sample was withdrawn in fluoride vials (1 mL), EDTA (2 mL), and plain vials (2 mL) for the diagnosis of T2DM, such as blood sugar levels during fasting (glucose level 126 mg/dL), and separate sample for postprandial (2-hour blood glucose 200 mg/dL). EDTA samples of both T2DM case and control groups were used for DNA extraction using commercially available kits (Geneaid). Sample collected in plain vials were used to separate the serum for biochemical estimation.
NQO1 gene alteration among T2DM cases and healthy volunteers
NQO1 (rs1800566, C609T) genotypes were determined by Allele-specific PCR method, using extracted DNA from all the cases using the kit protocol (Geneaid, Taiwan). For the PCR reaction, 3 μL template DNA (100 ng), 25 pmol each primer (0.25 μL), 10 mM dNTPs (2.5 μL), 20 mM MgCl2 (1.5 μL), 5U/μL Taq polymerase (0.3 μL) with 10X Taq Buffer (2.5 μL) (Fermantas) and nuclease-free water (14.7 μL) to make total 25 μL reaction volume. Initial denaturation (94°C for 10 minutes), denaturation (95°C for 40 seconds), annealing (58°C for 40 seconds), and extension (72°C for 40 seconds) until 40 cycles and extension (72°C for 10 minutes) were PCR cycling conditions, and after the amplification, primer sequences for allele-specific PCR was used as F1: 5 TAT CAG AGT GTC TTA CTG AGA and R1: 5 AAT GCT ATA TGT CAG TTG AGG for the C allele; and F2: 5 GTG GCT TCC AAG TCT TAG AAT and R2: TTT CTA GCT TTG ATC TGG TTG for the T allele. A 2% agarose gel was stained with ethidium bromide to visualize the amplified DNA. Genotyping was characterized by a 161-bp band for the C (Pro) allele and a 283-bp band for the T (Ser).
Methylation analysis
Extracted DNA (100 ng) from all the participants was subjected to sodium bisulfite conversion using the BisulFlashTM DNA Modification Kit obtained from EpigenTek. After bisulfite modification, methylation-specific PCR (MS-PCR) was performed to check the hypermethylation status. The total reaction volume for MS-PCR was 25 μL using the PCR master 10 μL containing a working concentration of 25 pm for each primer following the program. Initial denaturation was performed at 95°C for 10 minutes, followed by 40 cycles of denaturation at 94°C for 45 seconds, annealing at 50°C in case of NQO1 hypermethylation and 48°C for NQO1 unmethylation for 45 seconds, and extension at 72°C for 45 seconds. This was followed by a final extension at 72°C for 10 minutes and cooling at 4°C for 10 minutes.
RNA isolation and cDNA preparation
Total RNA was extracted using the TRIzol method, and the concentration was determined by measuring the absorbance at 260 nm. Subsequently, cDNA synthesis was performed using commercially available kit products (Thermo Fisher Scientific, USA) following the manufacturer’s protocol. In a thermal cycler, a mixture of total RNA (100 ng), oligo-dT primer, and water was incubated for 5 minutes at 70°C and then kept at 4°C (10 minutes). Then, in a total volume of 20 μL, 5X RT buffer, 5 mM dNTPs, RNAse inhibitor, and reverse transcriptase were added to this reaction mixture as per protocol instruction. This final reaction mixture was incubated for one hour at 42°C, and the reaction was stopped by putting the mix at 95°C for 5 minutes and then at 40°C.
Expression by quantitative RT (Real-Time) PCR
The specific primers for NQO1 expression were used, forward (5′-TGAAAGGCTGGTTTGAGCGA-3′), reverse (5′-GCCTTCTTACTCCGGAAGGG-3′) and b-actin, forward (5′-CCAGCACAATGAAGATCAAGATC-3′), b-actin, reverse (5′-ATCTGCTGGAAGGTGACA-3′) by quantitative RT PCR using cDNA as template. Reaction volume of 20 μL was maintained, using 10 μL SYBR Green master mix, cDNA (1 μL), forward primer (0.3 μL, 25 pmol/L), reverse primer (0.3 μL, 25 pmol/L), and nuclease-free water (8.4 μL). Initial denaturation of the QRT-PCR took place at 95°C (10 minutes). Further denaturation at 95°C (30 seconds), primer annealing at 56°C (30 seconds), and elongation at 72°C (45 seconds) were performed for 40 cycles, followed by extension at 72°C (5 minutes). To ensure the precise amplification of the targeted gene, the final segment included a melting curve program (ranging from 35°C to 95°C).
Biochemical and vitamin-D level assessment
The electrochemiluminescence immunoassay was used to measure the levels of high-density lipoprotein (HDL), low-density lipoprotein (LDL), triglyceride (TG), cholesterol, very low-density lipoprotein (VLDL), and vitamin D in the participant’s serum that had been frozen at 80°C (Cobas e411, Roche, Basel, Switzerland). Vitamin D deficiency was defined as having serum 25(OH)D levels below 20 ng/mL, insufficiency as values between <30 ng/mL, and sufficient as levels at or above 30 ng/mL. 18
Statistical analysis
GraphPad Prism 5.0 and the Statistical Program for Social Science version 20 were used to analyze all data. The genotyping frequencies between the case and control groups were compared using the chi-square test, and values under five were examined using the Fisher exact test. Allele frequency was calculated by the Hardy–Weinberg Equilibrium equation, and odds ratio and relative risk were used to estimate the relationship between the NQO1 genotype and the risk of T2DM. The quantitative baseline data among the T2DM and healthy control participants (2 groups) were compared using the Mann–Whitney U test, and the 3 group data were compared using the Kruskal–Wallis test. The p values <0.05 were considered statistically significant.
Results
Baseline characteristics and diabetes-specific parameters in both case and control groups
The baseline characteristics and T2DM-specific parameters are explained in Table 1. The mean age of cases (type II diabetic patients) was 58.23 ± 7.22, and the average age of controls (healthy individuals) was 57.04 ± 7.61. Gender distribution was 74% male and 26% female in the case group and 69% male and 31% female in the control group. As diabetes-specific parameters, fasting and postprandial blood glucose and serum HbA1c showed significant differences (p = <0.0001).
Base Line Characteristics and Diabetes-Specific Parameter Among Type 2 Diabetes Mellitus Patients and Control Group
Lipid profile comparison among the T2DM patients and healthy controls
Among the T2DM cases and healthy controls, biochemical parameters, such as lipid profile, were compared and significant differences (p ≤ 0.001).
It was observed that HDL, LDL, TG, cholesterol, and VLDL parameters had 36.80 mg/dL, 163.0 mg/dL, 231.1 mg/dL, 239.1 mg/dL, and 32.61 mg/dL among the T2DM patients. In comparison, the healthy control had 56.14 mg/dL, 98.35 mg/dL, 124.7 mg/dL, 161.9 mg/dL, and 25.27 mg/dL, and the differences among them were found to be significant (p < 0.0001, Table 2), respectively.
Biochemical Parameters’ Comparison Among the Type 2 Diabetes Mellitus Patients and Healthy Controls
HDL, high-density lipoprotein; LDL, low-density lipoprotein; TG, triglyceride; VLDL, very-low-density lipoprotein.
NQO1 (rs1800566, C609T) genotypes and allele frequency among T2DM patients and healthy controls
The genotypic difference between the case and control is seen in Table 3 and found to be highly significant (p = 0.04). Homozygous CC wild-type genotype was 52 (52%), and heterozygous CT genotype was 43 (43%). Homozygous TT mutant-type genotype was 5 (5%) in case group (T2DM), whereas homozygous CC wild-type genotype was 69 (69%), heterozygous CT genotype was 29 (29%), and homozygous TT mutant type genotype was 2 (2%). %). The allelic frequency of the T allele was higher in the case group (0.26) than in the control group (0.16).
Genotype Distribution and Allele Frequencies of NQO1 Gene Among Type 2 Diabetes Mellitus Patients and Controls
Odds ratio, relative risk, and NQO1 genotypes
The NQO1 polymorphism (rs1800566, C609T) and its association with the degree of genotype between both case and control groups were evaluated with an odds ratio with a 95% confidence interval. We observed significant differences in genotype distribution. In a comparison of the wild-type homozygous CC genotype with the homozygous TT mutant type, the odds ratio was 3.31 (0.61–17.77), and for the CT heterozygous mutant-type genotype, the odds ratio was 1.96 (1.08–3.55), which indicates NQO1 polymorphism plays an important role as dominant in T2DM patients (Table 4).
Calculation of Odds Ratio with Respect to NQO1 CC, CT, and TT Genotypes
Relative risk was also calculated with reference to NQO1 CC homozygous wild-type genotype for heterozygous CT and mutant TT genotype (Table 5). The relative risk for CT heterozygous genotype was 1.41 (1.02–1.95), and for mutant TT genotype, it was 1.99 (0.61–6.50).
Calculation of Relative Risk with Respect to NQO1 CC, CT, and TT Genotypes
NQO1 (rs1800566, C609T) genotypes and biochemical parameters among the T2DM patients
We tried to compare the biochemical parameters (blood sugar fasting, blood sugar postprandial, HbA1c, HDL, LDL, TG, cholesterol, VLDL) with NQO1 genotypes (Table 6). We observed that the HbA1c level with NQO1 genotypes such as homozygous wild-type CC, heterozygous CT, and homozygous mutant TT showed 8.8%, 8.8%, and 10.5%, respectively (p = 0.04).
Comparison of Biochemical Parameters (Blood Glucose and Lipid Parameters) with Respect to NQO1 Genotypes
HDL, high-density lipoprotein; LDL, low-density lipoprotein; TG, triglyceride; VLDL, very low-density lipoprotein.
It was also observed that the HDL level concerning NQO1 CC, CT, and TT genotypes was 37.13 mg/dL, 33.88 mg/dL, and 28.2 mg/dL, and differences among them were observed to be significant (p = 0.002). In the same way, concerning NQO1 CC genotypes, the TG cholesterol levels were 217.4 mg/dL and 224.2 mg/dL, and NQO1 CT genotype had 257.2 mg/dL and 241.1 mg/dL. The NQO1 TT genotype had 301.6 mg/dL and 240.0 mg/dL, respectively, with significant differences (p < 0.0001, p = 0.003).
NQO1 gene hypermethylation and mRNA expression
NQO1 gene hypermethylation status was investigated by MS-PCR, and it observed that 34% of patients had NQO1 gene hypermethylation, and 66% of patients showed no hypermethylation (Fig. 1). NQO1 gene expression was analyzed concerning hypermethylation status, and it was observed that the patients with NQO1 gene hypermethylation had 0.22-fold expression. In contrast, the nonhypermethylated participant has 0.91-fold NQO1 mRNA expression (p < 0.0001).

Association of NQO1 mRNA expression with respect to gene hypermethylation status.
NQO1 gene hypermethylation and biochemical parameters
We compared the biochemical parameters with the hypermethylation status of the NQO1 gene (Fig. 2). Statistically significant differences were observed in HDL and TG levels. The T2DM patients having NQO1 gene hypermethylation had lower HDL levels (33.35 ± 5.75) compared with its contrast (36.29 ± 5.22) (p = 0.03), as well as patients having NQO1 gene hypermethylation had higher TG (262.2 ± 59.26) compared with nonhypermethylated patients (226.7 ± 83.12) (p = 0.001).
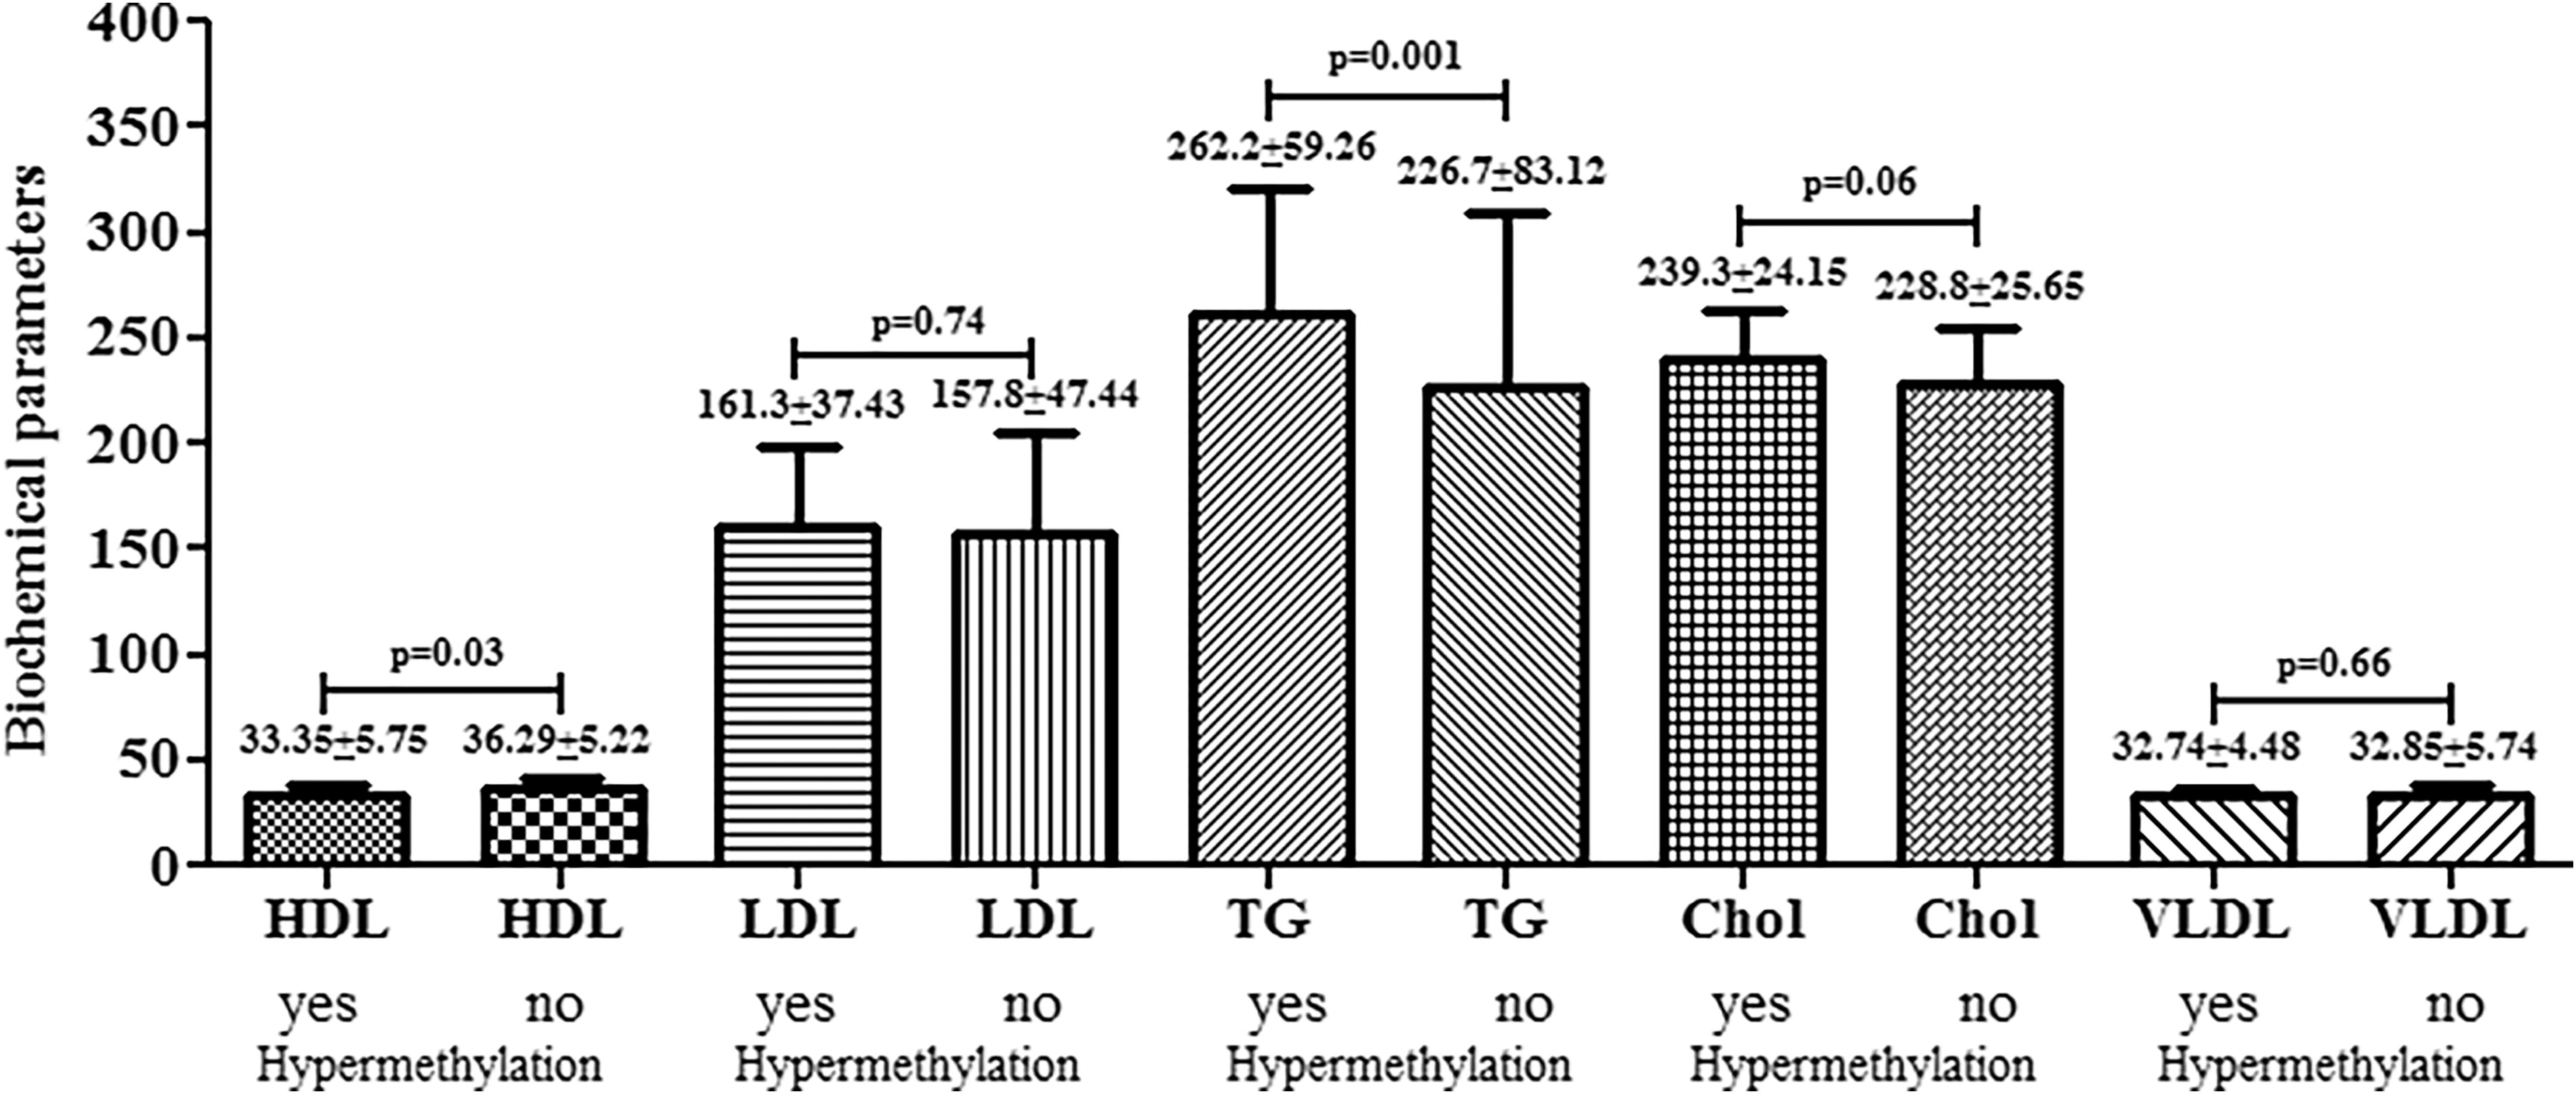
Comparison of biochemical parameters with respect to NQO1 hypermethylation status.
NQO1 (rs1800566, C609T) genotypes, vitamin-D, and mRNA expression
We compared the NQO1 mRNA expression concerning NQO1 genotypes (CC, CT, and TT genotypes) and observed a significant difference in expression among the T2DM patients (Fig. 3a). We observed that significantly decreased expression of NQO1 mRNA was observed with heterozygous CT (p < 0.0001) and homozygous mutant TT genotype (p = 0.0004) compared with homozygous wild-type CC genotype. NQO1 mRNA expression level was also compared with vitamin D levels among the T2DM patients (Fig. 3b). T2DM patients with vitamin D deficiency had 0.67-fold NQO1 mRNA expression, whereas vitamin D insufficient and sufficient T2DM cases had 0.67-fold and 0.71-fold NQO1 mRNA expression. Vitamin D level was also compared with NQO1 genotypes (CC, CT, and TT), and it was observed that the CC genotype had higher (24.26 ng/mL) vitamin D level compared with CT (p = 0.03) and TT genotypes (p = 0.11, Fig. 3c).

Comparison of NQO1 mRNA expression
Discussion
NQO1 enzyme metabolizes several endogenous quinones. The polymorphism in NQO1 (C609T) exchanges position of 187 proline with serine and inactive enzyme. 19 The genomic location of the NQO1 gene is 16q22.1; moreover, nonsynonymous single nucleotide polymorphism has been detected in 609 nucleotide positions on exon 6 of cDNA (rs1800566) of NQO1. 20 The C609T polymorphism (C/T transition) in NQO1 changes a protein’s codon number 187 c for proline to serine amino acid. This polymorphism downregulates the enzyme activity and causes proteasomal degradation and polyubiquitination of the mutant protein. Some recent studies suggest the association of polymorphism of NQO1 with certain diseases related to oxidative stress, such as cancer, diabetes, and Alzheimer’s. The study observed an association of NQO1 polymorphism (C609T) among type II diabetic patients. A significant difference was observed in agreement with the study reported by Ketema EB. et al. 21 It has been revealed that the diabetes-related mortality risk increases with high HbA1c levels and suggested that high HbA1c levels increase the diabetic macrovascular and microvascular aggravation risk. 22 Several studies documented that type II diabetic patients’ liver enzymes and renal function tests were altered, and similar observations for biochemical lipid profiles were found between cases and the control group with significant differences (p=<0.001). Abnormal kidney function test was observed in T2DM patients, 23 and other findings reported that raised ALT enzyme activity was found in type II diabetic patients. 24
In type II diabetic patients, the polymorphism of the NQO1 gene is highly susceptible and plays a vital role in risk management. In Tables 4 and 5, we represented the distribution of the genotype of NQO1 and found that the case group had a higher incidence of mutant allele. The NQO1 TT mutant genotype and CT heterozygous genotype were also associated with an increased risk of T2DM independently. NQO1 mutant CT heterozygous, TT homozygous mutant type increases the risk of T2DM with odd ratios of 3.31, 1.96, and 2.05, respectively. A similar consistent finding was observed that NQO1 polymorphism is responsible for the development of diabetic nephropathy. 25 In another study, NQO1 variants might be significantly involved in developing T2DM and the risk of coronary artery disease. 26 Similarly, Han SJ et al. suggested that in type II diabetic patients, the NQO1 C609T polymorphism has a role in the development of atherosclerosis. 27 It has been found that rapid polyubiquitination breakdown severely abridged the stability, FAD binding ability, and half-life of the mutant genotype of NQO1 TT-based protein. 28 Furthermore, the complete absence of functional protein was observed in cases where NQO1 is homozygous for the mutant allele (T). In contrast, the reduced function of the NQO1 protein was observed with the heterozygous NQO1 CT genotype. 29 In diabetes, insulin sensitivity and disease progression are influenced by oxidative and proinflammatory processes, and NQO1 is associated with preventing diabetes and metabolic syndrome. 30,31 It has been revealed that the TT genotype of the NQO1 gene is linked with metabolic disorders, mainly with type 2 diabetes. 26 According to Gaikwad et al. NQO1 gene alteration was observed in T2DM in mice experiments and could be linked with the progression of the disease as insulin resistance. 32 It has also been observed that the NQO1 genotype, mainly TT, is connected with atherosclerotic carotid plaques other than CC and CT genotypes in type 2 diabetic patients. 33 NQO1 also significantly controls cardiovascular diseases, lipid alteration, plaque formation, prediabetes, and metabolic syndrome. 34 Qiu D et al. in 2022 suggested a protective role of NQO1 against oxidative stress and apoptosis in diabetic nephropathy; decreased NQO1 may lead to reduced levels of intracellular NAD+/NADH levels, leading to worseness of disease and concluded overexpression of NQO1 may improve the oxidative stress. 35 Wu PY et al. in 2022 revealed that heart failure in diabetic patients may result from oxidative stress, which can be overcome by improving the NQO1 activity. 36 T2DM patients with NQO1 downregulation have been observed to lead to oxidative damage and improper corneal endothelial cell activity. 37 Ross D et al. in 2021 suggested that altered regulation of NQO1 leads to improper glucose and insulin metabolism, which could lead to diabetes and other metabolic disorders. 38 Through its function as a superoxide scavenger, NQO1 directly contributes to protection against oxidative stress. 39 An increased risk of metabolic syndrome-related problems has been linked to a null polymorphism in NQO1 40,41 and genetic alteration in NQO1 observed to be linked with oxidative stress-related diseases, including, diabetes, and Alzheimer’s disease. 42 It has been shown that pharmacological activation of NADH oxidation through NQO1-mediated catalysis can improve both obesity and diabetes, 43 demonstrating that NQO1 overexpression may be a practical therapeutic approach for treating metabolic syndrome in mice, as well as hypertension and hyperlipidemia. 44 We have observed that 34% of cases had hypermethylation, which could cause gene silencing. It was also observed that the hypermethylated cases had reduced expression of NQO1 mRNA among the cases. We also compared the biochemical parameters with gene hypermethylation status and observed that NQO1 hypermethylation is linked with lower HDL and TG levels among T2DM patients. Decreased NQO1 mRNA expression was associated with gene hypermethylation among the T2DM patients, and reduced vitamin D level was also observed in CT heterozygous and TT mutant genotypes of the NQO1 gene among the patients as well as decreased NQO1 mRNA expression.
NQO1 functions in cellular stress, superoxide reductase activity, interactions with proteins to prevent proteasomal degradation, and putative roles in controlling glucose and insulin metabolism relevant to diabetes and the metabolic syndrome. 38 In a research study conducted in 2020 by Di Francesco A. et al., it was discovered that NQO1 has a protective role against adipose tissues from mice fed a high-fat diet developed hepatic steatosis, and their metabolic signatures indicated enhanced glucose and lipid metabolism. 45
Conclusion
Our results concluded that the polymorphism of NQO1 (rs1800566, C609T) plays a significant role in developing the risk of type 2 diabetes, and decreased expression could be involved in disease worsening. Most importantly, reduced NQO1 expression was observed, possibly due to hypermethylation and linked with low vitamin D, lower HDL, and higher TG levels among T2DM patients. However, our study had fewer participants. Therefore, more samples should be included to explore the role of the NQO1 gene and vitamin D levels among diabetic patients.
Limitations of the study
The low sample size and confounding factors were not controlled, as other lifestyle factors can influence vitamin D and other lipid parameters.
Footnotes
Acknowledgment
The authors gratefully acknowledge the study subjects who were a part of this study.
Authors’ Contributions
Conceptualization: J.H.A., M.M.A.B., M.I.K., and D.P. Data curation: M.I.K., J.H.A., F.A., A.A.A., and B.J.A. Formal Analysis: M.M.A.B., B.J.A., D.P. Funding acquisition: J.H.A., B.J.A., F.A., A.A.A., F.K., M.I.K., and M.M.A.B. Investigation: J.H.A., B.J.A., and F.A. Methodology: J.H.A., M.M.A.B., F.A., and M.I.K. Project administration: J.H.A., F.A., and M.I.K. Resources: J.H.A., F.K., and D.P. Software: M.M.A.B., F.K., F.A., A.A.A., and D.P. Supervision: M.M.A.B., J.H.A., F.A., and M.I.K. Validation: J.H.A., F.A., A.A.A., and F.K.. Visualization: M.M.A.B. and D.P. Writing—original draft: M.M.A.B., D.P., M.I.K., and J.H.A. Writing—review and editing: J.H.A., D.P., F.A., A.A.A., F.K., B.J.A., M.I.K., and M.M.A.B.
Data Availability
The corresponding author can provide the datasets used and analyzed during this study.
Data and Material Availability Statement
We confirm that the research data will not be shared in any public sphere or platform. The datasets can be obtained from the corresponding author upon reasonable request.
Author Disclosure Statement
No competing financial interests exist.
Funding Information
The authors appreciate the Deanship of Scientific Research and the researchers supporting Project number RSPD2024R1013 at the King Saud University, Riyadh, Saudi Arabia.