




Abstract
Frailty, a multifaceted syndrome, affects approximately 26% of older adults globally, yet there are limited data on the prevalence and longitudinal impact of frailty subtypes. Therefore, in this study, we aim to determine the prevalence of physical, psychological, and cognitive frailty, transitions between subtypes, and associated health determinants among Malaysian community-dwelling older adults. This study is part of the longitudinal aging study in Malaysia (LRGS Ageless and TUA). We assessed 815 older adults in 2014, with successful follow-up of 402 participants (mean age: 67.08 ± 5.38 years) after 5 years. Frailty subtypes were assessed at baseline, and transitions were evaluated at the 5-year mark. At baseline, the prevalence of older adults categorized as robust, physical frailty, cognitive frailty, and psychological frailty was 26.7%, 36.3%, 12.1%, and 16.7%, respectively, with 8.1% exhibiting concurrent psychological and cognitive frailty. Follow-up results showed that 22.9% remained robust, 46.8% experienced no change, 24.9% deteriorated (adversed), and 5.5% improved (reversed). Logistic regression analysis identified living alone (p < 0.001), increased body fat percentage (p < 0.05), increased waist circumference (p < 0.05), reduced fat-free mass (p < 0.05), decreased lower limb flexibility (p < 0.05), and declined cardiorespiratory fitness (p < 0.05) as significant predictors of frailty deterioration. Higher Mini Mental State Examination (MMSE) scores and improved Timed Up and Go and Chair Stand test results (p < 0.05) were significantly associated with the reversal of frailty subtypes (p < 0.05). Younger older adults (p < 0.001), males (p < 0.05), those with lower WHO Disability Scale scores (p < 0.05), and higher MMSE scores (p < 0.05) were significantly less likely to develop frailty subtypes. Intervention strategies that focus on combined physical, cognitive, and psychosocial functions are crucial for both reversing and preventing the progression of frailty subtypes in older adults.
Introduction
Aging is associated with a gradual decline in physiological systems, exacerbated by factors such as physical inactivity, psychological distress, and cognitive impairment. 1 Frailty, a diverse biological syndrome characterized by reduced reserves and resistance to stressors, often leads to detrimental effects on physical, social, psychological, and cognitive aspects in older individuals, resulting in a progressive decline in functionality. 2 –4 Consequently, older adults with frailty experience limitations in performing daily tasks and a declined quality of life. 5 Moreover, frailty imposes a significant financial burden, accounting for 40% to 76% of total care costs, making it a costly syndrome. 6
Two subtypes of frailty, physical and cognitive frailty (CF), have received extensive attention in the literature. 7 In Malaysia, approximately 15.9% of older adults have been identified as physically frail, while CF refers to the simultaneous presence of physical frailty and cognitive impairment, with an incidence rate of 7.1 per 100 person-years. 8,9 Advancing age, malnutrition, reduced functional mobility, and depression contribute significantly to the development of physical frailty and CF. 9 Although depression is commonly considered an outcome of frailty, recent studies have classified the simultaneous presence of depression and physical frailty as a distinct subtype known as psychological frailty, with a prevalence of around 3.5%. 10 However, factors contributing to this condition remain uncertain. 10
Zhang et al. (2020) proposed the emergence of frailty subtypes, including physical frailty, psychological frailty, cognitive frailty, and physiological frailty, based on a model of multicomponent deficit accumulation, offering insights into mechanisms and intervention strategies tailored to specific subtypes. 11 Approximately 6% of older adults with cognitive frailty and 25% of older adults with physical prefrailty were observed to revert to an improved state, indicating the dynamic nature of frailty status over time. 8,9 However, comprehensive information on factors influencing transitions among frailty subtypes, particularly psychological frailty, is lacking.
In this study, we aim to investigate the prevalence of frailty subtypes (physical, psychological, and cognitive), their transitions over time, and associated factors in a longitudinal manner.
Methods
Study design and participants
This study was conducted as part of the Transforming Cognitive Frailty to Later Life Self-Sufficiency (AGELESS STUDY) and Longitudinal Study on Neuroprotective Model for Healthy Longevity (LRGS TUA) and involved a 5-year follow-up period. The study received approval from the Medical Research and Ethics Committee of the Universiti Kebangsaan Malaysia (UKM PPI/111/8/JEP-2020–347 and UKM1.21.3/244/NN-2018–145). The initial sample consisted of 815 community-dwelling older adults who were recruited in 2014 from Malaysia’s northern and central areas using a multistage random sampling approach. 12 After 5 years, a total of 402 participants (49.3%) were successfully followed up, while others declined participation, could not be contacted, or had passed away. Before data collection, informed and written consents were obtained from all participants.
The study included participants who were 60 years of age and older and possessed independent mobility, with or without the use of aids. Individuals with known neurological or major psychiatric illnesses were excluded from the study.
Sociodemographic and health information
Face-to-face interviews were used to administer a structured questionnaire to gather sociodemographic and clinical data. Age, living situation (alone or with spouse/family), household income, and educational attainment were some of the sociodemographic details collected. Clinical data encompassed self-reported diseases diagnosed by physicians, multimorbidity (presence of more than 1 disease), history of falls in the past 1 year, sleep problems, life satisfaction, and activity of daily living.
Body composition
Anthropometric measurements were taken following a standardized protocol. 13 These measurements included the circumference of midupper arm, hip, waist, calf, and arm span. To determine the participants’ body mass index (BMI, kg/m2), height and weight were also recorded. In addition, using the Inbody S10F device and bioelectrical impedance analysis (BIA), body composition analysis was carried out.
Physical fitness and functional assessment
The Senior Fitness Test (SFT) 14 was administered to assess physical fitness in the participants. This test included the back-scratch test to evaluate upper body flexibility, the sit and reach test to measure lower body flexibility, the 2-minute walk test to assess aerobic endurance, and the 30-second sit-to-stand test to measure lower body strength. The timed up and go (TUG) test was also conducted to assess balance and functional mobility.
Functional limitations were evaluated using the Instrumental Activities of Daily Living scale, where a lower score indicates a greater limitation in performing activities of daily living. 15 In addition, the World Health Organization Disability Assessment Schedule (WHODAS) was used to identify the loss of function experienced by the participants. 16
Cognitive assessment
To evaluate global cognition, the Malay-Mini Mental State Examination (MMSE) was utilized, with a cutoff score of ≥19 indicating normal cognitive function in the Malaysian population. 17 Attention, working memory, and processing speed were assessed using the digit span test (forward and backward) and the digit symbol test. 18 Working and visual memory were evaluated using a component from the Wechsler Memory Scale-Revised called Visual Reproduction. 19 The total score for each assessment tool was determined by the participants’ correct responses.
Frailty assessment
The frailty subtypes examined were physical frailty, psychological frailty, and cognitive frailty. The categorizations of frailty subtypes are as tabulated in Table 1. Physical frailty was based on Fried’s operational frailty phenotype, 7 which includes the following criteria:
Categorization of Frailty Subtypes
Shrinking (self-reported weight loss of at least 5 kg in the last 1 year)
Muscular weakness (handgrip strength score is less than the cutoff points)
Exhaustion [assessed through self-reported exhaustion, based on two items from the Centre for Epidemiologic Studies Depression Scale: ‘I felt that everything I did was an effort’ and ‘I could not get going.’]
Physical inactivity (assessed with Physical Activity Scale for the Elderly)
Reduced walking speed (measured through 5-meter gait speed test)
Those who fulfilled 1–2 criteria were grouped as prefrail and more than 3 criteria were categorized as frail.
The coexistence of physical frailty and depressive symptoms was defined as psychological frailty. In this study, depressive symptoms were assessed using the Malay version of the Geriatric Depression Scale (GDS-14). Individuals who exhibited depressive symptoms, as indicated by a GDS score greater than 4, and also had physical frailty were classified as having psychological frailty. 10,20
Older adults presented with physical frailty with concurrent mild cognitive impairment (MCI) was categorized as cognitive frailty. To assess mild cognitive impairment (MCI), the Malay version of the Montreal Cognitive Assessment (MoCA) was employed, with a cutoff score of ≤24 indicating the presence of MCI. 21 Participants with physical frailty, depressive symptoms and MCI were classified as having psychological + cognitive frailty.
Frailty transition
The transition of frailty subtypes was determined by examining changes in frailty status from baseline to the 5th year follow-up. Participants were grouped based on the change in their frailty subtype over this period. The diagram below shows the classification of frailty subtype transition (Fig. 1).
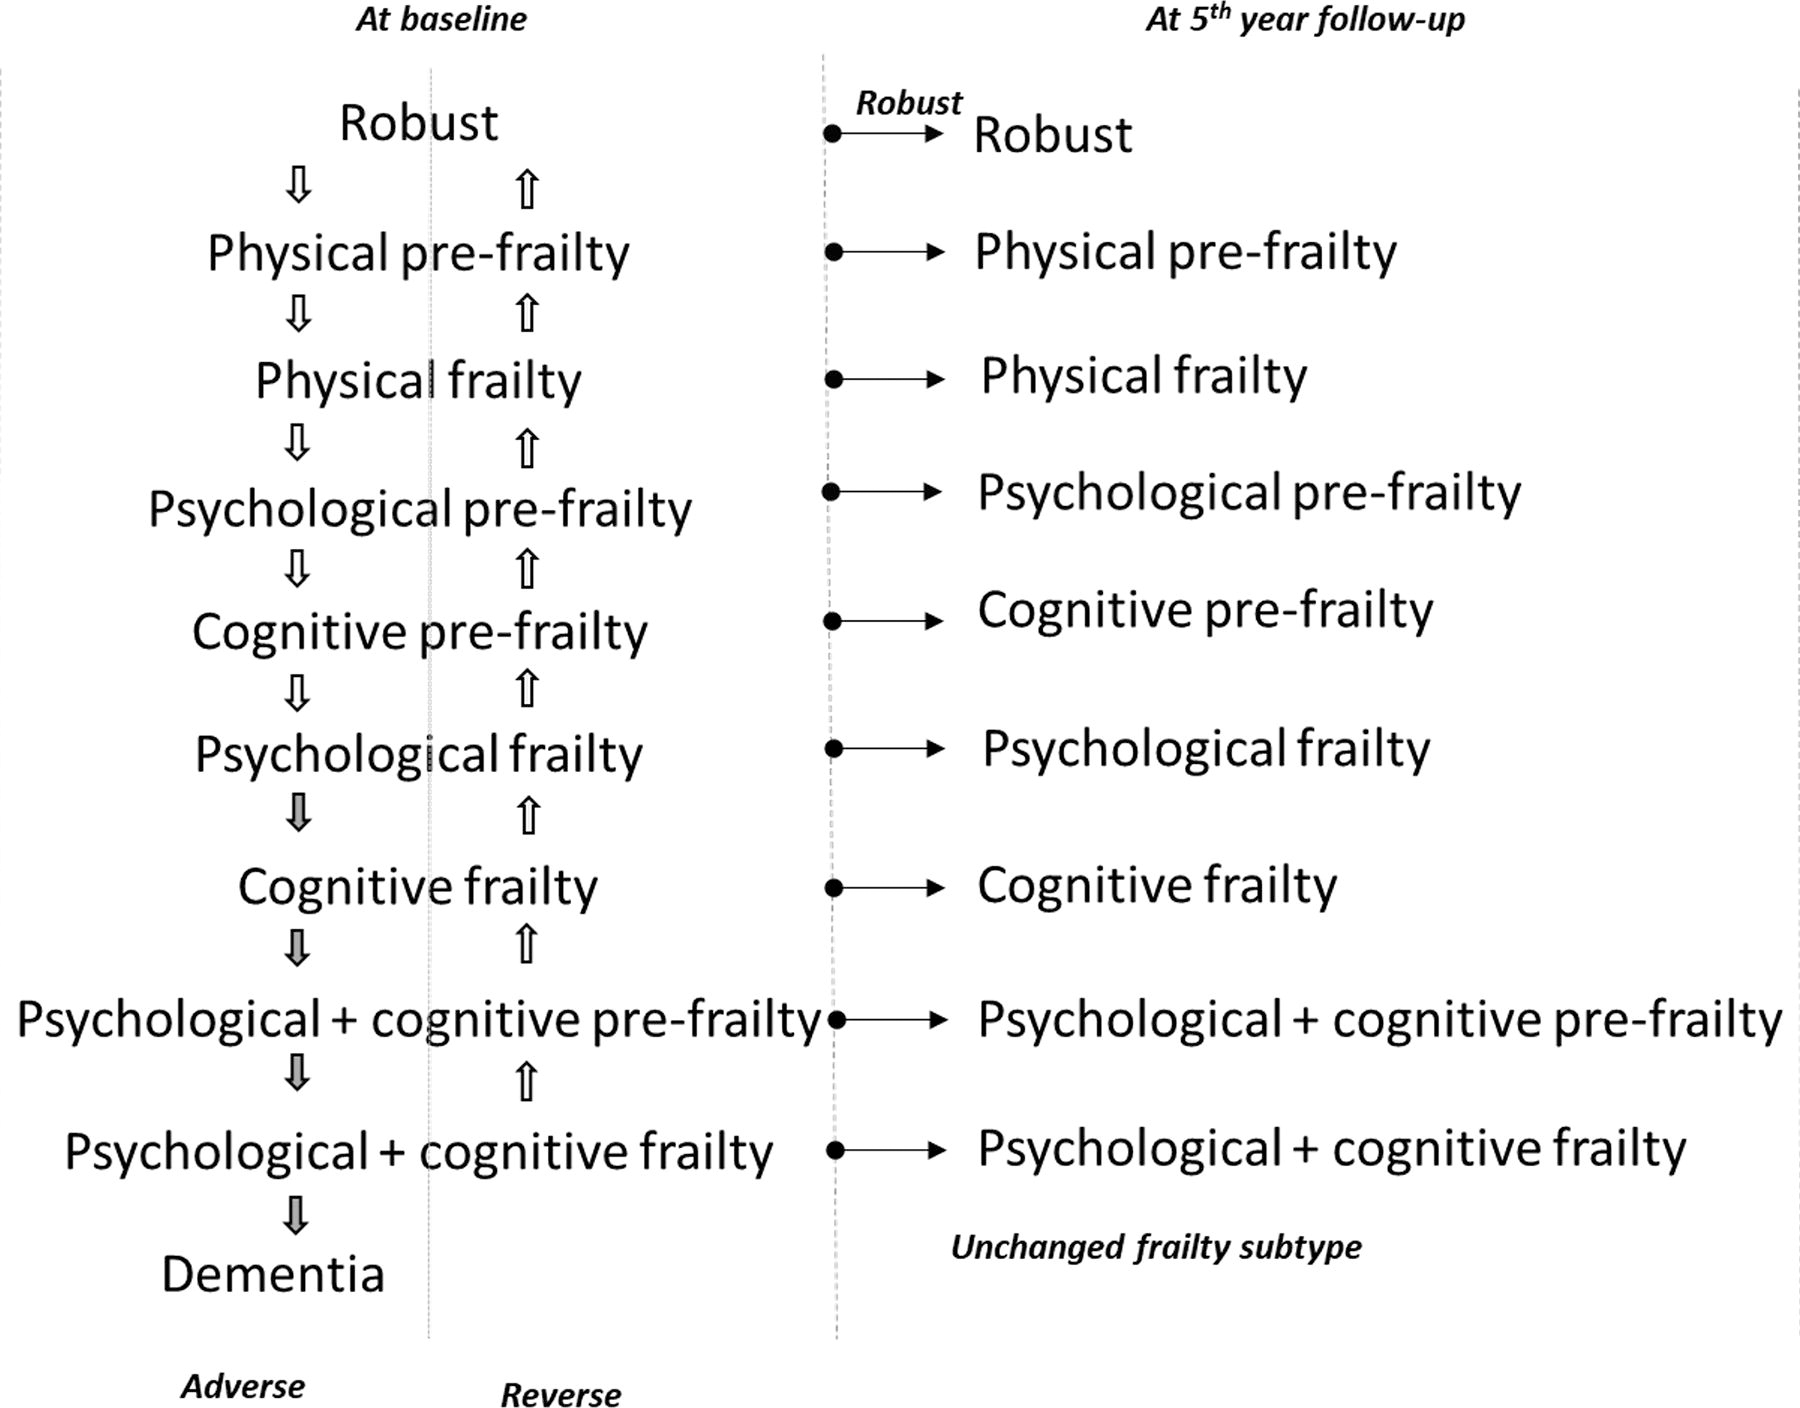
Frailty subtypes transition from baseline to 5th year follow-up.
Statistical analysis
Descriptive and frequency analyses were used to report the prevalence of frailty subtypes at baseline for a total of 815 participants. Profile differences between groups: robust, no change in frailty subtype, and adverse and reverse were executed with One-Way Analysis of Variance (ANOVA) for continuous variables and Chi-Square test (χ 2 ) for categorical variables after excluding dropouts (n = 402). The level of significance was set at p < 0.05 and results were reported as n (%) and mean ± standard deviation.
A binary logistic regression analysis was conducted to identify the associated determinants of frailty transition. The three regression models computed were as follows: Determinants associated with remaining robust over the 5-year period, with the nonrobust group serving as the reference category. Determinants associated with deterioration in frailty subtype, with the reference categories being the ‘unchanged frailty status’ and ‘reverse’ groups. The robust group was excluded from this analysis. Determinants associated with improvements in frailty subtype, with the reference categories being the ‘unchanged frailty status’ and ‘adverse’ groups. The robust group was excluded from this analysis.
To control for confounding factors, significant baseline variables that showed significant differences between the groups were included in the regression models. Mean imputations were utilized to replace missing data for 10% of the total sample with incomplete data. The statistical analysis was performed using IBM Statistical Package for the Social Sciences (IBM SPSS), Version 23.0.
Results
At baseline, 268 (32.9%) older adults were identified with physical prefrailty, which marked the highest prevalence, followed by robust (26.8%) and cognitive prefrailty (12.5%), as tabulated in Table 2. Psychological + cognitive frailty had the smallest number, n = 6 (0.7%). When stratified by gender, physical prefrailty was dominated by male participants (56.0%), whereas robust group had equal distribution among both sex (50%).
Prevalence of Physical, Psychological, and Cognitive Frailty
The highest frequency of participants showed no change in frailty subtype after 5 years, comprising 188 individuals (46.8%). Meanwhile, 100 participants (24.9%) experienced deterioration (adversed), 92 (22.9%) remained robust, and a minority of 22 (5.5%) reversed their subtype. The breakdown of the transition after 5 years is detailed in Table 3. The highest trend of deterioration was observed among those with cognitive prefrailty, with 28% regressing to cognitive frailty, 34% to psychological + cognitive prefrailty, and 14% developing dementia after 5 years (MOCA ≤17). Regarding the reversal of frailty subtype, 15.4% of those with psychological prefrailty at baseline progressed to physical prefrailty, 21.9% with cognitive frailty reverted to cognitive prefrailty, and 10.0% with psychological + cognitive prefrailty reversed to psychological prefrailty.
Breakdown of Transition of Frailty Status at 5th Year Follow-up
A comparison of baseline sociodemographic profiles between the ‘robust,’ ‘unchanged frailty subtype,’ ‘reversed,’ and ‘adversed’ groups revealed significant differences in age, years of education, and living status (p < 0.05). The robust group had the lowest mean age (65.1 ± 3.9 years) and the highest level of education (7.9 ± 3.6 years), with the majority living with someone (92.4%), in comparison to the other groups (Table 4).
Baseline Characteristics of Participants Stratified by Frailty Transition Status
One-way analysis of variance (ANOVA).
Chi-square test (χ2).
IADL, Instrumental Activities of Daily Living; M-MMSE, Malay-Mini Mental State Examination; PASE, Physical Activity Scale for the Elderly.
Physical fitness tests varied significantly across groups (p < 0.05), with the robust group exhibiting the highest mean values for handgrip strength (28.4 ± 7.1), chair stand test (11.7 ± 3.0), and back-scratch test (14.1 ± 11.9), as well as the lowest TUG scores (8.9 ± 1.9). Participants who experienced a reversal in frailty subtype engaged in more physical activity (with a mean Physical Acitivity Scale for the Elderly (PASE) score of 141.9 ± 43.6) and demonstrated greater lower limb flexibility (mean chair sit and reach measurement of 1.4 ± 13.3) compared to others.
All cognitive assessments showed significant differences between groups, with the mean scores of Malay-Mini Mental State Examination (M-MMSE), digit span, digit symbol, and visual reproduction in the ‘adversed’ group being lower compared to the remaining three groups. However, there were mean differences in anthropometric measurements, body composition, and functional assessments between groups, but these differences were not significant (p > 0.05).
The Binary Logistic Regression model indicated that being male (odds ratio [OR] = 4.45, 95% confidence interval [95% CI]: 1.21–10.04, p < 0.05), younger age (OR = 0.84, 95% CI: 0.77–0.92, p < 0.001), lower disability score assessed using WHODAS (OR = 0.88, 95% CI: 0.79–0.98, p < 0.05), and higher cognitive function as evaluated using M-MMSE (OR = 1.15, 95% CI: 1.01–1.32, p < 0.05) were found to be associated with the robust group who remained robust and did not develop any type of frailty in the following 5 years (Table 5).
Crude Odds Ratios (OR) and 95% Confidence Intervals (95% CI) of Potential Determinants for Prevention of Frailty, Frailty Deterioration, and Frailty Reversal after 5 Years of Follow-up
OR (95% CI) adjusted for age, years of education, living status, handgrip, chair stand test, timed up and go test, back-scratch test, chair sit and reach test, PASE score, digit span, digit symbol, MMSE, and visual reproduction II.
MMSE, Mini Mental State Examination; WHODAS, the World Health Organization Disability Assessment Schedule.
In contrast, living alone (OR = 4.80, 95% CI: 2.65–8.70, p < 0.001), increased percentage of body fat (OR = 1.16, 95% CI: 1.03–1.31, p < 0.05), increased waist circumference (OR = 1.09, 95% CI: 1.01–1.17, p < 0.05), reduced fat-free mass (OR = 0.91, 95% CI: 0.83–0.99, p < 0.05), reduced lower limb flexibility (OR = 0.97, 95% CI: 0.95–0.99, p < 0.05), and lower endurance (OR = 0.96, 95% CI: 0.94–0.99, p < 0.05) were significantly associated with deterioration (adversed) in frailty subtype among older adults.
Higher cognitive function (OR = 1.20, 95% CI: 0.98–1.45, p < 0.05), higher functional mobility (OR = 1.91, 95% CI: 1.18–3.06, p < 0.05), and higher lower limb muscle strength (OR = 1.67, 95% CI: 1.04–2.27, p < 0.05) as measured using TUG and chair stand tests, respectively, were significantly associated with the reversal of frailty subtype.
Discussion
To the best of our knowledge, this study is one of the first to investigate the prevalence and longitudinal effects on the transition of physical, psychological, and cognitive frailty, as well as the determinants contributing to these transitions.
In our study, the prevalence of physical prefrailty and physical frailty was found to be 24.87% and 5.5%, respectively. These figures fall within the range reported in a recent systematic review, which indicated that the prevalence of frailty based on Fried’s operationalized definition ranges from 3.9% to 26% across low-income and middle-income countries. 22 Specifically, in Malaysia, previous research has reported that approximately 8.9% of older adults have physical frailty, and 61.7% are classified as prefrail. 23 Our findings contribute to the existing literature by providing updated prevalence rates for physical prefrailty and physical frailty in our specific study population. A systematic review reported a co-occurrence rate of around 4% to 16% for both physical frailty and depression, which aligns with the findings of this study. 24 In addition, The National Center for Geriatric and Gerontology-Study of Geriatric Syndromes (NCGG-SGS) reported that an average of 3.5% of older adults presented with psychological frailty. 10 Notably, the aforementioned study excluded physical prefrailty in the classification.
The global pooled prevalence of cognitive frailty ranged from 11% to 16%. 25 Similarly, when combining the cognitive frailty and cognitive prefrailty groups in our study, we observed a prevalence of 16.8%. Previous analyses of data from the LRGS-TUA cohort reported a prevalence of 2.2% for cognitive frailty and 37.4% for cognitive prefrailty. 26 The slight discrepancy in prevalence could be attributed to the different assessment tools used to evaluate mild cognitive impairment (MCI). In addition, the former study focused solely on cognitive frailty and excluded older adults presenting with depressive symptoms. In contrast, in this study, we aimed to examine different subtypes of frailty that may coexist with cognitive frailty, including those with depressive symptoms.
Late-life depression (LLD) is commonly associated with cognitive frailty, characterized by the simultaneous decline of psychological and cognitive function in older adults. 24 The coexistence of depression and cognitive dysfunction is reported in approximately 25% of older adults. 27 However, there is limited evidence on the possible co-occurrence of psychological and cognitive frailty. In our study, we found that an average of 8.1% of participants had both psychological and cognitive frailty. Deficits in cognitive domains such as executive functioning, visuospatial reasoning, processing speed, and memory have been associated with LLD. 27,28 Depression can lead to reduced brain reserve, possibly caused by hippocampal atrophy and widespread ischemia. 28 These physiological changes can affect cognitive functioning among older adults with depression. 26
Traditionally, the reversal of physical frailty and cognitive frailty has been studied as an outcome measure after interventions. Multidomain interventions, including physical exercise, nutritional counseling, and cognitive training, have shown significant effects in reversing physical frailty and cognitive frailty. 29 We observed a reversal rate of frailty subtypes among older adults without the administration of interventions, indicating change over time with usual care in our study. We found that increased global cognition (assessed using MMSE), improved functional mobility (assessed using TUG), and greater lower limb strength (assessed using the chair stand test) were significantly associated with the progressive transition of frailty subtypes. These findings suggest that improvements in cognitive function, functional mobility, and physical strength may contribute to the reversal or improvement of frailty among older adults.
Functional mobility correlates with cognitive impairment, cognitive frailty, and dementia, in which the risk of cognitive frailty increases with a one-unit increase in TUG. 9 Moreover, the physical domain is considered in all frailty subtypes. Therefore, positive changes at the musculoskeletal level have the ability to improve physical frailty phenotypes and eventually delay or reverse frailty subtypes. 30 In general, deficits in cognitive domains are related to deterioration in physical function such as strength and mobility, which affect the independence and well-being of older adults. 3 It is noteworthy that our study’s participants who exhibited a reversal in frailty subtype engaged in a higher level of physical activity (based on the PASE score reported during baseline). This may have contributed to the improved physical and cognitive functions that mediated improvements in frailty criteria. These findings highlight the potential advantages of engaging in physical activity for enhancing both physical and cognitive abilities and potentially reversing frailty subtypes without any specific intervention.
Approximately 25% of older adults experienced a deterioration (adverse) in frailty status after 5 years, and those who lived alone and had an increased percentage of body fat and waist circumference, reduced fat-free mass, reduced flexibility, and low cardiorespiratory endurance were at higher risk of undergoing regressive frailty-related changes. Older adults living alone are more vulnerable to physical, cognitive, and psychosocial adverse effects on health, causing this group to have a higher risk of developing physical, psychological, and cognitive frailty. 31 Consistent with our findings, older adults living alone were found to be vulnerable to negative health outcomes. 32 Loneliness and being socially disengaged could possibly lead to deficits in cognitive function and psychosocial well-being. 32
Although the average BMI of this group of participants was ‘healthy,’ detailed anthropometric measurements of waist circumference and body fat were significantly associated with the deterioration of frailty status. This finding is consistent with previous research, which has shown that larger waist circumference and body fat mass in older adults increase the risk of frailty. 33 Moreover, a larger waist circumference is associated with increased body fat, adverse health outcomes, and increased mortality across all BMI categories. 34 Excess abdominal fat, particularly visceral adipose tissue, has been linked to various metabolic and inflammatory processes that have detrimental effects on physical function. 35,36
Decreased muscle flexibility may affect optimal activities of daily living among older adults, although its effects on frailty are limited. 37 Our findings indicate that reduced cardiorespiratory fitness is related to the deterioration of frailty subtypes. Notably, cardiorespiratory fitness has been reported as an independent predictor of mortality among older adults. 38 However, the association between impaired cardiorespiratory endurance and frailty is inconsistent, which could be due to differences in the assessment of cardiorespiratory endurance. 39
In our study, approximately 23% of older adults remained robust or ‘relatively healthy’ throughout the 5 years. Factors such as being male, younger in age, having a lower disability score, and higher cognitive function were associated with a lower risk of developing frailty. Consistently, past studies have reported a lower risk of frailty among older males compared to their counterparts. 11 Older women are more vulnerable to age-related hormonal deficits, leading to poor health status and slower recovery time. 40 Despite demographic and cultural differences across studies, advancing age appeared as an associated factor of frailty subtypes. 41 The accumulation of age-related molecular and cellular damage leads to the depletion of homeostasis maintenance and is exacerbated with increasing age. 42 Moreover, disability is often reported as an adverse outcome of frailty. 43 Similarly, our findings suggest that functional competence can potentially determine the transition of health status among older adults. Functional decline can lead to cognitive decline, and vice versa. Therefore, better cognitive function acts as a protective factor against frailty and its consequences. 44 It is noteworthy that only increased global cognition was found to be significantly associated with a lower risk of frailty in our study, and no association for specific cognitive domains in reducing the risk of frailty transition was observed.
At the 5-year follow-up, 3% of our participants developed dementia from the robust, cognitive prefrail, and psychological + cognitive prefrail groups. This transition could be due to the fewer years of education acquired by our participants, which may have an effect on cognitive reserves leading to the onset of dementia. 45
This study provides an overview of frailty subtypes, their transition, and determinants among community-dwelling older adults. Identifying the factors contributing to transitions in frailty status will aid in early prevention strategies. However, our findings were limited to physical, cognitive, and psychological domains of frailty, excluding social domains. In addition, we had a high dropout rate at the 5-year follow-up, which could lead to underrepresentation of the study population. Future research should prioritize examining the factors influencing the transition of frailty subtypes among older adults with neurological and psychiatric disorders, as this aspect was not addressed in this study. It is noteworthy that our research included participants from diverse cultural backgrounds, allowing the generalization of findings to older adult populations with comparable socioeconomic status and cultural beliefs.
This study highlights the significance of addressing various frailty subtypes, considering that deficits may manifest in one or more domains of frailty. It is imperative to promote evidence-based prevention strategies and interventions emphasizing physical, cognitive, and psychosocial statuses with the hope of reversing or delaying further deterioration of frailty status and preventing a detrimental cascade of related adverse events.
Conclusion
In conclusion, physical frailty is highly prevalent among community-dwelling older adults, followed by psychological and cognitive frailty subtypes, which may occur individually or co-occur simultaneously alongside another subtype. The transition of frailty status is significantly affected by age, sex, living status, body composition, physical and cognitive functions, and disability status. Except for age and sex, the other determinants are potentially modifiable. Therefore, taking these factors into consideration in the management of frailty has the potential to alter the frailty trajectory and combat its adverse outcomes.
Footnotes
Acknowledgment
The authors would like to thank the entire research team, including the coresearchers, field workers, enumerators, and participants, as well as their caregivers, for their contribution in this study.
Authors’ Contributions
P.P.: Writing—original draft and conceptualization (lead). R.R.M.: Writing—review and editing and formal analysis. S.S.: Writing—original draft (equal). N.F.M.R.: Methodology. P.S.: Writing—review and editing. D.K.A.S.: Conceptualization (equal).
Author Disclosure Statement
The authors declare that they have no competing interests.
Funding Information
This research was funded by Long Term Research Grant Scheme (LRGS) from the Ministry of Education Malaysia (