




Abstract
Stem cells are widely studied to enable their use in tissue repair. However, differences in function and differentiation potential exist between distinct stem cell populations. Whether those differences are due to donor variation, cell culture, or intrinsic properties remains elusive. Therefore, we compared 3 cell lines isolated from 3 different niches using the Affymetrix Exon Array platform: the cord blood-derived neonatal unrestricted somatic stem cell (USSC), adult bone marrow-derived mesenchymal stem cells (BM-MSC), and adult adipose tissue-derived stem cells (AdAS). While donor variation was minimal, large differences between stem cells of different origin were detected. BM-MSC and AdAS, outwardly similar, are more closely related to each other than to USSC. Interestingly, USSC expressed genes involved in the cell cycle and in neurogenesis, consistent with their reported neuronal differentiation capacity. The BM-MSC signature indicates that they are primed toward developmental processes of tissues and organs derived from the mesoderm and endoderm. Remarkably, AdAS appear to be highly enriched in immune-related genes. Together, the data suggest that the different mesenchymal stem cell types have distinct gene expression profiles, reflecting their origin and differentiation potential. Furthermore, these differences indicate a demand for effective differentiation protocols tailored to each stem cell type.
Introduction
S
The unrestricted somatic stem cell (USSC) is a recently described mesenchymal stem cell from placental cord blood [8]. This CD45-negative, neonatal stem cell with spindle-shaped morphology gives rise to cell types from all 3 germ layers in vivo, such as osteoblasts, chondrocytes, hepatocytes, functional neurons, and cells of the hematopoietic system, indicative of a more pluripotent capacity than other mesenchymal stem cells [8 –10]. Their more pluripotent character is further suggested by the fact that USSC have longer telomeres than adult stem cells, a hallmark for pluripotency. As such, USSC are more reminiscent of embryonic stem cells (ESC) [11], which exhibit shorter cycling times [12 –14] and are poised to undergo differentiation into neural (ie, ectodermal) cells by default in vitro [15,16]. In contrast, stem cells derived from fetal and postnatal tissues have longer cycling times and are believed to be less pluripotent, whereas other stem cells, notably hematopoietic, neural, and epidermal stem cells, are largely restricted in their differentiation capacity to the tissues in which they reside. Postnatal stem cells also have much longer cell cycles than the progenitors derived from them, but still may reduce the G1 phase during the cell cycle, in which lineage commitment is usually accomplished [17].
Currently, stem cells are widely investigated for their role in tissue regeneration, and as a tool to uncover developmental processes. Despite their clinical use, the diversity of the outcome of stem cell treatment is enormous, ranging from improved recovery from stroke and cardiac arrest to no effect at all [18 –20]. Those differences could be explained by differences due to stem cell donors or different sources of stem cells. We set out to compare expression profiles of 3 stem cell lines harvested from 3 independent donors. Moreover, 3 different stem cell sources were compared using the Affymetrix Human Exon Array ST 1.0 platform. These arrays do not interrogate a small part of a gene, but all of its exons, leading to more reliable measurements per gene [21]. Remarkably, only minor differences between donors were detected. However, large differences were detected between cells collected from bone marrow, fat, or umbilical cord blood. Together, these data indicate that stem cells have distinct gene expression profiles reflecting their origin and differentiation potential, and confirm that tailored differentiation protocols should be used for each stem cell type.
Materials and Methods
Isolation of stem cells and stem cell culture
Umbilical cord blood was obtained from 3 different donors after written informed consent, and USSC were generated as described before [8]. In brief, the mononuclear fraction of cells obtained by a Ficoll (Ficoll-Paque 1077, GE Healthcare, Uppsala, Sweden) gradient centrifugation was plated for 2 weeks in USSC proliferation medium (LG-DMEM; Lonza, Verviers, Belgium) supplemented with preselected FBS (30%; HyClone, South Logan, UT), penicillin (100 U/mL) and streptomycin (0.1 mg/mL; MP Biomedicals Inc., Solon, OH), ultraglutamine (2 mM; Cambrex, Verviers, Belgium), and dexamethasone (10−7 M; Sigma-Aldrich Inc., St. Louis, MO). After 2 weeks, cells were cultured for an additional 2–4 weeks without dexamethasone until adherent colonies were observed. Expansion of these colonies was performed by 5 subsequent passages followed by freezing the cells. USSCs were cultured in proliferation medium at 37°C and 5% CO2 in a humidified atmosphere. At 70% confluency, cells were trypsinized and replated in the volume ratio 1:3. At passage 6 or 7, cells were harvested for RNA isolation.
In order to obtain BM-MSC, bone marrow was collected after written informed consent from 1 healthy female and 2 healthy males. The median donor age was 36 years (SD: ± 4 years). Mononuclear cells were isolated by Ficoll density gradient centrifugation and plated in polystyrene culture flasks at a density of 160,000/cm2 in complete culture medium (LG-DMEM; Invitrogen, Paisley, UK) supplemented with penicillin and streptomycin (Lonza, Verviers, Belgium) and 10% preselected fetal bovine serum (FBS; HyClone, Logan, UT). Cells were collected by trypsinization at 90% confluency. In order to obtain AdAS, leftover subcutaneous or retropatellar fat tissue was obtained from 3 different females during orthopedic surgical procedures after oral consent. Mean age of the donors was 67 years (SD: ± 18 years). The fat was minced, placed in PBS containing 0.4% HSA, treated with liberase H1 (Roche, Indianapolis, IN) at 37°C for 60 min, under frequent shaking, and subsequently centrifuged for 10 min at 500g at room temperature. The supernatant, containing mature adipocytes, was aspirated and the stromal vascular fraction was plated and further cultured as described for BM-MSC. Before isolation of RNA, cells at 80%–90% confluency were washed with PBS, trypsinized, and further processed as described below. Both BM-MSC and AdAS were harvested at passage 6 or 7 for RNA isolation.
RNA isolation, quality control, and microarray hybridization
Total RNA was isolated from stem cells using the RNeasy Mini kit (Qiagen) according to the manufacturer’s protocol. The quality of RNA was tested using the Agilent 2100 Bioanalyzer following the manufacturer’s protocol. All samples had a 28S:18S ratio >1.5, thus passing quality standards for further processing. Two micrograms of total RNA was labeled according to the GeneChip Whole Transcript (WT) Sense Target Labeling Assay as provided by the manufacturer (Affymetrix, Santa Clara, CA), and hybridized to Human Exon 1.0 ST Arrays overnight before scanning in an Affymetrix GCS 3000 7G scanner. While there were 3 donors for each stem cell type, each donor sample was hybridized once; that is, there are 3 biological replicates per stem cell type. The Human Exon 1.0 ST Array contains >1,400,000 probe sets with an average of 4 probes per exon and an average of about 40 probes per gene. All hybridizations were carried out at the Microarray Facility of the Department of Human Genetics, Nijmegen Centre of Molecular Life Sciences, Radboud University Nijmegen Medical Centre, Nijmegen, The Netherlands.
Analysis of microarrays
The Affymetrix CEL files were imported into Affymetrix Expression Console version 1.1 where control probes were extracted using the default RMA algorithm in order to perform quality analysis checks. The area under the curve (AUC) of the receiver operator characteristic was calculated using the positive and negative control probes. All arrays had a AUC score above the empirically defined threshold of 0.85 indicating a good separation of the positive controls from the negative controls. Subsequently, CEL files were imported into Partek (Partek Genomic Suite software, version 6.4; Partek Inc., St. Louis, MO) where only core exons were extracted and normalized using the RMA algorithm with GC background correction. Core transcript summaries were calculated using the mean intensities of the corresponding probe sets. The correspondence of the replicate samples was confirmed using principal component analysis (PCA) and Pearson correlation analysis. After grouping the samples by stem cell type, the analysis of variance components indicated that the scan date of the samples had a relatively large influence on the expression profiles and this was included as an additional factor in the ANOVA model. Applying the ANOVA model on the log2 intensities, we generated P values for expression differences for the 3 pairwise comparisons of the 3 stem cell types. Venn diagrams were also generated in Partek.
Gene ontology analysis of differentially expressed genes
Lists generated in the pairwise comparisons between the 3 different stem cell types were used as input for the online Functional Annotation Tool at the DAVID Bioinformatics Resources (National Institute of Allergy and Infectious Diseases (NIAID), NIH, Bethesda, MD; http://david.abcc.ncifcrf.gov/) [22]. Only genes that were significantly (P < 0.05) differentially expressed >4-fold were included in the analysis. Affymetrix transcript IDs were used as Gene List input and all the genes in the human genome served as the background. From the output, only those GO terms that contain >6% of the genes from the pairwise comparisons and were significantly enriched (P < 0.05), were considered. Furthermore, only GO terms that accurately describe biological processes (GO_BP) were further analyzed.
Reverse transcription, conventional real-time quantitative PCR, and parallel real-time quantitative PCR using TaqMan low-density arrays
For conventional real-time quantitative PCR, cDNA was synthesized from 1 µg total RNA using the High Capacity cDNA Synthesis kit (Applied Biosystems, Foster City, CA), following the manufacturer’s directions. The equivalent of 2 ng total RNA input was used in a subsequent gene-specific conventional quantitative PCR using the PowerSYBR Green Master Mix, following the manufacturer’s recommendations. The gene-specific primers are listed in Supplementary Table 1 (Supplementary materials are available online at http://www.liebertpub.com/). The reactions were run on a 7900HT Fast Real-Time PCR System (Applied Biosystems), and data were collected using Sequence Detection Software (version 2.2.3; Applied Biosystems). ΔCt values for each gene were calculated with GAPDH as a reference, and exported to a text file. Gene expression data were further analyzed by means of one-factor ANOVA, and non-parametric pairwise comparison of the stem cell subsets was done using the Tukey’s post-hoc test in the R statistics package [23].
Parallel quantitative real-time PCR using TaqMan Low-Density Arrays was performed using the pre-designed Human Immune Panel array (Applied Biosystems, Foster City, CA) containing a total of 96 genes in quadruple, of which 5 serve as a reference and 91 are involved in immunity. Per sample, 200 ng total RNA was converted to cDNA as described above, and diluted in 1× TaqMan Universal PCR Master Mix and loaded onto 2 reservoirs encompassing 96 TaqMan assays, essentially as described by the manufacturer. Arrays were run on the 7900HT Fast Real-Time PCR System (Applied Biosystems) and data were collected using Sequence Detection Software (version 2.2.3; Applied Biosystems). ΔCt values were calculated with GAPDH as a reference, and exported to a text file for further analysis in the R statistics environment using the Bioconductor package LMGene [24], allowing a gene-by-gene ANOVA and the identification of differentially expressed genes. Genes that appeared differentially expressed were further analyzed by means of one-factor ANOVA, and non-parametric pairwise comparison of the stem cell subsets was done using the Tukey’s post-hoc test in the R statistics package [23].
Results
Neonatal USSC differ significantly in gene expression signature from postnatal BM-MSC and AdAS
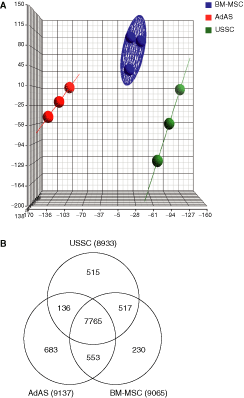
The stem cells derived from bone marrow and adipose tissue were characterized by flow cytometry (Supplementary Table 2) and are all positive for HLA-I, CD73, CD105, and CD90, whereas they are negative for HLA-DR, CD31, CD45, and CD80, except for AdAS donor 2, for which surface expression of HLA-I, HLA-DR, CD105, and CD80 has not been determined. Phenotype and differentiation characteristics for the cell lines used in this study have been described elsewhere [8,25]. In order to globally address differential gene expression between neonatal USSC and postnatal BM-MSC and AdAS, a comprehensive transcriptome analysis was performed using Affymetrix Human Exon Arrays. To first assess relatedness between the stem cell types, a PCA was performed. As shown in Figure 1A, the 3 independent samples of each stem cell type grouped together, with BM-MSC being more closely related to each other (blue circular plane), while the AdAS and USSC lines are more divergent (red and green lines, respectively). The data also indicate that AdAS are more distantly related to USSC than to BM-MSC, in line with the differential gene expression data (see below) and corroborated by Pearson correlation analysis (Supplementary Table 3). A Venn diagram was constructed in which genes expressed above a normalized value of 4 are represented (Fig. 1B). From this diagram, it is clear that the stem cell types all express ∼9,000, or 41% of all annotated genes, above the chosen threshold. Also, AdAS express 683 genes of the 21,980 annotated genes in the output (or 3.1% of all annotated genes) that can be considered unique to AdAS, whereas USSC express 515 unique genes (2.3%) and BM-MSC express only 230 unique genes (∼1%). Of the 21,980 annotated genes in the output, 4% to 8.4% of the genes are differentially expressed with a P value < 0.01 (Supplementary Table 4). It should be noted that this also includes genes expressed below the threshold chosen for the Venn diagram. Many of these genes are only moderately differentially expressed, as genes that are at least 2-fold up- or down-regulated between the different stem cell types only represent 1.5% to 4.8% or roughly one-third to half of all differentially expressed genes (Supplementary Table 5). As is evident from Supplementary Tables 4–6, comparison of AdAS and USSC shows the largest proportion of differentially expressed genes, again suggesting that they are the least related. When analyzing the top 25 differentially expressed genes in each pairwise comparison, genes involved in neurogenesis (LIF, EPHA5, ZIC1, NEFM, SCRG1; Supplementary Tables 7 and 8) are overrepresented in USSC, while AdAS express more genes involved in immunity (IL13RA2, TNFAIP6, CRLF1, FOS, DPP4, CLEC3B; Supplementary Tables 9 and 10). Interestingly, BM-MSC are enriched not only for genes related to immunity in comparison with USSC (CD74, HLA-DPA1, HLA-DRA, LITAF, IFI30, IFI44L; Supplementary Table 11), but also for genes in development when compared to AdAS (INHBA, DLX5, COL11A1, SATB2, DACT1, HOXB2; Supplementary Table 12). It should be noted that the top 25 genes in all pairwise comparisons are at least 8 times up-regulated.
(
Gene ontology analysis reveals a gene expression signature specific to USSC
To more broadly define gene expression signatures in the different stem cell types, we set out to analyze whether differentially expressed genes represent biologically distinct profiles. Gene expression data were subjected to gene ontology (GO) analysis, using the online functional annotation tool DAVID (http://david.abcc.ncifcrf.gov/). To this end, lists of differentially expressed genes were generated from pairwise comparisons between the different stem cell types, and only genes that were significantly (P < 0.05) up-regulated >4-fold were included in this analysis. In the case of genes that are up-regulated in USSC versus AdAS, it is evident that genes associated with cell cycle regulation were specifically higher in USSC (Table 1). Intriguingly, in 3 GO classes that were significantly up-regulated in USSC, 2 were linked to development: “nervous system development” (GO:0007399) and “organ development” (GO:0048513; see also Table 1). When comparing GO classes in USSC versus BM-MSC, the class associated with the cell cycle is highly up-regulated in USSC (Table 1). However, there are more classes associated with development as compared to USSC versus AdAS, and there is a strong bias toward neural development (see Table 1): “neurogenesis” (GO:0022008) and “nervous system development” (GO:0007399). Collectively, these data suggest that USSC proliferate at a higher rate than BM-MSC and AdAS. In addition, they express multiple genes associated with neurogenesis, a feature they share with ESC.
G
aGene ontology (GO) classes associated with development are indicated in bold face.
bOnly those classes that contain >6% of the genes from the pairwise comparison are included.
Abbreviations: USSC, unrestricted somatic stem cell; AdAS, adipose tissue-derived stem cell; BM-MSC, bone marrow-derived mesenchymal stem cell.
Several genes implicated in neurogenesis are expressed at higher levels in USSC
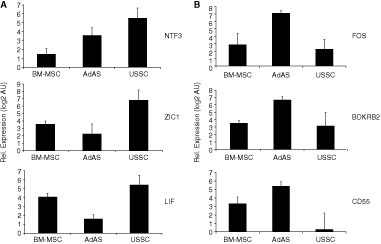
To verify that USSC indeed express high levels of genes involved in neurogenesis at high levels, we performed quantitative reverse transcription PCR (qRT-PCR) on a selection of genes shown to be differentially expressed in our microarray analysis (P < 0.01). These include leukemia inhibitory factor (LIF), which is involved in the development of astrocytes; neurotrophin 3 (NTF3), which controls differentiation and survival of neurons; and zinc finger in cerebellum 1 (ZIC1), the human homolog of the odd-paired gene in Drosophila believed to be important in brain development. Especially USSC express higher levels of NTF3 and ZIC1, whereas LIF expression is also somewhat higher in BM-MSC compared to AdAS, corroborating the data generated with the Exon array platform (Fig. 2A). Also more general factors that play an important role in development, such as inhibin, beta A (INHBA; Supplementary Tables 7 and 12), which is involved in numerous developmental processes, is expressed at higher levels in both BM-MSC and USSC, as well as collagen, type XI, alpha 1 (COL11A1; Supplementary Tables 7 and 12), mutations in which are associated with type II Stickler syndrome and with Marshall syndrome. Interestingly, when AdAS and BM-MSC are compared, BM-MSC appear to be geared more toward GO classes relating to mesodermal/endodermal development (GO:0001501, “skeletal development,” P < 0.05; GO:0048513, “organ development,” P < 0.05).
(
Adult stem cells from bone marrow and adipose tissue express many genes involved in innate and adaptive immunity
In comparison with USSC, both BM-MSC and AdAS express, apart from genes that are involved in development of organs and anatomical structures, a surprisingly high number of genes associated with GO classes involving inflammation and the immune response. In fact, in AdAS they appear to be one of the most prevalent classes, as of the 5 significant classes shown, 2 are directly linked with inflammation and immunity. The most significant class (GO:0009605: response to external stimulus) shows significant overlap with these 2 classes (Table 2). In the case of BM-MSC, GO classes associated with development are more prevalent, but those that are associated with inflammation and immunity are still well-represented: out of 6 significantly differentially expressed GO classes as compared to USSC, 2 classes are associated with immunity (Table 2). As is also evident from Table 2, both AdAS and BM-MSC express a high number of genes involved in development. A breakdown of this class into smaller GO subclasses revealed that these genes are primarily involved in the development of tissues and organs derived from the embryonic mesoderm and endoderm (GO:0048513, “organ development” and GO:0048856, “anatomical structure development,” P < 0.05).
G
aGene ontology (GO) classes associated with immunity are indicated in bold face.
bOnly those classes that contain >6% of the genes from the pairwise comparison are included.
cPrimarily development of tissues of mesodermal and endodermal origin.
Abbreviations: USSC, unrestricted somatic stem cell; AdAS, adipose tissue-derived stem cell; BM-MSC, bone marrow-derived mesenchymal stem cell.
Independent assays confirm higher expression of genes involved in immunity in adult mesenchymal stem cells
To confirm up-regulation of genes involved in immunity and inflammation in adult mesenchymal stem cells, the expression of a selection of genes in these GO classes was determined by reverse transcription real-time qPCR. As shown in Figure 2B, v-fos FBJ murine osteosarcoma viral oncogene homolog (FOS), which dimerizes with jun oncogene (JUN) to form the activator protein 1 (AP1) complex and is involved in the transcription of many different cytokines and chemokines during immune responses and inflammation, is highly expressed in AdAS. The same holds true for bradykinin receptor B2 (BDKRB2), while CD55 molecule, decay accelerating factor for complement (Cromer blood group) (CD55), is expressed at higher levels in both AdAS and BM-MSC. To verify differential expression of other genes involved in immunity and inflammation, Human Immune Panel TaqMan low-density arrays were used. As shown in Supplementary Table 13, many of these genes appear to be significantly differentially expressed after statistical analysis, and all these genes are also represented in the GO classes associated with immunity. Not all genes found to be significantly differentially expressed using the TaqMan array, that is CCL3 and HLA-DRB1, are in the output of the Exon array analysis, due to the fact that these genes do not contain unique core exons as a result of the presence of multiple, almost identical paralogs in the genome, as well as transcribed pseudogenes. Nevertheless, the match in the results obtained with the TaqMan arrays and the Exon arrays is striking (Fig. 3): absolute expression levels derived from the Exon array data for BCL2L1, CD68, IL12A, and CD4 correlate very well with data generated with the TaqMan assay. Taken together, the data imply that the different stem cell types can be classified on the basis of their gene expression profile, and that these profiles match with their reported biological properties.
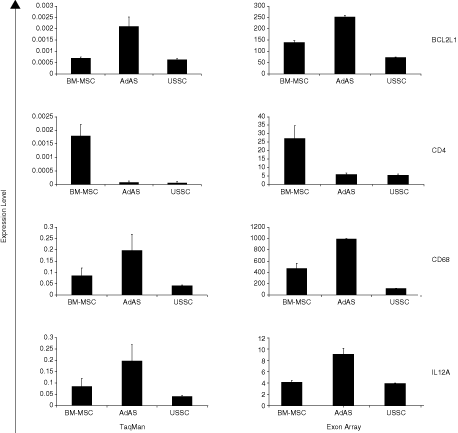
High degree of correspondence between the Human Immune Panel TaqMan low-density array and Exon array data. Genes involved in immunity are up-regulated in adult mesenchymal stem cells according to the gene ontology (GO) analysis of the microarray data, which was confirmed with parallel TaqMan real-time RT-PCR. On the y-axis of the TaqMan array data (left column of graphs), relative expression is indicated based on GAPDH as a reference gene. On the y-axis of the Exon array data (right column of graphs), the absolute expression levels based on the RMA normalized log2 values are indicated. Abbreviations: USSC, unrestricted somatic stem cell; AdAS, adipose tissue-derived stem cell; BM-MSC, bone marrow-derived mesenchymal stem cell.
Discussion
Stem cells are currently applied in the clinic for tissue regeneration and as an immunosuppressive adjuvants, and additionally help us to better understand developmental pathways leading to the formation of tissues, organs, and anatomical structures. Many stem cell types have been identified to date, while therapeutic efficacy of these cells varies widely [18 –20]. Since these variations may result from intrinsic differences between stem cells, and/or may depend on the niche they are derived from, we set out to generate and study transcriptomes of adult BM-MSC, AdAS, and neonatal USSC from 3 independent donors using the Human Exon Array ST 1.0 platform. Principal component analysis revealed that the donors for the different stem cell types nicely cluster according to stem cell source, indicating minimal donor variation. Although correlations between the different stem cell types are relatively high (>0.90), specific gene expression signatures could be derived from the pairwise comparisons of neonatal USSC and adult stem cells. Furthermore, we were able to largely corroborate the results obtained from the microarrays, despite sensitivity issues and non-uniqueness of some probes on the Human Exon microarray.
While in our study donor variation appears minimal for each stem cell type as determined by Pearson correlation analysis and PCA, such variation has been reported for AdAS [26]. Donor variation in that study could be ascribed in part to donor status: 2 out of 8 AdAS lines from overweight subjects appeared similar to each other but different from 6 donors with normal weight. Another important difference is the microarray platform used: Exon Arrays cover over 300,000 transcript clusters, while Illumina Bead arrays used by Pilgaard et al. cover ∼25,000 transcripts, therefore the sheer number of data points derived from Exon Arrays may further diminish differences between donors.
Gene ontology analysis revealed that USSC express many genes involved in cell-cycle control. Besides the fact that this is reflected by a much higher proliferation rate in cell culture as compared to AdAS and BM-MSC, higher proliferation may also be indicative for a more pluripotent state, as it is known that ESC are essentially devoid of the early G1 phase and have a much shorter cell cycle than other proliferating cells [17]. A more pluripotent character of USSC has also been suggested by the presence of much longer telomeres in USSC as opposed to adult stem cells [8]. One of the genes that is expressed at higher levels in USSC is cyclin-dependent kinase 6 (CDK6), which binds to
In contrast, BM-MSC express genes involved in endodermal and mesodermal development at higher levels, most of them known to be involved in differentiation of BM-MSC into other lineages. Although there are significant differences between BM-MSC and AdAS, there is some evidence that gene expression data covering only extracellular matrix genes converge upon osteogenic differentiation [32]. Clearly, genome-wide gene expression profiling is needed to confirm this convergence. AdAS, on the other hand, express a surprisingly high number of genes involved in immunity and inflammation. Chemokines and their receptors are not only involved in immune responses but are also known to be important for the homing of mesenchymal cells to sites of injury [33,34], at least in part explaining the presence of these genes in the AdAS expression profile. However, a wide variety of genes involved in immunity are expressed in AdAS, and the reason for this is unclear. There is, however, mounting evidence that adipose tissue functions as a depot for macrophages, mast cells, and T cells. Very recent evidence shows that resident CD8-positive T cells contribute to macrophage recruitment and adipose tissue inflammation, as is observed in metabolic disease in obese individuals [35]. Conversely, adipose tissue form lean fat contains a high number of regulatory CD4- and Foxp3-positive T cells, thereby inhibiting metabolic disease. The balance between normal and inflamed adipose tissue is regulated through differential production of cytokines by regulatory and conventional T cells, which influences the production of inflammatory mediators and glucose uptake in adipocytes [36]. It should be noted that immunomodulatory functions of stem cells have been described and partly resolved, and it is thought to be mainly occurring through the concerted action of chemokines and nitric oxide [37]. However, this immunomodulatory capacity is not limited to AdAS [38 –41].
In order to verify the results obtained from the Exon array platform, we used Human Immune Panel TaqMan low-density arrays to simultaneously determine the expression levels of 96 genes involved in immunity. The analysis revealed immediate differences between the 2 gene expression profiling methods: (1) arrays appear less sensitive than the PCR-based TaqMan method and (2) the output of the Exon array lacks genes that do not have unique core exons due to the expression of highly homologous paralogs or pseudogenes that are transcribed and thus cross-hybridize on the array. For these reasons, it should be noted that some housekeeping genes, such as GAPDH, are not in the output, as well as some genes that are relevant to stem cell biology, such as NANOG, OCT4, and SOX2. Furthermore, many growth factors, chemokines, and cytokines are highly homologous, and may thus be missing from our analysis.
In conclusion, we were able to generate stem cell type-specific transcriptomes from stem cells differing in origin and differentiation potential. Our findings indicate that USSC in some respects resemble ESC, which may further explain their highly pluripotent state, and that they are primed toward neurogenesis. In contrast, BM-MSC express genes involved in tissue and organ development, whereas AdAS express a high number of genes involved in inflammation and immunity. Furthermore, the described transcriptomes demand that effective differentiation protocols should be tailored each stem cell type to ensure better clinical efficacy.
Footnotes
Acknowledgments
Talia Latuhihin is gratefully thanked for technical assistance. This work was supported by grants NGT.6719 and NGT.6725 from the Dutch Program in Tissue Engineering (DPTE).
Author Disclosure Statement
The authors report no conflict of interest in connection with this article.