
Abstract
Intermediate progenitor populations play a crucial role in the regional specification and differentiation of the cranial neural crest. On the basis of global gene expression profiles, gene cohort expression levels, and epigenetic modifications, we have defined key factors involved in the differentiation of dental follicle (DF) intermediate progenitors into periodontal lineages, including alveolar bone (AB) osteoblasts, cementoblasts, and periodontal ligament (PDL) cells. When comparing differentially expressed genes, PDL cells most closely resembled DF progenitors, followed by AB osteoblasts and cementoblasts as the most distant population. According to gene ontology analyses, extracellular matrix-adhesion proteins were substantially increased in PDL cells, osteogenesis factors were elevated in AB osteoblasts, and gene expression levels were lower in cementoblasts, especially in the cytokine group. Unique signature proteins included interleukin 6, paired-like homeodomain transcription factor 2, thrombospondin 2, and glial cell line-derived neurotrophic factor for DF progenitors; asporin and prostaglandin-H2 D-isomerase for AB osteoblasts; and keratin 18, Netrin 4, Jagged 1, and Dickkopf1 for cementoblasts, as verified by western blot analysis. Secreted frizzled-related protein 1 was preferentially expressed in PDL cells, whereas matrix Gla-protein, bone sialoprotein, and insulin-like growth factor binding protein 5 were higher in AB osteoblasts than in cementoblasts. On an epigenetic level, DF progenitors featured high levels of the euchromatin marker H3K4me3, whereas PDL cells, AB osteoblasts, and cementoblasts contained high levels of the transcriptional repressor H3K9me3. Together, our data indicate that in addition to changes in signature gene expression, unique shifts in gene cohort expression levels, epigenetic modifications, and changes in cell morphology contribute to the individuation of tissue populations from a common neural-crest-derived ancestor.
Introduction
T
Intermediate pluripotent progenitors exist in many organs and tissues, including the subventricular zone of the brain [9] and the immature macrophages, granulocytes, and lymphocytes of the hematopoietic system [10]. A typical example of an intermediate pluripotent progenitor in craniofacial development is the dental follicle (DF), a transient tissue in tooth development that gives rise to all 3 tissues of the periodontal attachment apparatus, periodontal ligament (PDL), alveolar bone (AB), and root cementum [3,11 –14]. The concept of the intermediate progenitor might suggest that terminal tissue differentiation can be compared with a keystroke, involving switches in gene expression or environmental triggers that cause rapid change in cellular phenotype. Identification of these molecular codes and switches will be useful in the application of odontogenic stem cells for repair and regeneration [15,16].
As a result, there has been significant interest in the discovery of molecular markers that would allow the identification of periodontal tissues among each another or provide clues to reconstruct the terminal differentiation pathways of each of the 3 differentiated tissues, bone, cementum, and ligament, from their DF or neural crest origin. However, while all 3 periodontal tissues are derived from the DF and ultimately from the neural crest, they also feature significant morphological differences among each other. Two cementum-related proteins have been identified, CAP [17] and CP23 [18], which have also been detected in osteoblasts, PDL, and cementum [19]. Another protein, F-spondin, was linked to DF tissues, but was also reported in dental pulp and PDL, whereas Tenascin-N, a presumed PDL marker, was also identified in AB lining tissues [20]. These 4 proteins have been valuable first steps in trying to identify unique proteins suitable to characterize individual periodontal tissues. To further characterize the relationship between periodontal lineages in development and regeneration, we have conducted a comprehensive analysis of their cellular, molecular, and epigenetic signatures that define the transition from intermediate progenitor to periodontal lineages. To identify unique global gene expression characteristics of individual periodontal populations, we have also compared global gene expression levels and preferential gene cohort expression between periodontal lineages.
Materials and Methods
Source of cell populations
Healthy human teeth (patient ages ranging from 12 to 15 years) extracted for orthodontic reasons were obtained according to the humans subjects protocol approved by the UIC's Institutional Review Boards and the Office for the Protection of Research Subjects. Teeth were kept in serum-free Dulbecco's modified Eagle's medium containing 100 U/mL of penicillin and 100 mg/mL of streptomycin on ice before cell extraction. Ten fully erupted third molars with completely formed roots, 6 molars in the root development stage, and 6 molars with tooth organ surrounded by DF before root formation were obtained from patients in the above-mentioned age group.
Periodontal cell cultures
For the collection of DF progenitor cells, the loose DF sac surrounding the tooth organ at 2 different stages of development was isolated. The DF that was isolated from the tooth organs before root formation stage was termed “early stage DF” (edf), whereas the DF that was isolated from tooth organs in the root development stage is termed “late stage DF” (df). In both cases, DF tissues were gently removed using surgical scissors and scalpels. For the collection of PDL cells, the fibrous PDL associated with the tooth roots at 2 different stages of development was isolated. The PDL that was isolated from developing tooth roots was termed “early stage PDL” (epdl), whereas the PDL isolated from completely formed tooth roots was termed “late stage PDL” (pdl). Cell isolation and culture from these tissues was carried out as reported in [7,21]. Third-passage clonal populations from both cell types with the highest ability to differentiate into adipogenic and osteogenic lineages [7,21] were used as progenitor cells in all further experiments. Cementoblasts were harvested after dissecting root cementom from the apical tip of tooth roots after complete removal of PDL fibers. Root scrapings were minced into 0.5-mm-diameter pieces and cell cultures were established as previously reported [22]. AB osteoblasts were isolated from AB fragments obtained from the same donors whose teeth were extracted for orthodontic purposes. AB osteoblast cell isolation was performed according to the technique described in [23]. Briefly, the AB fragments were minced into small 0.5-mm-diameter pieces and subjected to collagenase/dispase (5 mg/mL) digestion in α-minimum essential medium for 30 min at 37°C with gentle rotation. After 30 min of digestion, the entire mixture was centrifuged at 500 g, and the centrifugal supernatant was discarded. The AB pieces were digested again with collagenase/dispase and the process was repeated 5 times, with the centrifugal supernatant discarded for the first 2 times. Cells obtained from the last 3 digestions were pooled together along with the explant pieces and cultured in α-minimum essential medium supplemented with 10% fetal bovine serum, antibiotic/antimycotics to subconfluence, and subsequently passed. During the culture period, cells were incubated in a humidified atmosphere, 95% air, 5% CO2 at 37°C, with a change to fresh media every second day. Human foreskin fibroblasts (hFFs) were purchased from ATCC and cultured in Dulbecco's modified Eagle's medium with 10% fetal bovine serum and 1% antibiotic/antimycotics.
Staining procedures for light microscopy and morphometry
Paraffin tissue sections were stained with Masson's trichrome stain (Sigma-Aldrich). To observe the cytological characteristics of the primary cells, cells were stained with 0.1% toluidine blue. Cellular morphometries such as cell area and cell elongation (length to width ratios) were calculated using NIH imaging software. Calculations were made on cells observed in 3 random fields of view and for a total of 3 wells for each cell type. Passage 3 AB osteoblasts and cementoblasts were either treated with osteogenic differentiation media (0.5 mM ascorbic acid 2-phosphate and 10 mM β-glycerophosphate) or left untreated and cultured for 2 weeks. To detect mineral deposits in these cultures, cells were fixed with 70% ethanol and stained with Alizarin Red S as described in [21] and calcium levels in cultures were measured using the o-cresolphthalein complex one method [24].
Western blot analysis
Proteins were extracted from cell cultures by scraping the monolayers with sodium dodecyl sulfate lysis buffer containing proteinase inhibitors, and western blotting was performed as previously described [21]. Primary antibodies are listed in the Supplemental Table S1 (available online at
Microarray analysis
As a microarray platform, the Agilent Whole Human Genome Microarray platform was used, representing >41,000 unique human genes and transcripts with public domain annotations (Agilent Technologies). This platform uses a 4 × 44K slide format based on 60-mer SurePrint technology. For each hybridization experiment, samples were run in triplicate; that is, RNA from 3 different samples of the same cell type was submitted for analysis.
The data from all microarrays in each experimental set were analyzed using Omicsoft Array Studio software (OmicSoft Corporation). All signals were quantile normalized and transformed to log2 values. Hypothesis testing was performed by combining technical replicates and performing a standard Student's t-test to calculate raw P values. Adjusted P values were calculated using the Benjamini and Hochberg method with a false discovery rate α-value of 0.05 [25]. Fold changes were calculated based on the mean values of the replicates for each probe.
Genome-wide microarray data were used for volcano plot display of gene expression level differences between cell populations, whereas gene cohort data were used for box and whisker plot display of differences between gene expression levels of individual cohorts (osteogenesis, ECM adhesion, etc.). Volcano plots were plotted using fold change and the raw P value from the Student's t-test (described above). Clustering dendrograms were generated using preselected genes based on gene set, fold-change, and statistical relevance. Red, black, and green color codes in dendrograms indicate higher (>2-fold), equal, and lower (<2-fold) relative expression, respectively. The hierarchical clustering was calculated using correlation distance and complete linkage clustering method. Box plots (box and whisker plots) were generated selecting the genes with a |fold-change| > 2 and P value of <0.05. Fold-change values for replicate probes representing the same gene were averaged before quantile calculations. The box represents the 25th and 75th quantiles, and the whiskers represent the 10th and 90th quantiles. The central line represents the mean value of the fold changes. Usually, the box plot uses the median value for the central line; however, since we eliminated all fold-change values between −2 and 2, the median did not provide useful descriptive information about where the data are distributed. As a result, the mean value was used as an alternative to show the distribution and indicate a prevalence of upregulation or downregulation in each comparison.
Criteria for gene set (cohort) selection
Genes for each gene set were chosen using the relevant gene ontology categories. Relevant gene categories were found using the AmiGO search tool available on the gene ontology Web page (
Statistical analysis
All experiments were performed in triplicate unless stated otherwise. Final values were reported as means ± standard deviation (SD). Data were analyzed using Student's t-test and P < 0.05 were considered statistically significant.
Results
DF progenitors, PDL cells, AB osteoblast, and cementoblast populations are neural crest derivatives
Earlier lineage analysis studies suggest that periodontal lineages originate from the cranial neural crest. To verify that the 4 human lineages used in the present study, DF progenitors, PDL cells, AB osteoblasts, and cementoblasts, were of neural crest origin, proteins were extracted from cells and neural crest marker proteins Nestin and snail homolog 2 (SNAI2) (SLUG) were detected using a western blot approach. Our analysis revealed that all 4 cell lineages were labeled positive for both Nestin and SLUG, whereas human foreskin fibroblasts (hFFs) served as a negative control (Fig. 1Q). Highest neural crest marker expression levels were in the early stage DF.
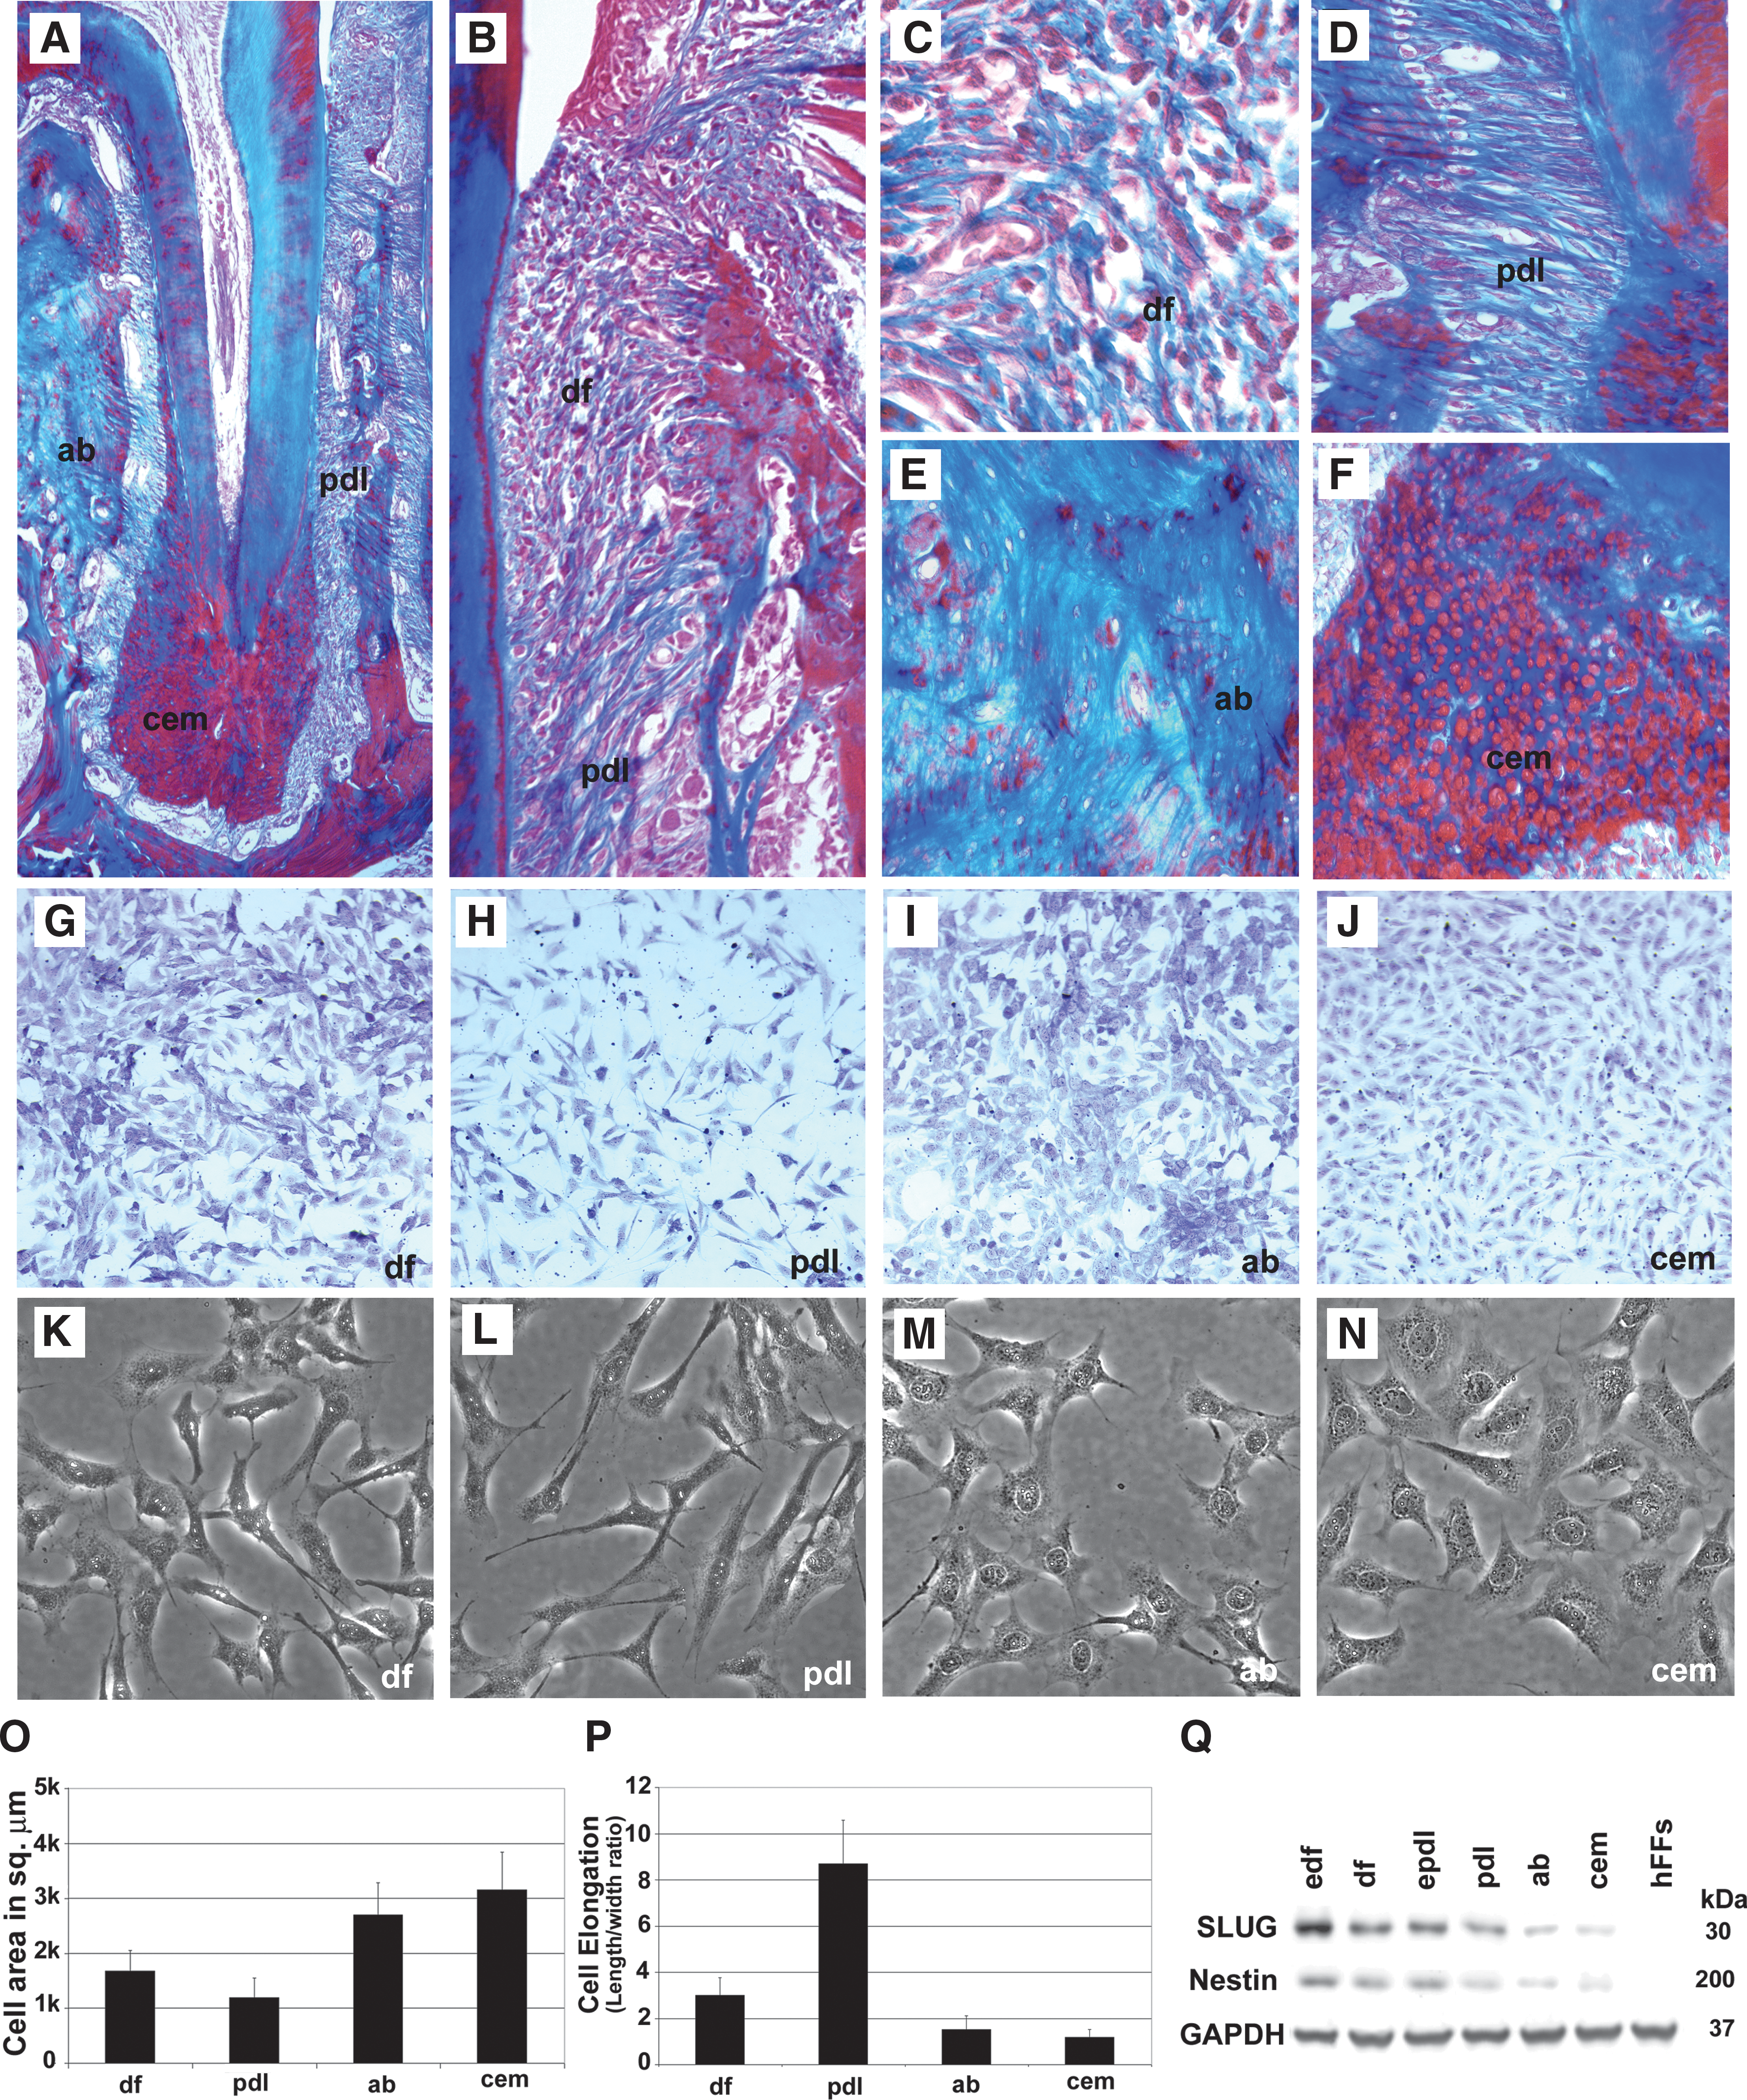
Morphological comparison between periodontal cells and tissues. Mallory's connective tissue stain distinguishes unique periodontal lineages surrounding the mouse molar tooth root based on their histological appearance, including cementum (cem), alveolar bone (ab), periodontal ligament (pdl), and dental follicle (df)
AB osteoblasts and cementoblasts were larger and less elongated than PDL cells and DF progenitors
During periodontal development, the DF differentiates into 3 periodontal tissues, PDL, AB, and cementum [7,26 –28] (Fig. 1A, B). Detailed histological analysis of mouse tissues distinguishes between the mixed connective tissue population of the DF (Fig. 1B, C), the fibrous PDL characterized by elongated fiber bundles (Fig. 1A, D), the compact osseous structure of the AB (Fig. 1A, E), and the rounded cementocytes embedded in a mineralized tissue prominently featured at the root apex, the cellular cementum (Fig. 1A, F). Mouse histology was used for illustrative purposes only. The remainder of this study was carried out with human cells that were released from their matrices and cultured in vitro. Specifically, our data revealed that DF cultures contained mixed cell populations of elongated and polygonal cells (Fig. 1G, K); PDL cell cultures were characterized by elongated, fibroblast-shaped cells (Fig. 1H, L); AB cell cultures contained polygonal, osteoblast-like cells (Fig. 1I, M); and cementoblast/-cyte cultures were similar to those of AB osteoblasts, but nuclei were less metachromatic (Fig. 1J) and their nuclear envelope was less contrasted from the cytoplasm (Fig. 1N). A comparison between total cell areas between these 4 periodontal lineages revealed high values for cementoblasts (3,157 ± 686 μm2) and AB osteoblasts (2,702 ± 580 μm2) compared with lesser values in DF progenitors (1,679 ± 372 μm2) and PDL cells (1,197 ± 355 μm2). The highest length to width ratio was found in PDL cells (8.68 ± 1.86), followed by DF progenitors (3.0 ± 0.78). AB osteoblasts (length to width 1.53 ± 0.58) and cementoblasts (length to width 1.17 ± 0.35) were less polarized. Together, this morphometric analysis identifies PDL cells as highly elongated, fibroblast-like cells, whereas AB osteoblasts and cementoblasts were characterized by a larger overall cell area, about double in size compared with DF and PDL cells. The presence of neural crest markers such as Nestin and SLUG in early stage DF, DF, early stage PDL, PDL, AB osteoblasts, and cementoblasts was confirmed by western blot analysis. hFFs were used as a negative control (Fig. 1Q).
PDL cells most closely resembled DF progenitors when comparing the number of differentially expressed genes
To document changes in gene expression levels between the DF as intermediate progenitor and PDL cells, AB osteoblasts, and cementoblasts as differentiated periodontal cell populations, differences in global gene expression patterns between intermediate progenitor and differentiated populations were assessed using a volcano plot observation and statistical verification approach (Fig. 2A–C). Using this approach, the average change in gene expression levels of significantly (above 2-fold) up- and downregulated genes provided a numerical value for the extent by which differentiated population varied from its intermediate progenitor in terms of expression levels of significantly altered genes (Fig. 2A–C).
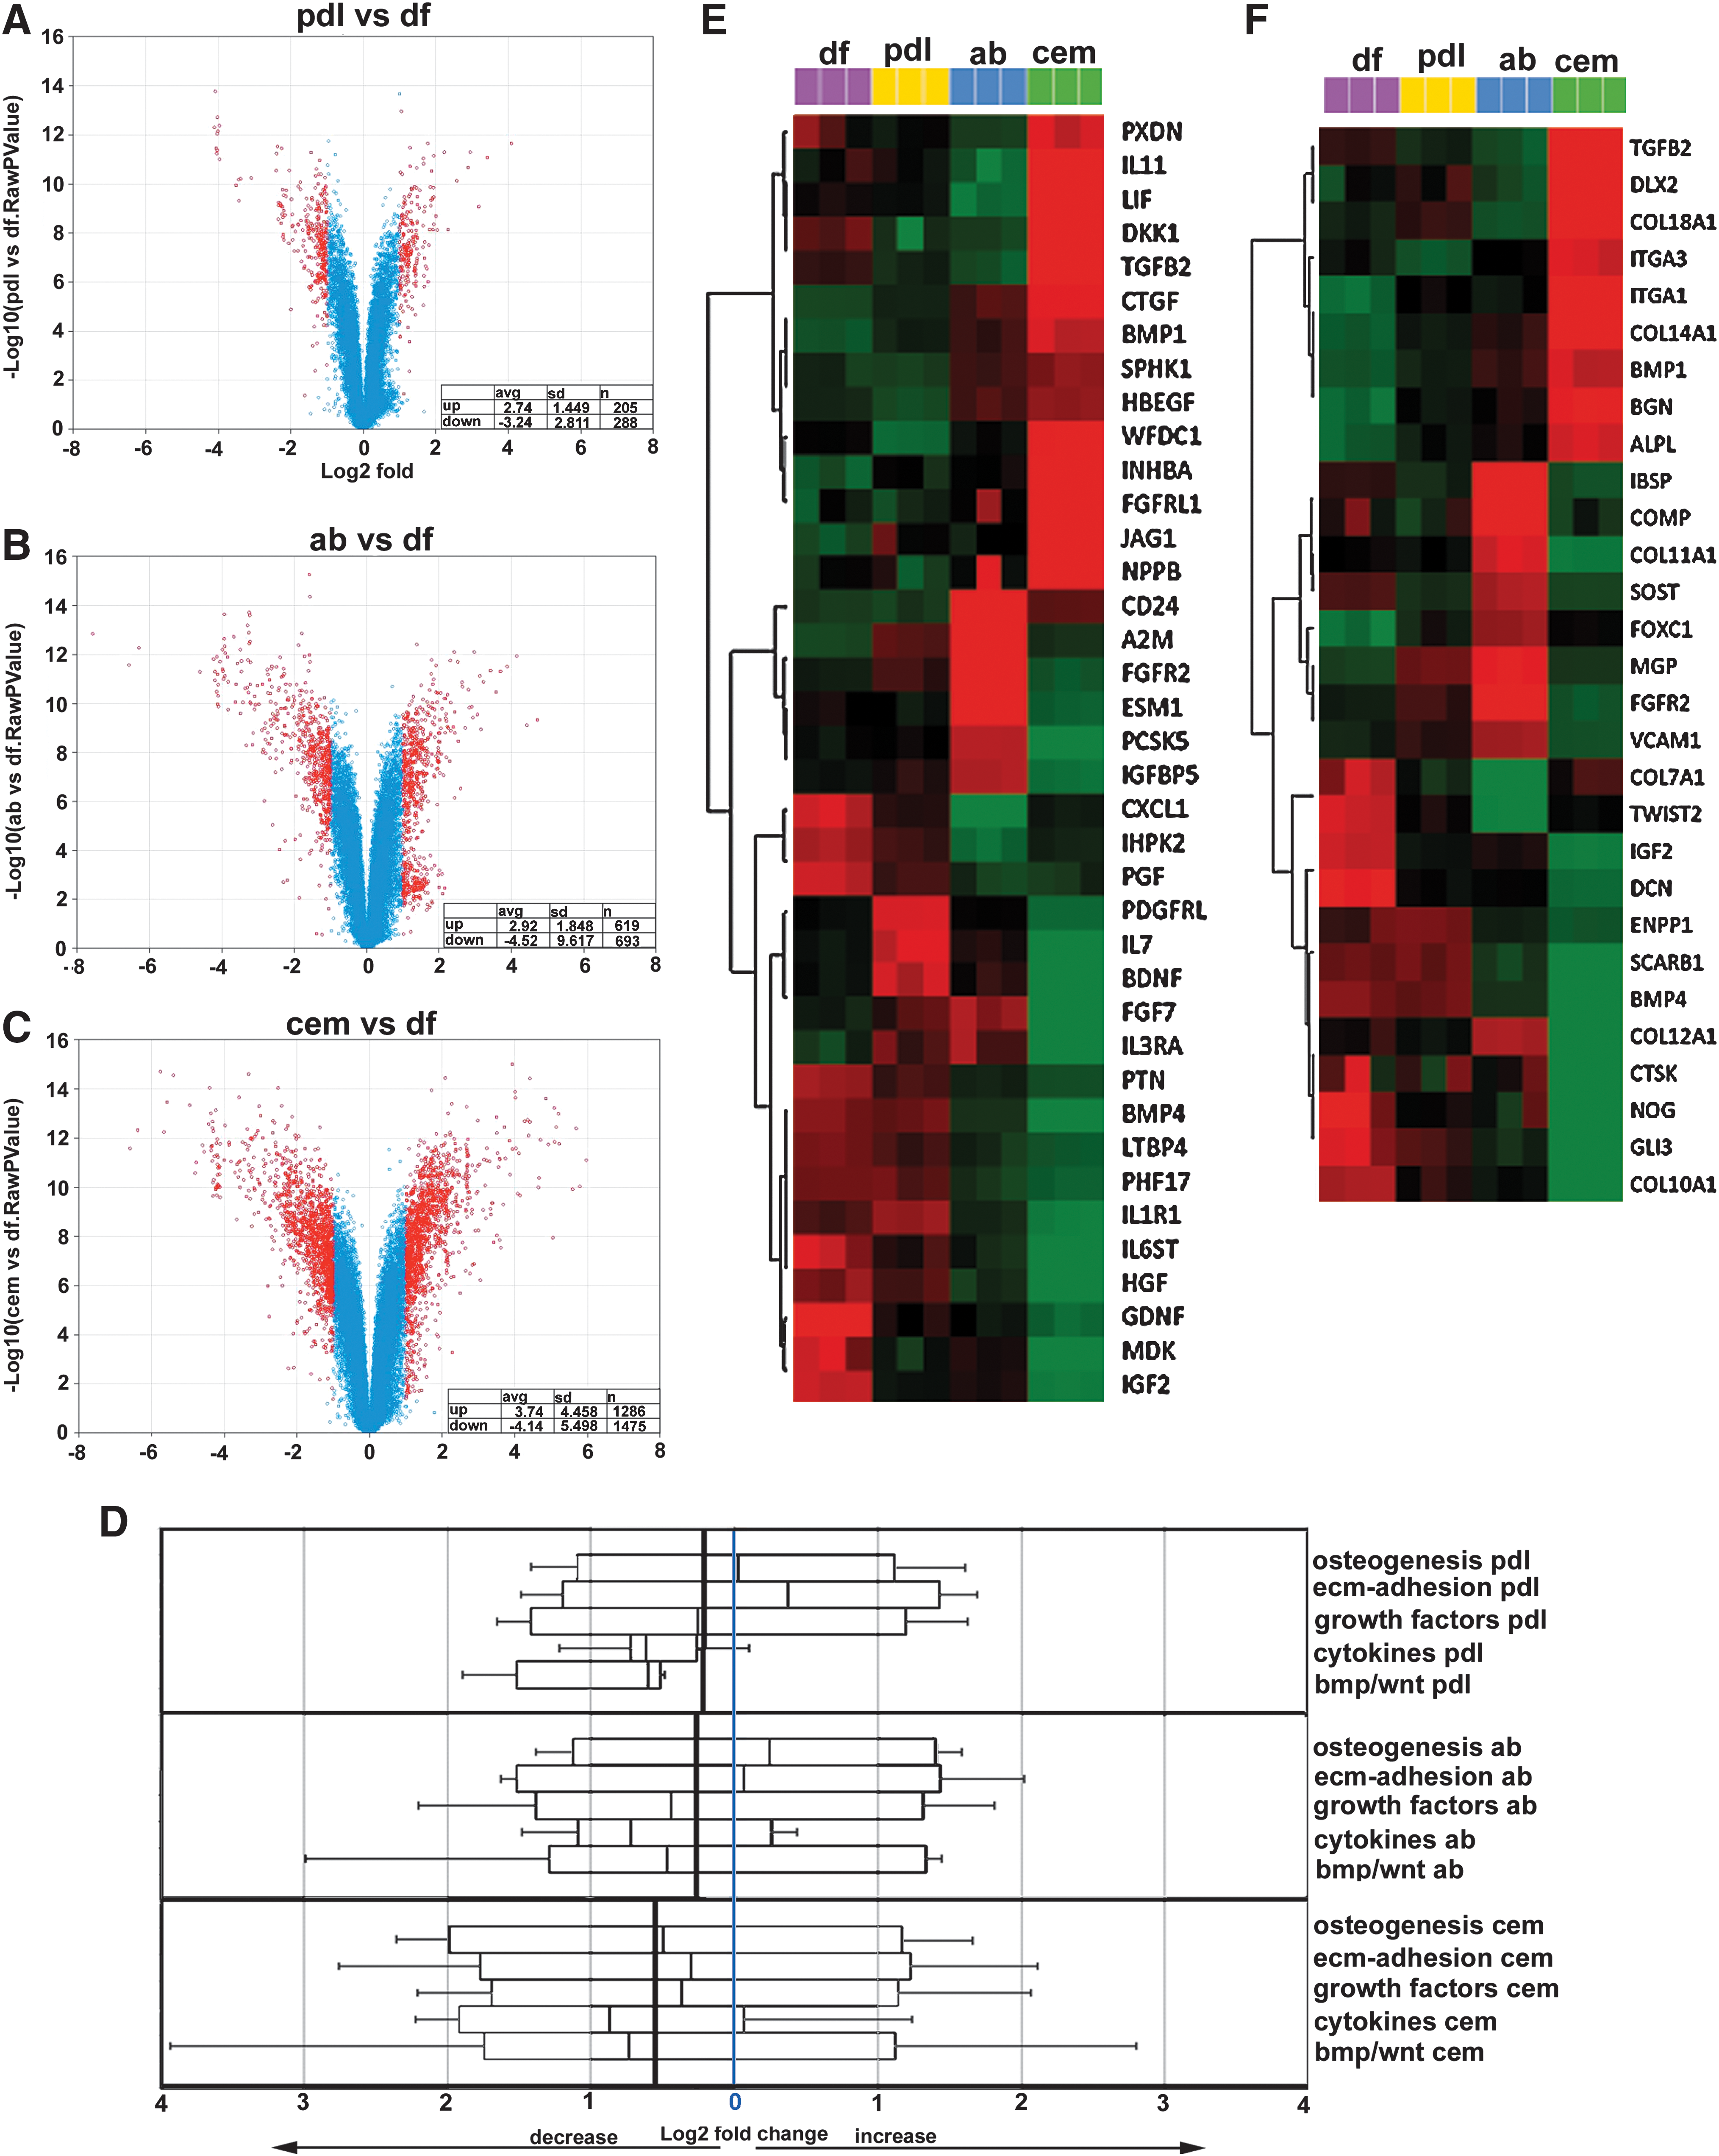
Systems biological comparison between DF progenitor gene expression profiles with derived periodontal lineage expression profiles. Volcano plots facilitated comparisons of global gene expression levels between DF progenitors and PDL cells
When comparing PDL cells to DF progenitors, there was an average increase in the expression levels of significantly altered genes (P < 0.05) by 2.74 (n = 205 genes, SD 1.45) and a corresponding decrease by 3.24 (n = 288 genes, SD 2.81) (Fig. 2A). Changes in gene expression levels are reported as log2 values. In contrast to other progenitor–target population relationships, SDs between PDL cells and DF progenitors were relatively small, indicating a close match between PDL cells and DF progenitor global gene expression profiles (Fig. 2A). When comparing AB osteoblasts to DF progenitors, there was an average increase in the expression levels of significantly altered genes (P < 0.05) by 2.92 (n = 619 genes, SD 1.85) and a corresponding decrease by 4.52 (n = 693 genes, SD 9.61). SDs between AB osteoblasts' and DF progenitors' significant gene expression level changes indicated significant differences between the expression levels of a number of key genes between AB osteoblasts and DF progenitors (Fig. 2B). Finally, when comparing cementoblasts to DF progenitors, there was an average increase in the expression levels of significantly altered genes (P < 0.05) by 3.74 (n = 1,286 genes, SD 4.46) and a corresponding decrease by 4.14 (n = 1,475 genes, SD 5.5) (Fig. 2C). Together, this global gene expression comparison between DF progenitors and cementoblast, AB, and PDL populations indicated that in comparison to DF progenitors, cementoblasts featured the highest number of significantly differently expressed genes, followed by AB osteoblasts and PDL cells. The greatest spread of changes was found between DF gene expression levels and expression levels of downregulated genes in the AB osteoblast group. In comparison to DF progenitors, overall gene expression levels in differentiated periodontal cells were reduced (Fig. 2A–D), indicating that the DF population featured the highest overall levels of gene expression.
ECM adhesion proteins were substantially increased in PDL cells, osteogenesis factors were elevated in AB osteoblasts, and gene expression levels in cementoblasts were generally reduced, as gene ontology analysis revealed
To identify unique pathways characteristic for each differentiated periodontal tissue, we grouped subsets of genes according to a controlled vocabulary of terms using gene ontology searches (
As a result, this gene ontology analysis demonstrated a substantially increased level of ECM adhesion proteins in the PDL cell population, a high number of osteogenesis factors to AB osteoblasts, and generally lower levels of gene expression in the 5 gene ontologies chosen for analysis, especially in the cytokine group, to the cementoblast population. When compared with the DF progenitor population, overall gene expression levels in PDL cells were reduced by 0.362, in AB osteoblasts by 0.461, and in cementoblasts by 1.48, identifying the DF as the most active and the cementoblasts as the most passive cell population in terms of gene expression levels in osteogenesis, ECM adhesion, growth factor, cytokine, and bone morphogenetic protein (BMP)/Wnt gene ontology categories (Fig. 2D).
Heatmaps (cluster dendrograms) for individual changes in gene expression levels between DF progenitors, PDL cells, AB osteoblasts, and cementoblasts identified unique sets of genes characteristic of each cell population (P < 0.05) (Fig. 2E, F). In the growth factor group (Fig. 2E), DF progenitors featured glial cell line-derived neurotrophic factor (GDNF), Midkine also known as neurite growth promoting factor 2 (MDK), insulin-like growth factor 2 (IGF2), chemokine (c-x-c-motif) ligand 1 (CXCL1), and placental growth factor (PGF); PDL cells were characterized by high levels in platelet-derived growth factor receptor-like (PDGFRL), interleukin (IL) 7, and brain derived neurotrophic factor (BDNF); AB osteoblasts uniquely displayed CD24, A2M, fibroblast growth factor receptor 2 (FGFR2), and endothelial cell-specific molecule 1 (ESM1); and cementoblasts expressed high levels of peroxidasin homolog (PXDN), IL11, leukemia inhibitory factor (LIF), Dickkopf1 (DKK1), transforming growth factor beta 2 (TGFB2), connective tissue growth factor (CTGF), bone morphogenetic protein 1 (BMP1), WAP four-disulphide core domain protein 1 (WFDC1), Inhibin beta A (INHBA), fibroblast growth factor receptor-like 1 (FGFRL1), Jagged 1 (JAG1), and brain natriuretic peptide (NPPB). In the osteogenesis/mineralization group (Fig. 2F), DF progenitors featured collagen type VII, alpha 1 (COL7A1), twist-related protein 2 (TWIST2), IGF2, Decorin (DCN), Noggin (NOG), GLI-Kruppel family member GLI3 (GLI3), and collagen type X, alpha 1 (COL10A1); AB osteoblasts unique displayed integrin-binding sialoprotein (IBSP), cartilage oligomeric matrix protein (COMP), collagen type XI, alpha 1 (COL11A1), sclerostin (SOST), matrix Gla-protein (MGP), and fibroblast growth factor receptor 2 (FGFR2); and cementoblasts expressed high levels of transforming growth factor beta2 (TGFB2), Distal-less homeobox 2 (DLX2), collagen type XVIII, alpha 1 (COL18A1), integrin, alpha (ITGA1) and 3, collagen type XIV, alpha1 (COL14A1), biglycan (BGN), and alkaline phosphatase (liver/bone/kidney) (ALPL). A complete set of 30 heatmaps for individual changes in gene expression levels between DF progenitors, PDL cells, AB osteoblasts, and cementoblasts served as a basis for the identification of unique sets of fingerprint/marker genes characteristic of each cell population (Fig. 5).
AB osteoblasts displayed higher overall levels of gene expression than cementoblasts and expressed higher levels of osteogenesis genes, notably MGP, bone sialoprotein, and insulin-like growth factor binding protein 5
Here we have used a systems biological approach to ask whether there are unique molecular characteristics that distinguish the mineralized DF-derived cell populations within cementum and AB from each other (Fig. 3). When comparing cementoblasts to AB osteoblasts, our volcano plot analysis revealed an average increase in the expression levels of significantly altered genes (P < 0.05) by 3.71 (n = 909 genes, 4.6 SD) and a corresponding decrease by 3.82 (n = 1,283 genes, 3.99 SD) (Fig. 3A). Note that SDs are an indication for the level of spread between statistically significantly (P < 0.05) up- or downregulated genes. These numbers highlight the remarkable number of genes downregulated in cementoblasts when compared with AB osteoblasts (1,283 downregulated vs. 909 upregulated), confirming the concept of cementum as a less active tissue.
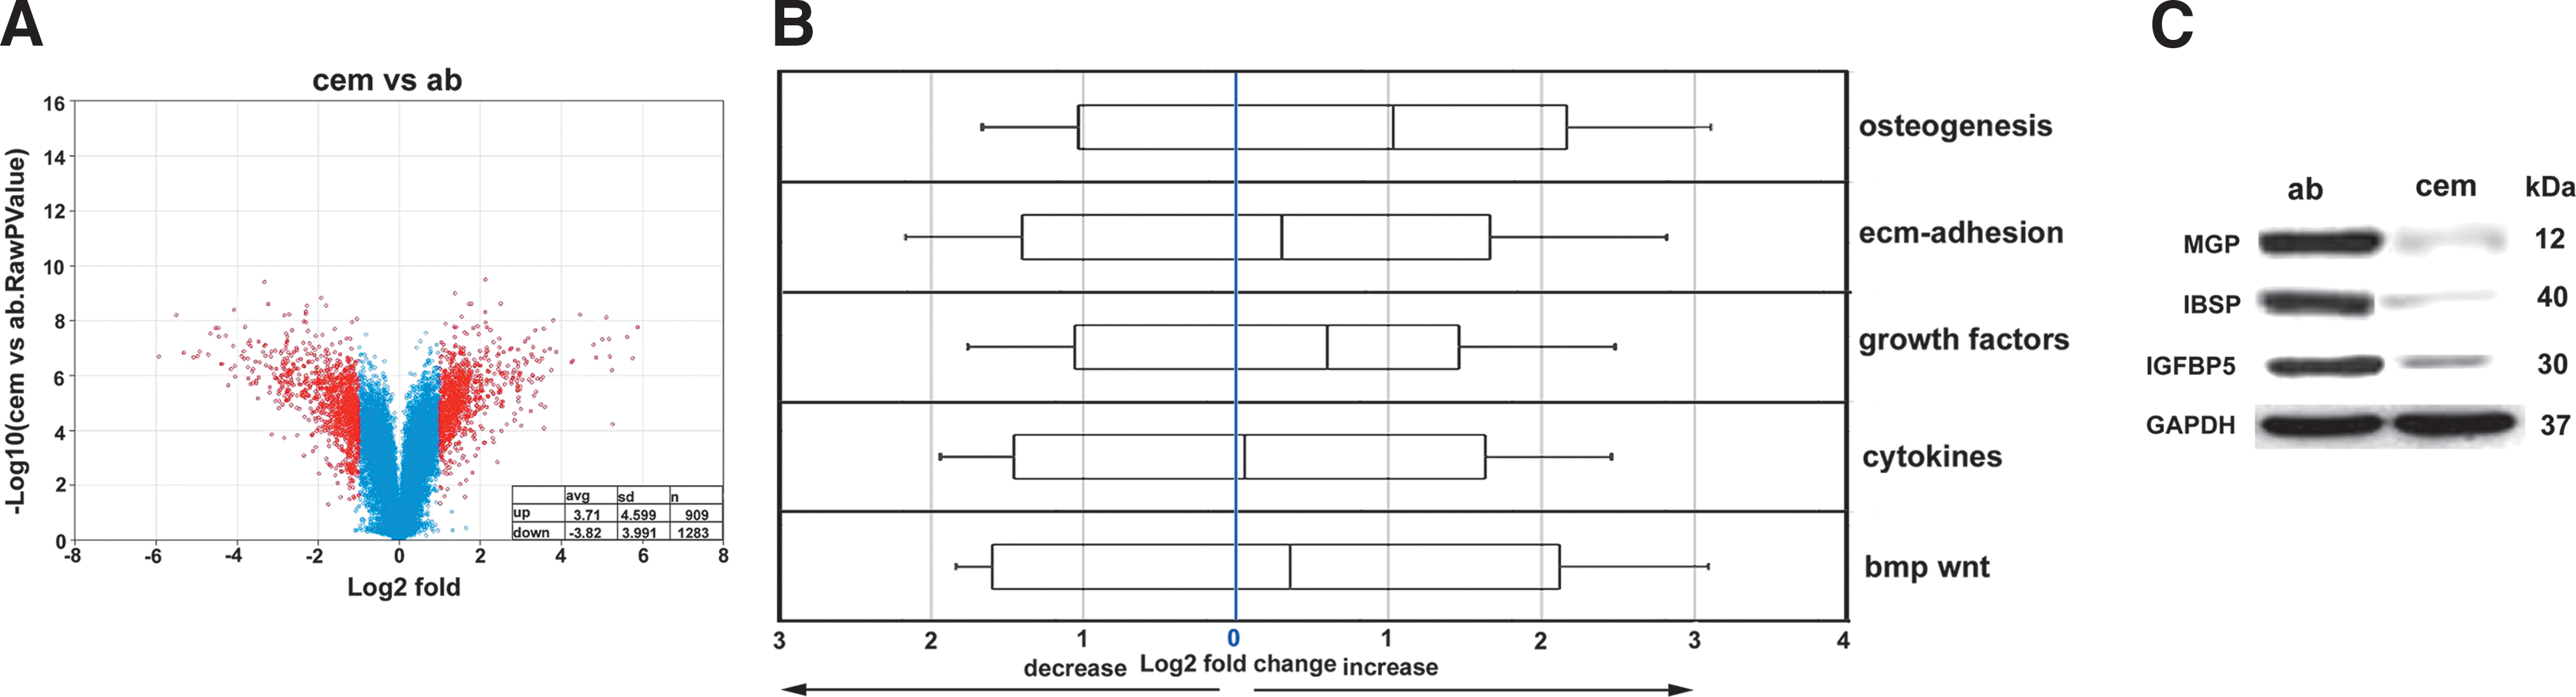
Comparison between periodontal mineralized tissue populations. A volcano plot analysis revealed greatly enhanced numbers of downregulated genes in cementoblasts versus AB osteoblasts
When comparing changes in gene expression between cementoblasts and AB osteoblasts in terms of gene ontology subgroups (see Fig. 3B), AB osteoblast gene expression levels were increased in the osteogenesis group by 2.02, in the ECM adhesion group by 1.23, in the growth factor group by 1.52, in the cytokine group by 1.04, and in the bmp/wnt group by 1.27 (Fig. 3B). These data indicate that while gene expression levels in all 5 gene ontologies examined here were higher in AB osteoblasts compared with cementoblasts, the greatest difference in our study was found in the osteogenesis group.
We then used a western blot approach to compare individual genes and proteins that were differentially expressed between cementoblasts and AB osteoblasts according to our dendrogram microarray analysis (Fig. 3C). Among a number of candidate proteins, MGP, IBSP, and insulin-like growth factor binding protein 5 (IGFBP5) featured high levels of expression in AB osteoblasts vs. cementoblasts. MGP was 14.2-fold higher, IBSP was 25.1-fold higher, and IGFBP5 was 10.2-fold higher in AB osteoblasts compared with cementoblasts (Fig. 3C).
Osteogenic in vitro conditions substantially enhanced global gene expression levels and mineralization potential of AB osteoblasts and cementoblasts
Osteogenic media containing key components such as ascorbic acid, β-glycerophosphate, and dexamethasone stimulate cell differentiation along osteogenic pathways [29,30]. A comparison between AB osteoblasts and cementoblasts treated with osteogenic medium (OM) versus untreated controls stained with alizarin red to detect calcium levels resulted in highly elevated alizarin red level in treated cells, suggesting that standard OM enhance the mineralization potential of both AB osteoblasts (21.2-fold) and cementoblasts (14.1-fold) compared with the untreated controls (Fig. 4A). Volcano plot analysis for shifts in gene expression levels in significantly higher or lower expression genes (P < 0.05) revealed a general trend toward higher expression, especially in the osteogenesis group (Fig. 4D, E). Specifically, OM-treated AB osteoblasts featured an average increase in the expression levels of significantly altered genes (P < 0.05) by 5.77 (n = 1,268 genes) and a corresponding decrease by 3.02 (n = 724 genes) (Fig. 4D). In contrast, OM-treated cementoblasts featured an average increase in the expression levels of significantly altered genes (P < 0.05) by 3.41 (n = 950 genes) and a corresponding decrease by 3.21 (n = 1,042 genes) (Fig. 4E).
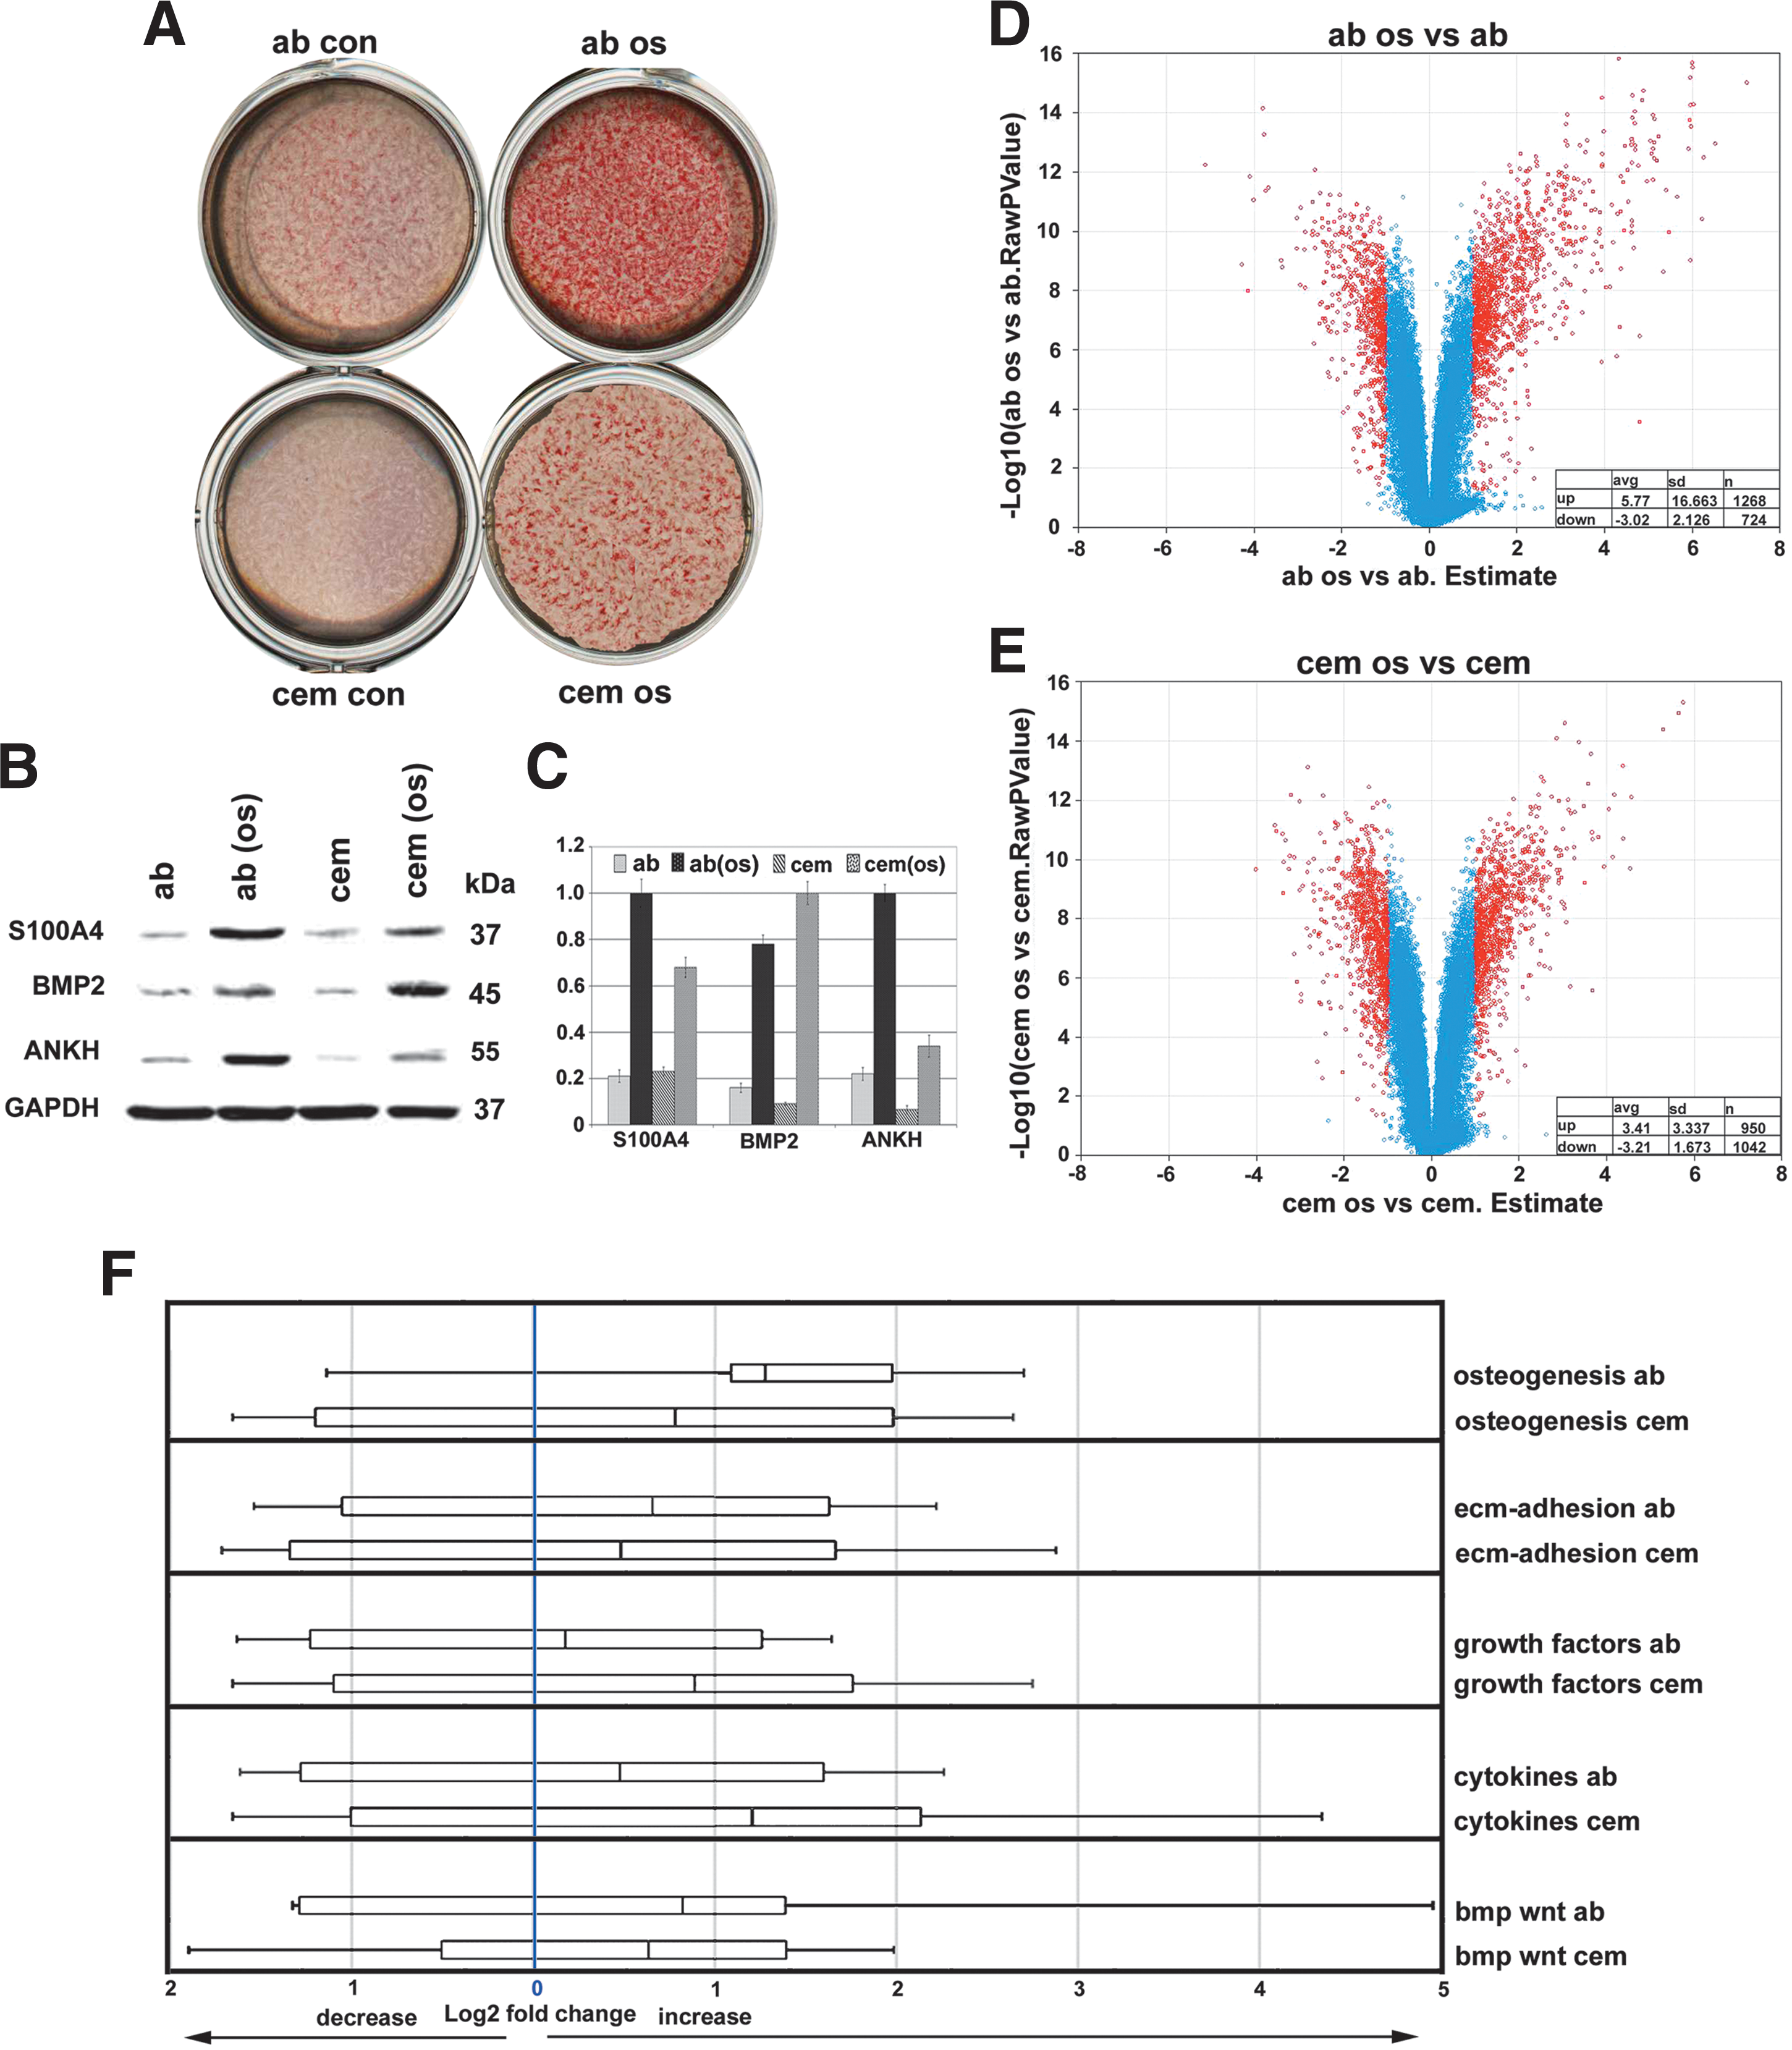
Effect of mineralizing in vitro culture conditions on periodontal mineralized tissue cell behavior and gene expression. Osteogenic medium containing β-glycerolphosphate and ascorbic acid enhanced the mineralized status of both AB osteoblast and cementoblast cultures as documented by high levels of alizarin red stain (ab os vs. ab con, and cem os vs. cem con)
When comparing unique gene ontology subgroups, OM-treated AB osteoblast gene expression levels were increased in the osteogenesis group by 2.41, in the ECM adhesion group by 1.58, in the growth factor group by 1.13, in the cytokine group by 1.4, and in the bmp/wnt group by 1.77, whereas OM-treated cementoblast gene expression levels were increased in the osteogenesis group by 1.72, in the ECM adhesion group by 1.4, in the growth factor group by 1.84, in the cytokine group by 2.29, and in the bmp/wnt group by 1.55 (Fig. 4F). Thus, in general, osteogenic culture conditions resulted in increased gene expression of both AB osteoblasts and cementoblasts. In addition, our whisker plot analysis indicated elevated cementoblast gene expression levels above those of AB osteoblasts in the cytokine and growth factor group (Fig. 4F).
We then asked how mineralization pathway induction affected individual genes and proteins. A dendrogram comparison yielded 3 unique genes/proteins that were subjected to western blot analysis, including S100 calcium binding protein A4 (S100A4), bone morphogenetic protein 2 (BMP2), and progressive ankylosis protein homolog (ANKH). The western blots in Fig. 4B and C demonstrate that osteogenic culture conditions increased all 3 proteins, S100A4, BMP2, and ANKH, both in AB osteoblasts and in cementoblasts, with S100A4 and ANKH more upregulated in AB osteoblasts and BMP2 more affected by osteogenic conditions in cementoblasts.
Unique molecular signatures for DF progenitors, AB osteoblast, and cementoblast populations
Microarray analysis followed by western blot verification was performed to identify unique signature genes for periodontal cell populations. Western blots indicated that there was no individual protein that was completely absent from any one of the 4 progenitor populations studied here or exclusively expressed in one population and not in another. Nevertheless, we were able to assign signature combinations of genes that were preferentially expressed in each of the 4 populations of periodontal cells (Fig. 5A–D). Our western blot analysis identified IL6, paired-like homeodomain transcription factor (PITX2), thrombospondin 2 (THBS2), and GDNF as signature protein indicators for DF progenitors; asporin (ASPN) and prostaglandin-H2 D-isomerase (PTGDS) as signature protein indicators for AB osteoblasts; and keratin 18, netrin 4, JAG1, and Dkk1 as markers for cementoblasts. In addition, secreted frizzled-related protein 1 (SFRP1) levels were higher in PDL cells compared with the other 3 lineages (Fig. 5A). Table 1 summarizes all differences between these 4 periodontal cell populations that were identified in this study.
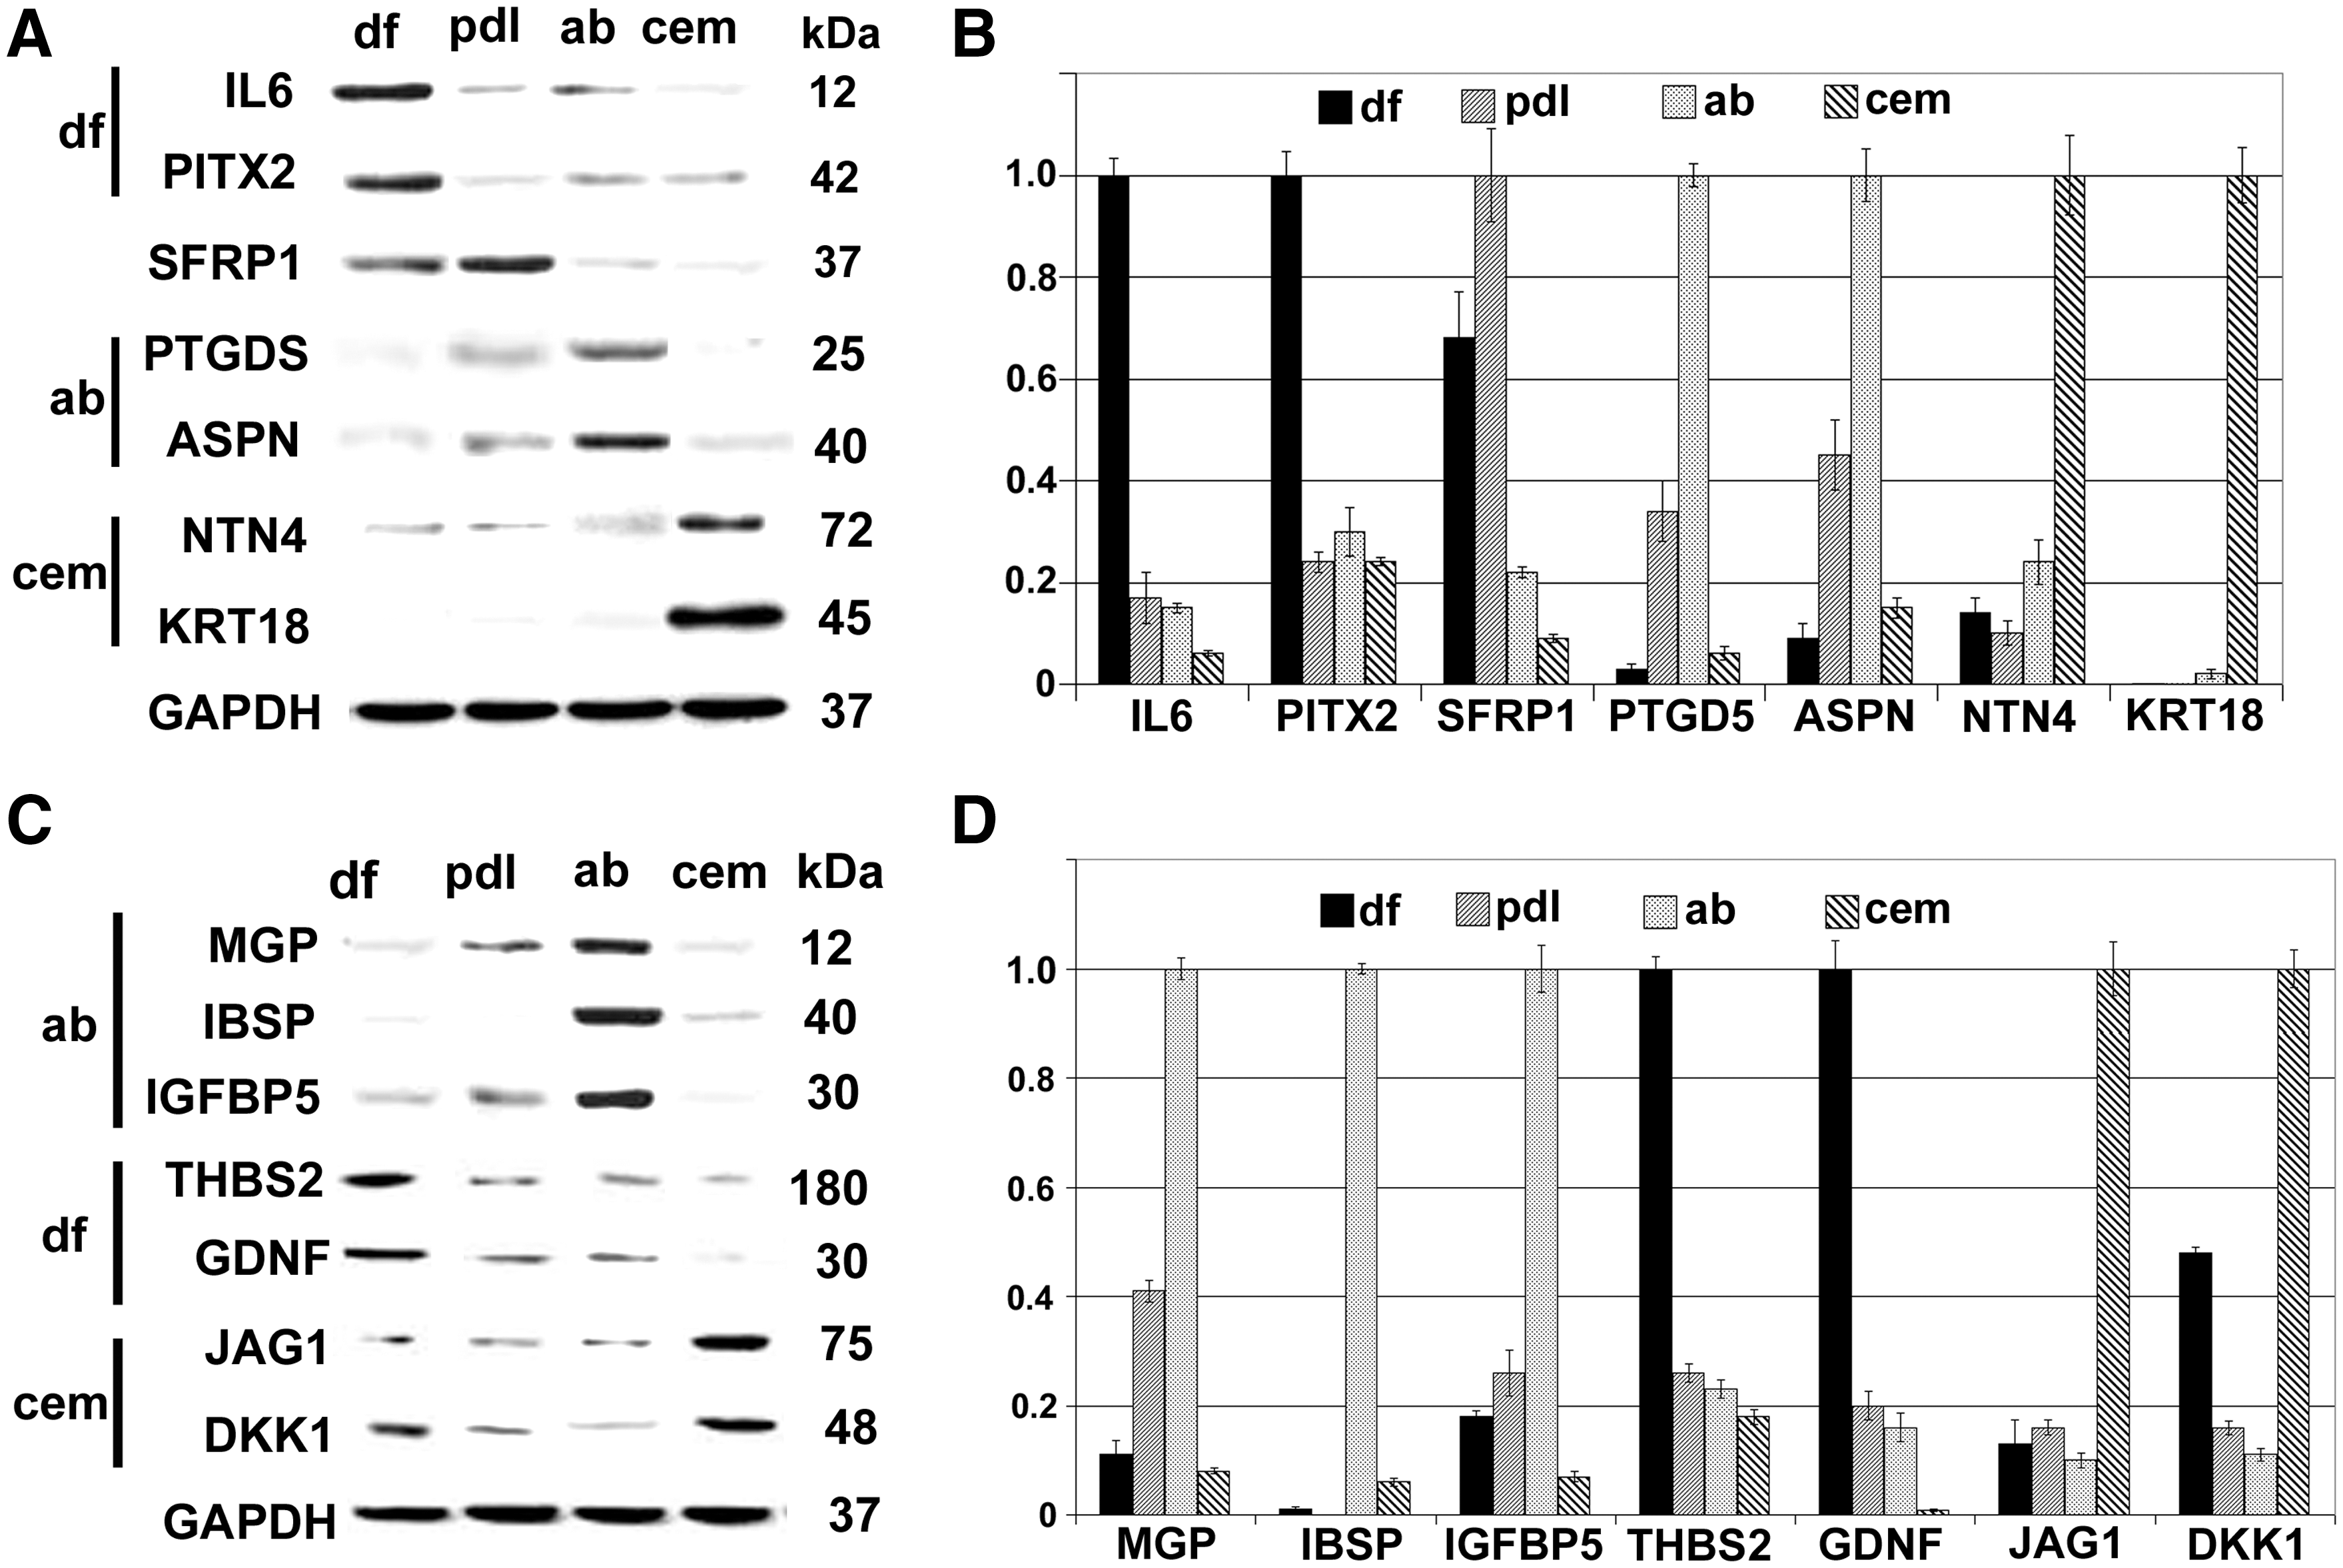
Signature gene expression patterns of DF progenitors and PDL, AB, and cementoblast lineages. Western blot comparisons
Five + 's indicate high levels and a single + indicates low levels. Δ is a measure for the relative distance from dental follicle progenitor expression profiles as revealed in our volcano plot comparison (Fig. 2).
ASPN, asporin; AB, alveolar bone; DF, dental follicle; DKK, Dickkopf1; GDNF, glial cell line-derived neurotrophic factor; IL, interleukin; JAG1, Jagged 1; PDL, periodontal ligament; PTGDS, prostaglandin-H2 D-isomerase; PTIX2, paired-like homeodomain transcription factor; SFRP1, secreted frizzled-related protein 1; THBS2, thrombospondin 2; ↑, increase; ↓, decrease.
Switch from the euchromatin marker H3K4me3 to the transcriptional repressor H3K9me3 during differentiation of DF progenitors into PDL cells, AB osteoblasts, and cementoblasts
Here we have used the euchromatin marker H3K4me3 [31] and the transcriptional repression marker H3K9me3 [32] to ask whether changes in epigenetic landscape could contribute to the differentiation of periodontal lineages. Our western blot analysis demonstrated high levels of the transcription repressor marker H3K9me3 and a lack of the euchromatin marker H3K4me3 in the periodontal lineages PDL cells (both early and late stage), AB osteoblasts, and cementoblasts (Fig. 6A, B). In contrast, the euchromatin marker H3K4me3 was prominent in ES cells as well as early and late stage DF progenitors, whereas there was a dearth of H3K4me3 in differentiated periodontal lineages (PDL cells, AB osteoblasts, and cementoblasts; Fig. 6A, B). In addition, the balance between H3K4me3 and H3K9me3 shifted from early stage to late stage DF populations, with a 4:1 H3K4me3 to H3K9me3 ratio in early stage DF progenitors and a 2.5:1 H3K4me3 to H3K9me3 ratio in mature DF progenitors (Fig. 6A, B). Inductive culture conditions, including exposure to OM and growth factor combinations (CTGF and fibroblast growth factor 2 [FGF2]) [21], resulted in a switch from high levels of the euchromatin marker H3K4me3 to high levels of the transcriptional repressor H3K9me3 in DF cultures (Fig. 6C, D), mirrored by low levels of H3K9me3 before induction (osteogenic and growth factor, respectively) and H3K4me3 after induction. In a control experiment, the CTGF/FGF2 growth factor combination resulted in an increase in periostin, whereas OM increased both osteocalcin and periostin levels (Fig. 6C, D). Western blot findings on epigenetic marks in periodontal lineages were verified using immunofluorescence (Fig. 6E). Micrographs were taken at identical conditions, including antibody concentration, washing times, magnification, and exposure conditions. There was strong immunofluorescence for the euchromatin marker H3K4me3 in DF progenitors, while the transcriptional repressor H3K9me3 was preferentially detected in differentiated periodontal lineages of PDL, AB, and cementum. The H3K4me3/H3K9me3 switch was somewhat less pronounced in AB osteoblasts with a basal level of H3K4me3 and a slightly reduced level of H3K9me3 fluorescence, but also here signals for the transcriptional repressor H3K9me3 were stronger that those for the euchromatin marker H3K4me3 (Fig. 6E).
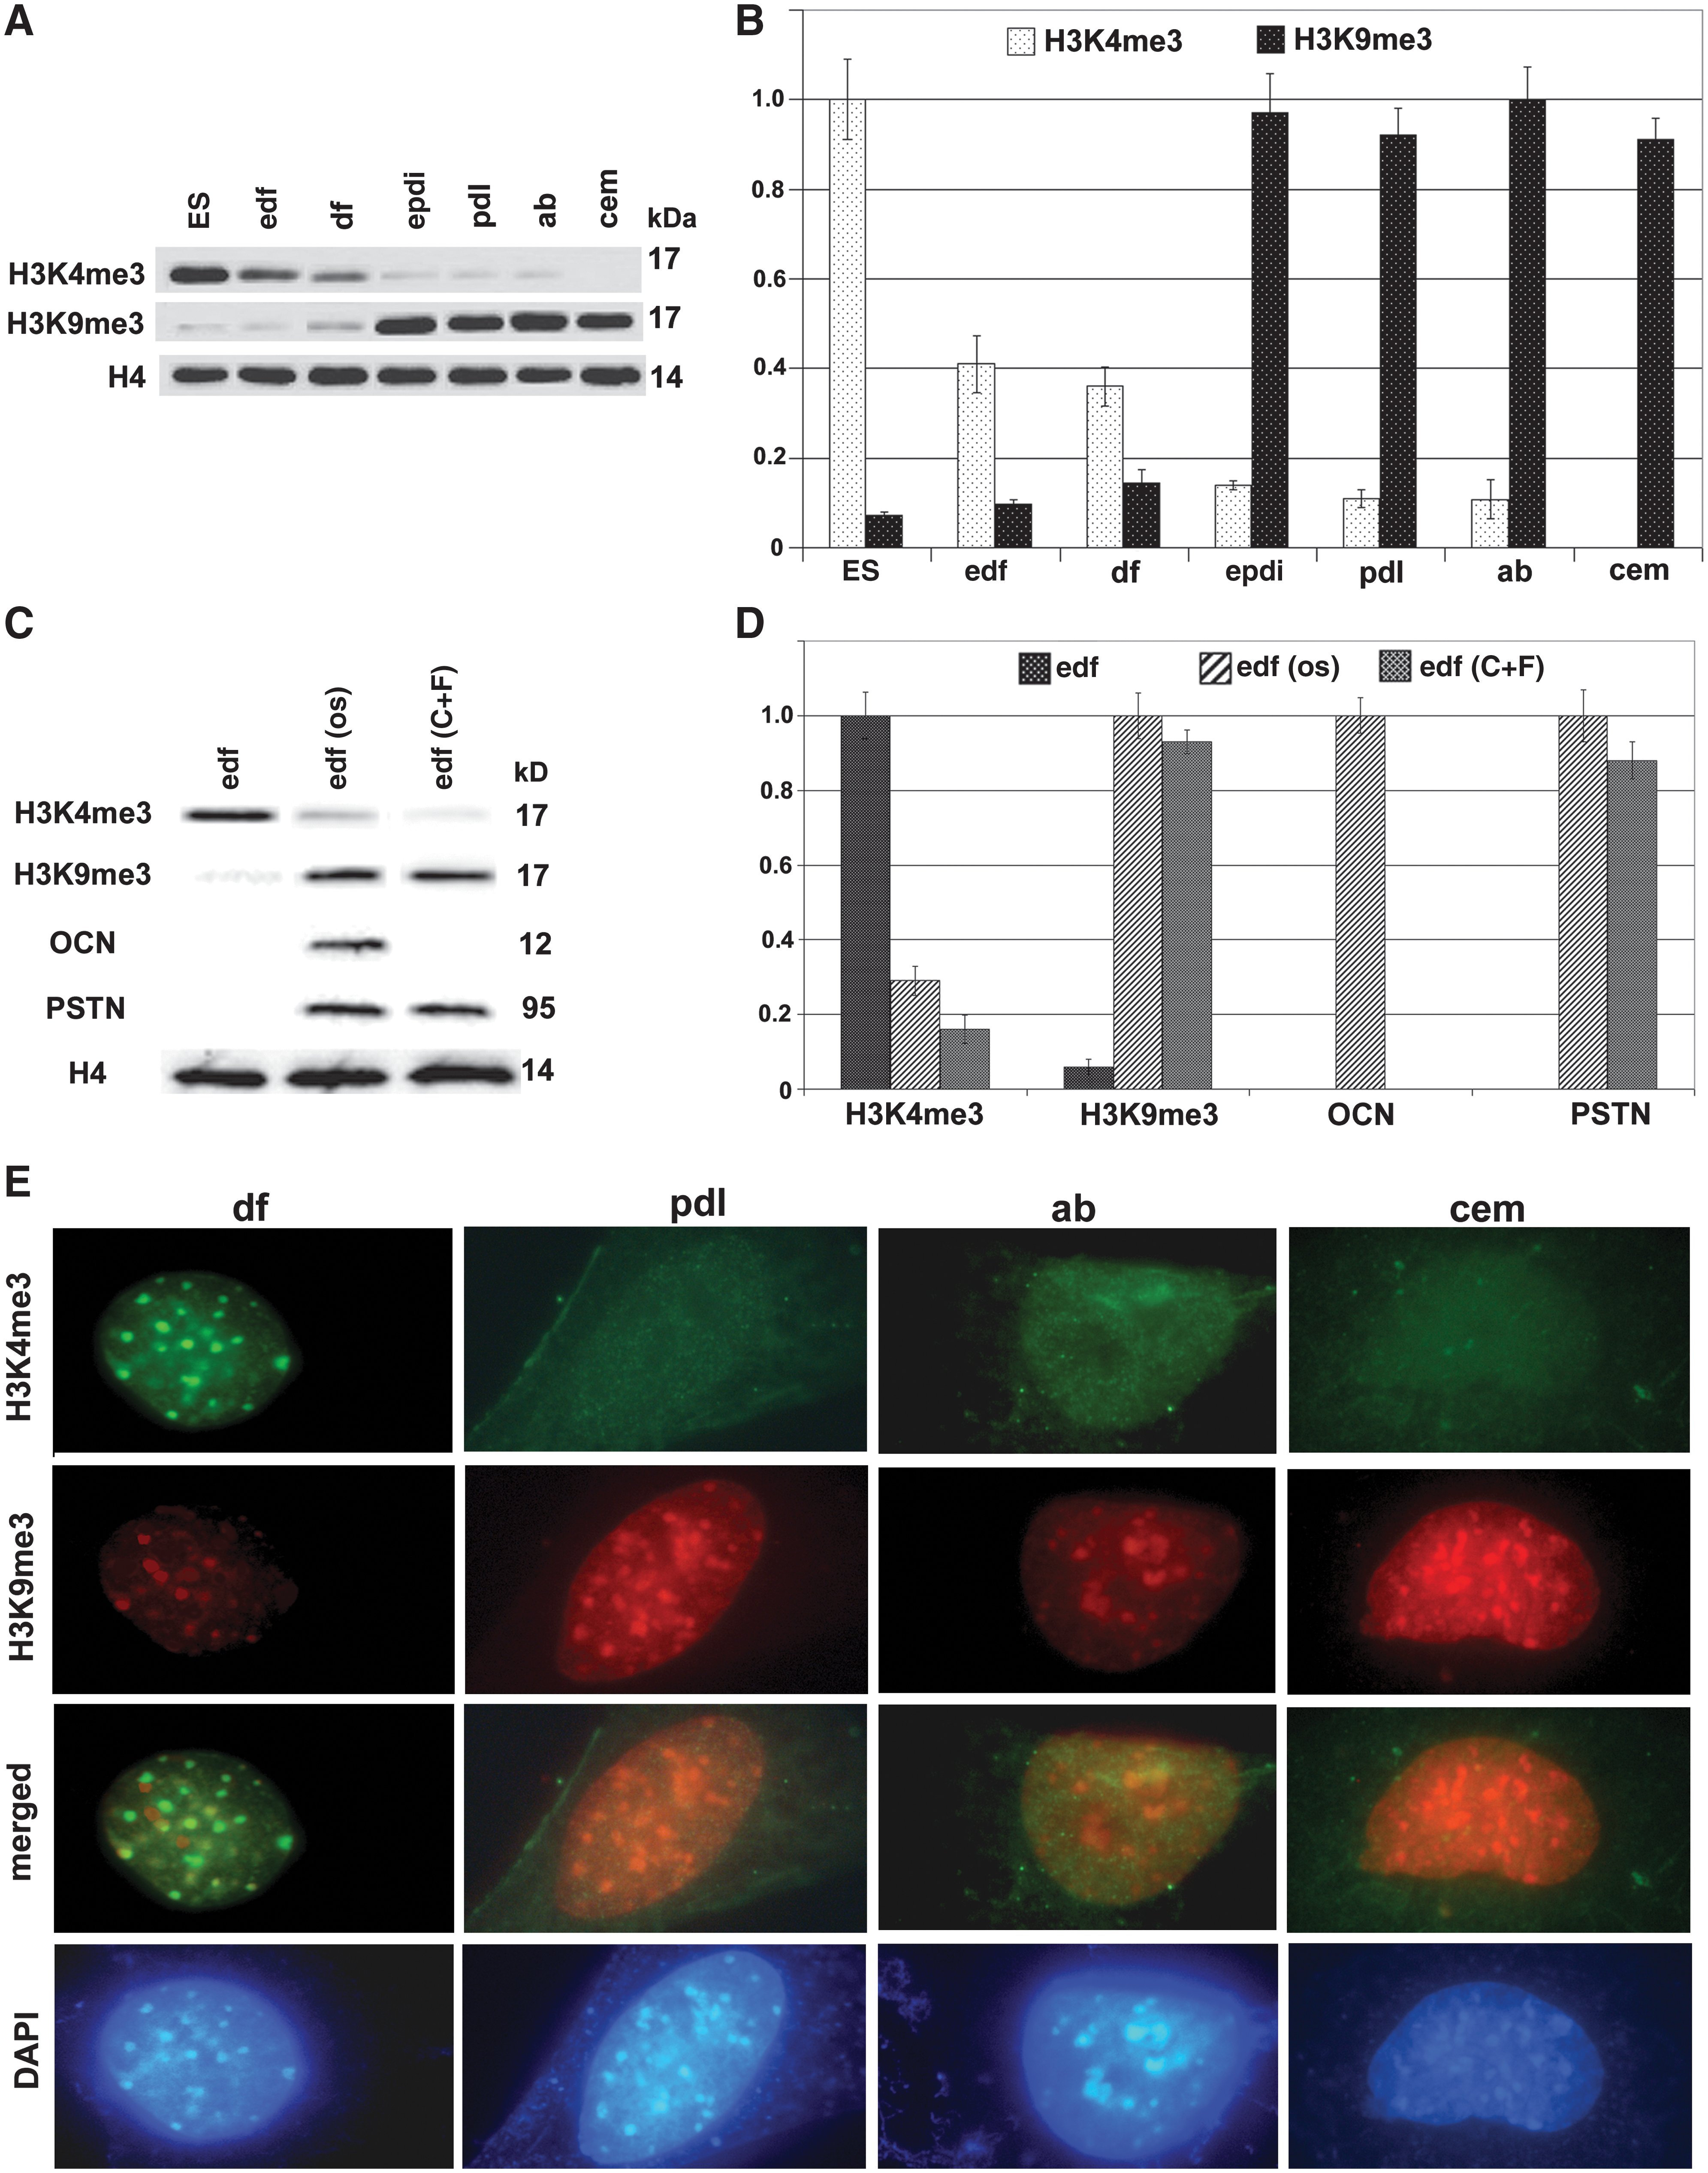
Epigenetic marks in periodontal lineage differentiation. Western blot comparisons
Discussion
Here we have presented a comprehensive characterization of the differentiation of AB osteoblasts, cementoblasts, and PDL cells from neural-crest-derived DF progenitors using a number of stoichimetric, epigenetic, molecular, and cellular approaches. Our analysis of microarray-derived expression levels indicates that the differentiation of periodontal tissue cell populations from neural-crest-derived intermediate progenitors involves not only changes in key marker genes, but also significant changes in gene cohort expression levels, shifts in global gene expression levels, epigenetic modifications, and changes in cellular parameters that contribute to the individuation of differentiated lineages from a common neural-crest-derived ancestor (Table 1). The unique emphasis on an in vitro comparison of primary cultured cells allowed us to focus on the cells themselves that reside within the ECMs of the periodontium and to distinguish between their individual gene expression profiles. While our focus on in vitro studies allowed us to discriminate between individual lineages, actual tissue comparisons might reveal marker profiles that are different from the lineage marker identified here.
Our epigenetic data indicated that differentiation of periodontal lineages from DF intermediaries involved a loss of the euchromatin marker H3K4me3 and elevated levels of the transcriptional repressor H3K9me3. This switch in methylation state was observed when comparing DF progenitors with differentiated periodontal lineages, PDL cells, AB osteoblasts, and cementoblasts, and also when comparing developing and differentiated DF tissues either during different developmental progression or after differentiation induction. The euchromatin marker H3K4me3 has been associated with active chromatin and gene expression [33,34], while H3K9me3 methylation has been shown to correlate with transcriptional repression and serve as a specific binding site for the heterochromatin protein 1 [35]. The unique correlation between active chromatin in the intermediary progenitor DF and transcriptional repression in periodontal populations suggests that periodontal lineages differentiate from stem cell-like DF intermediary progenitors via epigenetic restriction of potentialities through a switch from open euchromatin to constitutive heterochromatin [36] translating into increased recruitment of methyltransferases and increased silencing.
Analyses of global expression profiles and gene ontologies indicated close similarities between all 4 periodontal cells, with PDL cells most closely resembling DF progenitors and cementoblasts representing the most different population. Moreover, PDL cells and AB osteoblasts were remarkably similar, suggesting that AB osteoblasts are so closely related to PDL cells and that a simple change in mineralization conditions might be the causative trigger to turn PDL cells into AB osteoblasts. The concept of AB as a mineralized pendant to the PDL has been supported by studies showing a dramatic increase in bone marker expression, including osteocalcin and bone sialoprotein, after addition of BMP2 to PDL fibroblasts [37], and a mineralization induction in PDL cells as a result of mineralizing in vitro conditions [38].
In previous studies, we have identified the DF as a progenitor population for the 3 periodontal lineages PDL cells, AB osteoblasts, and cementoblasts [3,7]. In support of this role, we show here that DF progenitor populations were distinguished from PDL cells, AB osteoblast, and cementoblast populations by a switch from the euchromatin marker H3K4me3 to the transcriptional repressor H3K9me3, suggesting that trimethylation of H3K9 by methyltransferases is an important event during the differentiation of periodontal tissues [39]. Four DF signature proteins were identified using our gene ontology and genome-wide comparisons and verified by western blot, including the inflammatory mediator IL6, PITX2, THBS2, and GDNF. While the tissue-specific function of some of these proteins remains to be discovered, PITX2 has been shown to prevent the osteoblastic differentiation of myoblasts [40], a function that might be an important step in the odontogenic lineage differentiation of periodontal progenitors from common neural crest origins.
Genome-wide expression comparison identified the Wnt-antagonist SFRP1 [41] as a gene of preferred expression in PDL cells. Supportive of its role in the nonmineralized PDL, SFRP1 has been associated with bone loss and reduced mineral density [42]. SFRP1 was only 1.53-time higher in PDL cells compared with DF progenitors on western blots, whereas there were SFRP1 baseline levels in AB and cementum, prompting us to identify SFRP1 as a protein of preferred expression in PDL cells instead of calling it a marker or signature protein. In contrast, genome-wide comparisons revealed that AB osteoblasts were characterized by substantially enhanced levels of ASPN, and PTGDS. While no leads were found for PTGDS, which was also expressed in PDL cells, ASPN has been shown to promote osteoblast collagen mineralization and calcium binding [37,43]. In addition, gene ontology comparisons identified 3 other AB signature genes, including the well-known bone proteins MGP and IBSP [44 –46] as well as IGFBP5, which has been associated with osteoblast proliferation [47,48] and increased bone matrix production [49].
In contrast to the other 3 periodontal cell populations, cementoblasts were remarkably different from their counterparts, including AB osteoblasts. The overall different behavior of root cementum when compared with other periodontal tissues was previously established in a study demonstrating the susceptibility of cementum to a lack of alkaline phosphatase [50] and changes in extracellular pyrophosphate levels [51]. Moreover, in comparison to AB osteoblasts, cementoblasts were characterized by a number of unique signature genes, including the chemoattractant Netrin 4, the intermediate filament keratin 18, the notch signaling mediator JAG1, and Dkk1. Netrins have been associated with the neural regulation of bone metabolism [52], which might be of relevance in cementogenesis in light of the significant innervation in the periphery of Hertwig's epithelial root sheath [53]. Dkk1 is a negative regulator of the Wnt signaling pathway [54,55] and might be associated with the reduced gene expression levels in cementum. A role of the Wnt signaling pathway in cementogenesis through differentiation inhibition and by promoting proliferation has been proposed in earlier studies [56]. Remarkably, JAG1-mediated Notch activation induces epithelial-to-mesenchymal transition through Slug-induced repression of E-cadherin [57], which might play a role in the slow reduction of Hertwig's epithelial root sheath (HERS) cells in the periodontal region over time [53]. In addition, Notch-mediated repression of E-cadherin results in resistance to anoikis [57], which might be important for cementoblast survival in the avascular cementum matrix. Finally, increased levels of keratin 18 in cementogenesis might be either due to entrapped HERS cells as part of the cultured cell population or a unique differentiation shift of cementoblasts.
Footnotes
Acknowledgments
Generous support for these studies by NIDCR grant DE15425 is gratefully acknowledged. Dr. Kevin White's group at the University of Chicago gracefully provided support for microarray analyses of periodontal lineages.
Author Disclosure Statement
No competing financial interests exist.
References
Supplementary Material
Please find the following supplemental material available below.
For Open Access articles published under a Creative Commons License, all supplemental material carries the same license as the article it is associated with.
For non-Open Access articles published, all supplemental material carries a non-exclusive license, and permission requests for re-use of supplemental material or any part of supplemental material shall be sent directly to the copyright owner as specified in the copyright notice associated with the article.