




Abstract
The Hox family are master transcriptional regulators of developmental processes, including hematopoiesis. The Hox regulators, caudal homeobox factors (Cdx1-4), and Meis1, along with several individual Hox proteins, are implicated in stem cell expansion during embryonic development, with gene dosage playing a significant role in the overall function of the integrated Hox network. To investigate the role of this network in normal and aberrant, early hematopoiesis, we employed an in vitro embryonic stem cell differentiation system, which recapitulates mouse developmental hematopoiesis. Expression profiles of Hox, Pbx1, and Meis1 genes were quantified at distinct stages during the hematopoietic differentiation process and compared with the effects of expressing the leukemic oncogene Tel/PDGFRβ. During normal differentiation the Hoxa cluster, Pbx1 and Meis1 predominated, with a marked reduction in the majority of Hox genes (27/39) and Meis1 occurring during hematopoietic commitment. Only the posterior Hoxa cluster genes (a9, a10, a11, and a13) maintained or increased expression at the hematopoietic colony stage. Cdx4, Meis1, and a subset of Hox genes, including a7 and a9, were differentially expressed after short-term oncogenic (Tel/PDGFRβ) induction. Whereas Hoxa4-10, b1, b2, b4, and b9 were upregulated during oncogenic driven myelomonocytic differentiation. Heterodimers between Hoxa7/Hoxa9, Meis1, and Pbx have previously been implicated in regulating target genes involved in hematopoietic stem cell (HSC) expansion and leukemic progression. These results provide direct evidence that transcriptional flux through the Hox network occurs at very early stages during hematopoietic differentiation and validates embryonic stem cell models for gaining insights into the genetic regulation of normal and malignant hematopoiesis.
Introduction
E
The HOX network is comprised of the clustered class I homeobox genes, which encode master regulators of development. The mammalian 39 Hox genes are evolutionarily highly conserved and appear to have arisen by a process of duplication and divergence from a primordial gene (reviewed by Duboule [6]). Mammalian Hox genes are located as up to 13 paralogs within 4 clusters (A, B, C, and D) on separate chromosomes (7, 17, 12, and 2, in human; 6, 11, 15, and 2, in mouse). During embryonic development Hox genes are expressed sequentially (3′–5′) along the anterior-posterior axis, with 3′ genes such as Hoxa1 expressed earlier and more anteriorly than 5′ genes, such as Hoxa13 [7,8]. Deregulated Hox expression at the individual gene level tends to result in subtle phenotypic changes, most likely due to a high level of redundancy built into the network.
Hox expression during definitive hematopoiesis has been relatively well studied in both mouse and human with the majority of the Hox genes being expressed predominantly in the hematopoietic stem/progenitor cell (HSPC) compartment. Hox gene expression appears linked to and may specify in part hematopoietic lineage and stage of differentiation. In particular, the A and B clusters, which are preferentially expressed in the most primitive hematopoietic cells, exhibit reduced expression after lineage commitment (reviewed by Argiropoulos and Humphries [9]). Such observations led to the hypothesis that self-renewal of HSPCs is Hox dependent and that inappropriate Hox expression observed in myeloid leukemias underlies maintenance of the leukemia-initiating cell [10,11]. The role of Hox genes in hematopoiesis has also been studied using gene-targeting strategies. Both gain-of-function and loss-of-function mutants have provided insight into the role of individual Hox genes in hematopoiesis. Ectopic expression of Hoxa9 results in increased HSPC self-renewal that results in acute leukemia with a long latency [12,13], whereas overexpression of Hoxb4 results in stem cell expansion in the absence of overt leukemia [14 –16]. Similarly, Hoxa9-deficient mice display a dramatic phenotype consistent with reduced HSPC self-renewal [17,18], whereas Hoxb4-deficient mice are normal [19]. The difference in phenotype between these 2 models may be related to the significantly higher expression of Hoxa9 than that of Hoxb4 in normal HSPCs [18].
Several studies have implicated aberrant regulation of the Cdx family and the Hoxa and Hoxb clusters in myeloid malignancies especially acute myeloid leukemia (AML) [20,21]. However, a role for Hox genes in myeloproliferative neoplasms (MPN) has not been clearly defined. The t(5:12)(q33;p13) translocation, identified in a subset of patients with the MPN chronic myelomonocytic leukemia, fuses an Ets-related transcription factor (Tel) to the PDGFRβ gene, producing the Tel/PDGFRβ (TP) tyrosine kinase-active fusion protein [22]. Previous studies using tetracycline (Tet)-regulated expression of TP recapitulated observed findings for TP+ patient samples, in particular alterations in the hematopoietic transcriptional network that drives myelomonocytic differentiation [23,24]. In this study, we have employed a previously established hematopoietic differentiation model [5] to determine the Hox transcriptional profile during primitive and more definitive hematopoietic commitment. The effects of the leukemic oncogene on this gene signature were then examined to determine how perturbed myelopoiesis alters the Hox network. Cells were collected at key stages during hematopoietic differentiation along the mesodermal-hemangioblast-hematopoietic axis for quantitative expression profiling. Our results clearly demonstrate transcriptional flux through the Hox network and regulation of specific Hox subsets during hematopoietic differentiation of ES cells, with specific changes observed in our leukemic model. These findings are consistent with a combination of global regulation of Hox clusters and targeted regulation of individual Hox genes (or subsets) during hematopoietic commitment. This study highlights that transcriptional fluxes in the Hox network play a role in deregulation of myelopoiesis in MPN.
Materials and Methods
Hematopoietic differentiation of ES cells and ES-TP clones
Hematopoietic differentiation was performed as previously described [5]. Primary EBs were generated from single-cell suspensions of ES parental cells or ES-TP clones in the presence or absence of 500 μg/mL Tet. Cell were plated at 1 × 10⁴/mL in low adhesion Petri dishes in the following basal media: 1% methylcellulose (Sigma-Aldrich Technologies), 1× Iscove's modified Dulbecco's medium (IMDM) (Invitrogen Life Technologies), 100 μg/mL holo-transferrin, 10 μg/mL insulin, 10−4 M 2-Mercaptoethanol, 50 μg/mL ascorbic acid (Sigma-Aldrich Technologies), 15% fetal calf serum (FCS; Invitrogen Life Technologies) supplemented with the following growth factors to promote good mesodermal differentiation, 10 ng/mL bone morphogenetic protein-4 (BMP-4; R&D Systems Ltd., Abingdon), 2 ng/mL Activin A, and 10 ng/mL basic fibroblast growth factor (bFGF; PeproTech™). After 3.75 days in culture EBs were harvested, washed ×3 with phosphate-buffered saline (PBS), and treated with 0.25% trypsin–ethylenediaminetetraacetic acid for 3 min. Cells were replated at 1 × 10⁵/mL in basal media supplemented with the following growth factors to promote hemangioblast formation: 100 ng/mL stem cell factor (SCF), 10 ng/mL interleukin-6 (IL-6), and 10 ng/mL vascular endothelial growth factor (VEGF; PeproTech). After 4 days of culture, EBs and BCs were harvested as outlined and a single-cell suspension replated at 2.5 × 10⁴/mL in basal media supplemented with 1% bovine serum albumin (Invitrogen Life Technologies) and cytokines to promote both myeloid and erythroid colony formation: 25 ng/mL GM-CSF, 25 ng/mL G-CSF, 10 ng/mL SCF, 10 ng/mL IL-3 (PeproTech), and 2 U/mL erythropoietin (EPO) (R&D Systems Ltd). After further culture for 7 days, hematopoietic colonies (HCs) were scored using a Nikon Eclipse TS100 microscope and digital camera imaging system.
Cell culture
CCE and E14tg2a (expressing the Tet-sensitive transactivator) murine ES cells [25] were routinely cultured on tissue culture plates (Nunc) coated with 0.1% (v/v) porcine gelatin (Sigma-Aldrich Technologies) as described previously [23]. The ES-TP clones were cultured as previously described [24]. For induction of expression of TP clones were washed ×3 with PBS and incubated in LIF-containing media in the presence of 500 ng/mL Tet to prevent expression of TP, or no Tet to induce the expression of TP.
Conditional expression of TP
TP clones (TP1 and TP14) were plated at 1 × 10⁵–1 × 10⁶ cells per gelatin-coated 100 mm tissue culture dish. Cells were cultured with and without Tet for 24, 48, or 72 h to induce the short-term expression of TP. After treatment, the cells were harvested and washed ×3 with ice-cold PBS before being lysed as described previously [24]. Protein concentrations were determined using a Bio-Rad protein assay kit. Delayed TP activation was initiated by removal of Tet at the BC stage (day 4 culture—LIF) or the HC stage (day 8—LIF) of development. BC cells with delayed TP activation cells were collected at day 8—LIF (day 4 TP+) and the corresponding HC cells at day 15—LIF (day 7 TP+). Delayed TP-activated cells were examined by colony assays and total RNA isolated for polymerase chain reaction (PCR) and real time quantitative (RQ)-PCR analyses.
Immunoblotting and antibodies
For immunoblotting, 20 μg of each cell lysate was fractionated by sodium dodecyl sulfate–polyacrylamide gel electrophoresis and blotted onto nitrocellulose. Primary antibodies were used at the following dilutions: 0.1 μg/mL anti-phosphotyrosine 4G10 (05–32; Upstate Biotechnology); 0.5 μg/mL PDGFRβ antibody, which recognizes TP (CST 3162; New England Biolabs); and 1:2,000 anti-SHP-2 (sc-293; Santa Cruz Biotechnology Inc.). Secondary antibodies conjugated to horseradish peroxidase (Dako) were used at 1:10,000 dilution and blots developed using ECL (Amersham Pharmacia).
FDCP-Mix cells
Factor dependent cell Paterson (FDCP)-Mix cells stably expressing the TP oncogene or empty vector (EV) were maintained in Fishers medium with 20% (v/v) horse serum supplemented with 10 ng/mL IL-3 (R&D Systems). For differentiation induction, FDCP-Mix cells were washed 3 times in PBS and cultured in IMDM with 20% fetal bovine serum (Invitrogen Life Technologies) and cytokines to induce monocytic and neutrophilic commitment (0.1 ng/mL IL-3, 10 ng/mL GM-CSF, 5 ng/mL M-CSF, and 10 ng/mL G-CSF; PeproTech).
Flow cytometry
During hematopoietic differentiation, cells were harvested at the primary EB, and secondary EB/BC colony for ES cell, or at days 0, 4, and 7 of differentiation for the FDCP-mix cells and analyzed by fluorescence-activated cell sorting (FACS). EBs were treated with trypsin for 2 min, neutralized with FCS, washed ×3 with PBS, and resuspended at 0.5 × 10⁵ cells/100 μL of FACS Buffer (PBS with 2% FCS and 0.02% sodium azide). Cells were blocked with 1 μg of Purified Rat Anti-Mouse CD16/CD32 Fc Block™ (Becton Dickinson, BD 553142) for 1 h at 4°C. Labeling was performed using 0.5 μg of each flurochrome-conjugated antibody or relevant isotype control for 1 h at 4°C in the dark. Secondary staining was performed for a further 30 min for any indirect stains: Flk-1 (VEGF-R2, Ly-73; BD 555308), Brachyury (Abcam 20680), Sca 1 (BD 558162), c-Kit (CD 117; BD 553356), CD 11b (BD 552850), Gr1 (BD 553129), FITC Secondary (BD 554020), Step-Avidin Secondary (BD 554064). Cells were washed in 2 mL of FACS Buffer, pelleted 1,200 rpm for 5 min at 4°C. Cells were resuspended in 300 μL of FACS Buffer and analyzed on a FACSCanto™ II flow cytometer (BD) and data analyzed using FlowJo software.
PCR analyses
Total RNA was prepared using RNAeasy Plus extraction kit (Qiagen). RNA (1 μg) was reverse-transcribed using Superscript reverse transcriptase and oligo dT primers (Invitrogen Life Technologies). PCR was performed using 2 μL of cDNA and standard conditions with gene-specific primers as previously reported [5].
Real-time quantitative PCR
RQ-PCR was performed as previously reported [26]. Briefly, total RNA was extracted from cells using RNAesay Plus extraction kit, cDNA was prepared, and RQ-PCR was achieved using TaqMan™ probe-based chemistry (Applera) and the ABI PRISM 7500 system (Perkin Elmer-Applied Biosystems). The murine Hox-specific oligonucleotide sets were designed using Primer Express™ (Applera) and validated by standard PCR cloning and DNA sequencing of at least 5 colonies. Hox target copy numbers (copies per 50 ng RNA equivalents) were obtained from plasmid-derived standard curves [27]. The 18S rRNA predeveloped assay reagent (Applera) was used as endogenous control. RQ-PCR data are reported as either cycle threshold (CT) values corrected to endogenous control, which refers to the accumulation of sufficient PCR product to transect a user-defined threshold (lower CT values indicate higher gene expression) or as fold change, which was calculated using the 2−ΔΔCT method and assumes doubling of the amount of product with each PCR cycle.
Statistical analysis
Data generated from biological and technical replicates were analyzed by the Paired, 2-tailed Student's t-test: + P < 0.05 and *P < 0.001.
Results
Hematopoietic differentiation of ES cells
Differentiation of the E14tg2a and CCE ES cell lines was performed using a modified protocol based on the original work of Keller and colleagues [1]. The directed differentiation was validated by morphological analysis that confirmed appropriate formation of 1° EBs, BCs, and HCs at key stages of hematopoietic development. Hemoglobinized erythroid cells were observed within the BCs and distinct CFU-GM, BFU-E, and GEMM colonies were identified by day 15 of culture (Fig. 1A) consistent with these established models [1,5]. The differentiation model was validated and characterized based on expression of known ES self-renewal and differentiation genes. Expression of self-renewal markers such as Oct-4 and Nanog decreased during differentiation in congruence with upregulation of maturation and lineage-specific markers such as FGF5, FIK-1, Hbb-b1, PU1, and MafB (Fig. 1B and as previously reported [5]). Maturation through the key stages of development was also associated with altered levels of brachyury, Flk-1, c-Kit, and Sca-1 (Supplementary Fig. S1; Supplementary Data are available online at

In vitro hematopoietic differentiation of murine embryonic stem (ES) cells.
Complete Hox network profiling during hematopoietic differentiation of ES cells
Undifferentiated murine ES cells displayed a wide range of expression of Hox elements with corrected CT values between 34 and 19, corresponding to 20 and 3 × 10⁵ copies for Hoxd9 and Hoxa1, respectively. All Hox genes were expressed to a measurable amount (CT < 36) in both murine ES cell lines (Fig. 2 and data not shown). The vast majority of the Hox genes (27/39) displayed reduced expression after induction of the differentiation program, and this reduction was either transient (12/27) or sustained (15/27) for the duration of the differentiation process (Fig. 2 and Supplementary Fig. S2a–d). Of the 8 genes that showed measurable (ΔCT ≥2) upregulation upon EB formation, only 1 was from the Hoxa cluster (a13), 2 from the Hoxc cluster (c8 and c10), and 5 from the Hoxd cluster (d1, d3, d4, d9, and d10). Transition from the EB to the BC development stage resulted in measurable upregulation in 20/41 genes analyzed, including the 3-amino loop extension (TALE) genes Pbx1 and Meis1 as well as downregulation in Hoxb1 and c13. Further differentiation to the HC stage resulted in global upregulation of the Hoxc cluster and general downregulation in the other genes with the notable exception of Hoxa13, b13, and Meis1 (Supplementary Fig. S2a–d). Due to their preponderance in hematopoiesis, further comparative analysis of Hoxa expression was performed during hematopoietic differentiation of both E14tg2a and CCE cell lines. Two distinct patterns of expression emerged whereby the 3′ genes (Hoxa1-Hoxa7) were downregulated during hematopoietic differentiation and the 5′ genes (Hoxa9-Hoxa13) tended to be upregulated during this process (Fig. 3). These data suggest coordinated expression of Hox genes in ES cells.

Array of Hox-Tale gene profiles in differentiating murine embryonic stem cells. Real-time quantitative PCR (RQ-PCR) expression analysis of Hox and cofactor genes at key development stages (1) undifferentiated (control), (2) primary EB (1° EB), (3) BC, and (4) HC formation. Representative mean cycle threshold (CT) values obtained from triplicate experiments normalized to 18S rRNA ± standard error (SE) are tabulated. Lowest CT values (18–20) reflect highest expression; highest CT values (32–35) reflect lowest expression.
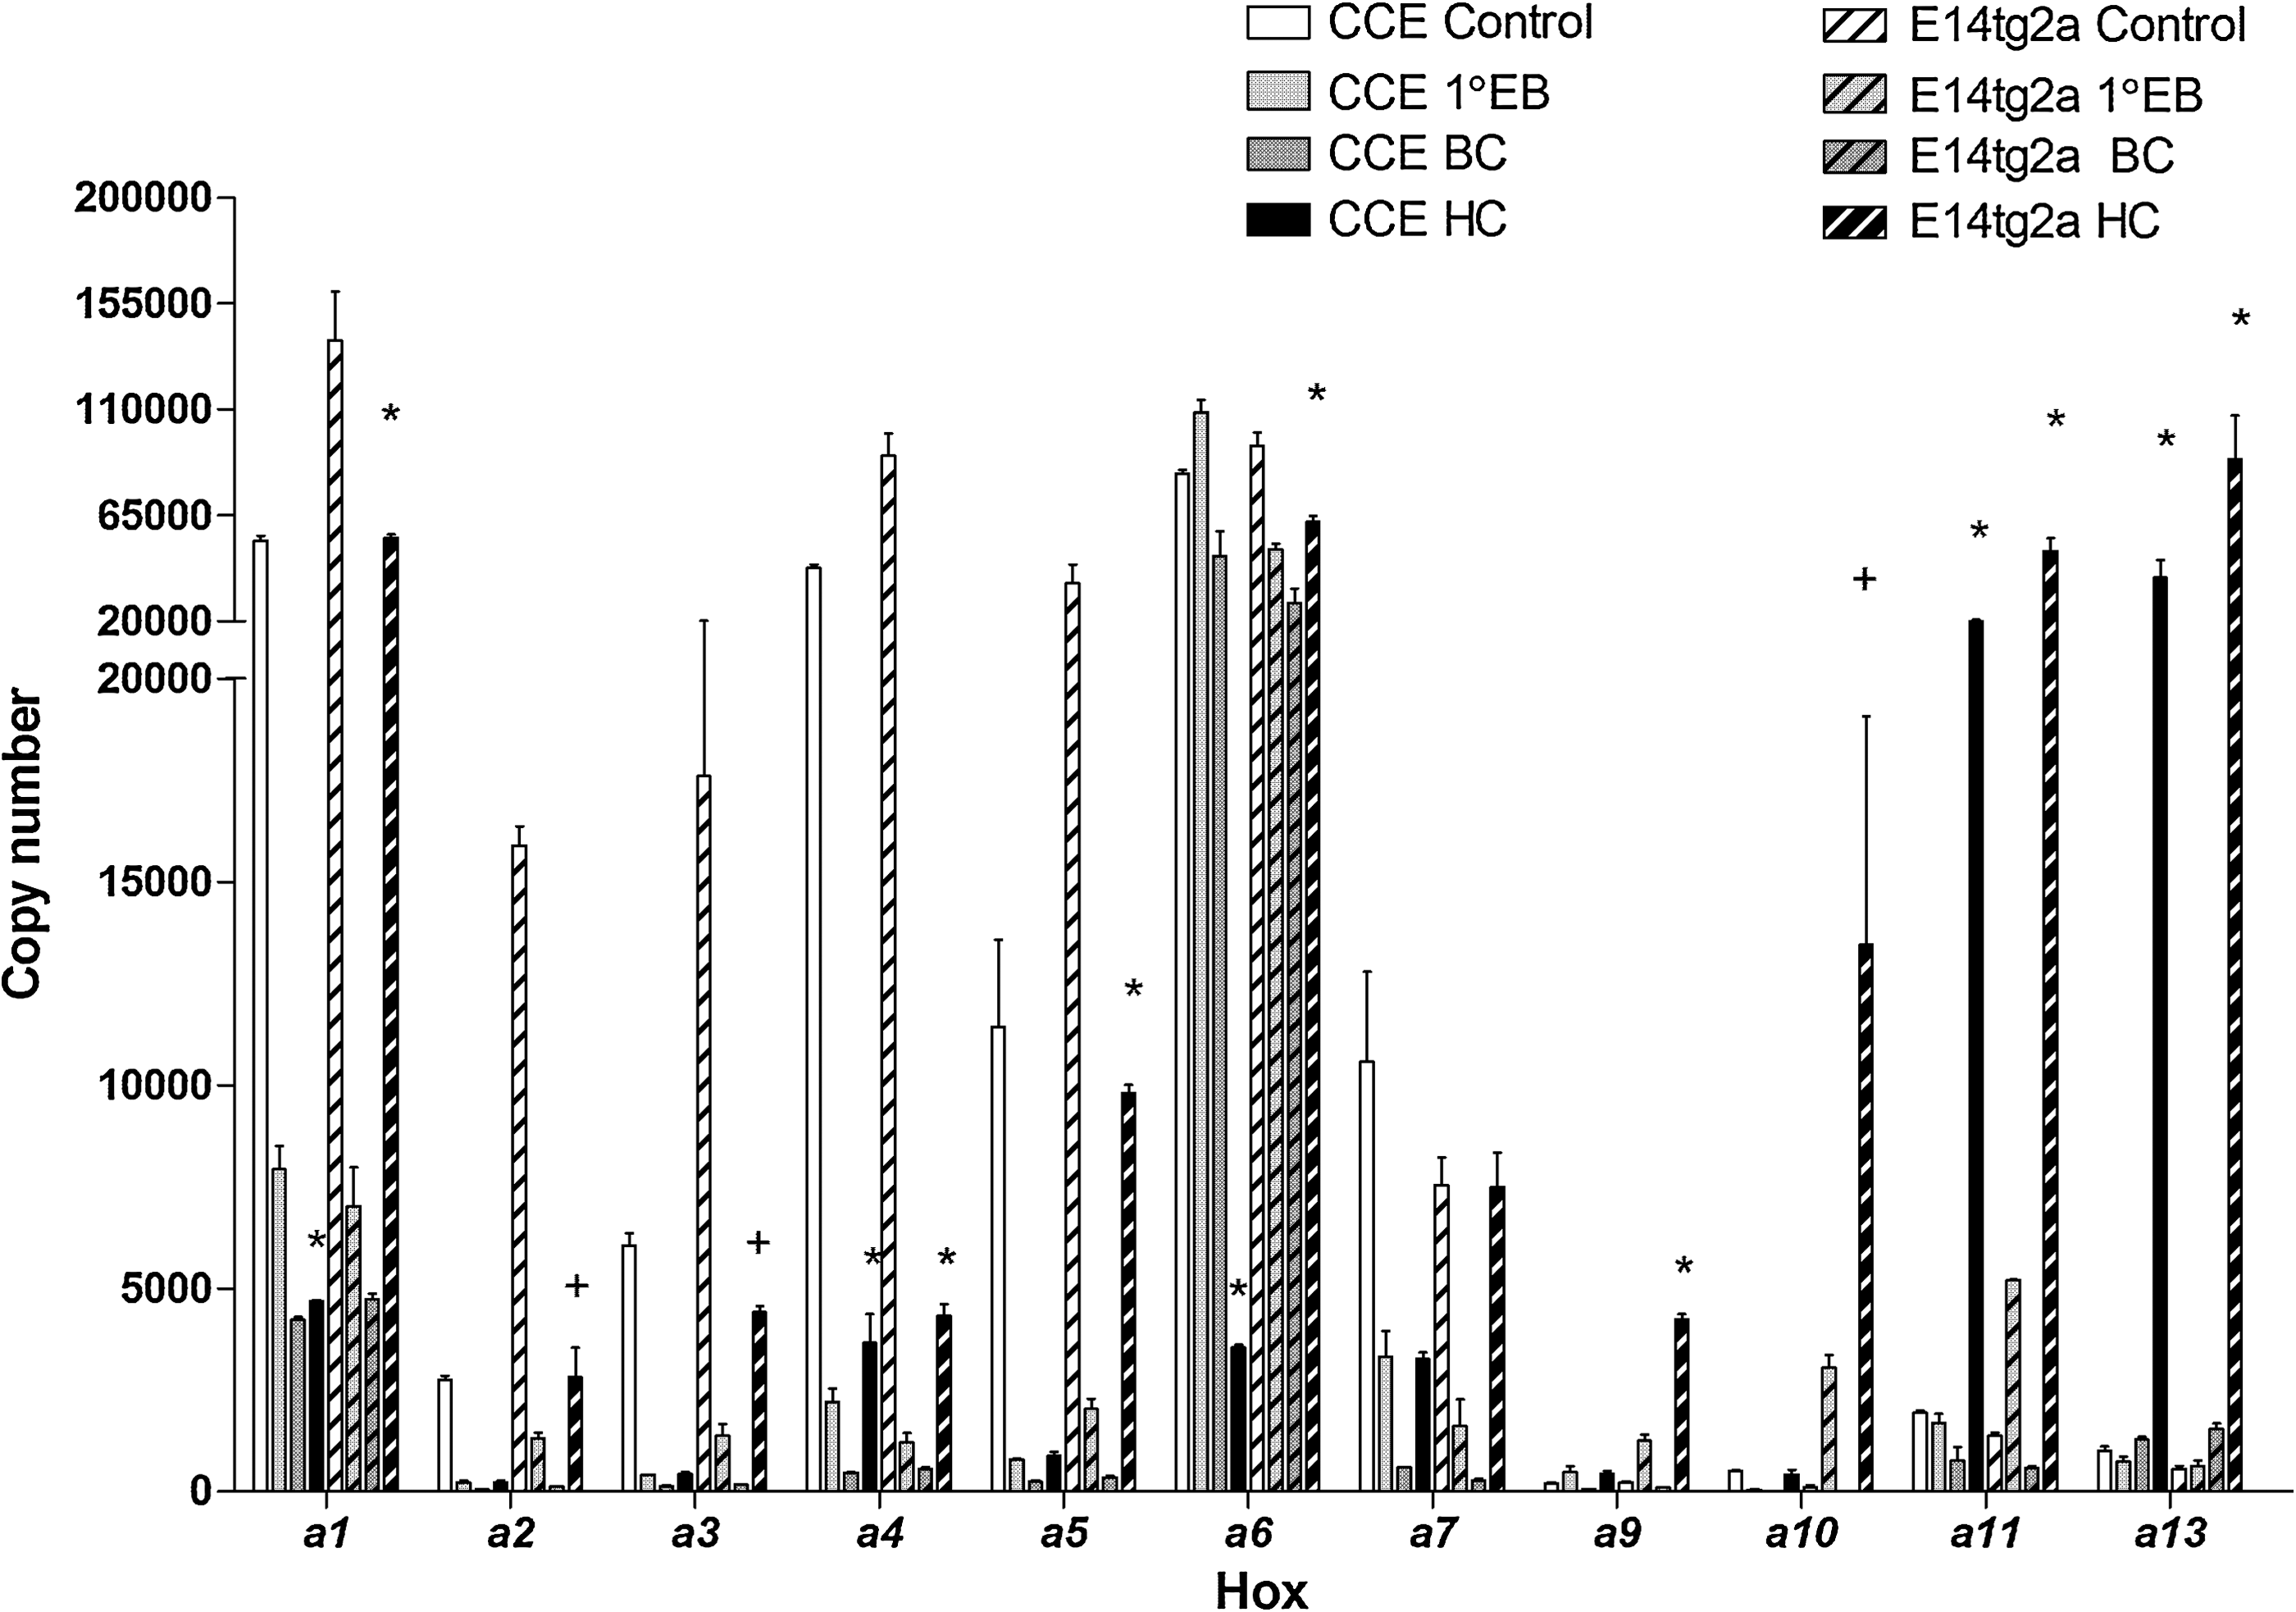
Reciprocal coordinated expression of the Hoxa cluster in differentiating murine embryonic stem (ES) cells. Representative histogram plots of copy number (per 50 ng of RNA) in expression of the Hoxa cluster in 2 independent cell lines (CCE and E14tg2a) from primary EB (1° EB): BC and HC formation compared with undifferentiated control cells. Values were obtained from triplicate experiments and normalized to 18S rRNA ± SE. † P < 0.05 and *P < 0.001.
Conditional expression of TP in an ES model of leukemia
Previous studies investigating the role of TP during hematopoietic differentiation of ES cells indicated that this oncogene can upregulate several transcription factors involved in regulating HSC expansion, including Hoxb4 and Cdx4 [24]. Several studies have shown that the Cdx family are global regulators of Hox gene expression. Removal of Tet from cultured ES-TP clones induced robust expression of TP that was maintained for up to 72 h (Fig. 4A). Immunoblotting analysis showed comparable levels of TP protein in 2 independent clones that resulted in functional signal transduction from the oncogenic receptor as detected by the anti-phosphotyrosine antibody. Induced TP expression (up to 72 h) resulted in increased expression of Hoxb4 and Cdx4 (Fig. 4B and ref. [24]) and decreased ES cell self-renewal and proliferation as verified by reduced alkaline phosphatase staining (Fig. 4C). This resulted in altered morphology consistent with a more differentiated phenotype as previously described [24].
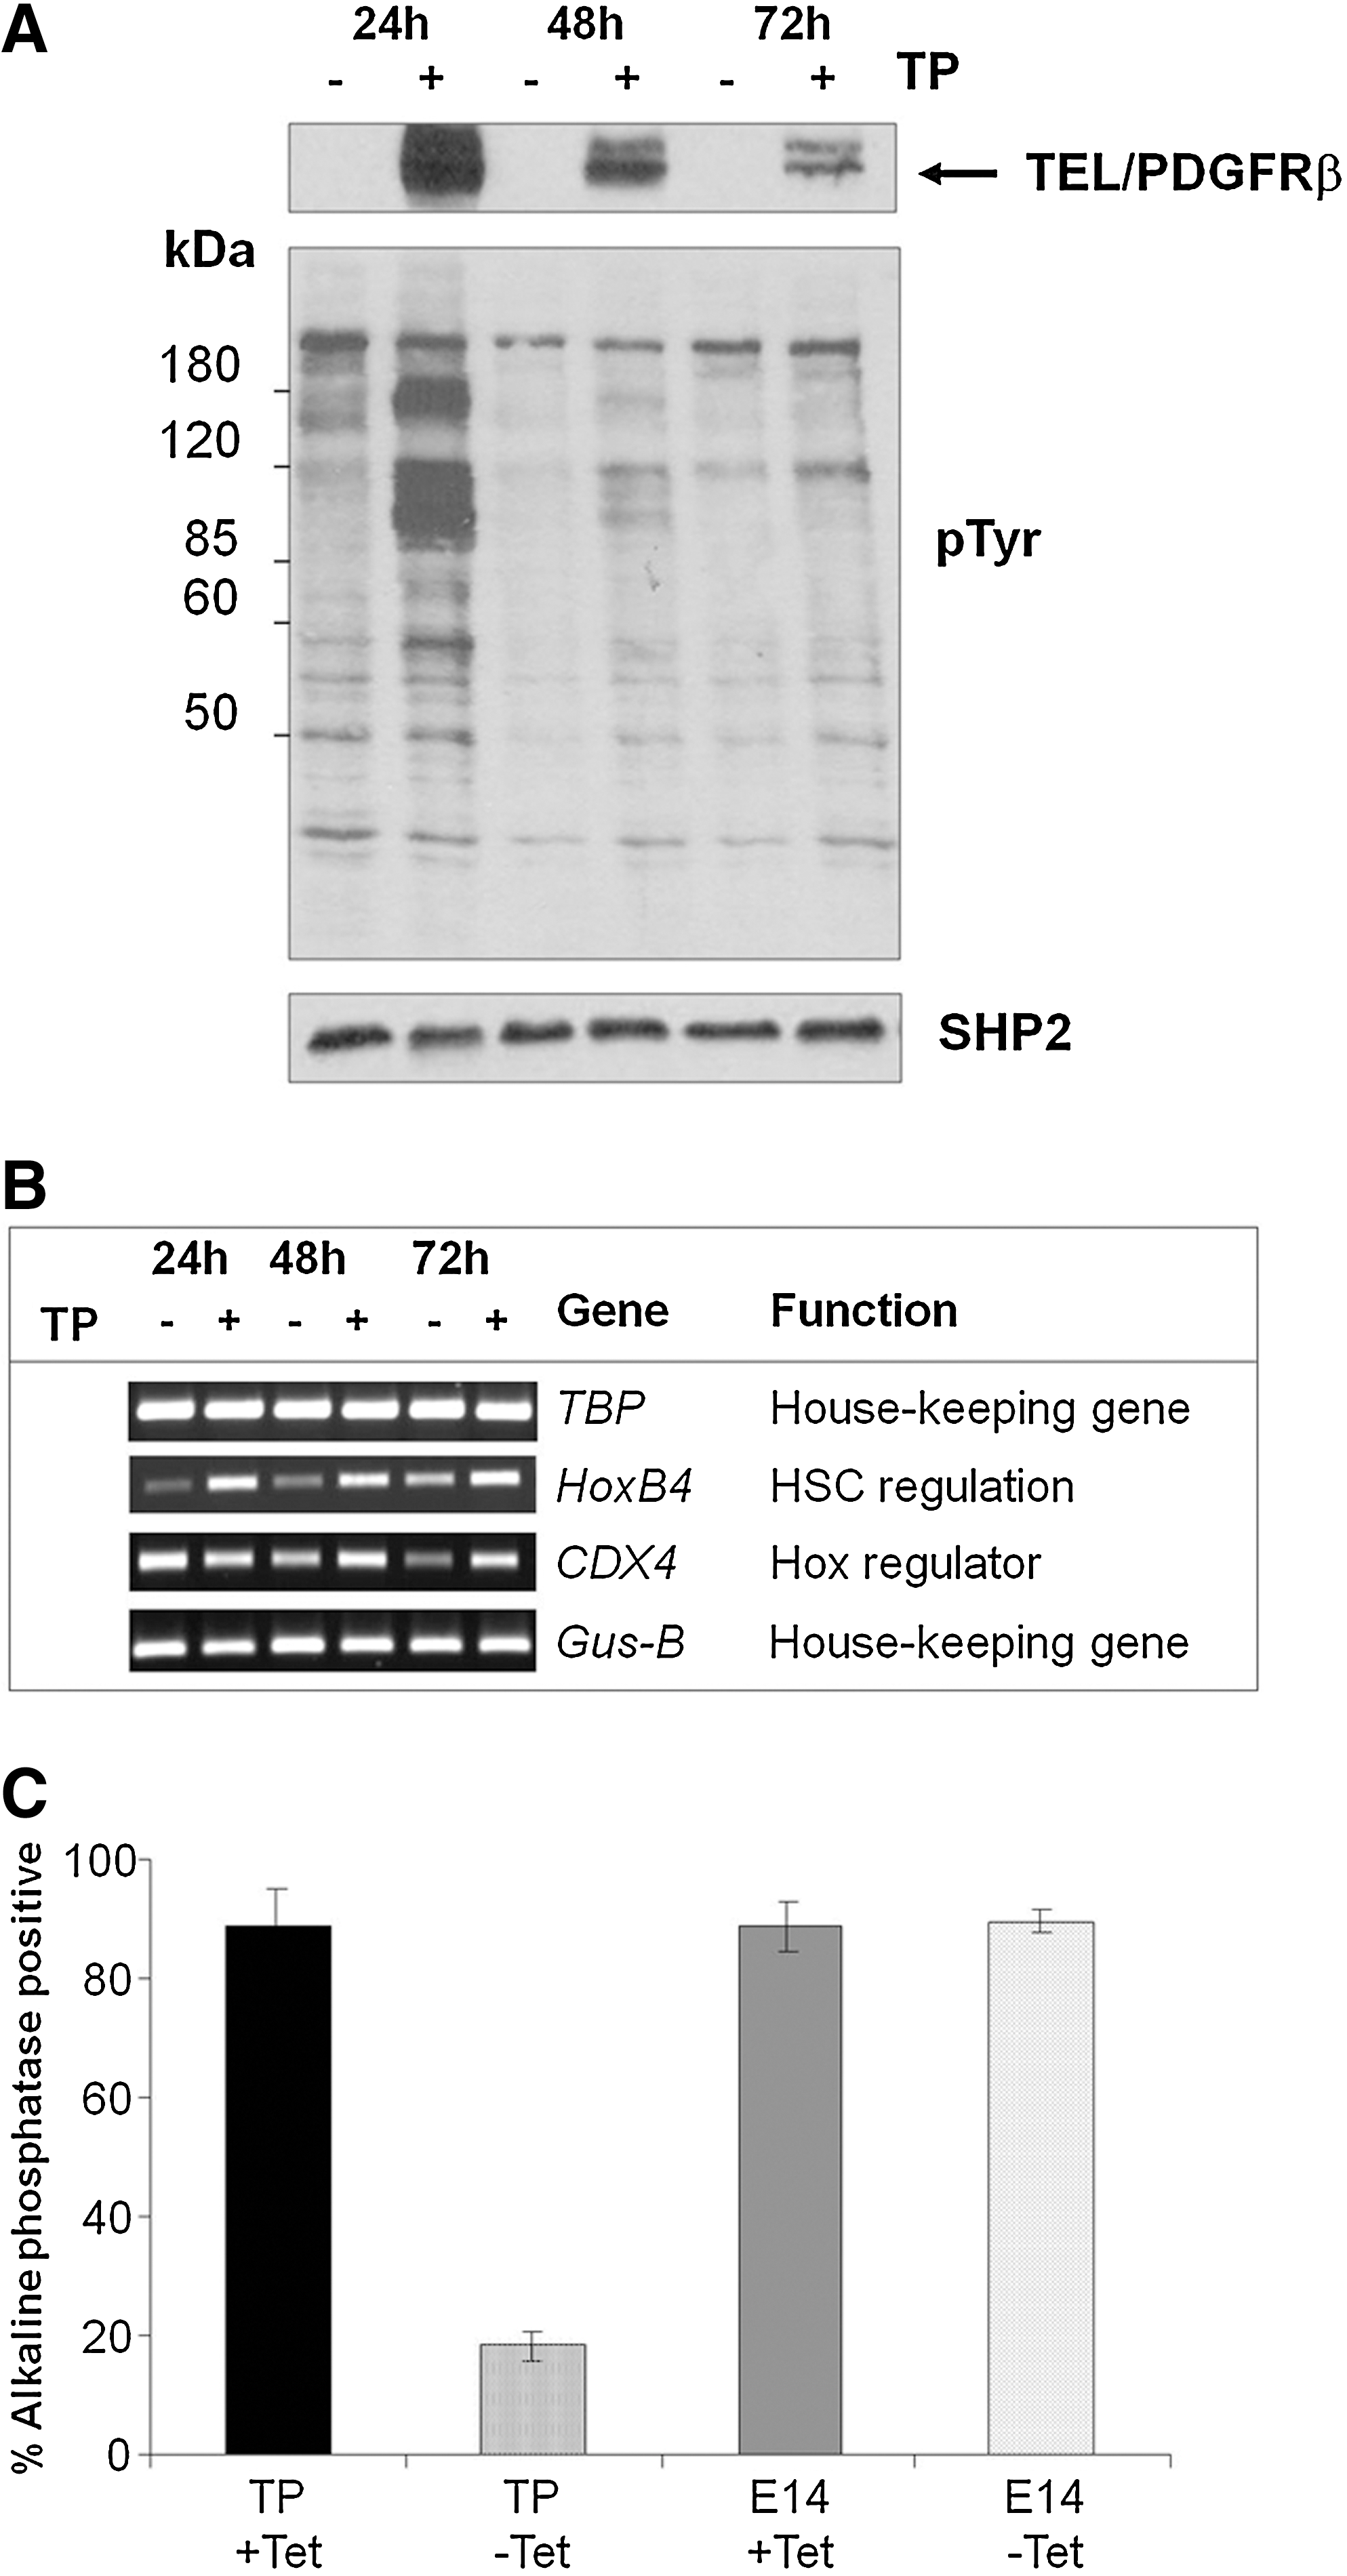
Induced Tel-PDGFRβ expression in murine ES cells leads to altered gene expression and phenotype.
Complete Hox network profiling after short-term TP expression in ES cells
RQ-PCR profiling of the Hox network in ES-TP cells showed measurable expression (CT <36) of all genes except Hoxd3. As was the case in the parental line a wide range of Hox expression was observed with CT values ranging between 35 and 24, corresponding to between 10 and 2 × 10⁴ copies for Hoxb1 and Hoxa3, respectively. Short-term induction of TP (24 h) resulted in moderate to substantial alteration in Hox expression as depicted by changes in corrected CT values (Supplementary Table S1). A subset of genes from the Hoxa and b clusters (n = 13) plus the cofactor genes Pbx1 and Meis1 were identified as candidates for further time-course study.
Candidate Hox gene expression during sustained TP activation in ES and FDCP-Mix cells
Hox genes that demonstrated differential expression after short-term TP activation (24 h) were further analyzed in a time-course study over 3 days that correlates with substantial differentiation of TP expressing cells (Fig. 4 and [24]). The candidate genes were all expressed at measurable levels (CT <36) throughout the time course. Significant changes in expression (P < 0.05) were observed throughout the time course (Fig. 5). The majority of the candidate genes demonstrated an initial reduction in expression after TP induction (9/15) that was either transient (7/9) or sustained (2/9) over the 3 days. Hoxa6 was the most predominantly expressed of the candidate genes and was significantly upregulated at the 72 h time point. Hoxa10 exhibited sustained repression (≥4-fold) after TP activation. Five genes, Hoxa13, b2, b4, b5, and Meis1, demonstrated initial upregulation in expression after TP induction that was sustained or steadily increased (up to 16-fold for Meis1) during the time course, as the TP expressing cells differentiate (Fig. 5). Of most interest was upregulation of Hoxa6, a7, a9, b2, b3, b4, Pbx1, and Meis1 in the TP-induced differentiated cells. These genes have previously been linked to hematopoietic regulation and deregulation of myelopoiesis in leukemia.

Comparative expression analysis of a subset of Hox-Tale candidate genes after Tel-PDGFRβ induction in a leukemic murine ES cell model. Representative histogram plot of copy number (per 50 ng of RNA) from 2 independent experiments of activated Tel-PDGFRβ (TP+) or control (TP−) murine ES cells for 24, 48, and 72 h. Values obtained from triplicate experiments normalized to 18S rRNA ± SE are plotted. † P < 0.05 and *P < 0.001.
Ectopic expression of TP in the multipotent FDCP-Mix murine cell line resulted in pTyr activation and modified differentiation as defined by increased Sca-1 and decreased CD 11b and Gr-1 expression compared with control cells (Supplementary Fig. S3). Although baseline Hox expression was an order of magnitude lower in this model compared with the ES cells, increased expression in the constitutively active TP cells (day 0) was observed for Hoxa6, a7, a9, a10, b2, b3, b4, b9, and Meis1 (Supplementary Fig. S4). Extended differentiation of the FDCP-Mix cells, up to day 7, resulted in significantly reduced levels of Hox as expected. Meis1 expression was consistently higher than the Hox genes in the differentiating FDCP-Mix cell lines, and TP activation resulted in maintained increased expression of Meis1 compared with EV controls.
TP modulates key Hox genes during hematopoietic differentiation of ES cells
To examine transcriptional flux through the Hox network in a leukemia-differentiation model, inducible TP-ES cells were directed to undergo hematopoietic differentiation in the presence or absence of Tet. Cells were collected at time points corresponding with EB, BC, and HC formation with HCs scored to ensure that TP was driving myelopoiesis as previously reported [24]. Examination of the TP-candidate genes in this model demonstrated significant altered expression (P < 0.05 and <0.001) of a number of Hox genes at various stages of development. Moderate to substantial (up to 10-fold) changes in expression were shown between control TP-inactive and TP-active differentiating cells (Fig. 6). Hoxa6 was the most predominant of the candidate genes in this model. Transient upregulation of the majority of genes, including Hoxa6, was observed at either the EB (9/15) or BC (13/15) stage of development. Hoxa5 and Hoxa7 expression was increased considerably (8–10-fold) with EB formation and Hoxb1 (10-fold) with BC formation. Hoxa6, a7, a9, b3, b4, and b9 were all upregulated in both the early differentiating cells (72 h TP expression) as well as during mesodermal and hemangioblast formation after TP expression, identifying these as potential candidates involved in TP-mediated alterations in hematopoietic transcriptional regulation. Hoxa5 and a10 were initially downregulated after short-term TP expression but became upregulated during mesodermal and hemangioblast commitment. All of the candidate genes apart from Hoxb2 were downregulated in the TP expressing HCs, most notably for Meis1 (∼4-fold).
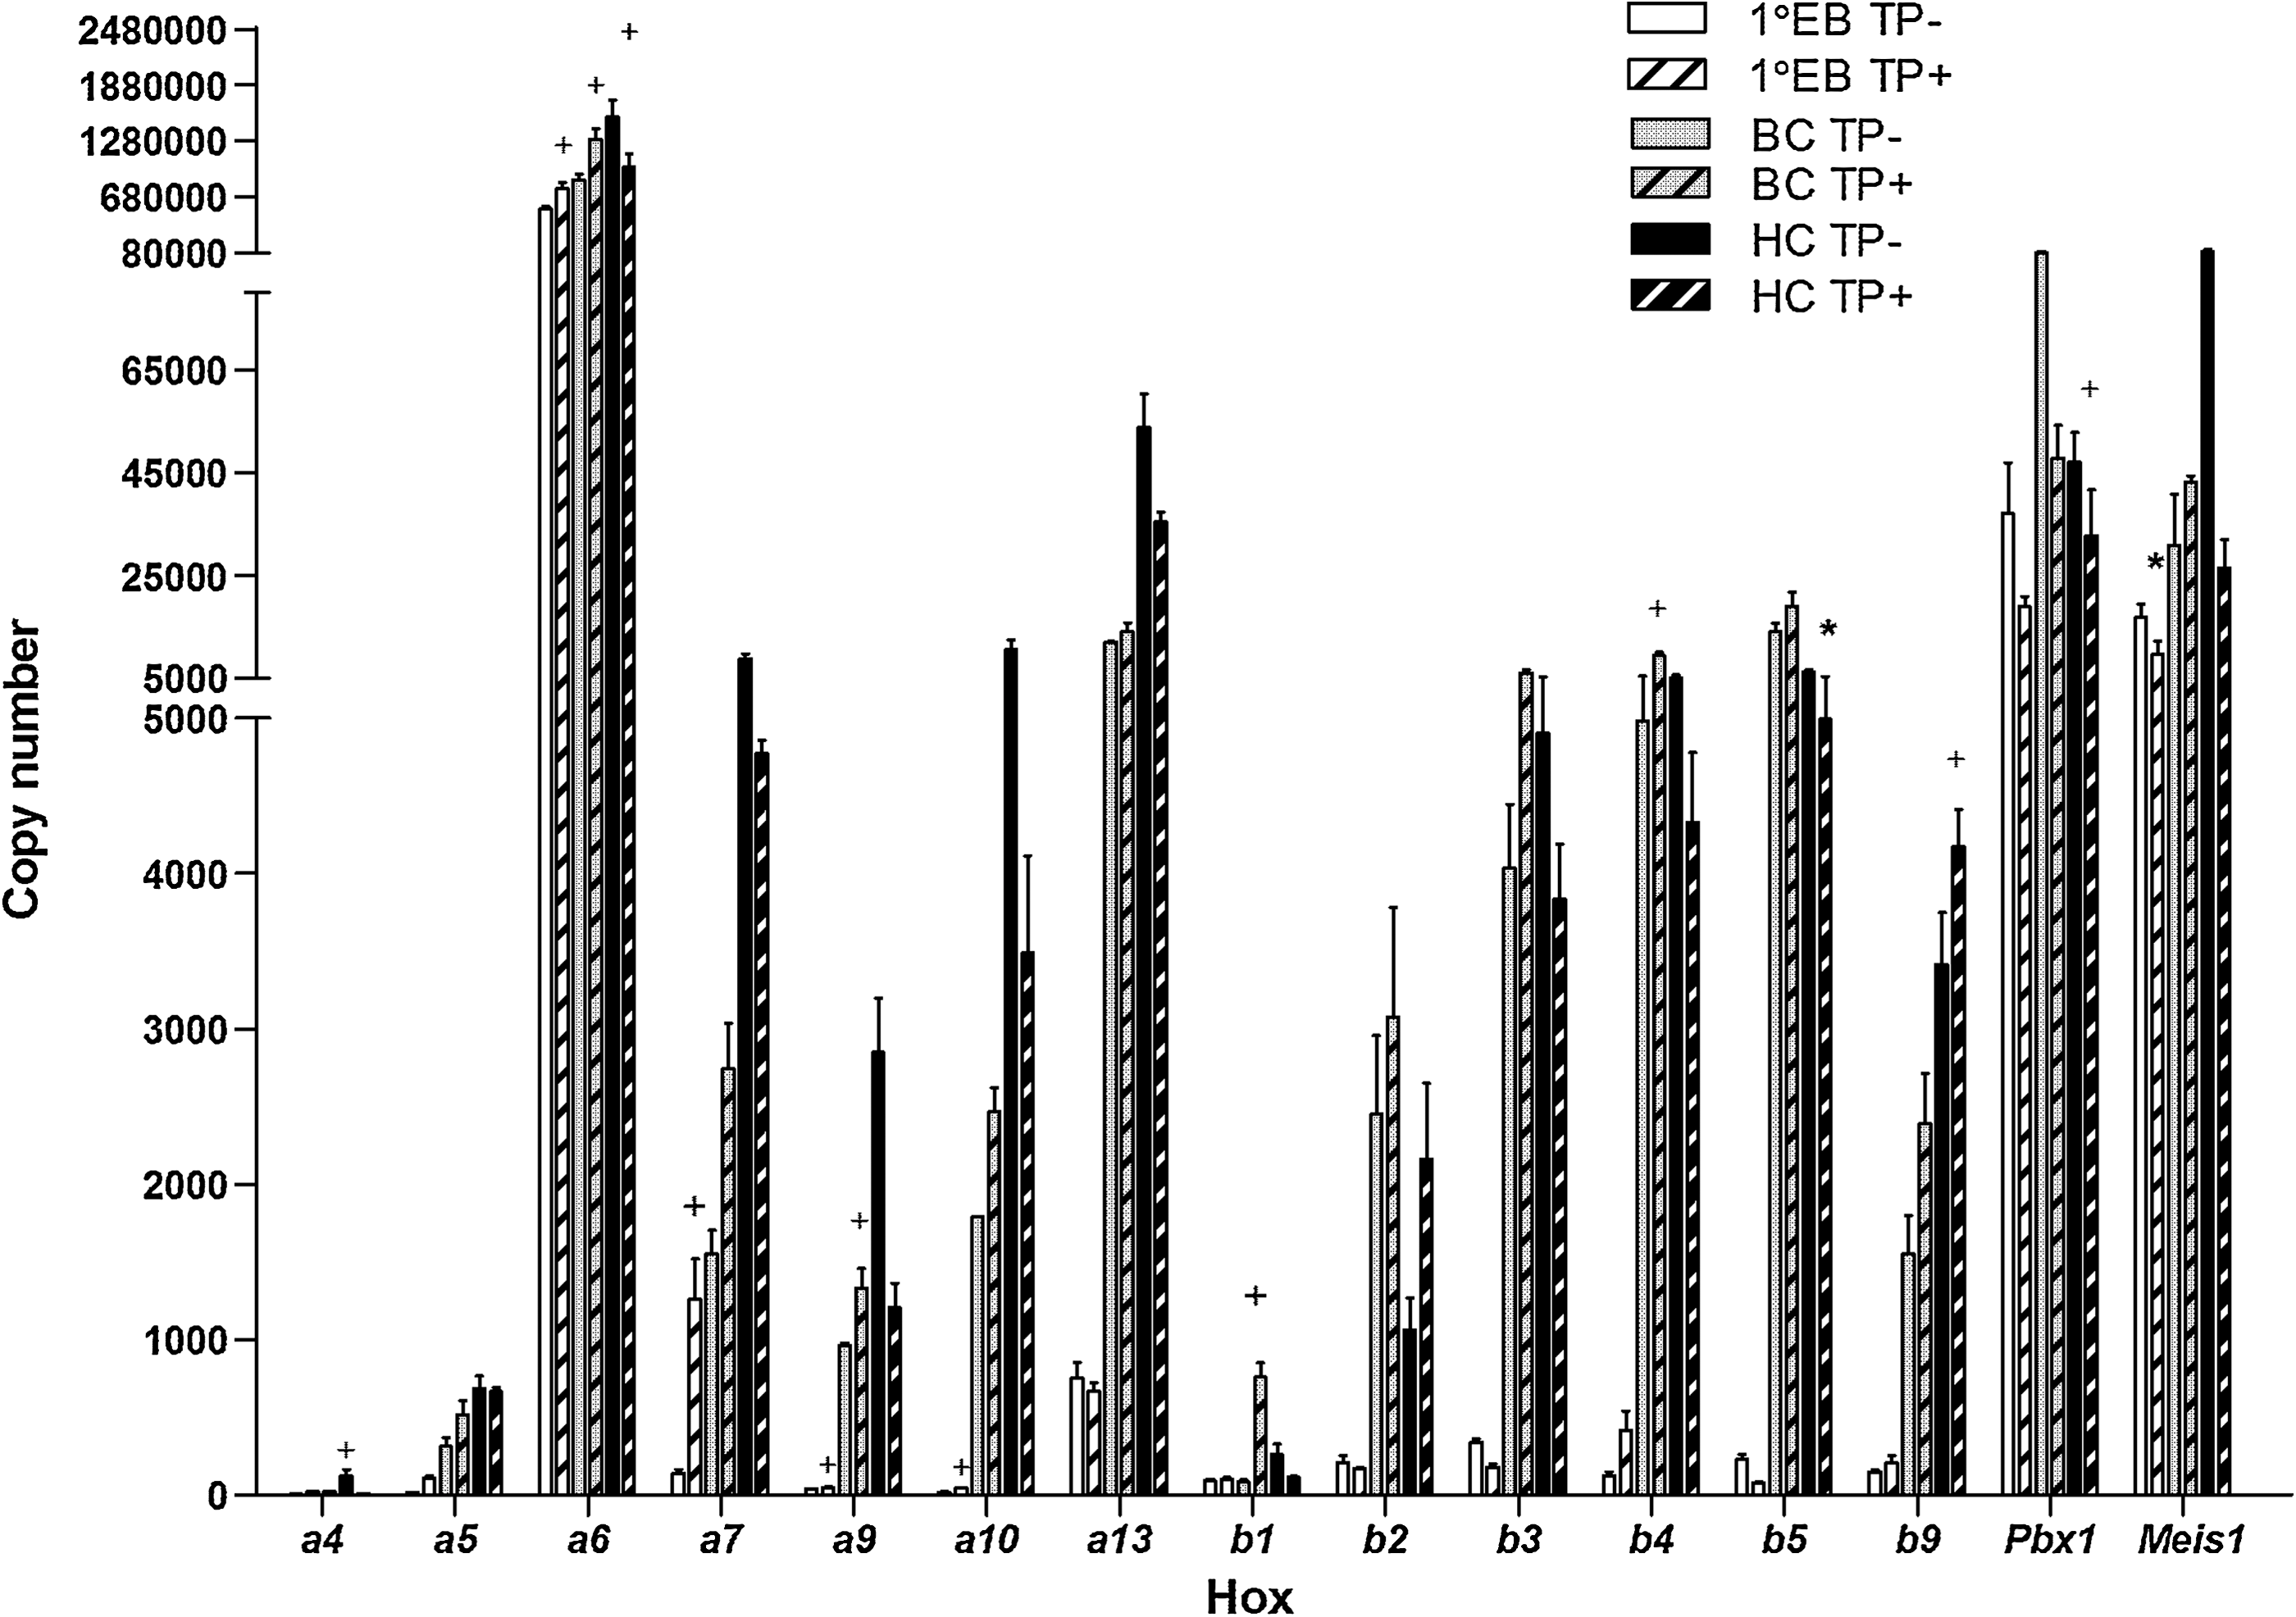
RQ-PCR analysis of a subset of Hox-Tale genes after sustained Tel-PDGFRβ induction in a leukemic model of murine ES cell differentiation. Representative histogram plot showing copy number (per 50 ng of RNA) of the candidate genes at primary EB (1° EB): BC and HC formation after induction of Tel-PDGFRβ (TP) compared with noninduced controls. Mean values were obtained from triplicate experiments normalized to 18S rRNA ± SE. † P < 0.05 and *P < 0.001.
Delayed activation of TP results in altered differentiation and gene expression
Delayed activation of TP was examined by Tet removal at the BC or HC stage of differentiation. Late activation of TP in HC cells resulted in increased myeloid colony formation at the expense of erythroid and mixed colonies (Fig. 7A). These phenotypic changes, reflected by changes in differentiation marker gene expression, were dependent on conditional TP activation and defined stage of development (Fig. 7B). Lower Hoxb4 and EpoR expression in HC cells was more dependent on development stage than TP status. In contrast, conditional activation of TP resulted in a marked upregulation of GATA3 expression at the BC or HC stage of development. With the exception of Hoxa10, which showed a moderate upregulation, TP activation in BC cells had little effect on Hox-Tale expression. Delayed TP activation in HC cells, however, resulted in significant upregulation in Hoxa4, a5, a7, a13, b2, b3, b4, and b5, with a 2-fold reduction in the expression of Hoxa6 (Fig. 7C). The candidate Hox-Tale signature increased, cumulatively, by over 75% (10,578–18,782 copies) after activation of TP in HC cells.

Delayed TP activation results in increased myeloid differentiation and differential gene expression of ES cells. (
Discussion
The ES/EB model used to track early events involved in hematopoietic cell commitment and differentiation is now well established [1,2,28]. Several researchers have elucidated key signaling events that regulate self-renewal and lineage commitment using this system (reviewed by Park et al. [29]). Murine ES cells are maintained in the undifferentiated state by the presence of LIF in the culture media. LIF signals through its receptor gp130 to activate STAT3, which is sufficient for retention of ES cells in their undifferentiated pluripotent state [30]. Additional intracellular signal transduction molecules, including other STATs [31], MAPK [32], PI3K [23], TGF-Beta/Smad [33], and the members of the Wnt family [5,34,35], have been shown to play a significant role in hematopoietic development from ES cells. A modified culture system that efficiently promotes the directed differentiation of ES cells to the hematopoietic lineage [1] was used. The sequential addition of specific growth factors is critical for coordinated lineage restriction of the ES cells. BMP-4 promotes efficient formation of mesoderm; bFGF and activin A induce the differentiation of mesodermal precursors to hemangioblasts; and VEGF and SCF regulates the production of fully committed hematopoietic progenitors. The stepwise production of HCs allows for molecular dissection of the key stages of hematopoietic development [36].
BMP-4 signaling appears to play 2 distinct and sequential roles during ES-derived hematopoiesis at least in part by activation of the Cdx-Hox pathway [37]. FGF regulation of the Cdx-Hox axis has been established in other developmental models [38] and a Cdx-Hox code may actually control the effectiveness of FGF signaling [39]. Similarly VEGF signaling is associated with differential Hoxb expression [40]. Members of the TGFβ superfamily, including Activin A, have previously been identified as regulators of the Hox axis [41] and more recently direct interaction between specific Hox proteins and TGFβ/BMP downstream regulators have been identified [42,43]. Differential expression of Cdx4 and Hoxb4 was initially confirmed in the ES model and quantitative profiling of the Hox network extended these findings to the complete Hox network. Cdx4 expression was initially downregulated during formation of the EBs in the presence of BMP-4 but became dramatically upregulated during production of BCs and hematopoietic progenitors, perhaps in part due to the biphasic activity of BMP-4.
Induction of differentiation in the normal ES model resulted in a robust downregulation of the majority of Hox genes, including Hoxb4, reflected by an increased CT value and reduced copy number. Global downregulation of Hox genes is a hallmark of differentiation and may reflect global epigenetic regulation of the clusters [44,45]. The increased expression of Hoxa13, c8, and c10 throughout the differentiation process points to specific Hox regulation associated with the early stages of hematopoiesis. The marked upregulation of the Hoxd cluster, with the exception of Hoxd12, also suggests privileged global regulation of this cluster during ES differentiation as previously reported [46]. This global activation may be controlled in part by an underlying mechanism of nuclear reorganization that results in looping out of the Hoxd cluster from its chromosomal territory [47]. Whether this nuclear reorganization is maintained in tissue-specific developmental processes such as hematopoiesis requires further study. The Hoxa cluster is generally well expressed in hematopoietic tissue and its deregulation is often associated with leukemia [9]. Comparative analysis of 2 independent ES cell lines undergoing hematopoietic differentiation demonstrated reciprocal coordinated expression of the Hoxa cluster. The more anterior 3′ subset (Hoxa1-Hoxa7) showed consistent reduced expression during all 3 key stages of differentiation. Conversely, the more posterior 5′ subset (Hoxa9-Hoxa13) showed differentiation associated downregulation followed by a moderate to substantial increase in expression upon formation of the hematopoietic progenitor cells. Both the degree and trend of expression appeared coordinated around cluster position, with Hoxa6/7 acting as the fulcrum. The trend in expression was similar for both cell lines with the E14tg2a cell line showing greater degree of expression change throughout the network.
Oncogenic activation of TP results in an MPN with accumulation of myelomonocytic cells. In the leukemic model, the transforming TP oncoprotein self-associates and activates kinase-dependent signaling pathways [48]. Previous studies demonstrate that TP inhibits ES self-renewal and promotes myeloid differentiation [24,49]. This phenotype was validated by reduction in alkaline phosphatase expression and upregulation of Hoxb4 and Cdx4. Increased Hoxb4 and Cdx4 expression levels are known to enhance the clonogenic potential of EB-derived cells during hematopoietic differentiation [49,50]. Recent evidence suggests that Cdx4 is upregulated in 23% of AML patients, with preferential expression shown in primitive stem and progenitor cells. In addition, Cdx4-transduced bone marrow demonstrated serial re-plating ability of primitive myelomonocytic-like cells [20]. Further, the impaired hematopoietic phenotype of Cdx mutant mice can be rescued by multiple Hox genes [51]. Therefore, Cdx4 may play an important role in modulating the Hox network to bias myelomonocytic differentiation in the TP model.
Short-term TP activation in ES cells resulted in increased expression of Hoxa13 and Hoxb2 (up to 6-fold). Hoxa13 is recognized as playing a role in normal limb development, but overexpression has been observed in models of leukemia and in small cell lung carcinoma [52]. Hoxb2 is part of a common Hox repertoire associated with self-renewal [53] and expansion potential of another ES cell line (D3) and bone marrow-derived mesenchymal stem cells [54]. Extended analysis identified Hoxa6, b1, b2, b4, and Meis1 as displaying measurable to substantial upregulation (up to 16-fold for Meis1) after TP activation. Hoxb4 is well established as a self-renewal factor for ES and LT-HSCs [16] and we have previously shown Hoxa6 to affect hematopoietic cell proliferation and self-renewal [55]. The striking and sustained upregulation of Meis1 suggests that it plays a key role in the oncogenic pathway initiated by TP activation. Meis1 is an established Hox collaborator and its expression has been shown to track with Hox genes during ES differentiation [56]. Meis1 cooperates with Cdx4 to accelerate AML development in mice through upregulation of Hoxa6, a7, a9, b8, b4, and c6 [20] and has been associated with regulating other Hox genes such as Hoxb1 and b2 [57].
Hematopoietic differentiation of TP expressing ES cells resulted in upregulation of Hoxa6, a7, a9, b1, b2, b3, b4, and b9 between days 3 and 8 of differentiation when cells undergo mesodermal and hemangioblast/HSC formation. Meis1 was also upregulated in the BC when the first hemangioblasts and HSC form. To test if the TP-induced transcriptional effects were ES cell specific, conditional TP expression (-Tet) was delayed until the BC (days 4–8) or HC (days 8–15) stage of development. Quantitative PCR analysis of the Hox candidates identified 9 genes (Hoxa4, a5, a7, a13, b2, b3, b4, b5, and Meis1) that were upregulated after TP expression at the HC stage rather than BC stage. To further examine the TP-induced Hox candidates in a hematopoietic progenitor cell line, an FDCP-Mix-TP+ model was used [57,58]. Constitutive expression of TP in the FDCP-Mix cell line (day 0) resulted in differentiation with an associated upregulation of Hoxa6, a7, a9, a10, b2, b3, b4, and Meis1 compared with EV controls. As expected the Hox expression was reduced to barely detectable levels after differentiation of the FDCP-Mix cells, validating this model. Together, these findings demonstrate that oncogene-specific disruption of genetic networks may govern the leukemic cell phenotype. Expression of a core subset of Hox genes (a7, a9, b2, b3, and b4) is enhanced, along with Meis1 and Cdx4, in the presence of TP throughout hematopoietic differentiation and may represent part of the leukemia stem cell signature along with Nanog, Oct4, c-kit, and Flk-1 [24].
The temporal and spatial expression of Hox genes is tightly regulated at both the genetic and epigenetic level. This study demonstrates for the first time transcriptional flux through the Hox network during normal hematopoietic and TP-induced leukemic differentiation of ES cells. Quantitative complete Hox network profiling confirms and extends previous published reports and identifies a novel subset of genes with potential roles in establishing early hematopoietic commitment. Due to the high degree of redundancy built into the network, loss-of-function studies involving individual Hox genes and clusters have provided limited information on the importance of this family in hematopoiesis. This study highlights that this is probably due to changes in several Hox genes influencing hematopoietic regulation. Overall, this study has identified how the Hox gene expression pattern alters during key stages of hematopoietic differentiation and establishes Hox signatures that change in response to an active tyrosine kinase involved in an MPN. Upregulation of Cdx4, Meis1, Hoxa7, a9 b2, b3, and b4 are an emerging theme in myeloid malignancies and warrant further investigation as potential targets for future therapies or intervention.
Footnotes
Acknowledgments
Supported by a cohesion grant from the Cancer RRG (A.T. and H.W.), Leukaemia & Lymphoma Research (formerly Leukaemia Research Fund) (G.J.D. and A.T.), Northern Ireland Leukaemia Research Fund (H.W.), and the Department of Education and Learning, Northern Ireland (J.M.R., E.D., and P.M.C.).
Author Disclosure Statement
The authors have no conflicts of interest to declare.
References
Supplementary Material
Please find the following supplemental material available below.
For Open Access articles published under a Creative Commons License, all supplemental material carries the same license as the article it is associated with.
For non-Open Access articles published, all supplemental material carries a non-exclusive license, and permission requests for re-use of supplemental material or any part of supplemental material shall be sent directly to the copyright owner as specified in the copyright notice associated with the article.
