
Abstract
Human embryonic stem cells can be differentiated along different lineages, providing the possibility of a precise analysis of genes profiles associated with specific commitments. Subtractive gene expression profiling between differentiated and undifferentiated cells provides lists of potential actors in this commitment. This combines, however, genes that are specifically associated with development and others that are over expressed because of nonlineage-specific differentiation systems. As a way to establish gene profiles associated with the neural and/or to the mesodermal commitments of human embryonic stem cells more precisely, we have carried out a 2-step analysis. We first performed a subtractive analysis of gene profiles of each of these lineages as compared to the undifferentiated stage. Then, we extended the analysis by comparing the 2 sets of results with each other. This strategy has allowed us to eliminate large numbers of genes that were over expressed in both sets of results and to uniquely associate different gene networks with either the neural or the mesodermal commitments.
Introduction
F
Over the last few years, important efforts focused on the possibility of controlling the differentiation of hES cells particularly for neural fate. Indeed, using protocols based on the coculture of hES cells with defined stromal cell lines exhibiting neural inducing activity, it is possible to directly observe the process of neural conversion by forming of columnar epithelial cells radially organized resembling a cross section of neural tube named “neural rosettes” [10,11]. These neurectodermic clusters of cells are greatly enriched in neural progenitor cells (NPCs), which have the ability to differentiate into various subtypes of neurons, astrocytes, and oligodendrocytes [10 –14]. Although this system of culture is considered to be relevant for neural induction, neural cells differentiated in vitro from hES cells are widely heterogeneous, probably due to no synchronized processes [15]. Consequently, neural rosettes represent structures that contain a mixture of cells, including neuroepithelial progenitor cells, neural stem cells, committed neurons at different stages of their development, and probably neural crest derivatives at their periphery. For this reason, several groups have attempted to develop cell selection strategies, including the use of fluorescence-activated cell sorting (FACS). To date, only few membrane markers have been used to enrich cultures in neural precursors and neurons [16]. Among these markers, we used neural cell adhesion molecule (NCAM/CD56) in this work [17].
The production of mesenchymal precursor cells (MPCs) has not been as widely reported as that of neural precursors. By taking advantages of the recent development of protocols triggering the differentiation of hES cells toward a near-homogenous amplifiable population of mesenchymal progenitors exhibiting a phenotype of mesenchymal stem cell (MSC)-like can be obtained [18 –23]. In this study, we produced highly homogenous cell populations for both neural and MPCs by engagement of the hES cells into either the neural or the mesodermal lineages. The analysis of gene expression patterns of these 2 populations, sharing the same genetic background, compared to the same starting population that were hES cells, using strictly identical procedures for hybridization and statistical analysis, allowed us to select genes that were modulated in opposite directions during commitment to either neural or mesenchymal fates. After this subtractive analysis, selected genes exhibiting modulations specific for either neural or MPCs were used to build in silico global gene networks and, using a comparative strategy, to determine their implications as actors in the main signaling pathways involved in early steps of human development.
Materials and Methods
Human ES cells culture
Two hES cell lines, SA01 (XY, passage 40; Cellartis) and VUB01 (XY, passage 80; AZ-VUB), were maintained and propagated on a feeder layer of (SIM mice Thioguanine and Ouabaine resistant (STO) murine embryonic fibroblast cells inactivated by Mitomycin C (Sigma Aldrich; 2.5 μg/mL overnight at 37°C). Cells were cultured in a humidified 5% CO2 incubator at 37°C in a serum replacement medium knockout Dubecco's modified Eagle's medium (DMEM), 20% knockout serum replacement (KSR), 1% glutamax 1 mM, 1% nonessential amino acid (NEAA), 0.1% β-mercaptoethanol (BM) 0.1%, and 1% penicillin/streptomycin (P/S); all from Gibco] supplemented with 8 ng/mL of basic fibroblast growth factor (FGF; Invitrogen). The culture medium was changed daily and routine passages routinely performed by mechanical cutting of hES cells on a fresh feeder layer every 4–5 days.
Differentiation of hES cells toward NPCs, neurons, and astrocytes
Differentiation of hES cells toward NPCs
The differentiation of hES cells toward neurectodermal rosettes was adapted from the Stromal Differentiation Inducing Activity protocol as described elsewhere [10]. Briefly, hES cells were manually dissociated from the STO feeder layer and plated at a density of ∼103 cells per cm2 on a confluent layer of mitotically inactivated murine stromal feeder cells (MS5). Cells were cultured in KSR medium (knockout DMEM, 15% KSR; 1% glutamax; 1% NEAA, and 0.1% BM; all from Gibco) for 14–16 days in vitro (DIV), when the medium was replaced by neurobasal medium, N2 (DMEM-F12+ glutamax, 1% N2 supplement and 1% P/S) until DIV21.
Cell sorting
Cells were harvested at DIV21 using TrypLE Express (Gibco) and about 5 × 10⁶ cells were suspended in phosphate-buffered saline (PBS)–2% fetal calf serum containing 1% 7-amino-actinomycin D (Sigma) and then incubated with immunoglobulin G (IgG)1κ direct conjugated phycoerythrin (PE) monoclonal anti-human NCAM antibody diluted 1/10 provided by BD Biosciences Pharmingen™. This antibody recognizes an extracellular Ig-like domain common to 3 molecular weight forms—M w 120, 140, and 180 kDa—of the NCAM protein. The cell sorting was performed by a MoFlow Cell Sorter Cytometer from Cytomation and positive and negative fractions were collected in 1 mL of N2 medium with 1% P/S.
Differentiation of NPCs toward neurons and astrocytes
After sorting, the NCAM+ cells were seeded on polyornithine (15 μg/mL; Gibco)/laminin (1 mg/mL; Sigma)-coated dishes (50 × 103/cm2) in N2 medium supplemented with basic fibroblast growth factor (bFGF or FGF2) (20 ng/mL; Invitrogen), and epidermal growth factor (EGF) (10 ng/mL; Abcys) to allow their proliferation for 10–15 days. The medium was changed every 2 days. When confluent, they were passaged (P1) after exposure to collagenase 1 mg/mL for 15 min at 37°C and plated in N2 medium supplemented for differentiation toward either neurons or astrocytes. For neuronal differentiation, brain-derived neurotrophic factor (BDNF) (10 ng/mL) and ascorbic acid (10 ng/mL) was added in the N2 medium, which was changed every 2–3 days for 2 weeks after which the cells were fixed. For differentiation toward astrocytes, medium was supplemented with EGF and ciliary neurotrophic factor (CNTF) (20 ng/mL; R&D) for 15 days. After that, they were passaged and maintained in N2 medium containing only CNTF until around 100 DIV and then fixed for immunochemistry.
Differentiation of hES cells toward MPCs, osteoblasts, and adipocytes
Differentiation of hES cells toward MPCs
Mesodermal differentiation was obtained as previously described by our laboratory [22] using a modified protocol from Barberi et al. [23]. Briefly, differentiation was induced by plating 2 × 10⁴ ES cells/cm2 on 0.1% gelatin-coated dishes in the presence of knockout DMEM supplemented with 20% fetal bovine serum (Invitrogen), 1 mM
Differentiation of MPCs toward osteoblasts and adipocytes
To induce osteoblastic differentiation, cells were plated at a density of 30,000 cells/cm2 in a specific medium (Cambrex), containing dexamethasone, ascorbate, and B-glycerophosphate (Sigma-Aldrich). After 21 days, cell phenotype was analyzed by alkaline phosphatase activity (Sigma-Aldrich). Adipogenic differentiation was induced by culturing the cells in the specific medium (Cambrex) supplemented with 100 μM linoleic acid. Adipogenesis was detected by the presence of neutral lipids in the cytoplasm stained with Oil Red O.
Immunocytochemistry
Cells were fixed in paraformaldehyde for 20 min at room temperature, rinsed with PBS, and blocked with 1% bovine serum albumin, 5% goat serum 0.1% triton in PBS solution for 1 h, and thereafter were incubated with the appropriate primary antibodies overnight at 4°C. Rabbit polyclonal antibodies included Nestin (dilution 1/500; Chemicon) and GFAP (dilution 1/1,000; Dako). Mouse monoclonal antibodies (IgG) included TujI (dilution 1/500; Covance), Stro-1 (dilution 1:100), and alpha-smooth muscle actin (α-SMA: 1:100; Dako). Appropriate Alexa 488– and Alexa 555–labeled secondary antibodies were used at 1/500 and 4′,6-diamino-2-phenylindole at 2 μg/mL (Sigma) for counterstaining.
The preparations were analyzed by epifluorescence microscopy (Zeiss Imager Z1 and Zeiss Axiovert 40CFL) and images were captured with Axiocam mRM (Zeiss).
RNA sample preparation
mRNA samples were extracted using the RNeasy Mini kit (Qiagen) according to the manufacturer's protocols for undifferentiated hES cells, NPCs, and MPCs. RNA samples were quantified using the Nanodrop photometer and quality controls were performed on BioAnalyzer 2100 (Agilent). For reverse transcription-polymerase chain reaction (RT-PCR) analysis, cDNAs were prepared by reverse transcription of 500 ng of mRNA using the SuperScript II Reverse Transcriptase kit according to the manufacturer's instructions (Invitrogen). Primers used in this study are shown in Supplementary Table S1 (Supplementary Data are available online at
Hybridization and data analysis
RNA samples were labeled and hybridized on the GeneChip Human Genome HG_U133_Plus 2.0 Array (Affymetrix) by the RNG platform (Réseau National des Génopoles) according to the Affymetrix procedures. Hybridization data were exploited using Array Assist 4.2 software (Stratagene). First, the software validated the quality controls. Next, the GC-RMA statistical algorithm procedure was used to normalize hybridization intensity values. A 1-way analysis of variance test was applied on transformed logarithm base 2 data to retain values that did not changed significantly (α < 0.05) among triplicate samples. Identification of modulated genes was performed using the Student parametric statistical test adjusted with the FDR Benjamini-Hodgberg correction. A gene was considered as modulated for a fold change (FC) > 2 with a corrected P value, α
c < 0.05. The final list of modulated genes was established by removing duplicate data (multiple probesets measuring the same gene) to retain the most modulated one. Gene ontology (GO) biological processes and canonical pathways analysis enriched in differentially expressed genes were identified using the Fischer exact test as implemented in the Ingenuity Pathways Analysis (Ingenuity® Systems,
Results
Obtention of two homogenous neural and mesodermal progenitor cells from hES cells
Two hES cell lines (SA_01 and VUB_01) were induced in triplicate toward the neural lineage using the SDIA protocol (see Materials and Methods section). Under these conditions, neural rosettes appeared around 16–18 DIV (Supplementary Fig. S1A). To get a homogenous population, cell sorting was performed at DIV21 using the membrane marker NCAM (CD56) known to be expressed in neural precursors but not expressed in MS5 mouse feeder cells and to a small extent in the undifferentiated hES cells (Supplementary Fig. S1B). The NCAM-positive cells, termed NPCs, expressed a combination of markers known to be specific for the neurectodermic precursors such as NESTIN and the transcription factors SOX1, PAX6, and OTX2. Moreover, the NCAM-positive cells exhibited a complete loss of NANOG expression and did not express glial fibrillary acidic protein (GFAP) by RT-PCR (Supplementary Fig. S1C) or by immunochemistry (Supplementary Fig. S1D–F). The NCAM-positive cell population was able to give rise to cells positive for TUJ1 (βIII-tubulin) and for GFAP corresponding to neurons and astrocytes, respectively (Supplementary Fig. S1G, H). Differentiation of ES cells into MPCs displaying a phenotype similar to that described by previous authors [18 –21] was readily obtained after about 30 days of culture (2–3 passages). Cells displayed a homogeneous fibroblast-like morphology (Supplementary Fig. S2A). At near homogeneity, they expressed CD29 (β1-integrin), CD44 (H-CAM), CD73 (SH-3, ecto-5′-nucleotidase), CD105 (SH-2, endoglin), and CD166 (ALCAM), and were negative for hematopoietic markers (CD34, CD45, and CD14), neuronal markers (NCAM/CD56 and FORSE1), and the endothelial marker CD31 (Supplementary Fig. S2B). Cells were immunoreactive for Stro1 and some of them are positive for α-SMA (Supplementary Fig. S2C). In addition, these MPCs were also able to differentiate into osteogenic or adipogenic cells in appropriate conditions (Supplementary Fig. S2D).
Global analysis of gene expression
To compare the expression patterns during the commitment of hES cells toward the neural and the mesenchymal fates, transcriptome analysis was performed in triplicate on the 2 undifferentiated hES cell lines, SA01 and VUB01, and the 2 progenitor cell populations, NPCs and MPCs (Fig. 1A). The global expression profiles of these 3 populations were compared by correlation plot and by the Principal Component Analysis. A high correlation coefficient was observed between the expression patterns of the 3 replicates for each cell line and between the 2 cell lines indicating a small variability between the biological samples for the same stage of differentiation (Fig. 1B). Moreover, when the 3 distinct populations were plotted by Principal Component Analysis, samples for the same stage were very close (Fig. 1C). This allowed us to group the results obtained for the 2 cell lines for further statistical analysis. A total of 3,167 genes were found to be differentially expressed between NPCs and hES cells, 1,727 upregulated and 1,440 downregulated (Supplementary Tables S2 and S3), including genes with no annotation, putative genes and expressed sequence tags that amounted to about a quarter of all modulated genes. Parallel comparison between hES cells and MPCs revealed 5,931 genes modulated, including 2,212 genes upregulated and 3,719 genes downregulated in MPCs (Supplementary Tables S4 and S5). As expected, major markers of pluripotent hES cells, including NANOG, OCT4 [POU5F1], REX1 [ZFP42], FGF4, FOXD3, CLDN6, GDF3, DNMT3A, and CD2, were downregulated in both NPCs and MPCs. However, the expression of the pluripotency transcription factor SOX2 was maintained in neural progenitors, whereas it was switched off in mesenchymal progenitors.
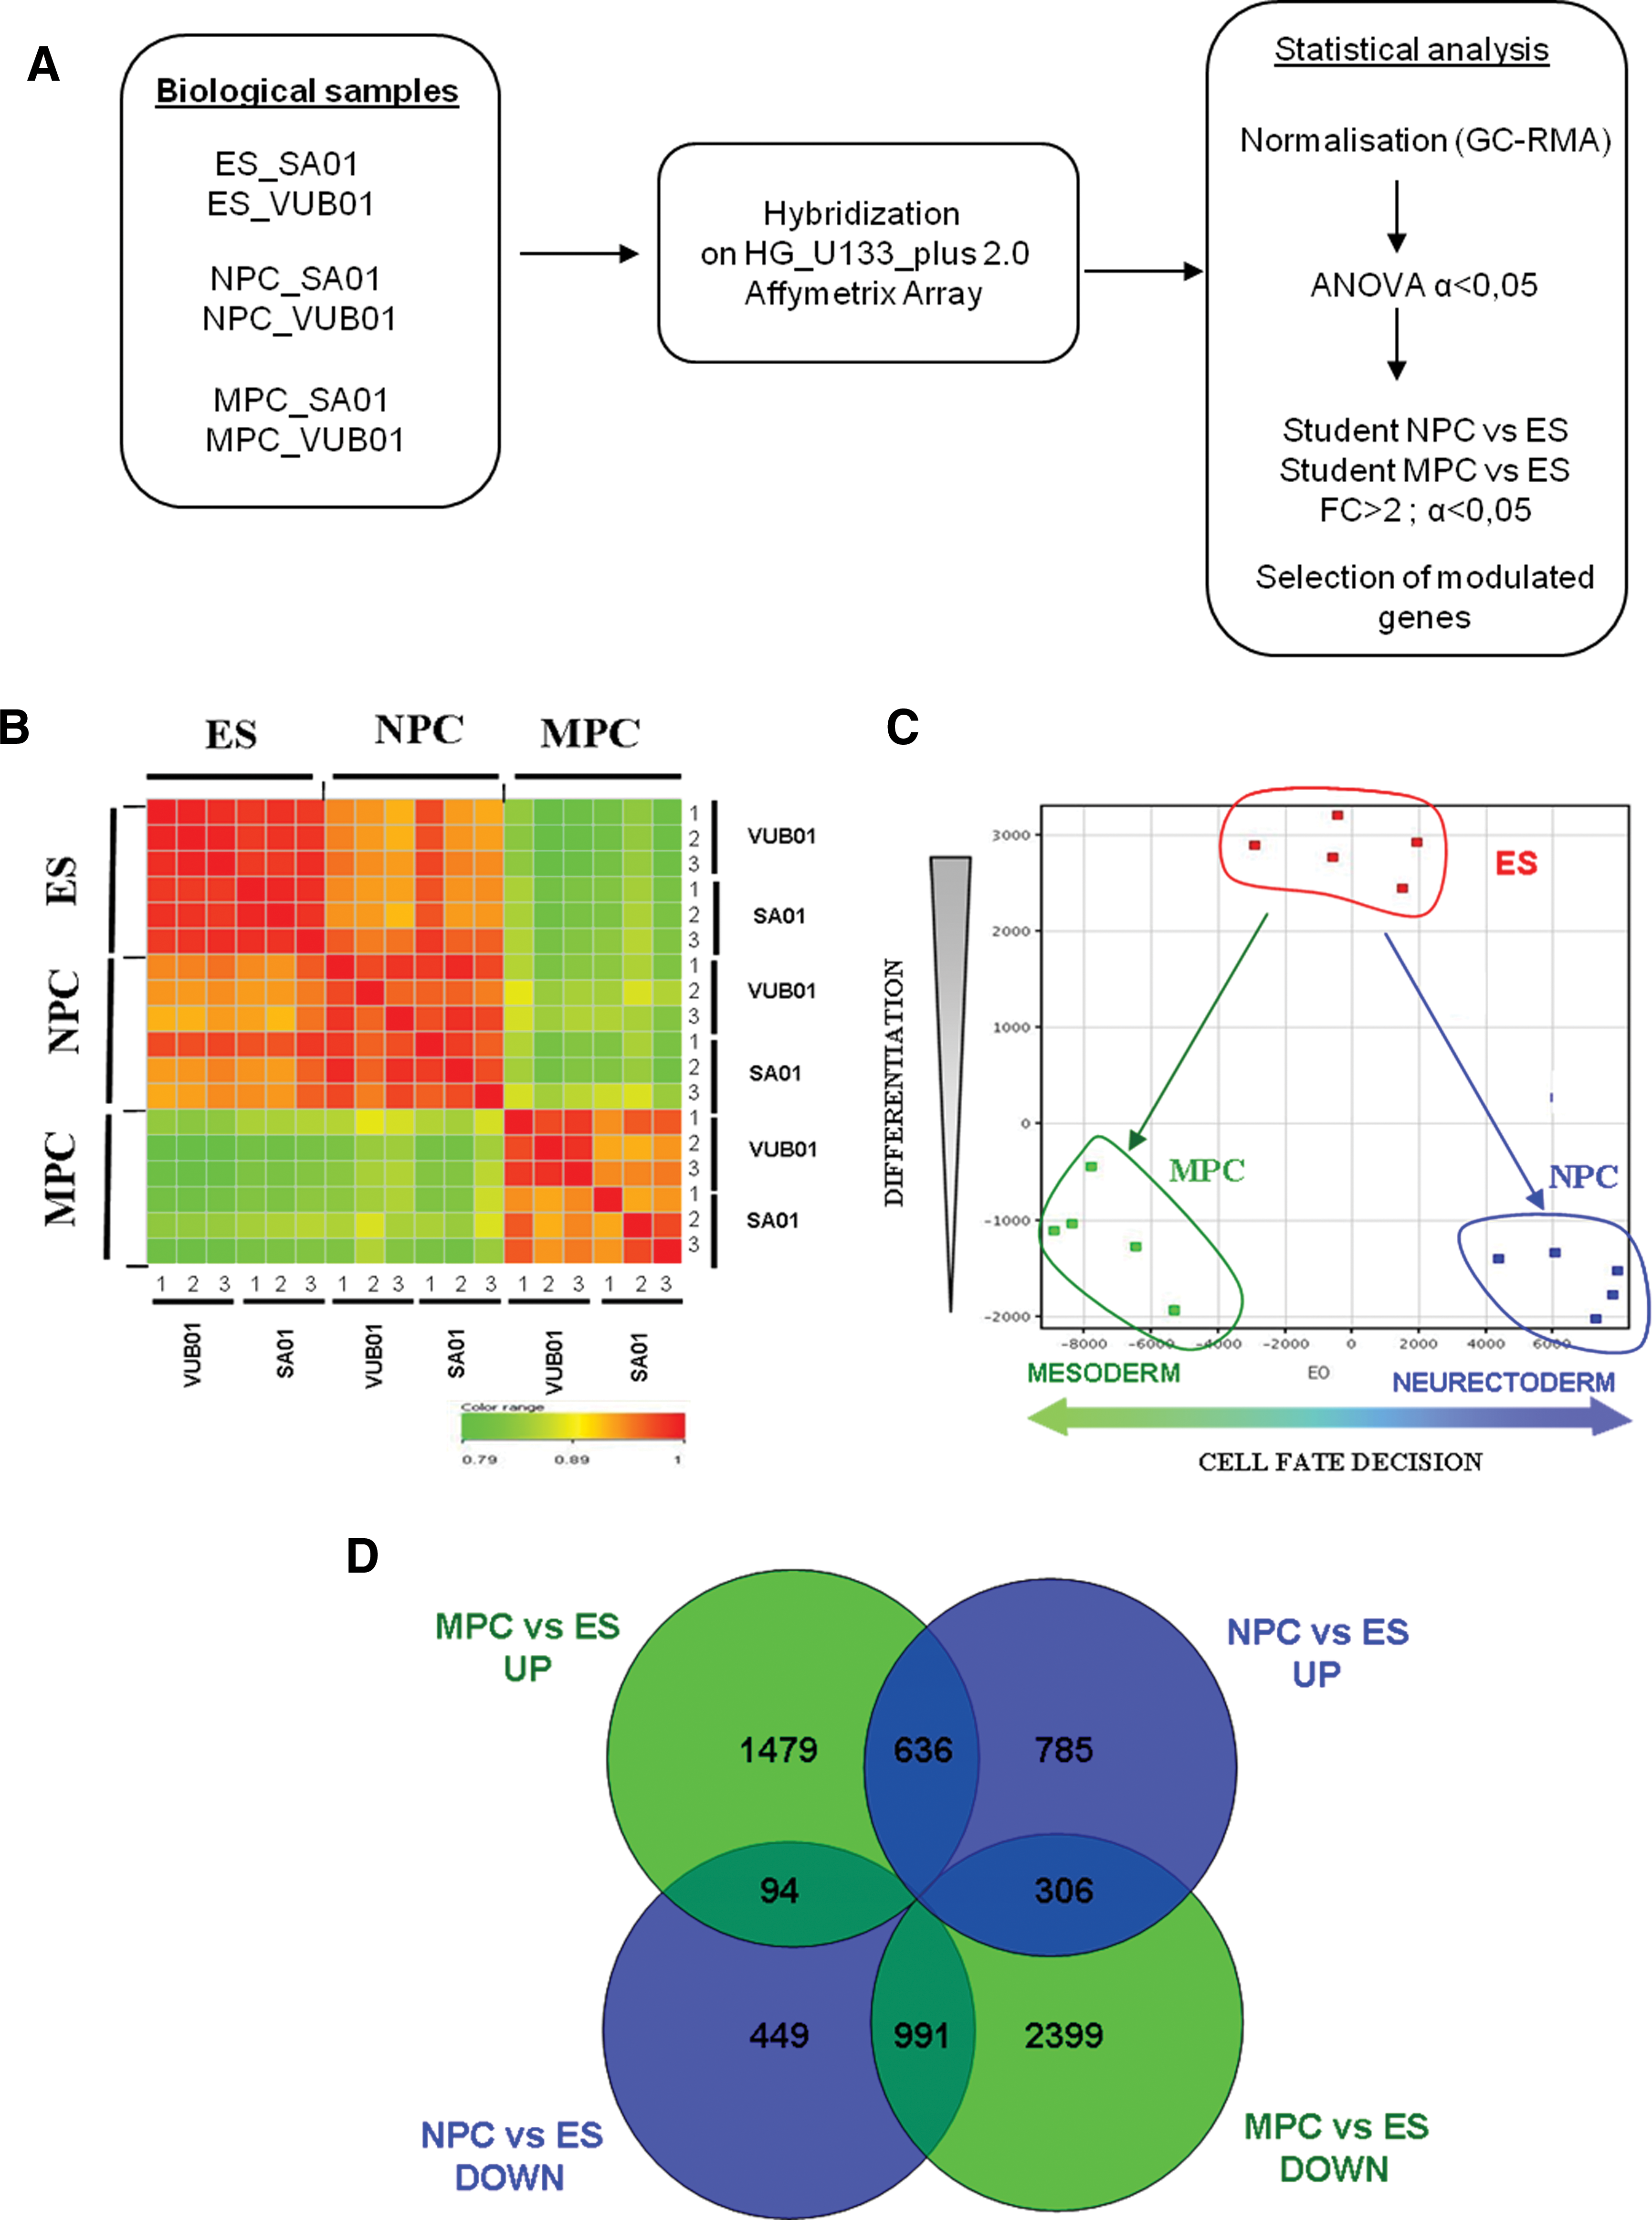
Global gene expression patterns analysis for the hES cells (ES) and the 2 precursor cells, NPCs and MPCs, derived from the same hES cells.
As quality control of genes modulated in the transcriptomic experiment, we found specific neural genes expected to be upregulated in NPCs compared to hES cells, such as NCAM, PAX6, SOX1, and OTX2. On the contrary, neither markers of mesoderm such as T/Brachyury, HAND1, IGF2, CD45, FLK1, CD31, MYOD, or CALP (Calponin) nor endodermal markers SOX17, FOXA2, GATA4, or AFP were found modulated. In the same way, concerning genes known to be implicated in the MSC phenotype, CD73/NT5E, CD105/ENDOGLIN, CD44, INTEGRIN β1/ITGB1, ALCAM/CD166, and VIMENTIN, were all found to be upregulated in MPCs compared to hES cells.
Subtractive gene expression profiling
The lists of the modulated genes in the NPCs and the MPC populations were compared (Fig. 1D). The 785 genes that are upregulated in NPCs but not in MPCs (Supplementary Table S6) and the subset of 306 genes that were upregulated in NPCs and downregulated in MPCs were selected as potential candidate genes involved in the neuralizing process (Supplementary Table S7). Conversely, the 1,479 genes that are upregulated in MPCs but not in NPCs (Supplementary Table S8) and the subset of 94 genes that were upregulated in MPCs and downregulated in NPCs were selected as potential candidate genes involved in the mesenchymal differentiation (Supplementary Table S9). Between the 2 selections of genes specifically implicated in the neuralization process or in the mesenchymal differentiation, we focused on transcription regulators that were specifically upregulated in each of both processes (Supplementary Table S10). For the neuralization process, among the 127 upregulated transcription regulators (Supplementary Table S10, left panel), for the 11 most modulated genes with an FC > 10, 8 were annotated in nervous system development (GO and Ingenuity Pathway Analysis [IPA] classifications), including genes such as LHX2, PAX6, ZIC1, FOXG1B, TFAP2B, ZBTB16, and EMX2, all implicated in the neural progenitor signature. Besides these genes, others were annotated to be involved in neural and other developmental processes, such as DACH1 and LEF1, or several members of family transcription factor such as the Inhibitor of DNA binding (ID2 and ID4), the POU domain family members (POU3F2 and POU4F1) but also the homeobox family members HOX (HOXA1 and HOXA9). In addition, genes found to be upregulated in NPCs and strongly downregulated in MPCs included SRY-related box protein members such as SOX3 and SOX11 or the member of the bicoïd sub-family of homeodomain-containing transcription factors such as OTX2, which encodes gene already reported to be involved in neurogenesis.
For the mesenchymal differentiation of the 118 upregulated transcription regulators (Supplementary Table S10, right panel), 25 were implicated in connective tissue development (IPA classification). The most modulated genes were SIX1, which encodes of the homeobox gene superfamily and 2 genes related to TGF-β signaling were highly upregulated, CDKN2B and TGF1B1I1.
Other modulated genes involved in development included several members of the Forkhead-box family (FOXD1, FOXF1, FOXF2, FOXJ2, FOXL1, and FOXP1), the basic helix-loop-helix family (BHLHE40 and BHLHE4), the Krüppel-like factors (KLF2, KLF7, and KLF9), signal transducers and activators of transcription (STAT1, STAT2, STAT3, and STAT6), T-box members (TBX2 and TBX3), and homeobox family members (HOXB2 and HOXB7).
Transcriptional networks using an in silico approach
Global gene networks were built based on selected genes exhibiting specific overexpression in each precursor, as described above, for either the neural (Fig. 2A) or the mesenchymal differentiation (Fig. 2B). Starting from the core pluripotency gene network composed of the 3 transcription factors, NANOG, OCT4, and SOX2, their potential targets were explored by selecting genes that were specifically upregulated in each precursor cell population.

Global gene networks. Networks were constructed using the Ingenuity software based on expression relationships described in the literature. Modulated genes are represented as a box with its gene symbol inside.
For the neural gene network, the starting point was the binding relationship linking PAX6 and LHX2 promoters with NANOG, OCT4, and SOX2 proteins encoded by the core pluripotency genes. Using this strategy, the construction of the gene network step by step revealed some nodes that included key transcription factors, including downstream NOTCH1 targets such as HES1 HES5, and LEF1 but also PAX3 that may support a pivotal role with its complex partner SOX10. Otherwise, NOTCH1 downstream signal was also connected with the SWI/SNF DNA remodeling complex (SMARCC4 and SMARCE1).
For the mesenchymal gene network, WWTR1 (also termed TAZ) implicated downstream of TGFB1, acted on the level of expression of NANOG and POU5F1, and thus may control several developmental genes, including GATA6. Moreover, SOX2 (whose expression was maintained in neural but greatly decreased in mesenchymal differentiation) was connected with 2 critical genes involved in osteogenic differentiation, JUN and TWIST1. Organization of the network also included PPARG, which is involved in differentiation of MSCs toward adipocytes, and STAT3, which acts downstream of the FGF signaling pathway and is involved in differentiation process.
Alternative signaling pathways controlling cell fate decisions
Levels of gene expression were explored in 3 signaling pathways, Notch, Wnt, and TGF-β/Activin/BMP that are known to be involved in hES cell fates determination but required different partners depending of lineage-specific differentiation.
Notch signaling pathway
Some genes encoding for ligands of Notch, such as JAG1 and DLL1, were found to be upregulated in the NPCs but not in the MPCs (Fig. 3A, B). Regarding the receptors in this pathway, NOTCH1 was specifically upregulated in the NPCs; NOTCH2 was found upregulated in both progenitor cell types, whereas other family members of NOTCH receptors were not modulated. Genes implicated in the modulation of the activity of NOTCH signaling that were specifically upregulated in NPCs included LFNG (encoded a fucose-specific glycosyltransferase), ADAM17 (encoded a metallopeptidase involved in the proteolytic release of Notch intracellular domain from the Notch1 receptor), and PSEN1 (presenilins-1) involved in the cleavage of the Notch receptor and the regulation of gamma secretase activity. On the contrary, NUMB encoding for an inhibitor of the Notch pathway and playing a role in the determination of cell fates during development was specifically overexpressed in MPCs. At least, specific transcriptional factors HES1 and HES5, downtream targets of Notch signaling, were found specifically upregulated in NPCs but not in MPCs, whereas others family members were not modulated in either progenitor cell types. On the contrary, NUMB, encoding for an inhibitor of the Notch pathway, play a role in the determination of cell fates during development. Additionally, other downstream transcriptional factors of the Hairy/enhancer-of split related with YRPW motif family exhibited similar expression profiles in the 2 progenitor cell types (ie, upregulation of HEY1 and down regulation of HEY2). Specific overexpression of DLL1, NOTCH1, HES1, and HES5 was confirmed in NPCs by quantitative RT-PCR (Fig. 3C).

Comparison of gene expression modulations within Notch signaling pathway either in NPCs or in MPCs. Modulated genes are represented as a box with its gene symbol inside. Genes upregulated by comparison with hES cells are in red and those downregulated in green. Color intensities of genes were correlated to FC intensities. The symbol () indicated a relation of “inhibition” and ( ) a relation of “activation” between genes in the path.
Wnt signaling pathway
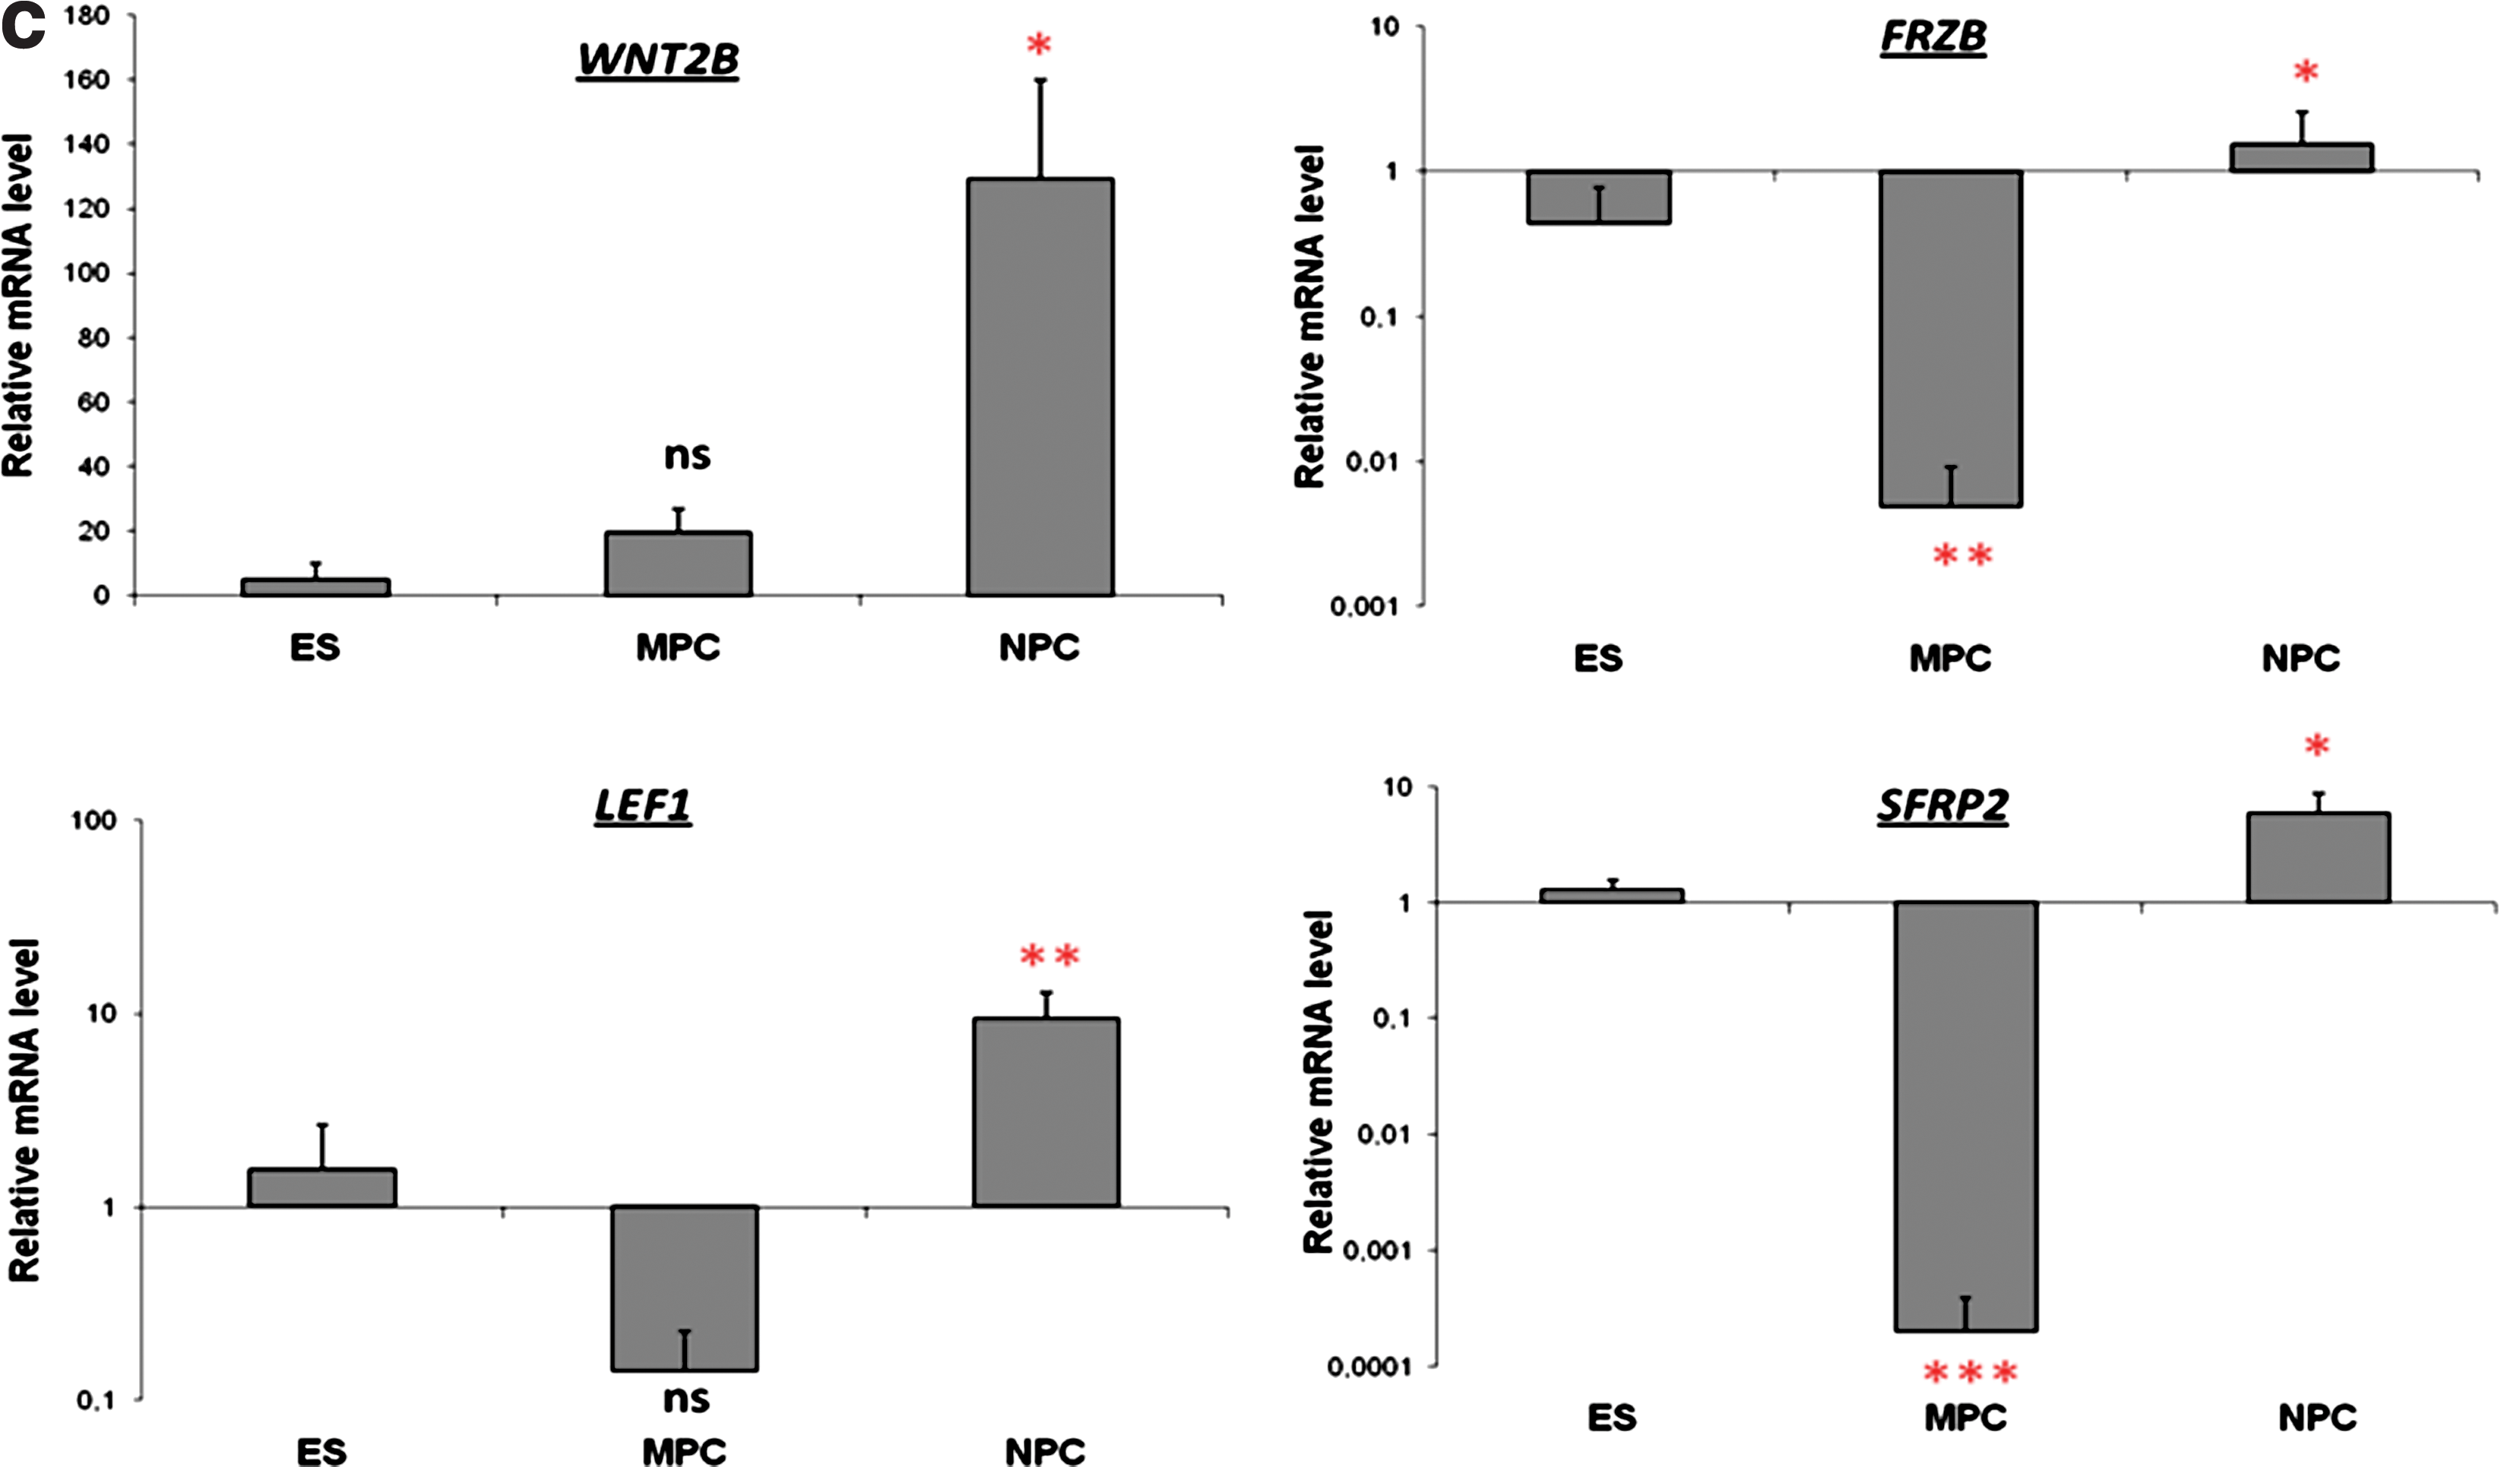
Concerning genes involved in the Wnt signaling pathway, overexpression of genes encoding negative regulators of this canonical pathway was observed in the NPCs, whereas genes modulated in MPCs rather reflected its activation (Fig. 4A, B). Indeed, Wnt inhibitors, including secreted antagonists such as DKK1, SFRP2 and FRZB, were all overexpressed specifically in NPCs. In addition, genes encoding for Wnt ligands such as WNT2B, reported to be a repressor of the canonical pathway, appeared to be specifically upregulated in NPCs, whereas WNT5A and WNT5B, 2 noncanonical ligands, were found to be modulated in the 2 types of progenitors. For the Wnt Receptors, notably Frizzled proteins, FZD3 and FZD5, were found, respectively, upregulated or not regulated in neural progenitors, whereas they were both switched off in mesenchymal progenitors. Concerning transcriptional regulators involved downstream of Wnt signaling pathways, genes involved in the repression of the β-catenin complex were found to be upregulated only in NPCs such as the SOX transcription factor SOX3 but also CTNNBIP1, a gene encoding a small soluble inhibitory protein also termed ICAT (inhibitory of beta-catenin and TCF), which prevents the interaction of β-catenin with different binding partners, including LEF1. In addition, the gene encoding for the transcription repressor TLE4, a member of the Groucho family, was also found upregulated only in the NPCs. Finally, when looking for the expression of genes known to be controlled directly downstream of the canonical β-catenin pathways, some genes, such as DCT, POU3F2, and NRCAM, controlled downstream of the complex containing LEF1 appeared to be induced in NPCs, whereas no modulation of these genes was observed in the MPCs. On the contrary, genes encoding important Wnt-induced mesenchymal markers such as FOSL1, JUN, PPARδ, and CD44 were all upregulated in the MPCs, whereas the expression of these genes was not modulated in the NPCs. To confirm these results, expression modulations for several genes, WNT2B, FRZB, SFRP2, and LEF1, involved in Wnt signaling pathway were confirmed by quantitative PCR using new biological samples in triplicate from 3 independent differentiation experiments. Results showed that they were found to be upregulated in NPCs and not modulated or downregulated in MPCs compared to hES cells (Fig. 4C).

Comparison of gene expression modulations within canonical Wnt/β catenin pathway either in NPCs or in MPCs. Same legend as described in Fig. 3.
TGF-β/Activin/BMP signaling pathway
Among the genes involved in BMP/TGF-β signaling pathways (Fig. 5A, B), BMP7 expression was upregulated during the differentiation of hES cells toward NPCs, whereas it was switched off during their differentiation toward MPCs. Interestingly, we also found upregulation of FST gene in MPCs encoding follistatin, an inhibitor of BMP pathway (Fig. 5C). In contrast, the upregulation of INHBA (inhibin beta A, also termed Activin A), which encoded a strong inducer of mesendoderm, was overexpressed only in MPCs (Fig. 5D). Differences between others modulated genes encoding for TGF-β ligands were also found such as upregulation of TGFB1 specifically in MPCs. Concerning downstream transcriptional factors target, we found an upregulation of SMAD3 in both NPCs and MPCs, respectively, whereas SMAD5 was found slightly modulated only in NPCs.
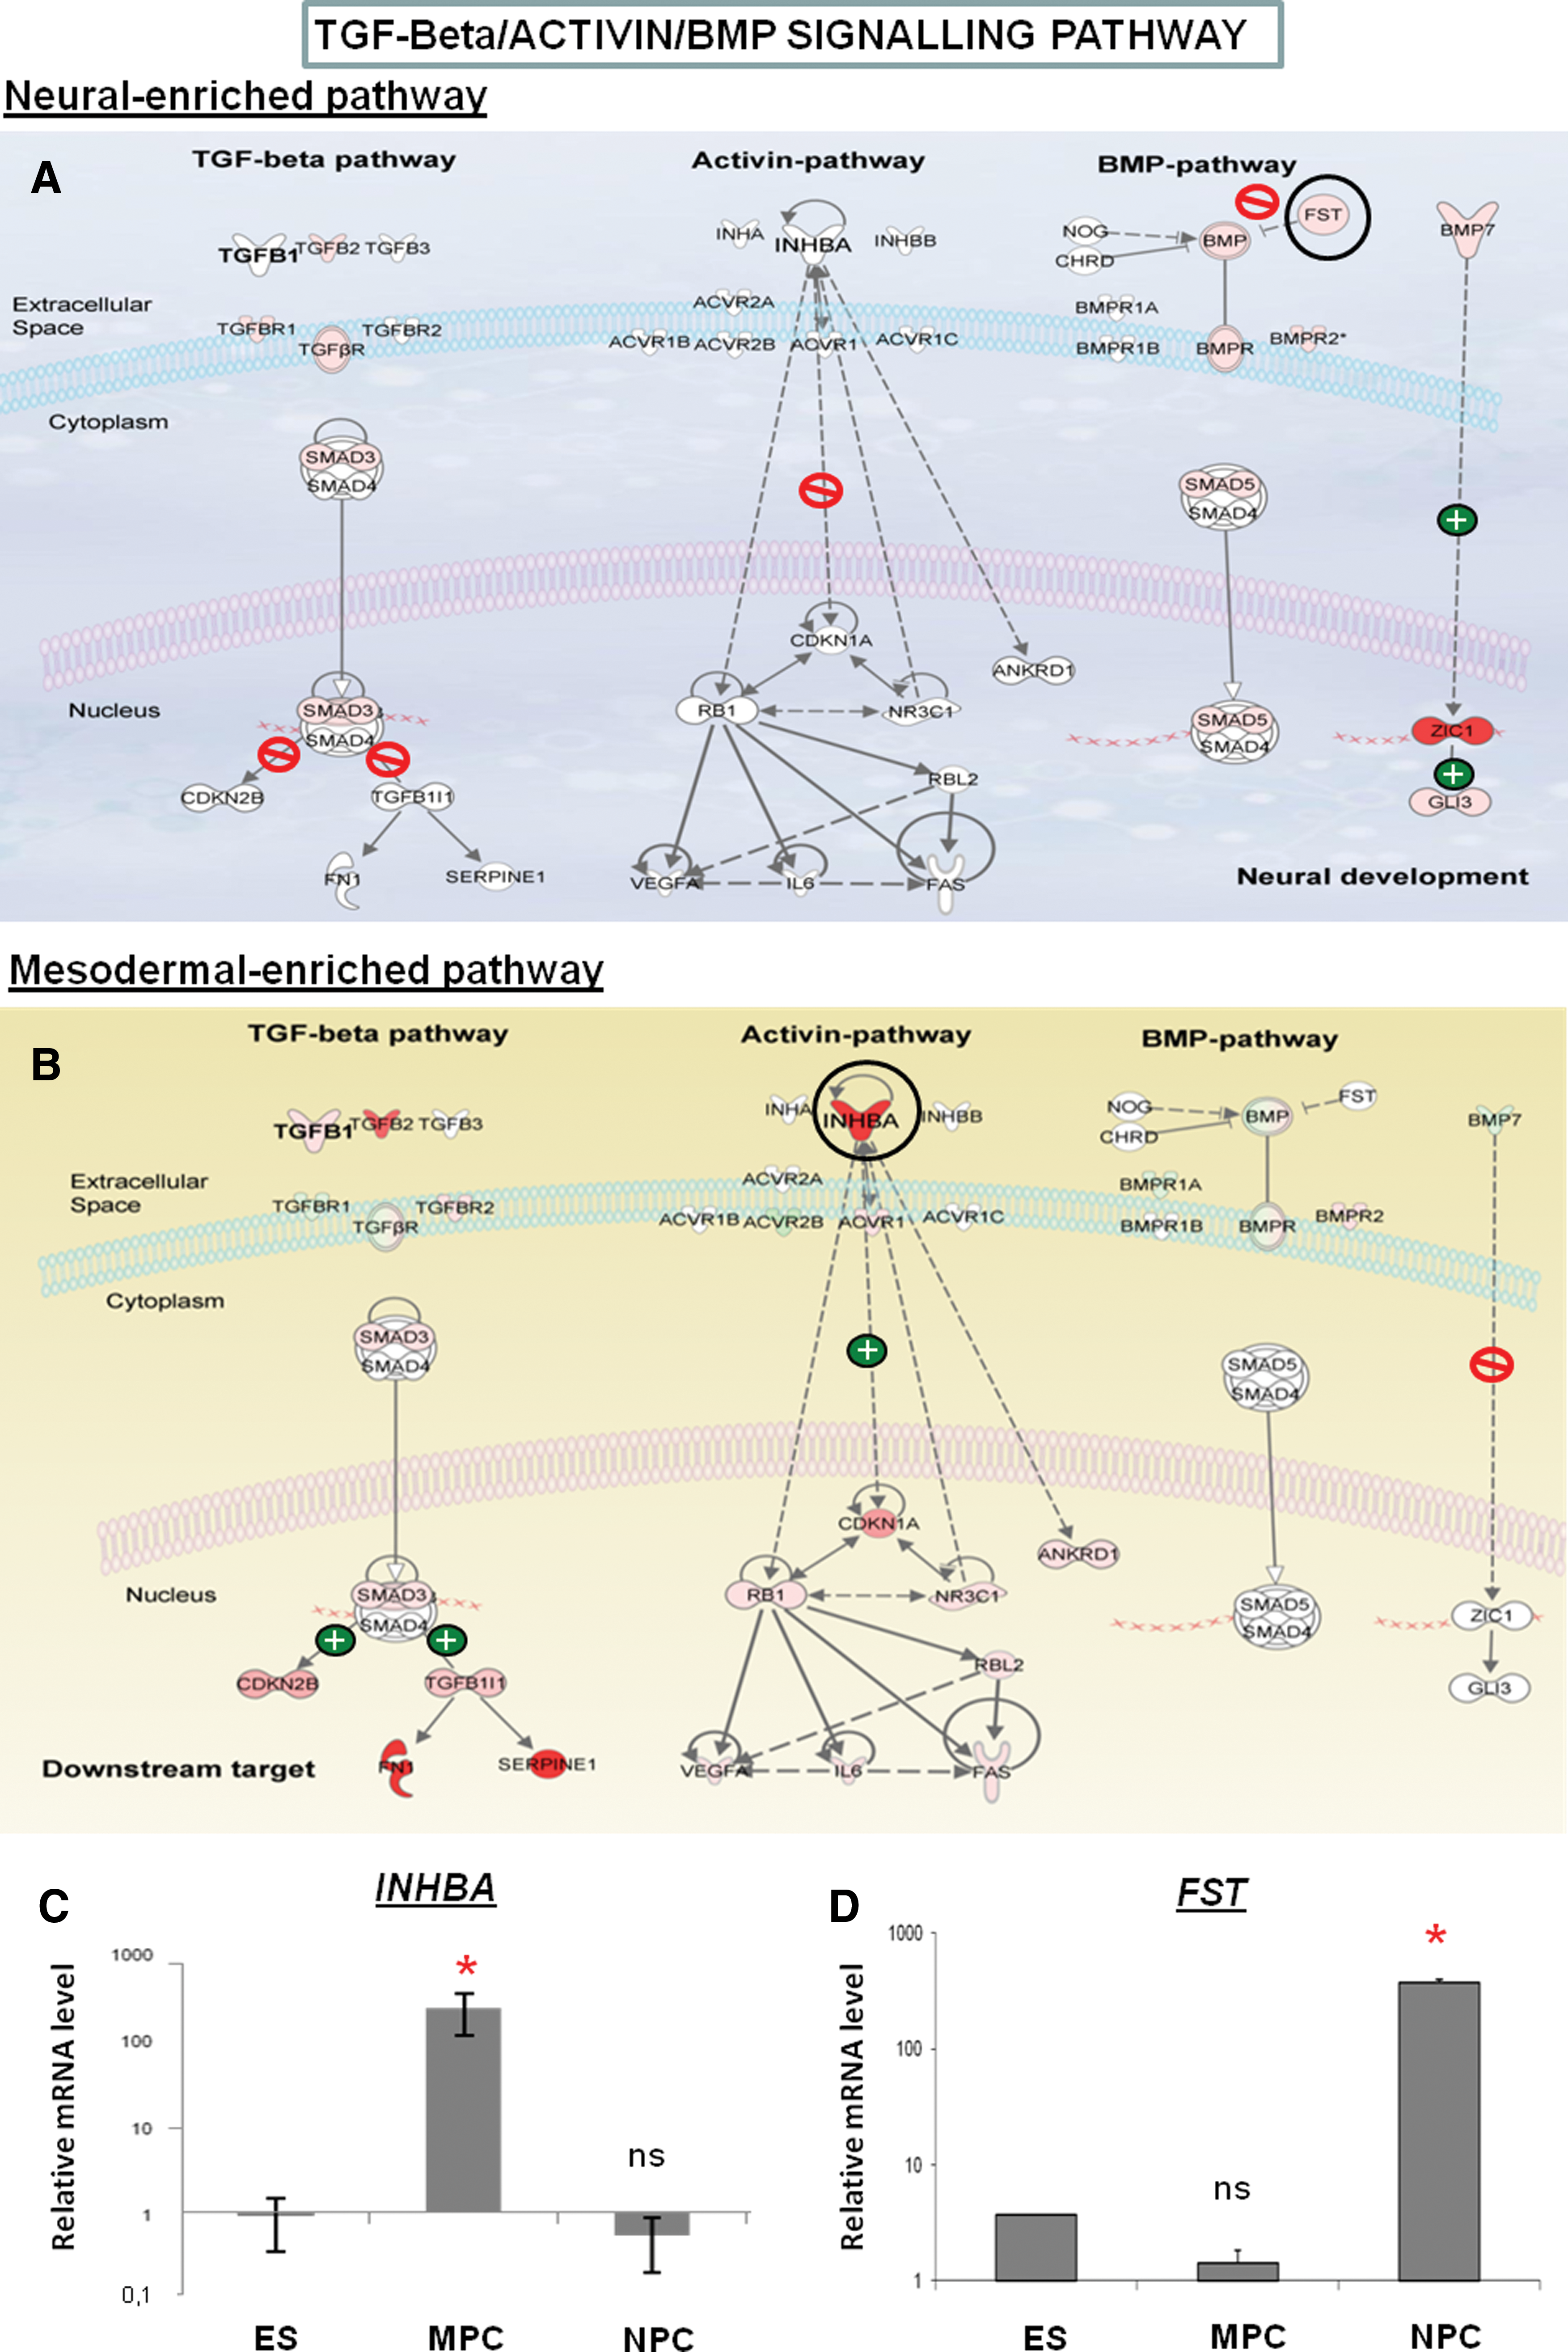
Comparison of gene expression modulations within TGF-β/Activin/BMP signaling pathway either in NPCs or in MPCs. Same legend as described in Fig. 3.
At last, to confirm expression modulation of genes specifically involved in one of these signaling pathways in either neural or mesenchymal progenitors, quantitative PCR data were obtained from new independent biological samples (Supplementary Fig. S3).
Discussion
The principal result of this study is the comparison of gene expression profiles in 2 homogenous populations of neural and mesenchymal of progenitors by subtractive gene expression profiling during early differentiation in hES cells toward either neural or mesodermal commitment. Genes whose expression levels were regulated in opposite directions might be of particular interest in molecular processes involved in the alternative cell fate decisions. Using a comparative strategy, we identified actors specific for each lineage that play an alternative role at the level of epigenetic modifications, implication of morphogens and through major developmental signaling pathways.
The integration of all these data allowed the construction of a global comprehensive developmental path between neurectoderm and mesoderm (Fig. 6).

Comprehensive developmental path model based on our gene expression data that may be controlled the hES cell fate decision toward either neural or mesodermal fates. Color images available online at
Specific gene expression pattern associated with each precursor cell
Transcriptional factors found to be specifically highly upregulated in NPCs included LHX2, PAX6, SIX3, SIX6, SOX1, and FOXG1B. This gene signature indicated that our neural progenitors exhibited a pattern closed to early neural progenitors appearing first in neural plate and/or neural tube in mouse and human during normal development in vivo. Unlike late neural progenitors, these cells expressed markers representative of the anterior region of the mouse developing brain, including FOXG1, EMX2, or OTX2, and markers of dorsal region such as PAX3 or PAX6. This anterior pattern was associated to a broad capacity of differentiation into various types of neurons and to glial cells in response to appropriate developmental clues. Thus, the present study presented for the first time a picture of gene expression network specifically associated to the neural developmental pathway of these progenitors.
Mesenchymal progenitors derived from hES cells appeared to be the first type of progenitors exhibiting a mesodermal phenotype that can be obtained almost homogeneously [18]. Identification in this study of genes specifically upregulated in MPCs highlighted potential factors that may play a role in the mesoderm formation including TWIST1. This gene is expressed in presumptive mesoderm and in invaginating cells in the ventral region of fruit fly embryos and functions in a signaling cascade to initiate mesodermal development during gastrulation in multicellular organisms ranging from Drosophila to vertebrates [24 –26]. TWIST plays a central role in dorsoventral patterning, which is essential for multiple steps of mesoderm development in Drosophila [27,28]. Another interesting gene is WWTR1/TAZ, which was known to control the mechanism of self-renewal through controlling Smads nucleo-cytoplasmic shuttling [29 –31] and thus may contributing to the cell fate choice by controlling mesodermal genes. Among other genes that may represent important developmental nodes, RUNX2 and SQSTM1, which are both involved in skeletal development, were highlighted, suggesting that early mesodermal progenitors acquire a developmental context that enhances osteogenesis.
Epigenetic modification signatures
The transcriptional signature also deciphers the role of another type of developmental regulation that concerns genes involved in epigenetic modifications.
Among genes that are differentially expressed during neural or mesoderm differentiation, genes encoding helicases that function to open chromatin to enhance transcription in the SWI/SNF DNA chromatin remodeling complex family, including SMARCC1 and SMARCE1, were found specifically upregulated in the neural progenitors and may interact with proteins encoded by other specific genes such as ARID2 and ARID1B [32,33]. These proteins may play a role in enhancing differentiation by coupling gene repression with global and local changes in chromatin structure [34]. In MPCs, specific upregulation of SMARCA2 was observed, which has been described to be specific of mesoderm in early postimplantation mouse embryos [35].
Morphogen implications
Another aspect of the transcriptional signatures concerns morphogens that act through signaling pathways. BMP7 was found to be upregulated in neural progenitors, and therefore these cells may themselves produce morphogens that contribute to control downstream genes involved in neural development, including ZIC1 [36] and GLI3 [37]. In MPCs, the upregulation of INHBA encoding the beta A subunit that forms a homodimer named Activin A was reported to be one of the most important mesodermal morphogens in classical developmental models, including Xenopus laevi [38]. More recently, Willems and Leyns described that Activin A supported self-renewal of hES cells and directed the nascent mesoderm toward axial mesoderm and mesendoderm [39]. This increase also coincides with upregulation of the Activin receptor type 1, ACVR1. Inversely, inhibition of Activin/Nodal signaling promotes specification of hES cells into neurectoderm [40]. In this context, the follistatin, encoding a protein that antagonizes Activin [41,42] and BMP signaling pathway in Xenopus embryo [43], is specifically upregulated in NPCs. This might suggest that follistatin may contribute to induce neural differentiation of hES cells in vitro by antagonizing the different pathways (BMPs, Activin, and TGF-β). Indeed, currently, the most efficient protocol allowing hES cells differentiation toward neurectoderm uses Noggin (an inhibitor of BMPs) and SB43542 (an artificial molecule inhibating Activin and TGF-β pathways) [44,45].
Altogether, these data suggest that once the mesenchymal phenotype has been acquired, these precursors may maintain a mesodermal identity by producing themselves important morphogens such as Activin A and inversely the neurectodermal phenotype may be maintained by producing follistatin that prevents activation of Activin pathways.
Alternative pathway responses
Wnt and Notch pathway responses occurred during both neural and mesenchymal differentiation. Although discussed, different studies described a “negative” effect of WNT/β catenin signaling pathways onto the neural induction process in vivo [46] and in vitro in mouse ES [47,48]. Indeed, upregulation of expression of some modulators/inhibitors of the Wnt signaling was observed in NPCs (but not in MPCs), including SFRP2, identified elsewhere to enhance neural differentiation [47] but also FRZB, another Wnt inhibitor found expressed in neural plate and neural tube in overlapping areas like SFRP2 during chick development [49]. During and just after gastrulation, the Wnt pathway was also involved as an inducer of primary mesenchymal cells, but specific genes involved in this process are still unknown or elusive due to differences between species. In this study, we found that gene expression modulations of Wnt pathway members in mesenchymal cells but not in neural cells, including DKK3, which is both temporally and spatially regulated [50], may play a role in mesoderm formation in humans and have been demonstrated in Xenopus laevis [51]. Additionally, a distinct profile of genes downstream of the Wnt signaling pathway was also observed. Neural progenitors did not express numerous genes known to be controlled by CTNNB1, whereas they were expressed in MPCs. In contrast, a possible mechanism would be due to the expression of the inhibitor of the interaction of βcatenin with LEF1. Thus, LEF1 may interact with other proteins and control a neural gene network downstream. Concerning the Notch signaling pathway, the central role of NOTCH1-specific pathway already described was confirmed as an important path for the maintenance of the neural progenitor state [52,53], whereas the downregulation of NOTCH1 was already reported to enhance the differentiation of mesodermal cardiogenic progeny [32]. Here, DLL1, one of the NOTCH1 ligands, was found highly upregulated in NPCs and may contribute to induce HES1 and HES5 transcription factors acting by their dominant effect on neurogenic transcription factors and therefore to delay the differentiation of neural precursors in mature neurons maintaining a “neural precursor state.” Conversely, DLL1 was downregulated in MPCs, suggesting a process that closely controls this gene during the transition toward either neural or mesoderm identity.
Some genes connected to Notch signaling were also described that may support central interactions in the global neural gene network. For example, SOX10 that interacts with PAX3 may reflect some features of neural crest development as demonstrated in cells surrounding neural rosettes in culture [54] and in the neural crest origin of the Waardenburg syndrome in humans [55]. WNT inhibition pathways associated with NOTCH1 activation may be involved in expression of LEF1-specific expression contributing to an explanation of the specific regulation of downstream neural genes such as NRCAM, DCT, and POU3F2. Concerning the acquisition of the mesenchymal phenotype, our data suggested that the differentiation involved a developmental process mimicking the TGF-β-induced epithelial–mesenchymal transition (EMT) process. Numerous genes involved downstream of TGF-β1 signaling pathways that have already been described as major contributors of the EMT type 1 process were found to be upregulated [56,57]. During embryonic development, the EMT is a crucial cellular process whereby adherent cells dissolve their intercellular contacts, organize their motility apparatus, and move to new locations. As observed in vivo during the EMT, during mesenchymal differentiation of hES cells, we found the loss of epithelial cell adhesion markers, including E-box genes including E-cadherin (CDH1) but also claudin (CLDN3/6/10/23), occludin (OCLN), and loss of some polarity genes such as Discs Large (DLG3/7) [58], Crumbs homolog3 (Crb3) [59], and conversely the acquisition of mesenchymal markers, including fibronectin (FN1), vimentin (VIM), and thrombospondin-1 (THBS1). It can be postulated that TGF-β1 signaling may reflect in part the biology of the mesenchymal progenitors. Moreover, SIX1, a developmental gene encoding for a homeodomain transcription factor, was the most upregulated transcription regulator in MPCs. It is known to cooperate with TGF-β and to increase the downstream EMT-induced TGF-β signal leading to the acquisition and/or maintenance of the stem cell-like phenotype accompanying EMT [60,61].
In conclusion, based on the production of precursor cell populations at near homogeneity, our data describing modulation of gene expression should contribute to a better comprehension of gene regulations involved in fate choices during differentiation of embryonic stem cells.
Footnotes
Acknowledgments
The authors wish to thank Dr. Marc Peschanski for continuous support and input during this study. This work was supported by the Association Française contre les Myopathies (AFM), MediCen (IngeCell program), and Genopole. The authors thank the platform of RNG, Institut Curie, Paris, France, for performing Transcriptome experiments, Phillippe Rameau for cell sorting, Lina Kassar-Duchossoy for astrocytes differentiation, and Drs. Alexandra Benchoua, Anselme Perrier, Laetitia Aubry, and Cécile Martinat for their expertise in the field and helpful discussions.
The gene expression data have been deposited in GEO Data Bank with the accession no. GSE8590.
Author Disclosure Statement
No competing financial interests exist.
References
Supplementary Material
Please find the following supplemental material available below.
For Open Access articles published under a Creative Commons License, all supplemental material carries the same license as the article it is associated with.
For non-Open Access articles published, all supplemental material carries a non-exclusive license, and permission requests for re-use of supplemental material or any part of supplemental material shall be sent directly to the copyright owner as specified in the copyright notice associated with the article.