
Abstract
Mesenchymal stem cells (MSCs) are adult multipotent cells able to differentiate toward mature mesodermal lineages. In spite of more than a decade of investigation, little is known about the molecular mechanisms regulating the undifferentiated state and the identity of distinct functional subpopulations in these cells. Transcription factors that regulate the maintenance of the pluripotent state in embryonic stem cells, including NANOG, SOX2, and OCT4, have been proposed to play a similar role also in adult stem cells, although with conflicting results. We performed a critical evaluation of expression of these 3 transcription factors and found that NANOG, but not OCT-4 and SOX-2, is expressed in cultured human adult MSCs. Actually, NANOG was not expressed in freshly isolated MSCs, but was detected only after in vitro culture. NANOG was detected only in proliferating cells, but not in MSCs induced to differentiate. The percentage of cells expressing NANOG was maintained throughout early passages of MSCs, but then started to decrease in late passages in MSCs from adipose tissue and heart but not from bone marrow. However, the number of NANOG-expressing cells did not associate with the proliferative and differentiative capabilities of MSC populations, neither its expression appeared to identify cells having stem or progenitor cell properties. Accordingly, we propose that activation of NANOG expression in MSCs is associated with, although cannot directly regulate, the transition from in vivo quiescence to adaptation to in vitro growth conditions.
Introduction
H
Since MSCs from human adult tissues represent a promising source of cells for a wide range of cellular therapies, there is high interest in better understanding the mechanisms underlying proliferation, differentiation, and heterogeneity of these cells [11]. Studies on MSCs gene expression have led to the identification of several genes and proteins differentially expressed during proliferation and differentiation [12 –15]. In addition, Wnt proteins and their downstream signaling pathways play an important role in controlling proliferation and differentiation of MSCs [16], and TAZ, a β-catenin-like molecule, acts as a transcriptional regulator during the early stages of MSCs differentiation toward bone and fat [17]. However, in spite of many insights attained during the last decade, the molecular mechanisms regulating proliferation and multipotency of MSCs have not been clarified yet.
The molecular basis of proliferation and multipotency are well understood in other stem cells system such as embryonic stem (ES) cells, where expression of 3 transcription factors, namely, OCT-4, SOX-2, and NANOG, is important in regulating ES cells' self-renewal and differentiation [18,19]. Given their function in ES cells, expression of OCT-4, SOX-2, and NANOG has been also proposed to play a similar role in adult multipotent cells, including MSCs. Expression of OCT-4 and SOX-2 transcripts has been reported in MSCs isolated from different tissues [11,20 –25]. Further, OCT-4 has been proposed to target a set of genes in MSCs, some of which are related to those regulated in ES cells, further suggesting a functional role of OCT-4 in regulating MSCs multipotent properties [21]. Recently, however, it has been argued that the presence of several transcribed OCT-4 pseudo-genes may have generated false-positive results on OCT-4 mRNA expression [26 –28]. In addition, recent studies on OCT-4 expression in somatic stem cells, including MSCs, challenged a functional role of OCT-4 in adult stem cells, concluding that expression of OCT-4 is not required for self-renewal and differentiation ability of somatic stem cells [28,29]. NANOG expression has been also reported in adult stem cells [4,21], although it has been investigated at lesser extent than OCT-4 in MSCs. In a different, yet complementary line of experiments, NANOG overexpression has been shown to have both a profound effect on trans-differentiation of C2 cell lines along the osteogenic lineage [30] and to increase proliferation and osteogenic potential of transduced human MSCs [31], suggesting its involvement in regulating proliferation and differentiation of cell populations other than ES cells. On the other hand, NANOG expression has to be highly controlled in normal cells, as high levels of NANOG expression have been observed in different types of cancer and its forced expression in NIH3T3 cells resulted into a transformed phenotype [32 –34].
In the present study, we performed a critical evaluation of OCT-4, SOX-2, and NANOG expression in MSCs by polymerase chain reaction (PCR) using primers carefully selected to avoid detection of pseudogenes as well as by immunofluorescence. Expression of OCT-4 and SOX-2 was not detected by both PCR and immunofluorescence experiments, whereas NANOG expression was observed by PCR and confirmed by immunostaining experiments. NANOG was not expressed in freshly isolated MSCs, but was detected only after in vitro culture. However, in cultured MSCs, the number of NANOG-positive cells did not associate with proliferative and differentiative capabilities of MSC populations, neither NANOG expression appears to identify cells having stem or progenitor cell properties. We therefore conclude that activation of NANOG expression in MSCs may result from, although cannot directly regulate, the transition from in vivo quiescence to adaptation to in vitro growth conditions.
Materials and Methods
Isolation and propagation of human MSCs
All tissues analyzed in this study were obtained after informed consent. Human bone marrow MSCs were isolated as previously described [2]. Briefly, iliac crest bone marrow aspirates (n = 4) were diluted in phosphate-buffered saline (PBS) and mononuclear cell fraction was separated by Ficoll-Hypaque gradient centrifugation. Cells were washed twice in PBS, suspended in the proliferation medium, plated in 55-cm2 Petri dishes [passage 0 (p0)], and grown until 80% confluence. Human adipose tissue MSCs were isolated as previously described [3]. Briefly, subcutaneous white adipose tissue biopsies (n = 7) were washed twice in PBS, mechanically minced, and digested for 1 h at 37°C in PBS containing 0.075% Collagenase Type IA and 2 mM CaCl2. Collagenase digestion was blocked with an equal volume of the proliferation medium and undigested adipose tissue was discarded after centrifugation at 1,700 rpm. Pelleted cells were re-suspended in the proliferation medium, filtrated in 100 and 70 μm cell strainers, plated in 55- or 150-cm2 Petri dishes (p0), and grown until 80% confluence. MSCs from cardiac tissue were isolated as previously described [15]. Briefly, cardiac auricola biopsies (n = 3) were mechanically minced and blandly digested for 15 min at 37°C in Dulbecco's modified Eagle medium (D-MEM) containing 0.075% Collagenase Type IV and 0.1% trypsin. Partially digested cardiac fragments were cultured as explants for 2 weeks. Emerging fibroblast-like cells (p0) were detached and expanded as MSCs. All cell populations were grown in the same proliferation medium consisting of basal medium (α-MEM) supplemented with 10% fetal bovine serum (FBS), 100 U/mL penicillin, and 100 μg/mL streptomycin. From p1, the medium was changed every 3/4 days and all cell populations were serially passaged at a plating density of 4,000 cells/cm2. The passaging ratio was 1:2 in early passages of all cell populations, whereas it slightly decreased in late passages of bone marrow- and heart-derived MSCs.
Flow cytometry
Bone marrow MSC, adipose tissue MSC, and heart MSC cell populations were analyzed for cell surface antigen expression by fluorescence-activated cell sorting (FACS). Briefly, 1 × 10⁵ cells from MSC preparations were incubated for 30 min at 4°C in 2 mM ethylenediaminetetraacetic acid/0.5% bovine serum albumin (BSA)/PBS (FACS buffer) with the following mAbs: CD34-APC, CD 45-FITC, CD49e-PE, CD90-PE/Cy5, CD117-PE, HLA/ABC-APC, HLA/DR-PE/Cy5 (all from BD Biosciences), CD13-PE, CD44-FITC (both from DAKO), and CD105-PE (Santa Cruz). Identical IgG isotypes (BD Biosciences) served as negative controls. Threshold was adjusted in forward and side scatter dot plot to exclude cellular debris, and a total of 20,000 events were analyzed on a FACS-Calibur flow cytometer running CellQuest software (BD Biosciences).
Differentiation of human MSCs
Adipogenic differentiation was induced by culturing MSC populations in α-MEM supplemented with 10% FBS, 0.5 mM 3-isobutyl-1-methylxanthine (IBMX), 1 μM dexamethasone, 10 μM insulin, and 0.2 mM indometacin. After 2 weeks cells were fixed in 4% paraphormaldeide and stained with Oil Red-O to observe lipid droplets. Adipogenic differentiation was quantified by 100% ethanol extraction of bound dye as previously described [35]. The absorbance of each extracted well was measured at 540/620 nm and then normalized for DNA content.
Osteogenic differentiation was induced by culturing MSC populations in α-MEM supplemented with 10% FBS, 0.1 μM dexamethasone, 50 μM ascorbate, and 10 mM β-glycerophosphate. After 4 weeks cells were fixed in 4% paraphormaldeide and stained with Alizarin red to observe mineralized matrix apposition.
Osteogenic differentiation was quantified as previously described [36]. Bound Alizarin red was extracted in 10% acetic acid for 30 min at room temperature. Extracted dye was heated at 85°C for 10 min and ice-cooled for 5 min. The absorbance of each extracted well was measured at 450/620 nm and then normalized for DNA content.
DNA was extracted overnight at 37°C in TRIS/EDTA buffer (TE) 0.2% sodium dodecyl sulfate and 1 mg/mL pronase. To quantify DNA content, 0.1 μg/mL Hoechst 33,258 was added to each sample and the absorbance was measured at 355/460 nm.
Chondrogenic differentiation was induced by culturing 0.3 × 10⁶ pelleted MSCs in D-MEM (high-glucose) supplemented with 0.1 μM dexamethasone, 150 μM ascorbate, 40 μg/mL L-proline, 100 μg/mL sodium pyruvate, 0.1% insulin, transferrin, selenous acid (ITS premix), and 10 ng/mL transforming growth factor β3. After 3 weeks micromasses were stained with Alcian-blue or included in Oct. Cryosections of 7 μm were fixed in 4% paraphormaldeide and then stained with Alcian-blue to observe proteoglycans deposition.
Clonal analysis
Freshly isolated adipose tissue-derived MSCs were plated to obtain <1 clone/cm2. Only clones of no more than 50 cells were isolated by cloning rings. Each selected clone was present as a single clone in one microscopic field. Isolated clones were expanded and differentiated as described above.
Reverse transcriptase-PCR experiments
Total RNA was extracted following manufacture's instruction (RNeasy, QIAGEN) and treated with DNase I using RNase-free DNase set to eliminate genomic DNA. RNA (1 μg) was reverse transcribed using 200 U of Moloney murine leukemia virus reverse transcriptase (MLVT; Promega), 2 mM dNTPs, and 0.25 mg of oligo (dT) (Invitrogen). In control samples MLVT was not added. RNasin (Promega) was added to the reaction mix to avoid RNA degradation. Aliquots of total cDNA were amplified in 25 mL of PCR reaction mixture containing 1× MgCl2-free buffer, 1.5 mM MgCl2 (both from Roche Molecular System), 0.2 mM dNTPs mix (Promega), 1.5 U/reaction of AmpliTaq Gold Polymerase (Roche Molecular System), and 10 pmol of the following pair of primers (Invitrogen)—NANOG forward, 5′-TCCAGGATTTTAACGTTCTGCT-3′; reverse, 5′-TTCTTGCATCTGCTGGAGGC-3′ (578 bp; NM_024865.2); OCT-4 forward, 5′-AGCCCTCATTTCACCAGGCC-3′; reverse, 5′-CCCCCACAGAACTCATACGG-3′ (292 bp; NM_002701.4); SOX-2 forward, 5′-ACACCAATCCCATCCACACT-3′; SOX-2 reverse, 5′-GCAAACTTCCTGCAAAGCTC-3′ (224 bp; NM_003106.2); β-actin forward, 5′-CAACTCCATCATGAAGTGTGAC-3′; reverse, 5′- GCCATGCCAATCTCATCTTG-3′. PCR conditions included an initial denaturation step of 10 min at 94°C, followed by 35 cycles of 1 min denaturation at 94°C, 1 min at annealing temperature and 1 min extension at 72°C, with a final elongation step at 72°C for 5 min. Amplified products were separated by electrophoresis on a 2% agarose gel and observed by ethidium bromide staining.
Immunofluorescence assays
Cells grown onto poly-lysinated cover-slips were fixed with ice-cold methanol and incubated for 1h at room temperature in blocking solution consisting of PBS/0.2% BSA/10% normal goat serum or 10% FBS. The following primary antibodies were incubated overnight at 4°C: monoclonal mouse anti-OCT-4 (1:50; Santa Cruz), polyclonal goat anti-SOX-2 (1:50; Santa Cruz), policlonal rabbit anti-NANOG (1:50; Abcam), polyclonal goat anti-NANOG (1:100; R&D systems), and monoclonal mouse anti-CD146 (1:50; Novocastra). After incubation with primary antibodies, cells were washed with PBS and then incubated with Cy2-cojugated goat anti-mouse immunoglobulin G (IgG) or Cy3-conjugated goat anti-rabbit IgG or Cy3-conjugated donkey anti-goat IgG (Jacksons ImmunoResearch Laboratories) for 1 h at room temperature. After nuclear staining with 4′,6-diamidino-2-phenylindole (Calbiochem), slides were mounted with MÖVIOL and analyzed with an Axioplan 2 Microscope (Zeiss). Quantification of positive cells was carried out by counting at least 300 cells within randomly selected microscopic fields.
Immunoprecipitation experiments
MSCs were washed with ice-cold PBS and lysed on ice for 30 min in radio immunoprecipitation assay buffer. Sonicated lysates were centrifuged at 14,000 g for 10 min. The supernatant from cell lysates was collected, and the protein concentration was measured using Bradford Reagent (Bio-Rad Laboratories). Protein G–agarose (PGA) beads were washed 3 times with PBS and incubated for 2 h in a rotor at 4°C in radio immunoprecipitation assay buffer with PMSF and protease inhibitor cocktail (Roche). About 300 μg of protein recovered from cell supernatants were precleared with 20 μL PGA slurry for at least 1 h on a rotor at 4°C. PGA beads were removed by centrifugation at 14,000 g for 5 min at 4°C. Immunoprecipitation was performed by overnight incubation/rotation at 4°C with 2 μg of polyclonal goat anti-NANOG (R&D systems). A no antibody control was also included for each sample. After incubation, 20 μL of PGA beads was added to immunoprecipitated samples and returned to 4°C for 3 h with rotation. PGA beads with bound protein complexes were recovered by centrifugation at 14,000 g for 5 min at 4°C, and beads were washed once with PBS and 0.2% Triton X-100 and twice with PBS. For western blotting, sodium dodecyl sulfate sample buffer was added to the samples before boiling for 5 min. The samples were separated using denaturing acrylamide gel and transferred to PVDF membranes (Hybond™-P; GE Healthcare). Membranes were saturated with 5% nonfat dry milk in tris buffered saline (TBS) containing 0.1% Tween 20 (TBS/T), for 1 h at room temperature and incubated overnight at 4°C in a solution of TBS/T with 0.5% BSA containing the anti-NANOG primary antibody (1:250). Secondary anti-goat IgG antibody conjugated to horseradish peroxidase were incubated with the membranes for 1 h at room temperature at 1:4,000 dilution in TBS/T with 5% nonfat dry milk. Immunoreactive bands were detected by SuperSignal West Pico chemiluminescent reagent.
Results
General characteristics of MSCs cultures
MSC populations were isolated from bone marrow (n = 4), adipose tissue (n = 7), and cardiac biopsies (n = 3) and maintained in culture for a minimum of 15 population doublings. FACS analysis indicated that MSCs expressed classical mesenchymal cell-surface antigens such as CD13, CD29, CD44, CD49e, CD90, CD105, and HLA-ABC and were negative for hematopoietic/endothelial markers such as CD34, CD45, CD117, and HLA-DR (Supplementary Table S1; Supplementary Data available online at

Proliferation and differentiation ability of cultured MSCs.
Reverse transcriptase-PCR and immunofluorescence experiments on OCT-4, SOX-2, and NANOG expression
After the initial characterization of the properties of MSC populations prepared above, we verified expression of OCT-4, SOX-2, and NANOG in these cells. The existence of several transcribed pseudo-genes for OCT-4 and NANOG, but not for SOX-2, has been reported [37,38]. Accordingly, we designed oligonucleotides discriminating against these pseudo-genes, to detect the correct OCT-4 and NANOG transcripts. Expression of OCT-4 and SOX-2 mRNAs was never detected in any of the 14 MSC preparations analyzed, whereas NANOG transcript was amplified in all cultured MSC populations tested (Fig. 2A). In agreement with the reverse transcriptase (RT)-PCR results, in immunofluorescence experiments, MSCs did not label with specific OCT-4 and SOX-2 antibodies, whereas a fraction of nuclei stained positive for NANOG antibody in all cell populations analyzed (Fig. 2B). Immunofluorescence experiments for NANOG expression were also performed with a second anti-NANOG antibody (see Materials and Methods), yielding identical results (data not shown), thus confirming expression of the NANOG protein in MSCs. In contrast, we never obtained evidence of OCT-4 and SOX-2 expression in MSCs neither by RT-PCR or immunofluorescence, confirming previous reports for undetectable level of OCT-4 in adult stem cells [28]. However, NANOG-specific signal in MSCs, both in RT-PCR and immunofluorescence experiments, was always dimmer than that of ES and embryonic carcinoma (EC) cells that were used as positive controls (compare lane 1–3 with lane 4 in Fig. 2A and upper left panel with upper right panel in Fig. 2B). In agreement with the lower intensity of the NANOG-specific signal in RT-PCR and immunofluorescence experiments, a NANOG-specific band was detected in western blot experiments with extracts from EC cells but not in those from MSCs (data not shown). However, a faint band corresponding to the predicted molecular weight of NANOG was consistently detected by immunoprecipitation assays in protein extracts from MSCs prepared from bone marrow and adipose tissue. The predicted NANOG band was never observed in immunoprecipitation assays with protein extracts from Sarcoma Osteogenic cell lines, which do not express NANOG (Fig. 2C).
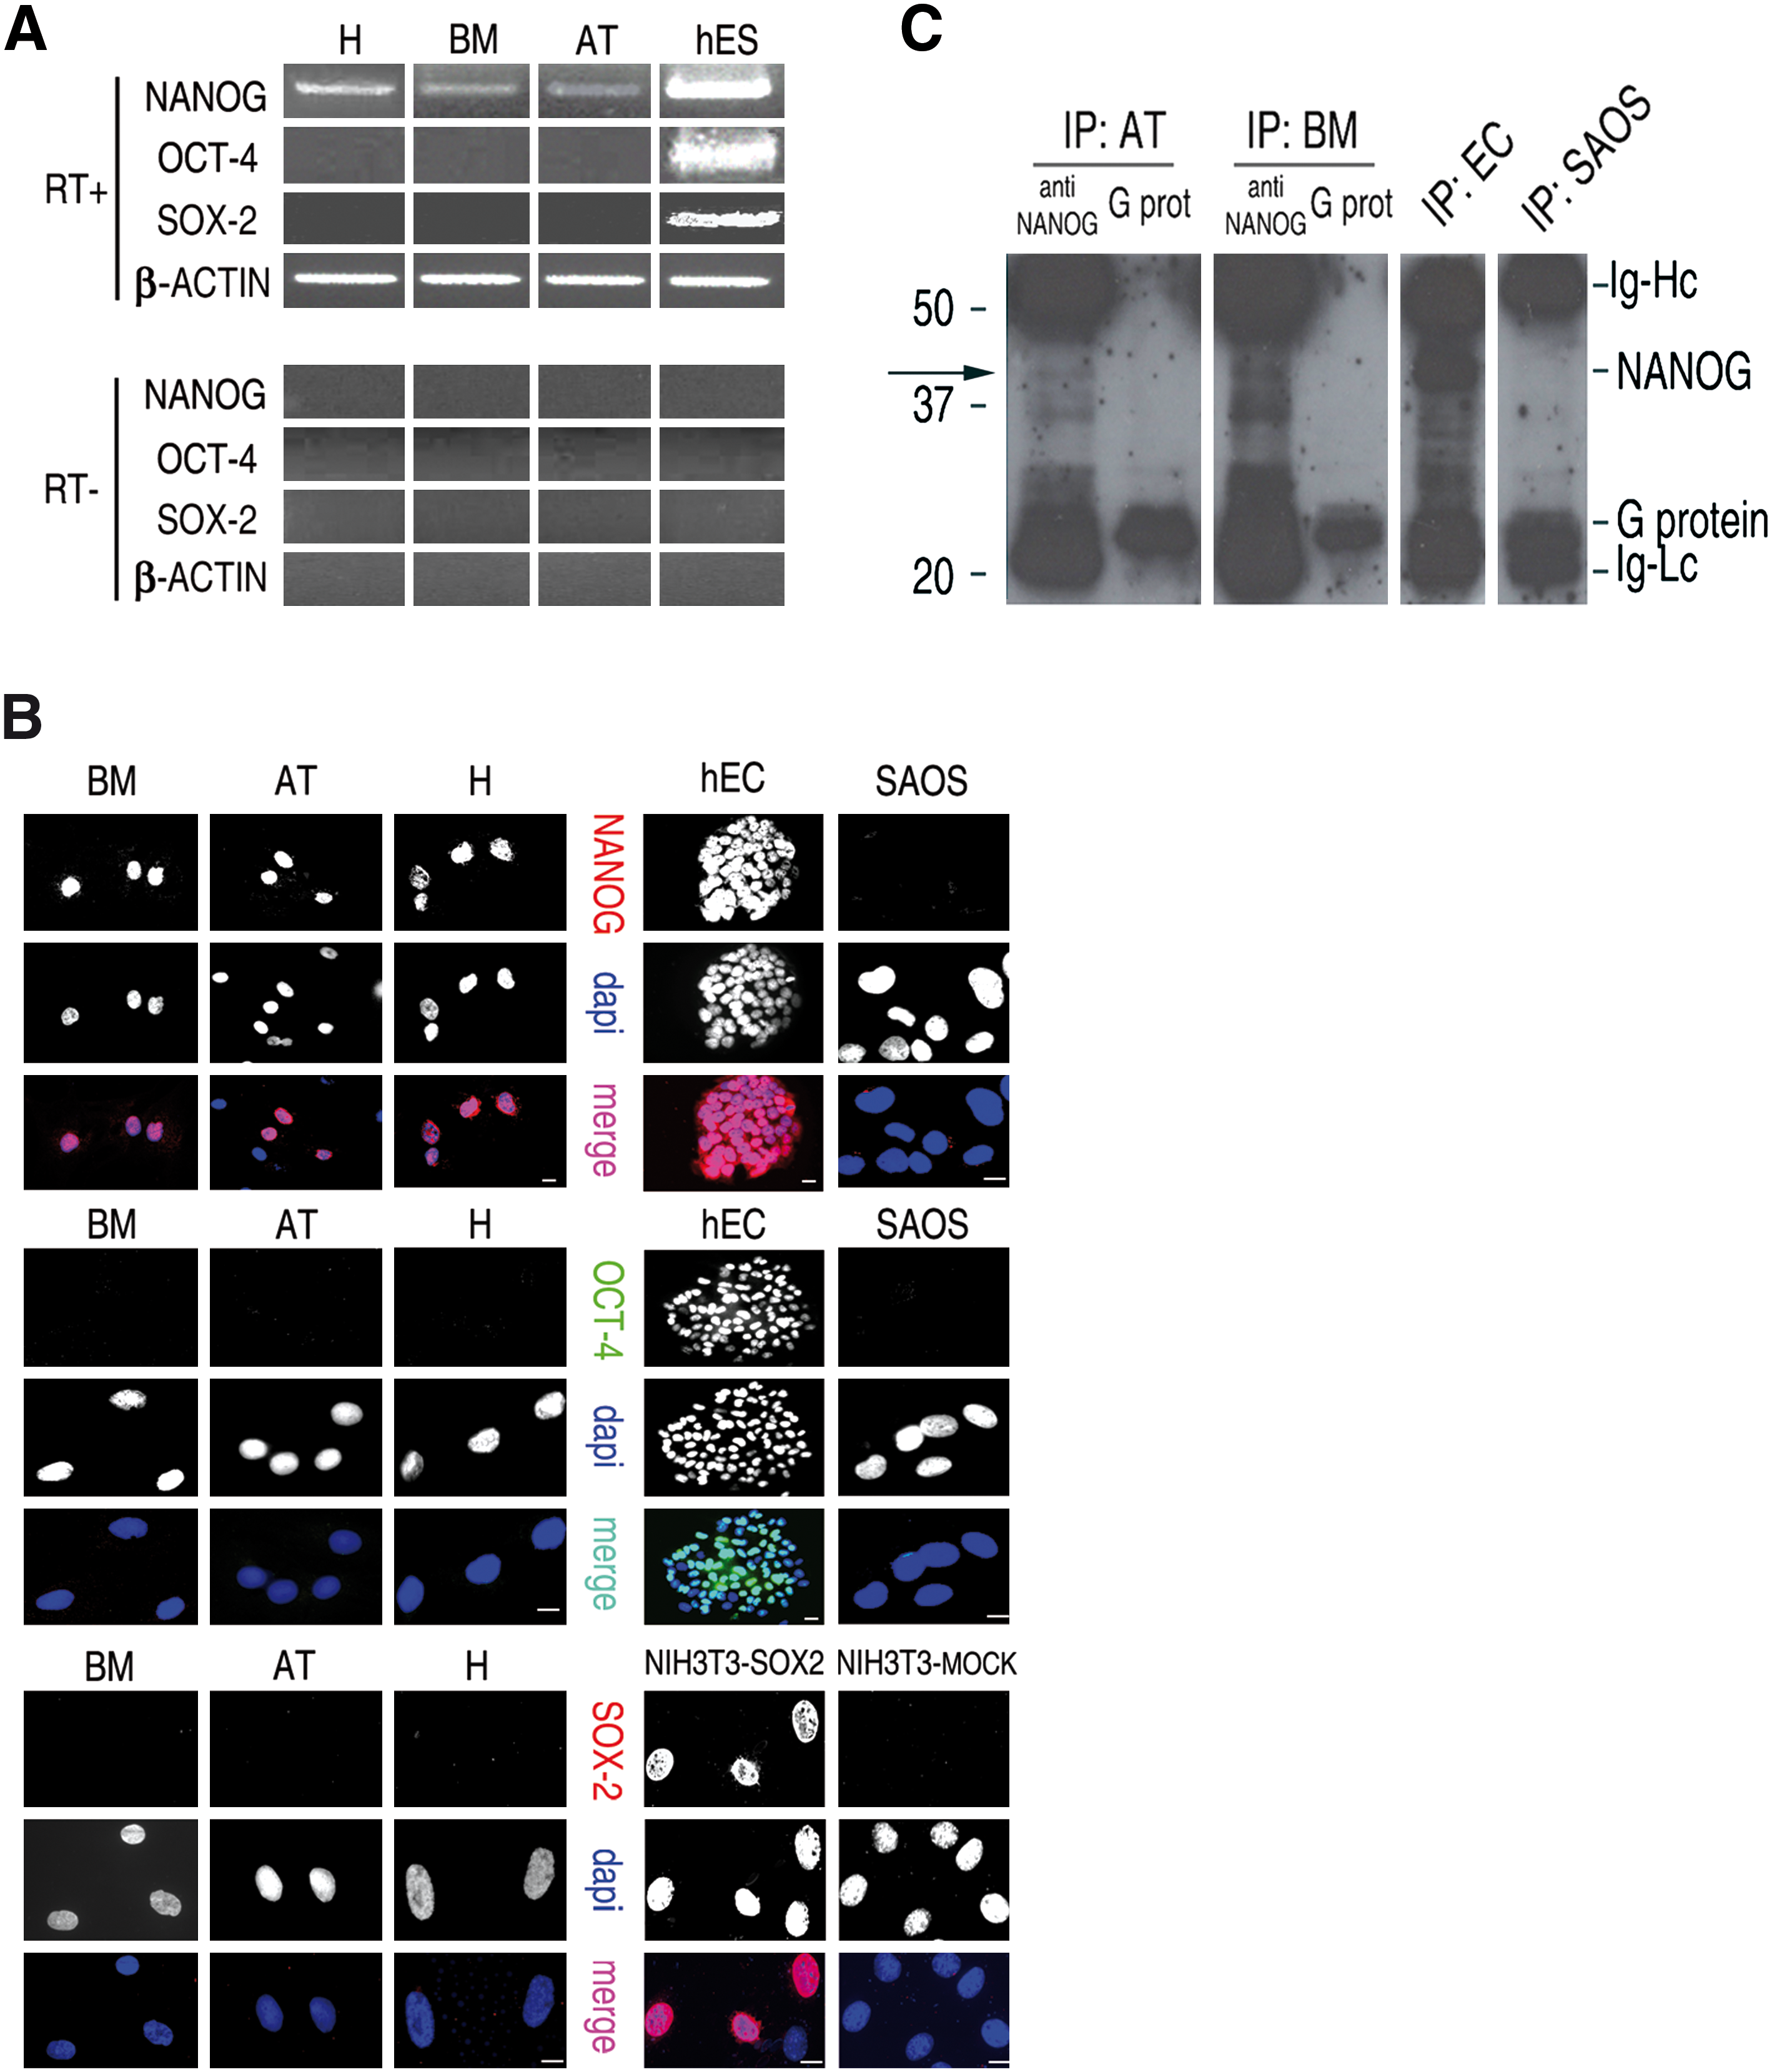
OCT-4, SOX-2, and NANOG expression in MSCs.
NANOG expression in MSCs is observed only after in vitro culture
On the basis of the results obtained by RT-PCR, immunofluorescence, and immunoprecipitation assays, we then focused our attention on expression of NANOG in MSCs. In contrast with data obtained with cultured MSCs, in freshly isolated (p0) MSCs, we never detected NANOG-expressing cells (Fig 3A). Nevertheless, after the first passage in vitro, a NANOG-specific signal started to be detected in some of the nuclei of MSCs from all 3 tissues in all MSCs tested (Fig. 3A). A careful investigation performed by immunostaining on consecutive passages of MSCs from bone marrow, adipose, and cardiac tissues revealed that in all the MSC populations analyzed NANOG was always expressed in the nuclei of a variable fraction of cells. As shown in Fig. 3C, the mean percentage of NANOG-positive cells did not significantly differ between early passages of MSCs from the 3 tissues, although the percentage of NANOG-expressing cells varied up to 5-fold among different MSC preparations even isolated from the same tissue. However, after extended in vitro passaging, the average percentage of NANOG-positive cells remained constant in MSCs from bone marrow, but was significantly reduced in MSC from adipose and cardiac tissues (Fig. 3C, D). In all cases, the number of NANOG-positive cells decreased after induction of differentiation (Fig. 3E).

NANOG expression in early and late passages of cultured MSCs.
NANOG expression in isolated clonal populations and in CD146-positive MSCs
MSC cultures are known to be a heterogeneous populations of cells, containing progenitors able to differentiate into 1 or more mesodermal cell types, in addition to a variable number of nullipotent cells [9,10]. To verify whether the presence of NANOG-expressing cells would correspond to a subpopulation of MSC with specific properties with respect to differentiation ability, 31 individual cell clones were isolated at p0 from an adipose tissue-derived cell preparation. These clonal cell populations were expanded and then induced to differentiate toward adipogenic, osteogenic, and chondrogenic phenotypes. According to their differentiation potential, clones were classified as nulli- uni-, bi-, and tri-potent clones (Fig. 4A). As shown in Fig. 4A, the percentage of NANOG-expressing cells in these clones was found to be similar, regardless of the differentiation potential of the individual clones.
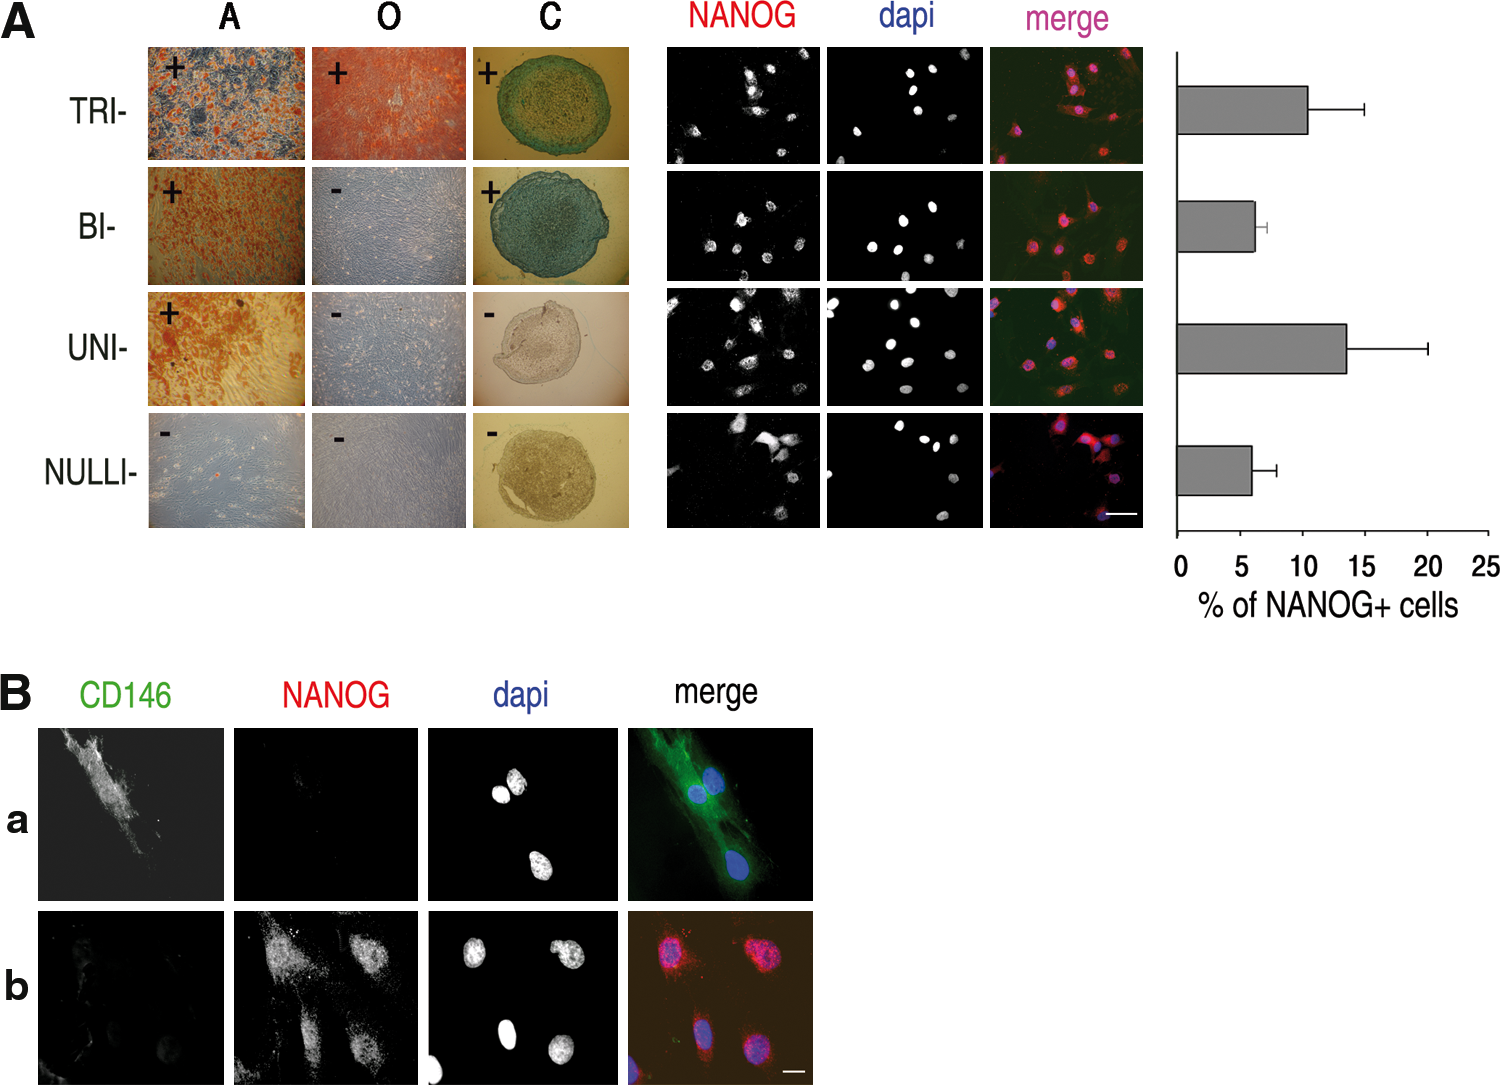
NANOG expression in isolated clones and CD146 expression in bulk populations.
Recent reports have proposed that MSCs may derive from a subpopulation of CD146+/lin− perivascular cells and that expression of CD146 may identify a subpopulation of undifferentiated, clonogenic, pluripotent cells [39,40]. Accordingly, proliferating MSCs were labeled with antibodies against NANOG and against CD146. As shown in Fig. 4B, cells positive for CD146 or NANOG were detected within the same population, but no double-positive cell was ever observed.
Discussion
The abilities to proliferate and to retain an undifferentiated state, as well as the capability to differentiate toward multiple cell lineages are distinctive properties of stem cells, although these properties are more efficiently represented in embryonic than in adult stem cells. MSCs represent a source of adult stem cells endowed with a long-lasting but finite proliferation potential, which are able to differentiate toward multiple mesodermal lineages, but also in lineages of different embryonic origin [1 –6]. MSCs have been extensively studied aiming to better understand their biological properties, but also because these cells may have a potential future for developing therapeutic interventions for a number of human diseases [41]. What governs the renewal and maintenance of the undifferentiated state and the capability to differentiate in different lineages in MSCs is not known. In this report we have investigated whether 3 transcription factors, namely, OCT-4, SOX-2, and NANOG, known to regulate the stem cell properties of ES cell, are expressed in MSCs from human adult tissues and whether their expression may affect the proliferative and differentiative properties of these cells. Our results indicate that OCT-4 and SOX-2 genes are not expressed in human MSCs, in contrast with data from other laboratory [20 –25] but confirming and extending previous reports [26 –29]. Indeed, several reports have described expression of OCT-4, SOX-2, and NANOG in adult stem cells, but these conclusions have been mainly based on PCR analysis, and in most cases the choice of primers did not excluded pseudogene-related transcripts (see ref. 27 for a detailed discussion). As it concerns OCT4, our data also agree with results obtained using lineage tracing that excluded a role of OCT-4 in adult stem cells [29].
In contrast to results obtained with OCT-4 and SOX-2, NANOG expression was detected in cultured MSCs both at the mRNA and protein level. The number of NANOG-positive cells differed up to 5-fold in MSCs from p1 to p9, and these variations were independent of the tissue of origin of the cells. The number of NANOG-positive cells was significantly reduced in late passages (p10–p22) of adipose and cardiac MSCs, whereas no change was observed in MSCs from bone marrow. However, the percentage of NANOG-expressing cells did not correlate with growth properties of MSCs at both early and late passages. This was more evident in cells at late passages, where MSCs from adipose tissue retained a high proliferation rate, but presented a low number of NANOG-positive cells, that was similar to that of MSCs from heart, which, however, had a reduced proliferative rate. Conversely, MSCs from bone marrow and heart had a comparable proliferation rate, but differed significantly in the number of NANOG-expressing cells. In analogy to what observed for proliferation, the ability to differentiate of the MSC cell populations analyzed appeared to be independent from the number of NANOG-expressing cells. Indeed, we found that all MSC populations tested were able to differentiate toward mature cells of mesenchymal lineages with comparable efficiency, independently from the percentage of NANOG-positive cells. An explorative nonparametric Spearman test revealed lack of correlation between the number of NANOG-positive cells and the ability of these cells to differentiate into adipocytes (R = −0.351) and osteocytes (R = 0.217). Such lack of correlation with differentiation ability was also observed in different MSC populations isolated from the same tissue but containing different percentages of NANOG-expressing cells. These results suggest that the subpopulation of NANOG-expressing cells is not directly correlated to the differentiation potential of cultured populations of MSCs.
Thus, the question remains as to the nature of the cells expressing NANOG. It is clear that current preparations of MSCs are heterogeneous, as they contain a mixture of progenitor cells with different degree of commitment and also a variable number of cells without differentiative properties [9,10,42]. To better verify if NANOG-positive cells would correspond to a subpopulation of MSCs progenitors, NANOG expression was analyzed in clonal populations that had been classified as tripotent, bipotent, unipotent, or nullipotent clones, based on their differentiative properties. Again, no significant difference was found in the percentage of NANOG-positive cells between these clones.
Recent advancements on the identification of mesodermal stem/progenitor cells have shown that the wall of small blood vessels contains a subset of MSCs named mesangioblasts, which may correspond in vivo to perivascular pericytes, and express the adhesion molecule CD146 [43]. Prospective isolation of CD146-positive cells from several tissues has yielded a self-renewing, clonogenic, multi-potent population, and it has been suggested that MSCs, as well as other related adult stem cells residing in different organs and tissues, may derive from this perivascular population [40]. On this basis, we then tested if NANOG was expressed in the fraction of mesenchymal progenitors expressing CD146. Indeed CD146-expressing cells were present in our cell preparations, but they were distinct from NANOG-expressing cells, once more suggesting that NANOG expression does not associate with mesenchymal progenitor cells.
Overall, our studies, although providing evidence that NANOG is expressed in adult human MSCs, fall short from identifying a role for cells expressing NANOG, or a role for NANOG expression in these cells. Recent evidence in ES cells indicated that NANOG expression is dynamic and is involved in modulating the epigenetic plastic state of the cells rather than acting as a core pluripotent determinant [44]. Moreover, in the emerging field of induced pluripotent stem cells, fully reprogramming of adult terminally differentiated cells to an ES-like state can be only achieved if the endogenous NANOG gene is re-activated during the early phases of the process [45]. Additional evidence indicated that somatic cell reprogramming is a stepwise process where NANOG choreographs the emergent regulatory network of pluripotency into a functional and self-sustaining configuration, termed ground state [46,47]. Notably, we found that freshly isolated MSCs do not express NANOG, whereas a variable fraction of NANOG-positive cells is present from p1 in cultured cells. Evidence of NANOG expression in freshly isolated MSCs, but only after in vitro expansion, is suggestive that NANOG expression in cultured MSCs may reflect changes associated with reprogramming mesenchymal cells to adapt to in vitro culture conditions. In this context, in vivo adult stem cells, including MSCs, are thought to be a quiescent population that is induced to proliferate and then differentiate following specific convergent stimuli arising from altered physiological, pathological, or traumatic conditions [48,49]. In vitro culture conditions (plastic adherence, growth medium, and serum concentration) may somewhat mimic in vivo activating signals. Thus, it tempting to speculate that the onset of NANOG expression in MSCs could result from changes associated to the transition from quiescence in vivo to active proliferation in vitro. However, since NANOG is expressed only in a fraction of cells, it may not directly regulate this process. Future work will help in testing this hypothesis.
In conclusion, our studies indicate that all cultured MSC populations, independently from the tissue of origin, express the embryonic transcription factor NANOG, whereas OCT-4 and SOX-2 are not expressed. NANOG expression cannot be associated with proliferative potential or with differentiative ability of both bulk and clonal MSCs. However, since NANOG is not expressed in freshly isolated MSCs, but only after in vitro expansion, we hypothesize that NANOG expression may reflect, but not directly regulate, the transition from in vivo quiescence to adaptation to in vitro growth conditions.
Footnotes
Acknowledgments
We thank Professor Charles Murry, University of Washington, for providing human ES RNA and Professor Peter Andrews, University of Newcastle, for providing human EC cells. This work was supported by Grants from Regione Toscana and from Fondazione Monte dei Paschi di Siena.
Author Disclosure Statement
No competing financial interests exist.
References
Supplementary Material
Please find the following supplemental material available below.
For Open Access articles published under a Creative Commons License, all supplemental material carries the same license as the article it is associated with.
For non-Open Access articles published, all supplemental material carries a non-exclusive license, and permission requests for re-use of supplemental material or any part of supplemental material shall be sent directly to the copyright owner as specified in the copyright notice associated with the article.