




Abstract
In general, the formation of embryoid bodies (EBs) is a commonly known method for initial induction of human embryonic stem cells (hESCs) into their derivatives in vitro. Despite the ability of EBs to mimic developmental processing, the specification and classifications of EBs are not yet well known. Because EBs show various differentiation potentials depending on the size and morphology of the aggregated cells, specification is difficult to attain. Here, we sought to classify the differentiation potentials of EBs by morphologies to enable one to control the differentiation of specific lineages from hESCs with high efficiency. To induce the differentiation of EB formation, we established floating cultures of undifferentiated hESCs in Petri dishes with hESC medium lacking basic fibroblast growth factor. Cells first aggregated into balls; ∼10 days after suspension culture, some different types of EB morphology were present, which we classified as cystic-, bright cavity-, and dark cavity-type EBs. Next, we analyzed the characteristics of each type of EB for its capacity to differentiate into the 3 germ layers via multiplex polymerase chain reaction (PCR), real-time PCR, and immunocytochemistry. Our results indicated that most cells within the cystic EBs were composed of endoderm lineage populations, and both of the cavity EB types were well organized with 3 germ-layer cells. However, the differentiation capacity of the bright cavity EBs was faster than that of the dark cavity EBs. Thus, the bright cavity EBs in this study, which showed equal differentiation tendencies compared with other types of EBs, may serve as the standard for in vitro engineering of EBs. These results indicate that the classification of EB morphologies allows the estimation of the differentiation status of the EBs and may allow the delineation of subsets of conditions necessary for EBs to differentiate into specific cell types.
Introduction
H
Hence, during the past decade, many groups have studied ways to improve the control of differentiation from hESCs by controlling the formation of EBs [9,13 –18]. To induce the EBs into a specific lineage, various protocols have been designed to form EBs using exogenous soluble biochemical materials [5,19 –23], such as cytokines [24,25], growth factors [10,24,26 –28], and vitamins [29,30]. However, even in the presence of additional controlling factors, EBs arise with various characteristics (eg, size or morphology). EB size is an important parameter for differentiation capacity, not only for improving the reproducibility of hESC differentiation experiments, but also for endogenously regulating cell type-specific differentiation, as has been recently reported [13 –16]. Unlike mouse EBs, it is difficult to control the morphology of human EBs due to the aggregation of single hESCs [9,31]. To generate uniform EBs, the development of optimized techniques is required. Indeed, the control of human EB size has been reported by a number of groups using either forced aggregation of defined cell numbers or microwells to form 3-dimensional hESC aggregates of specified dimensions that can then be transferred to suspension to form monodisperse EBs [13,15,16]. EB morphology also acts as a control factor in differentiation; cavity and cystic EB formation are generally used for separating the morphological classifications of EBs.
However, the relationships between the different types of EB morphologies and endogenously driven cell type-specific differentiation biases have not been explored. Even though EB formation is a commonly used tool for spontaneously differentiating pluripotent hESCs, differences in the developmental patterns associated with pluripotency and in the formation of the 3 germ layer cell types that are associated with EB morphology have not been studied in great depth. In the present study, we sought to describe the classification of EBs according to their morphologies and analyzed aspects of their differentiation. After separating EBs into cystic, bright cavity, and dark cavity types, we analyzed their differentiation properties using multiplex PCR, real-time PCR, and immunocytochemistry.
Our results indicated that most cells within cystic EBs are composed of endoderm lineage populations, and both of the cavity-type EBs are well-organized with 3 germ layers. However, the differentiation capacity of the bright cavity EBs was faster than that of the dark cavity EBs. These results indicate that morphology is an estimator of the differentiation status of EBs. Taken together, we suggest that bright cavity EBs are the ideal standard EB form for studying early human embryonic development, as well as differentiation into specific lineage cells for regenerative medicine.
Materials and Methods
hESC culture and EB formation
The undifferentiated hESC lines (CHA11-, CHA15-, and H9-hESCs) were cultured as previously described [32 –36]. Briefly, the hESCs were cultured in Dulbecco's modified Eagle's medium (DMEM)/F12 medium (Invitrogen) supplemented with 20% serum replacement (Invitrogen), 1 mM L-glutamine (Invitrogen), 1% penicillin–streptomycin (Invitrogen), 1% nonessential amino acids (Invitrogen), 0.1 mM mercaptoethanol (Invitrogen), and 4 ng/mL basic fibroblast growth factor (Invitrogen). Mouse embryonic fibroblast (MEF) feeder cells (from CF1 strain mice) were grown in DMEM containing 10% fetal bovine serum (Invitrogen), 1% penicillin–streptomycin (Invitrogen), 1% nonessential amino acids (Invitrogen), and 0.1 mM mercaptoethanol (Invitrogen). Mitomycin C (Invitrogen)–treated MEF feeder cells (4.5×10⁵ cells/60 mm tissue cultured dish) were seeded in 0.1% gelatin-coated tissue culture dishes. The next day, hESC clumps were seeded. After the first 2 days, the medium was refreshed every day. The hESCs were transferred mechanically to new feeder cells every 5–6 days. When cultured in suspension without anti-differentiation factors such as basic fibroblast growth factor and feeder layer cells, hESCs formed 3-dimensional multicellular aggregated EBs. Then, we cultured the hESC aggregates in Petri dishes to prevent them from adhering to the dish bottom. For EB formation, hESCs were detached from feeder cells by dispase (Invitrogen), transferred to Petri dishes, and then suspended in DMEM/F12 medium supplemented with 10% serum replacement, 1 mM L-glutamine, 1% penicillin–streptomycin, 1% nonessential amino acids, and 0.1 mM mercaptoethanol. The EB medium was refreshed every 24 h for ∼10 days, and then the different EB types were separated under a microscope using a 1-mL micropipette.
Total RNA isolation and cDNA synthesis
RNA extraction was performed using Trizol (Invitrogen), following the instructions of the manufacturer. Briefly, total RNA was extracted with chloroform and precipitated with 80% (v/v) isopropanol. After the supernatant was removed, the RNA pellet was washed with 75% (v/v) ethanol, air-dried, and dissolved in RNase-free DEPC water (Bioneer). The RNA concentration was determined using a NanoDrop Spectrophotometer (NanoDrop Technologies). A reverse transcription reaction was performed with 1 μg pure total RNA using the AccuPower RT PreMix (Bioneer), following the instructions of the manufacturer.
Multiplex PCR and real-time quantitative PCR
The synthesized cDNA was used for PCRs with a QIAGEN multiplex PCR kit (Qiagen GmbH), following the instructions of the manufacturer and using the PCR primer sets in Supplementary Tables S1 and S2 (Supplementary Data are available online at
Immunocytochemistry
hESCs and EBs were fixed with 4% paraformaldehyde and permeabilized with 0.1% Triton X-100 in phosphate-buffered saline (PBS; Invitrogen) for 15 min at room temperature, and then washed 3 times with 0.03% Triton X-100 in PBS (wash buffer). Fixed samples were blocked for 1 h with 1% bovine serum albumin solution dissolved in wash buffer, and then the samples were incubated with anti-human Oct-4 (Santa Cruz Biotech), anti-human SSEA-4 (Millipore), anti-human Tra-1-60 (Millipore), anti-human Tra-1-81 (Millipore), anti-human NeuroD1 (Abcam), anti-human AFP (DAKO), anti-human Brachyury (R&D Systems), anti-human NF68, anti-human TuJ1, anti-human PECAM, anti-human Sox17 (Millipore), and anti-human Collagen type 1 (Sigma Aldrich Inc.) primary antibodies diluted with wash buffer for 24 h at 4°C. The samples were washed with PBS and then incubated with Alexa488- or 594-conjugated secondary antibodies (Invitrogen) for 1 h. After being washed with PBS, the stained slides were mounted with a glycerol-based mounting solution containing 2.5% polyvinyl alcohol and 1,4-diazabicyclo-octane with 4′,6-diamidino-2-phenylindole (DAPI) (Sigma Aldrich Inc.). To characterize EBs, a stack of images was collected along the Z axis (the Z-stack) with 2 different manners—full-hemisphere or partial-hemisphere Z-stack (Supplementary Fig. S5). All images were analyzed with an LSM 510 META confocal microscope (Carl Zeiss Inc.).
Intracellular staining and flow cytometry
Cells were dissociated with 0.05% Trypsin-EDTA (Invitrogen) and then washed with PBS solution containing 2% (v/v) fetal bovine serum (FACS buffer). For intracellular staining, the cells were fixed and permeabilized with a BD Cytofix/Cytoferm kit (BD Biosciences) following the instructions of the manufacturer. They were resuspended with FACS buffer and incubated with isotype control or antigen-specific antibodies on ice in the dark. For NeuroD1 and AFP staining, the cells were incubated with purified rabbit anti-human NeuroD1 (Abcam) and AFP (Dako) antibodies for 30 min and then with AlexaFluor594 goat anti-rabbit IgG (Invitrogen) for 20 min. For Brachyury staining, the cells were incubated with purified rabbit anti-human Brachyury (R&D Systems) antibodies for 30 min and then with AlexaFluor594 donkey anti-goat IgG (Invitrogen) for 20 min. Flow cytometry was performed using a BD FACS Calibur (BD Biosciences).
Alkaline phosphatase staining
hESC colonies were fixed with 4% fresh para-formaldehyde for 15 min at room temperature and then washed 3 times with PBS. To localize alkaline phosphatase (AP), cells were fixed in 4% paraformaldehyde for 5 min. After washing, AP was detected with an ES Cell Characterization Kit (Millipore) according to the manufacturer's instructions. Images were analyzed using inverted and fluorescence microscopy (ECLIPSE TE2000; Nikon Instruments Inc.).
Karyotype analysis
Chromosome analysis was performed according to standard methods with minor modifications. After 3 days of culture, hESCs were incubated with 100 μL colcemide (Invitrogen) for 3 h at 37°C in a 5% CO2 environment and then trypsinized. After hypotonic solution (1% citrate buffer) treatment, the lysed cells were fixed in a mixture of methanol and glacial acetic acid (3:1). G-banding was performed for the identification of chromosomes.
Teratoma formation in SCID Mice
hESCs were maintained and harvested as described above. A suspension of 3×10⁵ undifferentiated hESCs was injected into the dorsal side of 6-week-old male SCID mice (The Jackson Laboratory) using a 28-gauge needle. After 12 weeks, teratomas were found in all mice. Dissected teratomas were paraffin-embedded. Sections were cut with an interval of 5 μm and examined by histological staining, including hematoxylin and eosin, Masson's Trichrome, and Periodic acid Schiff. Images were analyzed using an inverted microscopy system (Nikon Instruments, Inc.).
Statistical analysis
All experiments were performed at least 3 times to assess the reproducibility of the results. Quantitative data are expressed as the mean±standard derivation or standard error of the mean. Student's paired t-test, one-way ANOVA, or Kruskall Wallis test was performed to analyze statistical significance in each response variable. Prespecified comparisons between groups were made where appropriate with post hoc testing using Tukey's method in SPSS, version17. A P value <0.05 was considered statistically significant. Data histograms were fit with GraphPad Prism, version 5.
Results
Classification of differentiated EBs according to their morphologies 10 days post-EB induction
In this study, we used 3 hESC lines, namely, the H9 cell line, which is NIH-registered and commonly used, and our 2 previously established hESC lines, CHA11- and CHA15-hESCs (Supplementary Fig. S1) [36]. These human ESCs formed flat monolayer colonies on MEF feeder cells (Fig. 1A) and possessed the characteristics of undifferentiated hESCs (Fig. 1B, C). Under suspension conditions without specific growth factors, detached hESC colonies consistently aggregated and spontaneously formed EBs. Similar forms of the EBs that initially appeared subsequently differentiated into various morphologies and structures on the 10th day after EB formation. According to the morphological variations that were observed under a microscope, we classified 4 types of EBs: cystic EBs (Fig. 1D), which had a thin surface layer and accumulated fluid much like the visceral yolk sac of postimplantation embryos; bright cavity EBs (Fig. 1E), which showed aggregated cells at a low density in a spheroid shape; dark cavity EBs (Fig. 1F), which showed aggregated cells at a high density in a spheroid shape like a solid ball; and complex-form EBs Supplementary, which existed as hybrids of the types described above (Supplementary Fig. S2, cystic and cavity types). The distinction between bright and dark cavity EBs was based on the density of aggregated cells and the degree of clearing in formed EBs under a microscope. To examine the distribution of EB classifications derived from each of the hESC lines at day 10, we analyzed the ratio of each EB type. The distributions of the morphological classifications of EBs derived from the CHA11- and CHA15-hESC lines were not significantly different from each other, but they were different from that of the H9-hESC line. The dark cavity EBs were the most abundant type in the CHA11- and CHA15-hESC lines, representing 39% and 44% of total EBs, respectively. However, in the population of H9-hESCs, bright cavity EBs composed the largest population, representing 35% of total EBs. The proportion of cystic EBs was the lowest in all hESC lines (Fig. 1G). Until at least day 15, each EB type maintained its specific morphology without changing (data not shown). Also, each EB, independent of its type, was composed of ∼2,000 cells (Supplementary Table S4), and there was no statistically significant difference among the 3 hESCs lines in terms of the number of each EB type (Supplementary Table S5).
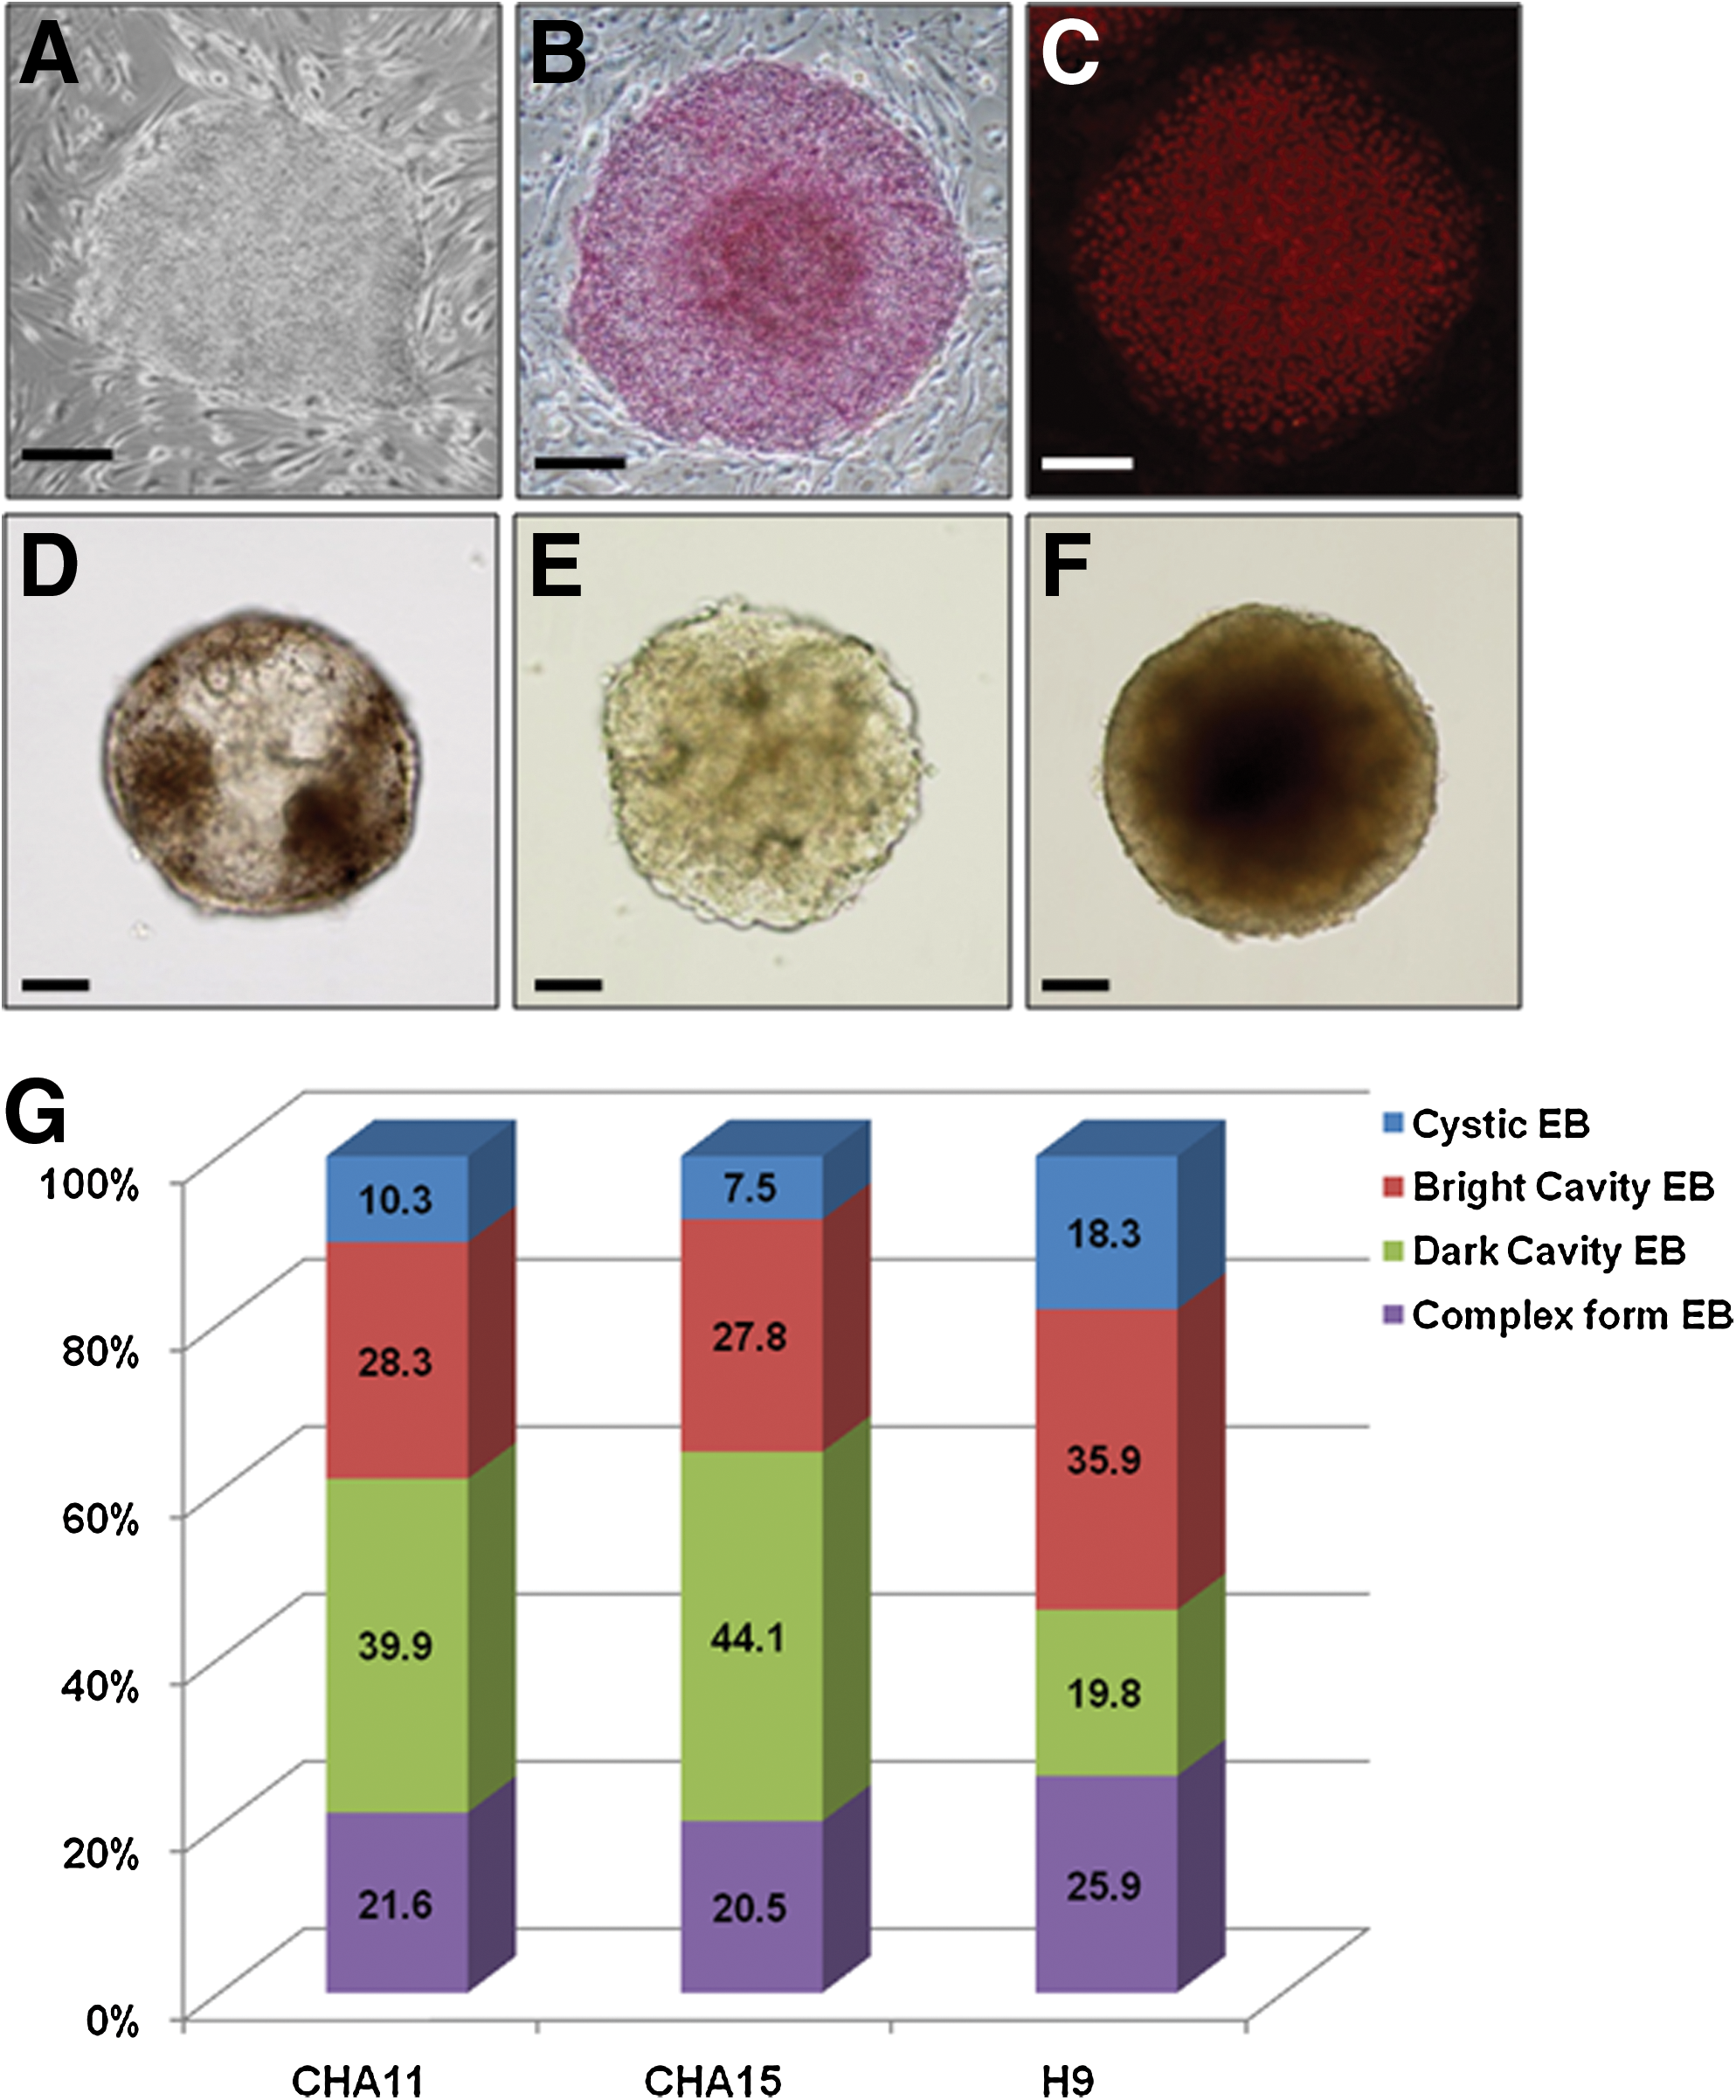
hESC colony and EB morphology in vitro.
Comparison of the expression levels of 3 germ layer markers in morphologically classified EBs at day 10
To examine the differentiation properties of the classified EBs in each of the hESC lines at day 10, we analyzed the gene expression of cystic, bright cavity, and dark cavity EBs using multiplex PCR for 2 sets of designed multiplex PCR primers (Supplementary Tables S1 and S2), including the pluripotency marker Oct-4 and 3 germ-layer specific marker sets: (a) NeuroD1, Sox1, and MAP2, which represent the ectodermal lineage; (b) GATA4, SOX17, and AFP, which represent the endodermal lineage; and (c) Brachyury (T), HAND1, and ACTC1, which represent the mesodermal lineage. Because complex-form EBs were composed of 2 or more types, we excluded these to achieve a clearer analysis of each morphological type in this study. In consideration of the limited amount of each sample and to conserve the costs involved in large-scale PCR analysis, we designed a multiplex PCR to examine the markers of the 3 germ layers. We first confirmed that the 2 designed sets of multiplex PCR primers, which featured Oct-4, AFP, ACTC1, SOX1, and GAPDH in set 1 (Supplementary Table S1) and GATA4, SOX17, MAP2, NeuroD1, HAND1, T, and GAPDH in set 2 (Supplementary Table S2), were well correlated between 12 (5 for set 1; 7 for set 2) monoplex reverse transcript transcription (RT)-PCRs and 2 sets of multiplex RT-PCRs. Also, the multiplex PCR sets were well under the positive differentiation conditions for each germ layer (Supplementary Fig. S3). Therefore, each newly designed multiplex RT-PCR was useful for rapid screening of the differentiation of the 3 germ layers in each of the EB samples (Fig. 2A). In the case of the undifferentiated hESCs, Oct-4 was expressed, but 3 germ-layer markers [including AFP (endoderm), ACTC1 (mesoderm), and SOX1 (ectoderm)] were undetectable in all 3 hESC lines (Fig. 2B, left panels), suggesting that all hESC lines were well preserved in an undifferentiated state before differentiation via EB formation. In contrast, the classified EBs differentially expressed the germ-layer markers at varying degrees according to their morphology. There was significant variation in the classified EBs, and the expression pattern of each type depended less on the cell line than on the morphology. Thus, directing differentiation toward specific EB morphological classifications may improve the differentiation efficacy of hESCs for target cell production. First, cystic EBs strongly expressed most of the 3 germ-layer markers, unlike the other EB types. Specifically, the expression of endoderm markers (eg, AFP, GATA4, and SOX17) was significantly higher in cystic EBs (Fig. 2B). Next, in the case of bright cavity EBs, expression levels for germ-layer markers were lower than those of cystic EBs (Fig. 2B). Unlike the expression pattern of cystic or bright cavity EBs, dark cavity EBs weakly expressed or lacked expression of germ-layer markers, which was more similar to the expression pattern of undifferentiated hESCs (Fig. 2B). To quantify the expression of classified EBs for the representative germ-layer markers in each of the cell lines, we next performed real-time PCR. The expression of NeuroD1 and AFP was highest in bright cavity EBs and cystic EBs, respectively. Also, the expression patterns did not show significant differences among the different cell lines. However, Brachyury expression followed neither a morphology-specific nor a cell line-specific pattern (Fig. 2C). From these results, ectoderm- and endoderm-lineage cells could be distinguished according to EB morphology, suggesting that morphological classification of EBs may be used to improve the effective directed differentiation of hESCs into specific lineages, except in the case of mesodermal lineage cells. To complement our PCR findings and to analyze the quantitative differences in protein expression levels among the 3 classifications of EBs, immunostaining (Supplementary Fig. S3 left panel; A, C, E) and intracellular FACS analysis (Supplementary Fig. S3, right panel, B, D, F) were performed. DAPI staining of z-axis sliced images for each group of EBs showed morphology-dependent differences (Supplementary Fig. S6). Compared with other cavity types, cystic EBs had much sparser DAPI staining, which demonstrated that the number of cells was low and that these EBs were essentially empty spheres. Cavity EBs, however, had a much higher frequency of DAPI staining, indicating the presence of more cells, and the bright type showed distinctive small slits (Supplementary Fig. S3A, white arrows, and Supplementary Fig. S6B). Cystic EBs had a distinctively high amount of AFP expression, which is an endoderm marker. The expression of NeuroD1 in bright cavity EBs from CHA11-hESCs was distinctively high, but the expression of NeuroD1 and AFP in bright cavity EBs from all 3 hESC lines was generally elevated. However, we could not observe significant differences in the amount of Brachyury expression among the 3 different morphological classifications. Taken together, cystic EBs had the highest amount of AFP expression, which is an endoderm marker, compared with cavity-form EBs. Compared with other EBs, bright cavity EBs showed an equal degree of NeuroD1 expression, which is an early ectoderm marker, and AFP, which is an endoderm marker. In the case of dark cavity EBs compared with hESCs, differentiation into the 3 germ layers was not detectable. In addition, Brachyury, which is known as a distinctive mesoderm marker, was not appropriate for detecting differentiation in the 3 morphological classifications of EBs.
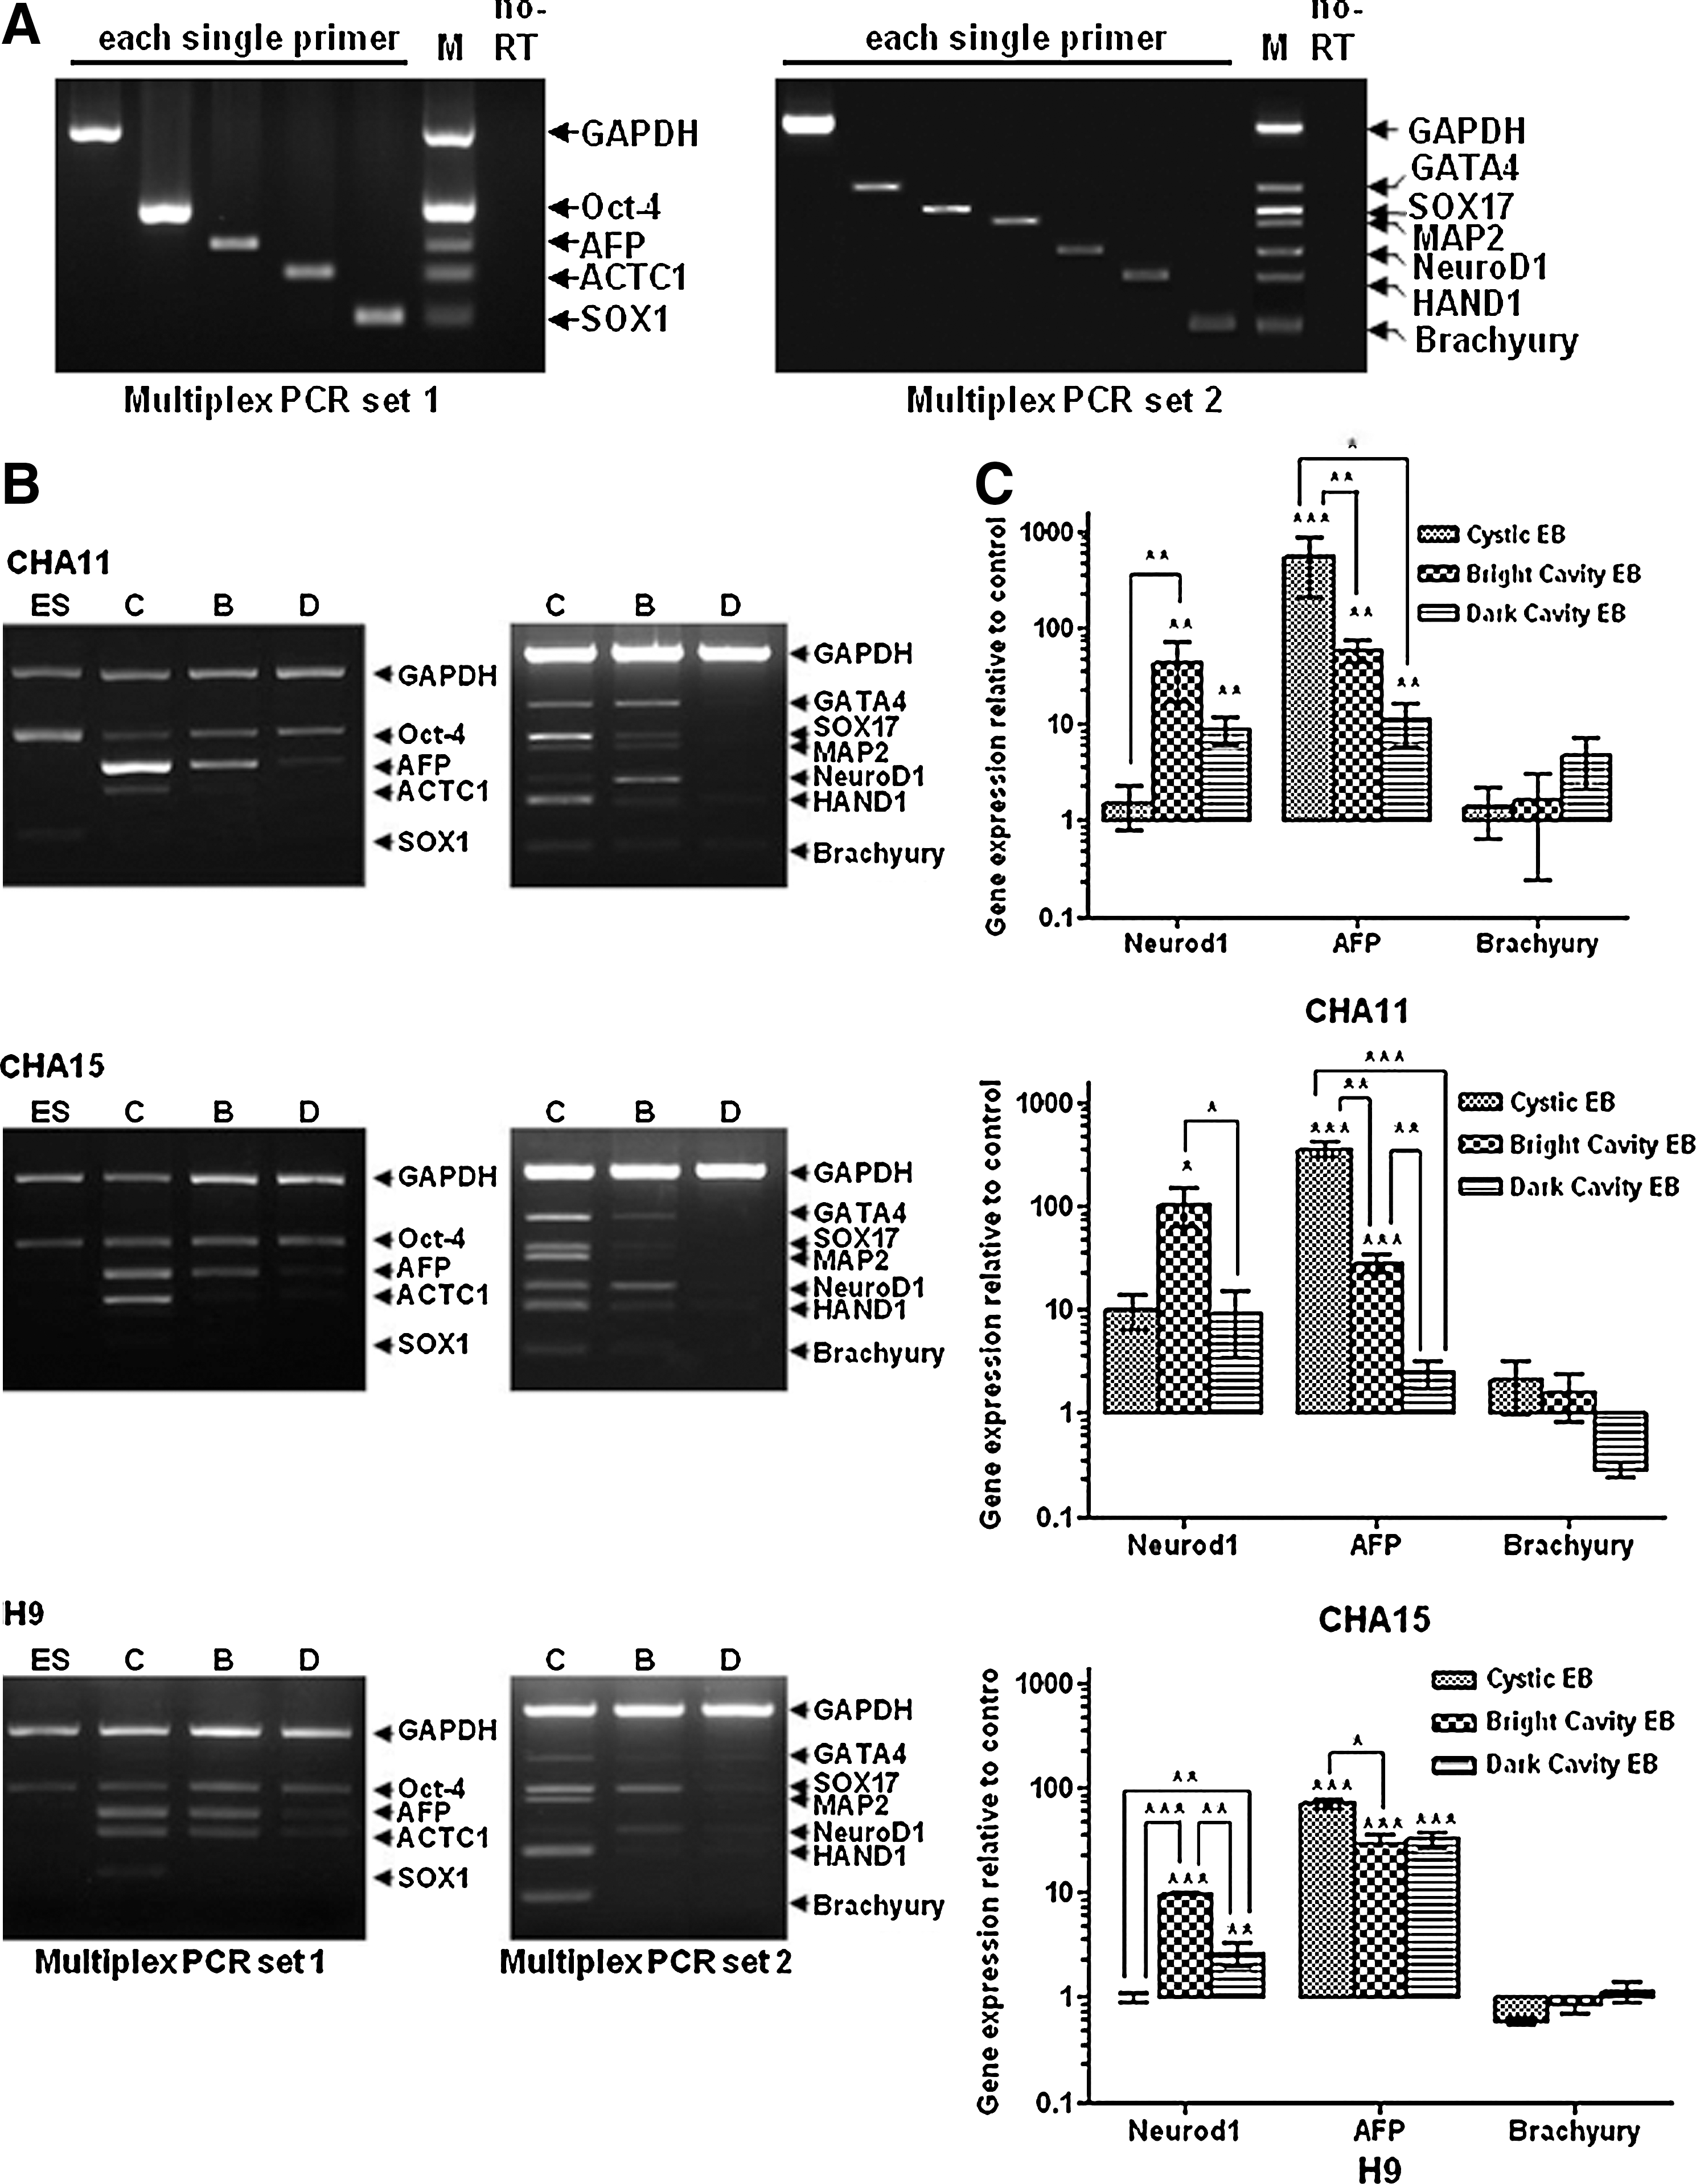
Gene expression patterns in each type of morphologically classified EBs as detected by multiplex RT-PCR and real-time PCR.
Developmental pattern of pluripotency and the 3 germ layers in morphologically classified EBs
To further investigate the expression patterns of cystic, bright cavity, and dark cavity EBs, we performed immunocytochemical analyses for markers of pluripotency and the 3 germ layers on the EBs on day 15. The pluripotency marker Oct4 was significantly more highly expressed in dark cavity EBs than in bright cavity and cystic EBs. Specifically, Oct4 was highly expressed where many cells were aggregated but not around empty spaces in cystic EBs. Interestingly, Oct4 expression was specifically observed on only one side of the EBs (Fig. 3A). PECAM, a mesodermal lineage-derived endothelial cell marker, was highly expressed in distinct tubule-like structures in bright cavity EBs. However, in cystic and dark cavity EBs, faint or indistinct tubule-like structures, respectively, were observed (Fig. 3B). Collagen 1, another mesodermal lineage-derived osteoblast cell marker, was also strongly expressed in bright cavity EBs compared with the other types (Fig. 3C). TuJ1, an ectodermal lineage-derived neuronal cell marker, was strongly observed in bright cavity EBs and weakly expressed on the surface of cystic EBs; unclear neuron-shapes were observed in the dark cavity EBs (Fig. 3D). Sox17, an endodermal lineage marker, was highly expressed in cystic EBs compared with the bright and dark cavity EBs. Specifically, Sox17 was localized around the empty space of cystic EBs, whereas it was expressed in a broad pattern or expressed weakly in the bright and dark cavity EBs, respectively (Fig. 3E). Finally, to examine the expression pattern of ectodermal and endodermal cells in the different EBs, we performed co-staining with an ectodermal lineage marker, NF68, and an endodermal lineage marker, AFP. The expression of AFP was similar to that of Sox17, and it was highly expressed in cystic EBs. In contrast, the expression pattern of NF68 was similar to that of TuJ1. Interestingly, NF68 and AFP co-expressing cells were observed in dark cavity EBs but not in cystic or bright cavity EBs (Fig. 3F). These immunostaining results confirmed the findings of the gene expression analysis, which showed that most of the cells in cystic EBs were composed of endoderm-lineage populations and that bright cavity EBs were evenly composed of cell populations from all 3 germ layers. Even though the dark cavity EBs were also composed of populations of cells representative of all 3 germ layers, differentiation occurred more slowly than that observed in bright cavity EBs. Thus, we inferred that the differentiation potential of EBs was influenced by morphology and that differentiated cells have specific localizations according to germ-layer characteristics during the differentiation of hESCs via EB formation.
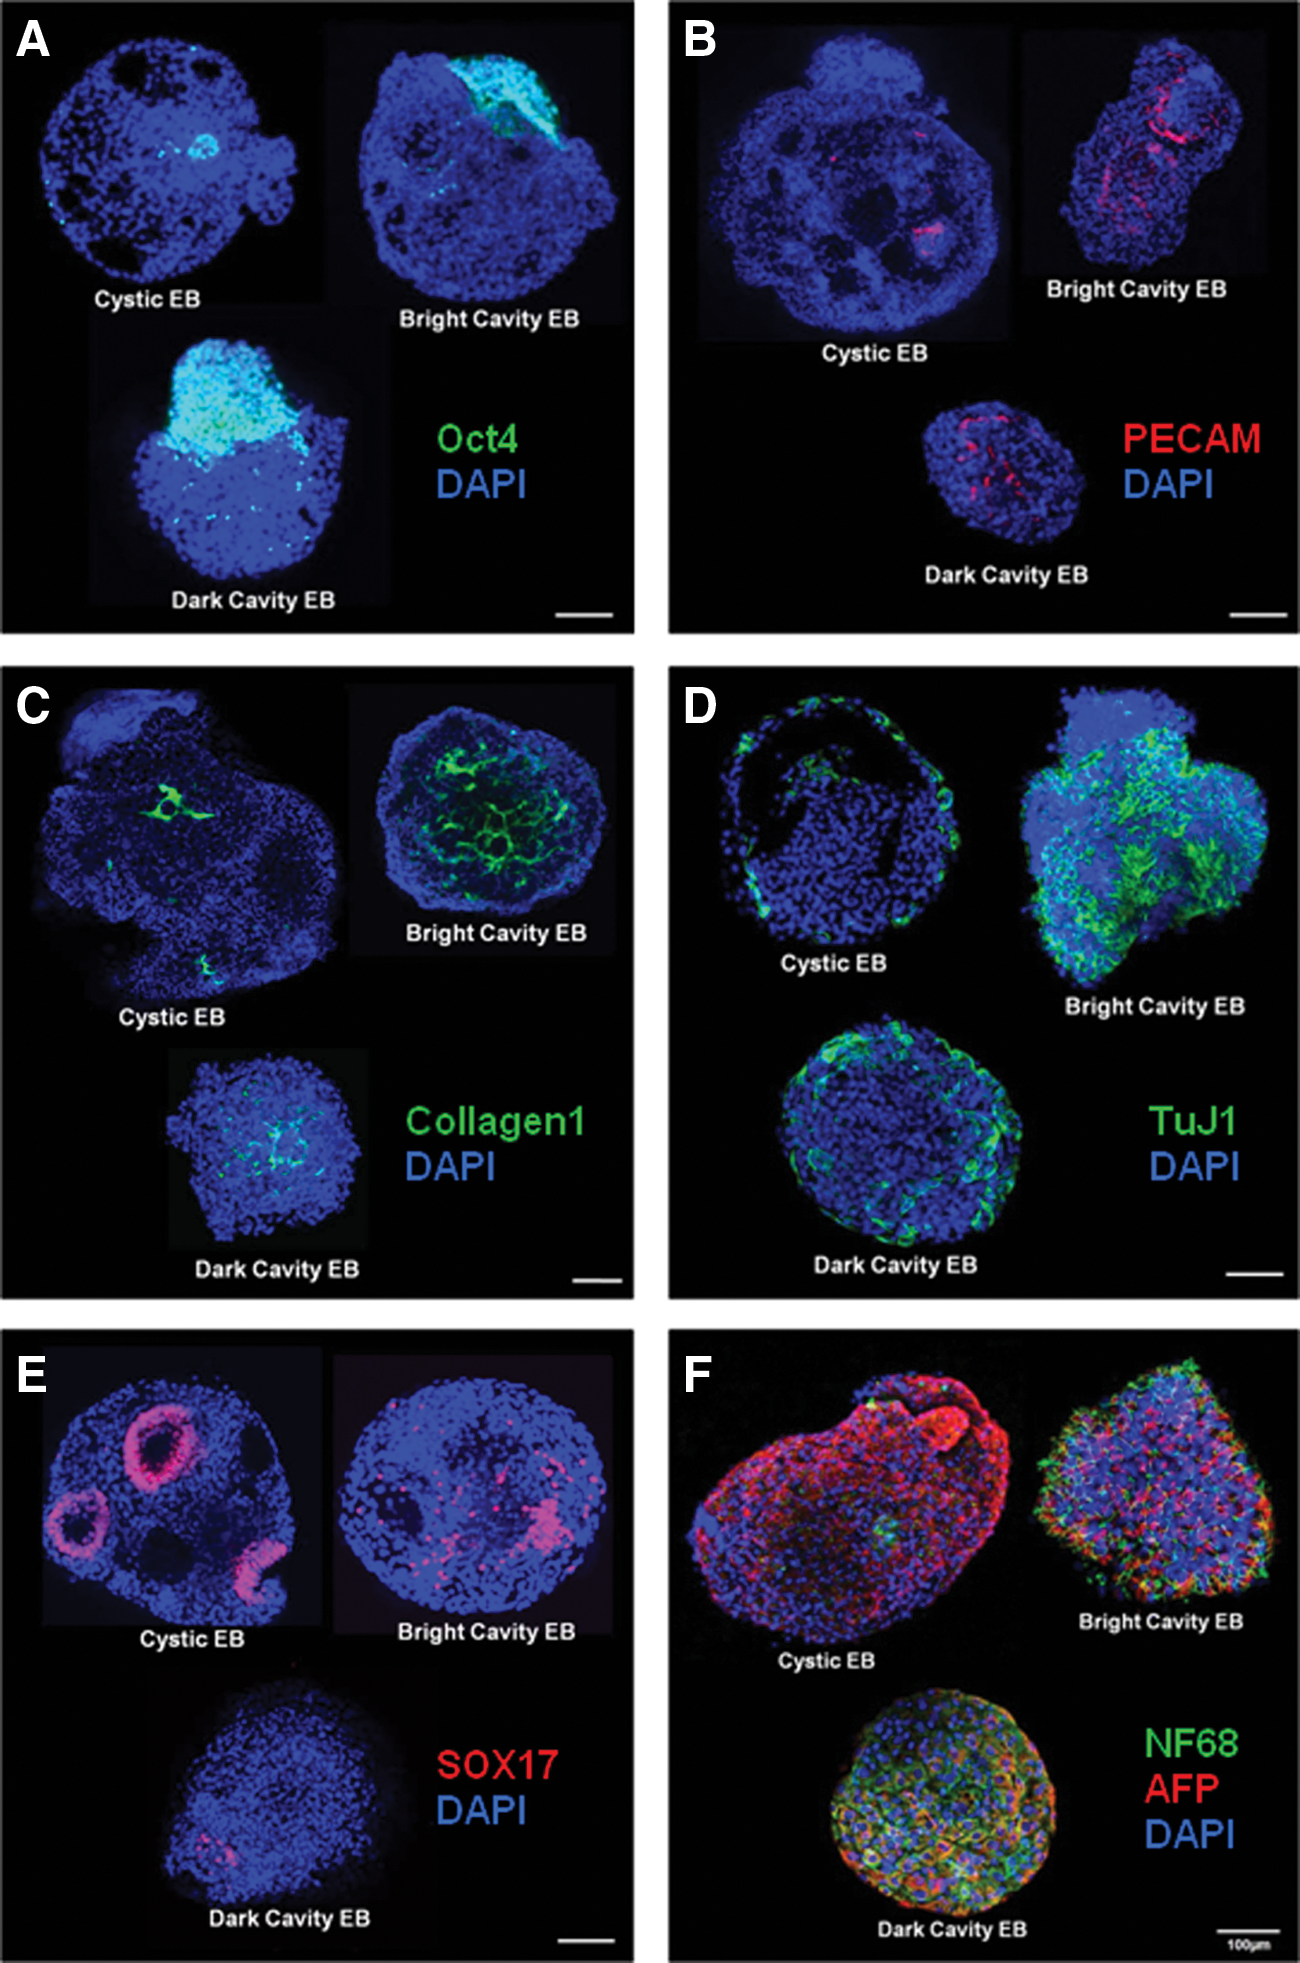
Expression pattern and specific localization of pluripotency and markers of the 3 germ layers in morphologically classified EBs at day 15.
Developmental pattern of the 3 germ layers in bright cavity EBs
To explore the development of bright cavity EBs, in which all 3 germ layers were uniformly present, we further induced differentiation, harvested EBs at day 20, and performed immunocytochemistry with a confocal microscope to analyze the expression and localization of the 3 germ layers. First, immunocytochemical analyses with PECAM and Sox17 (Fig. 4A and Supplementary Fig. S7) showed that PECAM was strongly expressed in the central region of EBs (30.4 to 85.1 μm from the surface, Supplementary Fig. S8) and was not expressed in the surface region (0 to 16.2 μm from the surface, Supplementary Fig. S8). In contrast, Sox17 was mostly expressed 0 to 16.2 μm from the surface (3rd panel of Fig. 4A, Supplementary Fig. S8) but weakly expressed in the center (4th panel of Fig. 4A, Supplementary Fig. S8). The localization patterns of PECAM and Sox17 expressing cells in the EBs were also clearly distinguished through live images (Supplementary Videos S1 and S2). The neuronal markers NF68 and TuJ1 were used to label ectodermal lineage cells, which first appeared near the surface (Fig. 4B and Supplementary Fig. S9); cells expressing and co-expressing NF68 and TuJ1 (Fig. 4C, white arrow) were localized within 34.1 μm from the surface (Supplementary Fig. S9). When the surface was further divided into outer (Fig. 4D, 0 to 11.4 μm), middle (Fig. 4D 11.4 to 22.7 μm), and inner (Fig. 4J, 22.7 to 34.1 μm) regions, our analysis showed that the majority of NF68- and TuJ1-positive cells were localized to the outer and inner regions, respectively, and cells co-expressing both neuronal markers were localized to the middle region (Fig. 4E). These localization patterns of NF68- and TuJ1-expressing cells in the EBs were also clearly distinguished through live images (Supplementary Video S3). As with the ectodermal lineage cells, AFP-positive endodermal lineage cells were localized near the surface of EBs during early differentiation by day 10. However, despite sharing the same region of origin, no cells co-expressed AFP and NF68 (Fig. 4F). In addition, as differentiation progressed further (day 20), APF- and NF68-positive cells were isolated in distinct locations near the surface (Fig. 4G), supporting the idea that the developmental patterns of ectodermal and endodermal lineage cells are different. From these results, the bright cavity EBs were the most pluripotent of the EB types analyzed here and were well organized into 3 germ layer populations. Thus, these EBs can be used to study early human development.

Expression pattern and localization of the 3 germ layers in bright cavity EBs at day 20.
Discussion
EBs are a commonly used tool for spontaneously differentiating pluripotent hESCs, but the differences in the developmental patterns of pluripotency and the 3 germ layers, which are associated with differences in morphology, in spontaneously differentiated EBs have not been studied in great depth. In this study, we classified EBs as cystic, bright cavity, or dark cavity EBs according to their morphologies and examined their varying differentiation potentials. According to a series of reports, nascent EBs take the shape of simple solid balls and progress into cystic-shape EBs by the formation of an external cell barrier with internal apoptosis [4,14]. However, there have been no previous attempts to describe the differentiation of different EB morphologies until now. Here, to minimize variation in the size and proportions of the differentiating cell populations within the initially formed EBs from undifferentiated hESCs, we first maintained the hESC lines using micro-dissection methods, which allowed the creation of similarly sized hESC colonies and the efficient expansion of these colonies [33]. Also, we removed differentiated colonies showing abnormal morphologies (<5%) by “Picking to Remove” under a microscope [33 –35]. Using these methods, we obtained uniform EB cultures with regular morphologies, which then developed into the various types of spontaneously differentiated EBs (ie, cystic, bright cavity, dark cavity, and complex EBs) at day 10 of postsuspension culture (Fig. 1). This induction at an even frequency was not statistically significant for each distinctive EB form in any of the hESC lines used (Fig. 1G, Supplementary Tables S4 and S5). It has been previously reported that cystic EBs derived from mouse ESCs have the characteristics of the mesoendoderm [10,37,38], and similar results have been reported for cystic EBs derived from hESCs [39]. In addition, Pick et al. showed that treatment with BMP4, which is a growth factor that induces mesodermal differentiation during EB differentiation from hESCs, activated the formation of cystic EBs, which enriched the differentiation of mesoderm lineage cells [8,24,26,40]. However, in this study, we discovered from real-time PCR analysis that cystic EBs have a rapid differentiation potential compared with cavity EBs and that they are relatively enriched for endoderm lineage differentiation (Fig. 2). In Fig. 3E, it is apparent that Sox17 expression was specifically detected at the perimeter of empty spaces within the cystic EBs, which lacked DAPI-stained cells and were formed by cell apoptosis, leading to a substantial presence of endoderm populations [4,41]. In contrast, bright cavity EBs were well organized and had all 3 germ layers, and specific localization and obvious separation of each of the lineage populations were observed (Figs. 3 and 4). In Fig. 3F, in contrast to the bright cavity EBs, NF68 and AFP co-expressing cells were observed in dark cavity EBs at day 10. However, co-expressing cell populations were not detected in dark cavity EBs at day 20 (data not shown). Even if the differentiation of dark cavity EBs progressed more slowly than that of bright cavity EBs (Fig. 3A and Supplementary Fig. S10), the expression pattern of differentiated cell markers was similar to that of bright cavity EBs, suggesting that dark cavity EBs could become bright cavity EBs over time. Dark cavity EBs, which had differentiation potentials similar to those of bright cavity EBs, experienced a slow induction of differentiation. From the analysis of the mesoderm lineage differentiation pattern, it became apparent that the expression of Brachyury and HAND1 indicates early mesoderm induction as previously reported by Park et al.; these were strongly expressed at day 4 to 6 in human EBs [42 –44]. In Fig. 2, Brachyury and HAND1 do not follow a regular pattern of expression, indicating that these markers are not appropriate for investigating the mesoderm differentiation in EBs at day 10.
The distribution pattern of the 3 germ layers within EBs has also not been extensively studied. Our previous study demonstrated that the specific localization of PECAM-expressing cells indicates the presence of mesoderm lineage cells in the central region of cavity-like EBs [35]. Based on these previous results, we monitored the distribution pattern of the 3 germ layers within EBs using 3 markers. We again confirmed the localization of PECAM-positive mesodermal lineage cells in the center of human EBs (Fig. 3B). In contrast, NF68 and AFP, which are markers for ectodermal and endodermal lineage cells, respectively, were expressed in the surface region of EBs (Fig. 3F). Although they co-localized during early differentiation, each population of cells became progressively more isolated as differentiation proceeded (Fig. 4F, G). Because ectodermal and endodermal lineage cells have similar distribution patterns during early differentiation, the induction of ectodermal [45 –47] and endodermal lineages from hESCs may also be similar [48 –50]. In addition, using confocal microscopy, we confirmed that the addition of N2- B27 or vascular endothelial growth factor augments the differentiation of neuronal cells and endothelial cells from mouse or human ESCs, respectively; the observation technique specifically demonstrated the influence of each of these growth factors on the distribution pattern of each lineage's differentiation [51,52].
It has been reported that different hESC lines have different properties in terms of self-renewal and differentiation capacity [53,54], and these differences became apparent in the 3 different cell lines used in this study. Among the cell lines used, the CHA11- and CHA15-hESC lines were successfully established by the CHA stem cell institute. Each of the cell lines was positive for the hESC-associated markers OCT4, SSEA4, TRA-1-60, and TRA-1-81 (as indicated by immunocytochemistry or flow cytometry), and they had strong AP activity (Supplementary Fig. S1). Also, the spontaneous differentiation capacity of these hESC lines was evaluated by teratoma formation in vivo (Supplementary Fig. S1). In Fig. 1G, these cell lines formed 4 different EB morphologies in vitro and expressed markers for all 3 germ layers (Fig. 2C and Supplementary Fig. S4), indicating their pluripotency. Thus, knowledge of the pluripotency potentials of various cell lines may help guide researchers in choosing cell lines that are suited to their experiments.
This study of 3 morphological classifications of EBs and their respective differentiation potentials has provided the following insights. First, hESCs form EBs composed of spontaneously differentiated cells under suspension conditions, and these EBs can be classified into the representative types of cystic-, bright cavity-, and dark cavity-EBs according to their morphological characteristics. Second, the expression pattern and localization of cells belonging to the 3 different germ layers within the EBs were distinct according to the morphology of the EBs in this study. Third, cystic EBs showed the fastest differentiation potential and were especially enriched for endoderm differentiation. Finally, even though similar expression patterns were observed for the differentiation potential of the 3 germ-layer populations between the bright and dark cavity EBs, the specific localization and exact classification of each germ layer population was clearer in the well-organized bright cavity EBs. Using our findings, EB formation, as a commonly used differentiation tool, could be utilized to control the differentiation of target lineage cells. The methods used in this study may effectively characterize various aspects of EB differentiation. Further, based on our results, we suggest that bright cavity EBs, which showed uniform differentiation tendencies compared with the other types of EBs, can be used as a standard model for studying early human development.
Footnotes
Acknowledgments
This research was supported by a grant (10033642) from the Industry Sources Development Project funded by the Ministry of Knowledge Economy, Republic of Korea.
Author Disclosure Statement
No competing financial interests exist.
References
Supplementary Material
Please find the following supplemental material available below.
For Open Access articles published under a Creative Commons License, all supplemental material carries the same license as the article it is associated with.
For non-Open Access articles published, all supplemental material carries a non-exclusive license, and permission requests for re-use of supplemental material or any part of supplemental material shall be sent directly to the copyright owner as specified in the copyright notice associated with the article.
