
Abstract
The noninvasive tracking of glioblastoma cancer stem cells (CSCs) in vivo constitutes a prerequisite for the development of CSC-specific therapies. Therefore, as a pilot study to identify CSC biomarkers for clinical magnetic resonance spectroscopy, 10 CSC lines were investigated using high-resolution 1H-nuclear magnetic resonance (1H-NMR) spectroscopy at 600 and 800 MHz (14.4 and 18.8 T) under reproducible in vitro conditions. The spectra were analyzed using principal component analysis (PCA), and spectral regions of high variability were evaluated regarding correlations to stem cell-related properties (clonogenic index and CD133 positivity) and cell death. PCA revealed that duplicates of CSC lines clustered together suggesting a characteristic 1H-NMR pattern of each CSC line. PCA enabled discrimination between samples with high and low clonogenicity, that is, clustering according to one of the hallmarks of stemness in samples with high viability. High/moderate correlations to clonogenicity and CD133 were found in spectral regions with high variability. In contrast, the mobile lipid signal at 1.28 ppm correlated to cell death, but not to stemness, as published previously for neural progenitor cells. In conclusion, our exploratory study demonstrates the correlation of specific resonances within 1H-NMR spectra with stem cell properties and advocates the use of the 1.28 ppm resonance as biomarker for cell death also in CSCs.
Introduction
H
Although recent advances have been made in imaging of nonmalignant stem cells in the CNS using either optical bioluminescent imaging [7] or 3′-deoxy-3′-
Experimental
CSC culture
All CSC lines used have been previously described [13,14]. In brief, freshly resected human primary GBM samples were dissociated and cultured in medium containing epidermal growth factor, basic fibroblast growth factor (both from R&D Systems), leukemia inhibitory factor (Chemicon Internation), and B27 supplement (1:50; Gibco). Medium was changed twice weekly and cells were continuously propagated. To determine the clonogenicity of CSC lines, single-cell suspensions were seeded at a density of 10 cells per well in 96-well plates and numbers of free floating or adherent spheres were determined after 21–28 days. Use of resection material and all experiments were approved by the local ethics committee.
Flow cytometry
CD133 expression was determined as previously described [13] using CD133/2-PE (clone 273; Miltenyi Biotech) or control IgG. The fraction of apoptotic and necrotic cells was determined by combined Annexin V-FITC and propidium iodide staining. Briefly, 2×10⁵ cells were washed twice in phosphate-buffered saline (PBS), resuspended in binding buffer [10 mM HEPES/NaOH (pH 7.4), 140 mM NaCl, 2.5 mM CaCl2), stained with 5 μL Annexin V-FITC (BD Biosciences), and incubated for 20 min in the dark at room temperature. Subsequently, propidium iodide (0.5 μg/mL) was added and the samples were analyzed on a BD FACSCalibur.
NMR spectroscopy
For 1H-NMR spectroscopy, 3–5 million cells (dependent on the size of the specific cells) per sample were washed twice in PBS, resuspended in 500 μL PBS solution containing 10% deuterium oxide and 40 μM dimethyl-silapentane-sulfonate (DSS), and transferred to a 5-mm Shigemi NMR tube that allows sedimentation within the sensitive volume of the probe coil because of a susceptibility-matched solid glass bottom. Samples were cooled to 5°C and 1H-NMR measurement started within less than 15 min thereafter. During measurement, the temperature was kept at 5°C. Measurements were performed using high-resolution NMR Bruker Avance 600 and 800 MHz spectrometers employing a gradient-based water suppression pulse sequence [15]. For 1-dimensional experiments, 64 scans with 64k data points and 4.7 s repetition time were accumulated, followed by an exponential line broadening of 2 Hz. After Fourier transformation (32k data points), the spectra were phase- and baseline-corrected manually. DSS was used as an internal reference standard (0.00 ppm). An additional 1H-NMR spectrum of the extracellular compartment of the cell suspension was obtained by carefully collecting the supernatant. Acquisition and processing procedures were used as for cell suspensions.
Assignment strategies
Resonances of small molecules and metabolites were assigned comparing chemical shifts, multiplet structures, and homonuclear couplings with 1- and 2-dimensional reference spectra from the databases HMDB [16], BMRB [17], SDBS (
Principal component analysis
For principal component analysis (PCA), the spectral region 4.20–0.70 ppm was used. Within this region, the following contaminants were excluded: DSS (1.80–1.72 and 2.94–2.88 ppm), acetate (1.93–1.89 ppm), and dimethyl sulfoxide (2.74–2.71 ppm). For each spectrum, 350 buckets (0.01 ppm bucket width) were integrated and scaled to the total intensity. Loadings, scores, and variances were calculated using a Matlab (The MathWorks) standard PCA routine (“princomp”).
Correlation analysis
For correlation analysis, the same spectral range, exclusions, and normalization were employed as for PCA (vide supra). Spectral regions with high variations across the samples (high standard deviations) were chosen as ROI for correlation analyses: 4.08–4.02 ppm, 3.8–3.73 ppm, 3.64–3.5 ppm, 3.23–3.17 ppm, 3.06–2.98 ppm, 2.48–2.4 ppm, 2.38–2.28 ppm, 2.15–2.1 ppm, 2.08–1.97 ppm, 1.48–1.45 ppm, 1.44–1.34 ppm, 1.33–1.305 ppm, 1.295–1.15 ppm, 0.92–0.8 ppm. Pearson's correlation coefficients between the ROI integrals and the available biological data (clonogenic index, cell death, CD133) were calculated using a standard Matlab routine (“corr”).
Mobile lipid quantification
The quantification of the macromolecular peak at 1.28 ppm (ML2) was obtained by deconvolution of the spectral region between 1.5 and 0.7 ppm using a Matlab fitting routine. In brief, the mobile lipid resonance (ML2) and the macromolecular multiplet between 1.05 and 0.80 ppm (M1+ML1) were separated from overlapping multiplets of small molecules such as lactate and free amino acids and from other underlying macromolecular residues (eg, M2). As previously described [22 –30], the mobile lipid biomarker was quantified as the ratio of ML2 and M1+ML1.
Results
1H-NMR characteristics of CSC lines
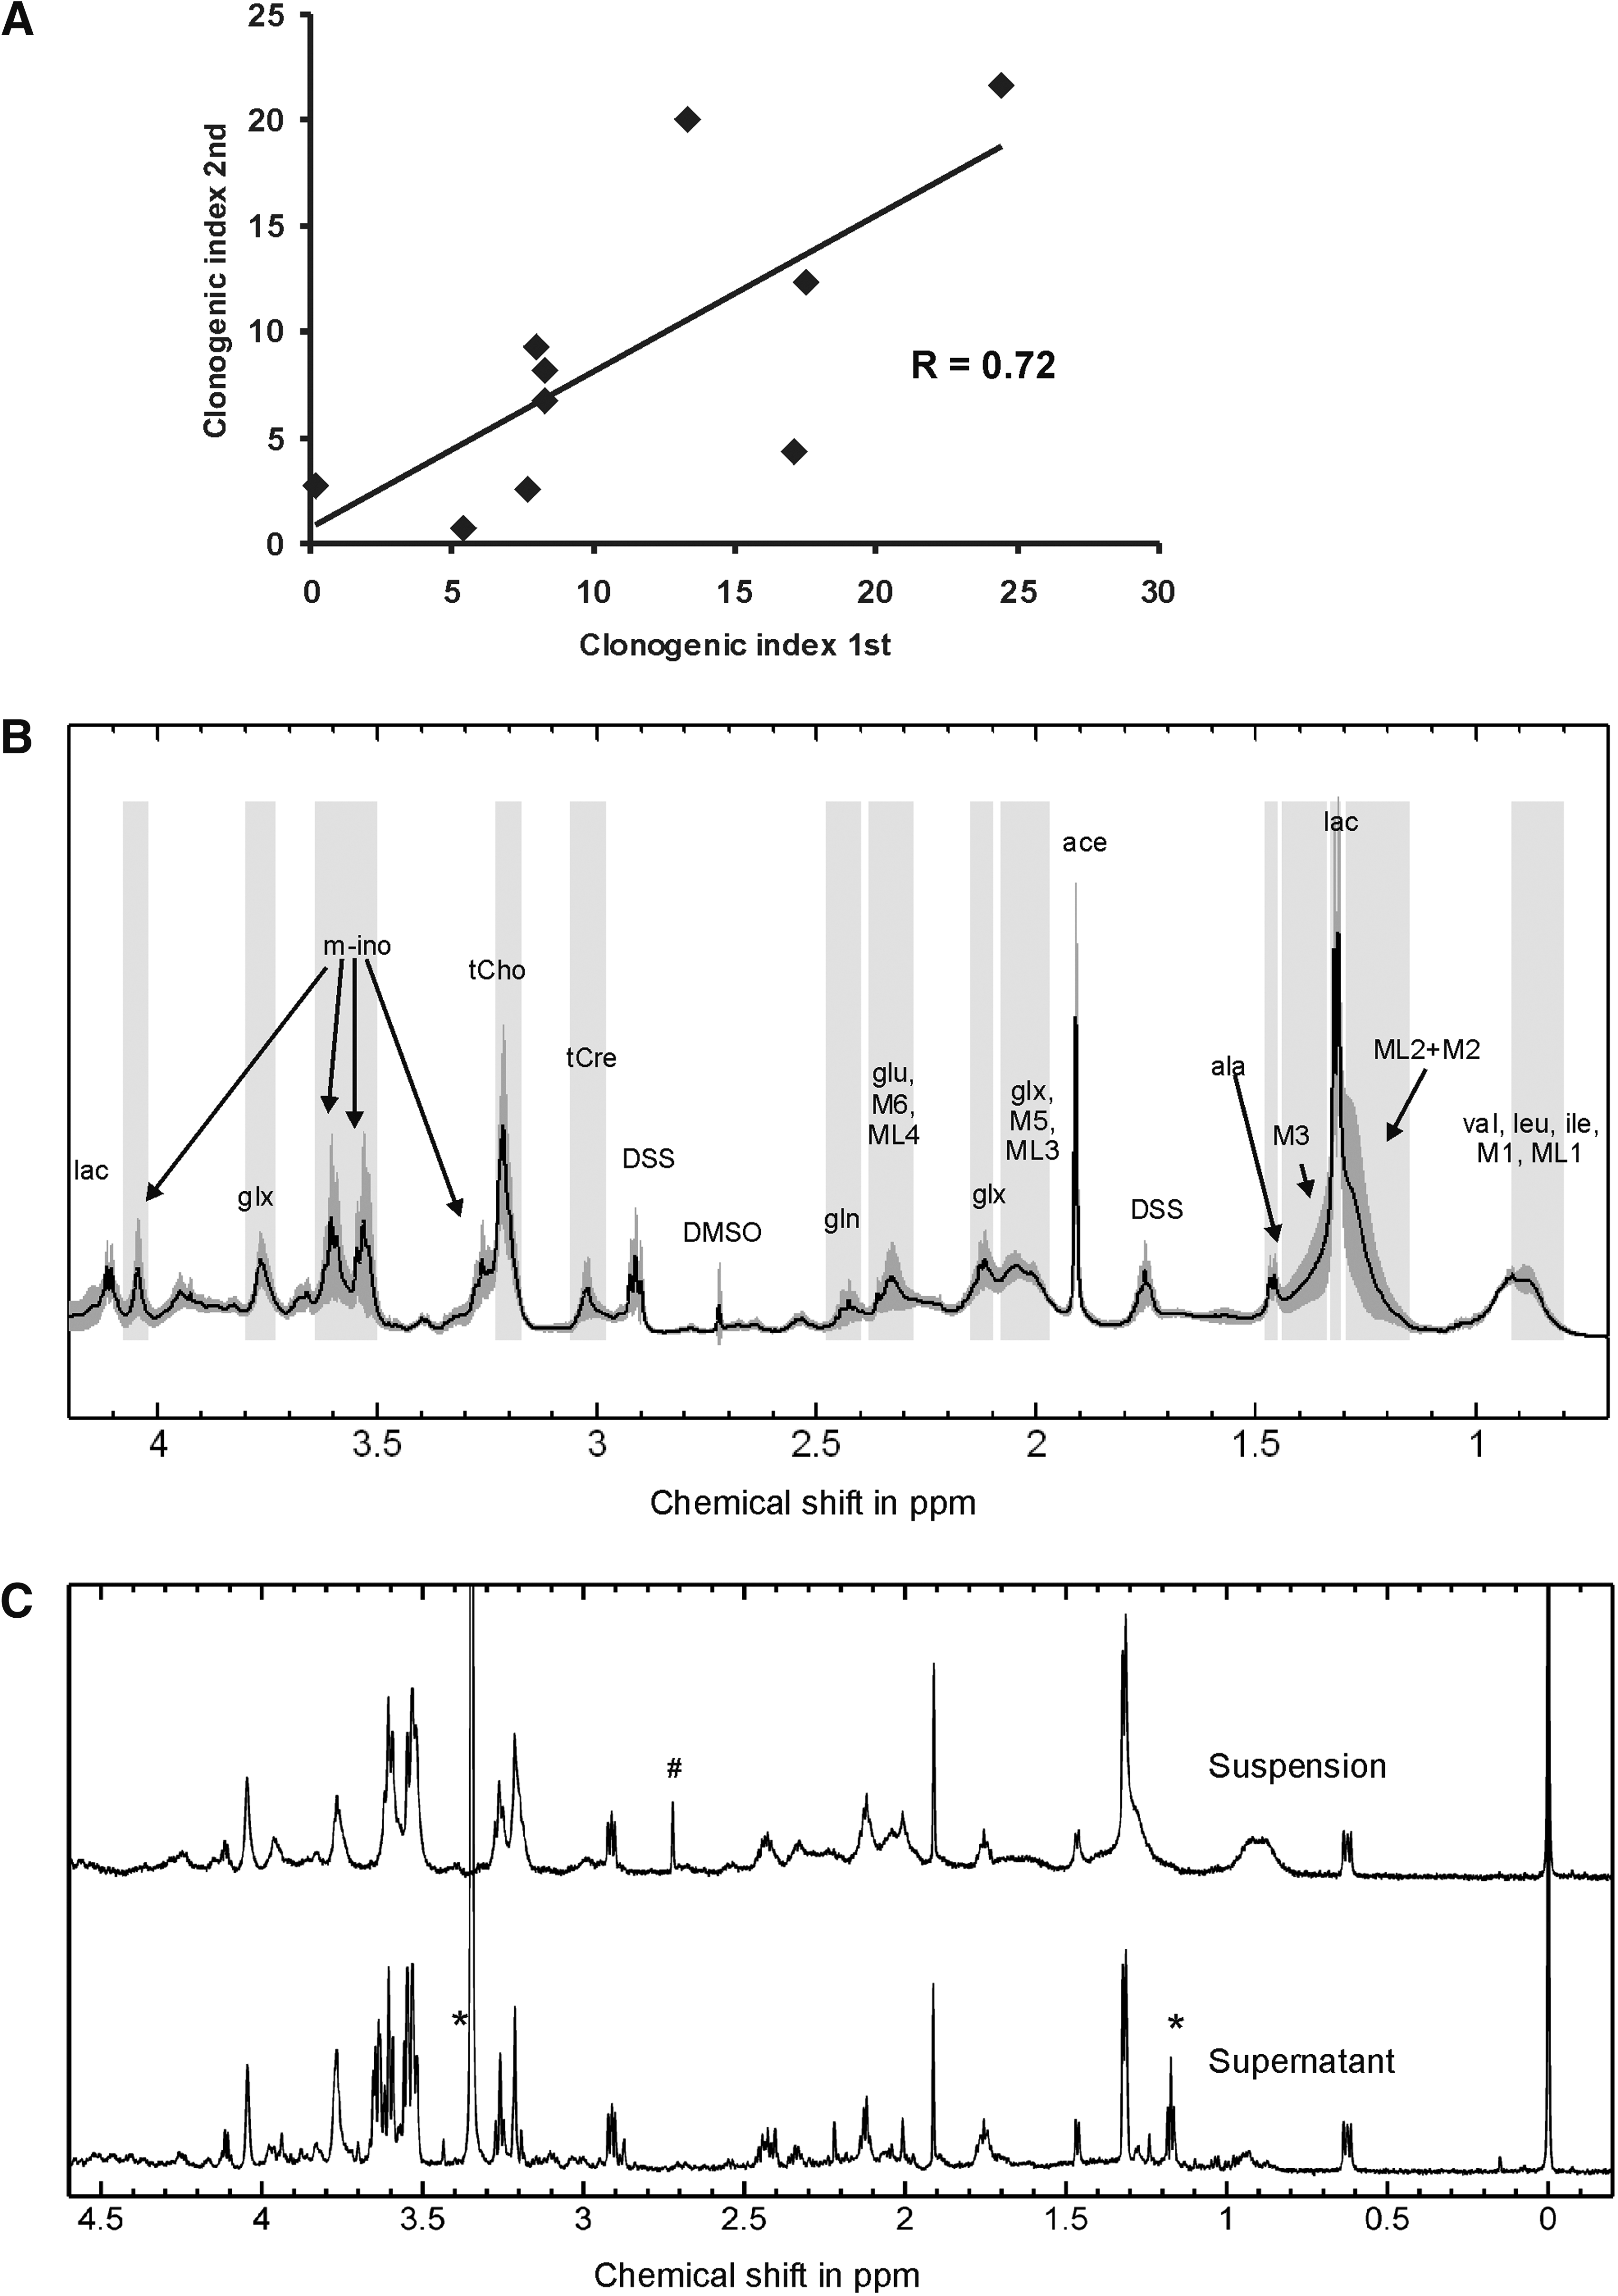
We characterized the 1H-NMR spectra of 10 different CSC lines derived from primary GBM samples [4,13]. The stem cell-related properties of the CSC lines were characterized in detail and showed a high variability of clonogenicity, CD133 expression, growth pattern, rates of spontaneous apoptosis, and cell death (Table 1). To compare 1H-NMR spectra with CSC lines, we measured CSC lines in 2 independent duplicates. Although the biological properties of the CSC lines remained stable (Fig. 1A), the 1H-NMR spectra showed a high variability between both measurements. Figure 1B gives the average variability between 0.7 and 4.2 ppm of both measurement series.
1H-nuclear magnetic resonance characteristics of CSC lines.
CSC, cancer stem cell.
In the 1H-NMR spectra, the assignment strategies resulted in the following unambiguous identification of resonances (abbreviations and chemical shifts in parentheses): methyl of lipids of branched-chain amino acids (val, leu, ile) and amino acid residues of proteins (M1+ML1, 1.10–0.70 ppm), mobile lipid fatty acid chain methylene (ML2, 1.28 ppm), lactate (lac, 1.31 ppm, 4.11 ppm), alanine residues of proteins (M3, 1.40 ppm), free alanine (ala, 1.47 ppm), acetate (ace, 1.91 ppm), creatine-containing compounds (tCre, 3.03 ppm), choline-containing compounds (tCho, 3.21 ppm), myo-inositol (m-Ino, 3.26 ppm, 3.53 ppm, 3.61 ppm, 4.05 ppm), and glutamate/glutamine (glx, 3.77 ppm) (labeled in Fig. 1B). The spectral region 2.5–2.0 ppm was assigned to glutamine (2.43 ppm, 2.13 ppm), glutamate (glu, 2.34 ppm, 2.08 ppm), mobile protein M6 (2.29 ppm) and M5 (2.05 ppm), and mobile lipid fatty acid chain methylene (ML3, 2.02 ppm and ML4, 2.24 ppm).
Additional spectroscopy of the supernatant after acquiring the suspension spectrum revealed that most sharp resonances found in suspension spectra originated also from the extracellular space of the suspension (Fig. 1C).
Cluster discrimination by PCA
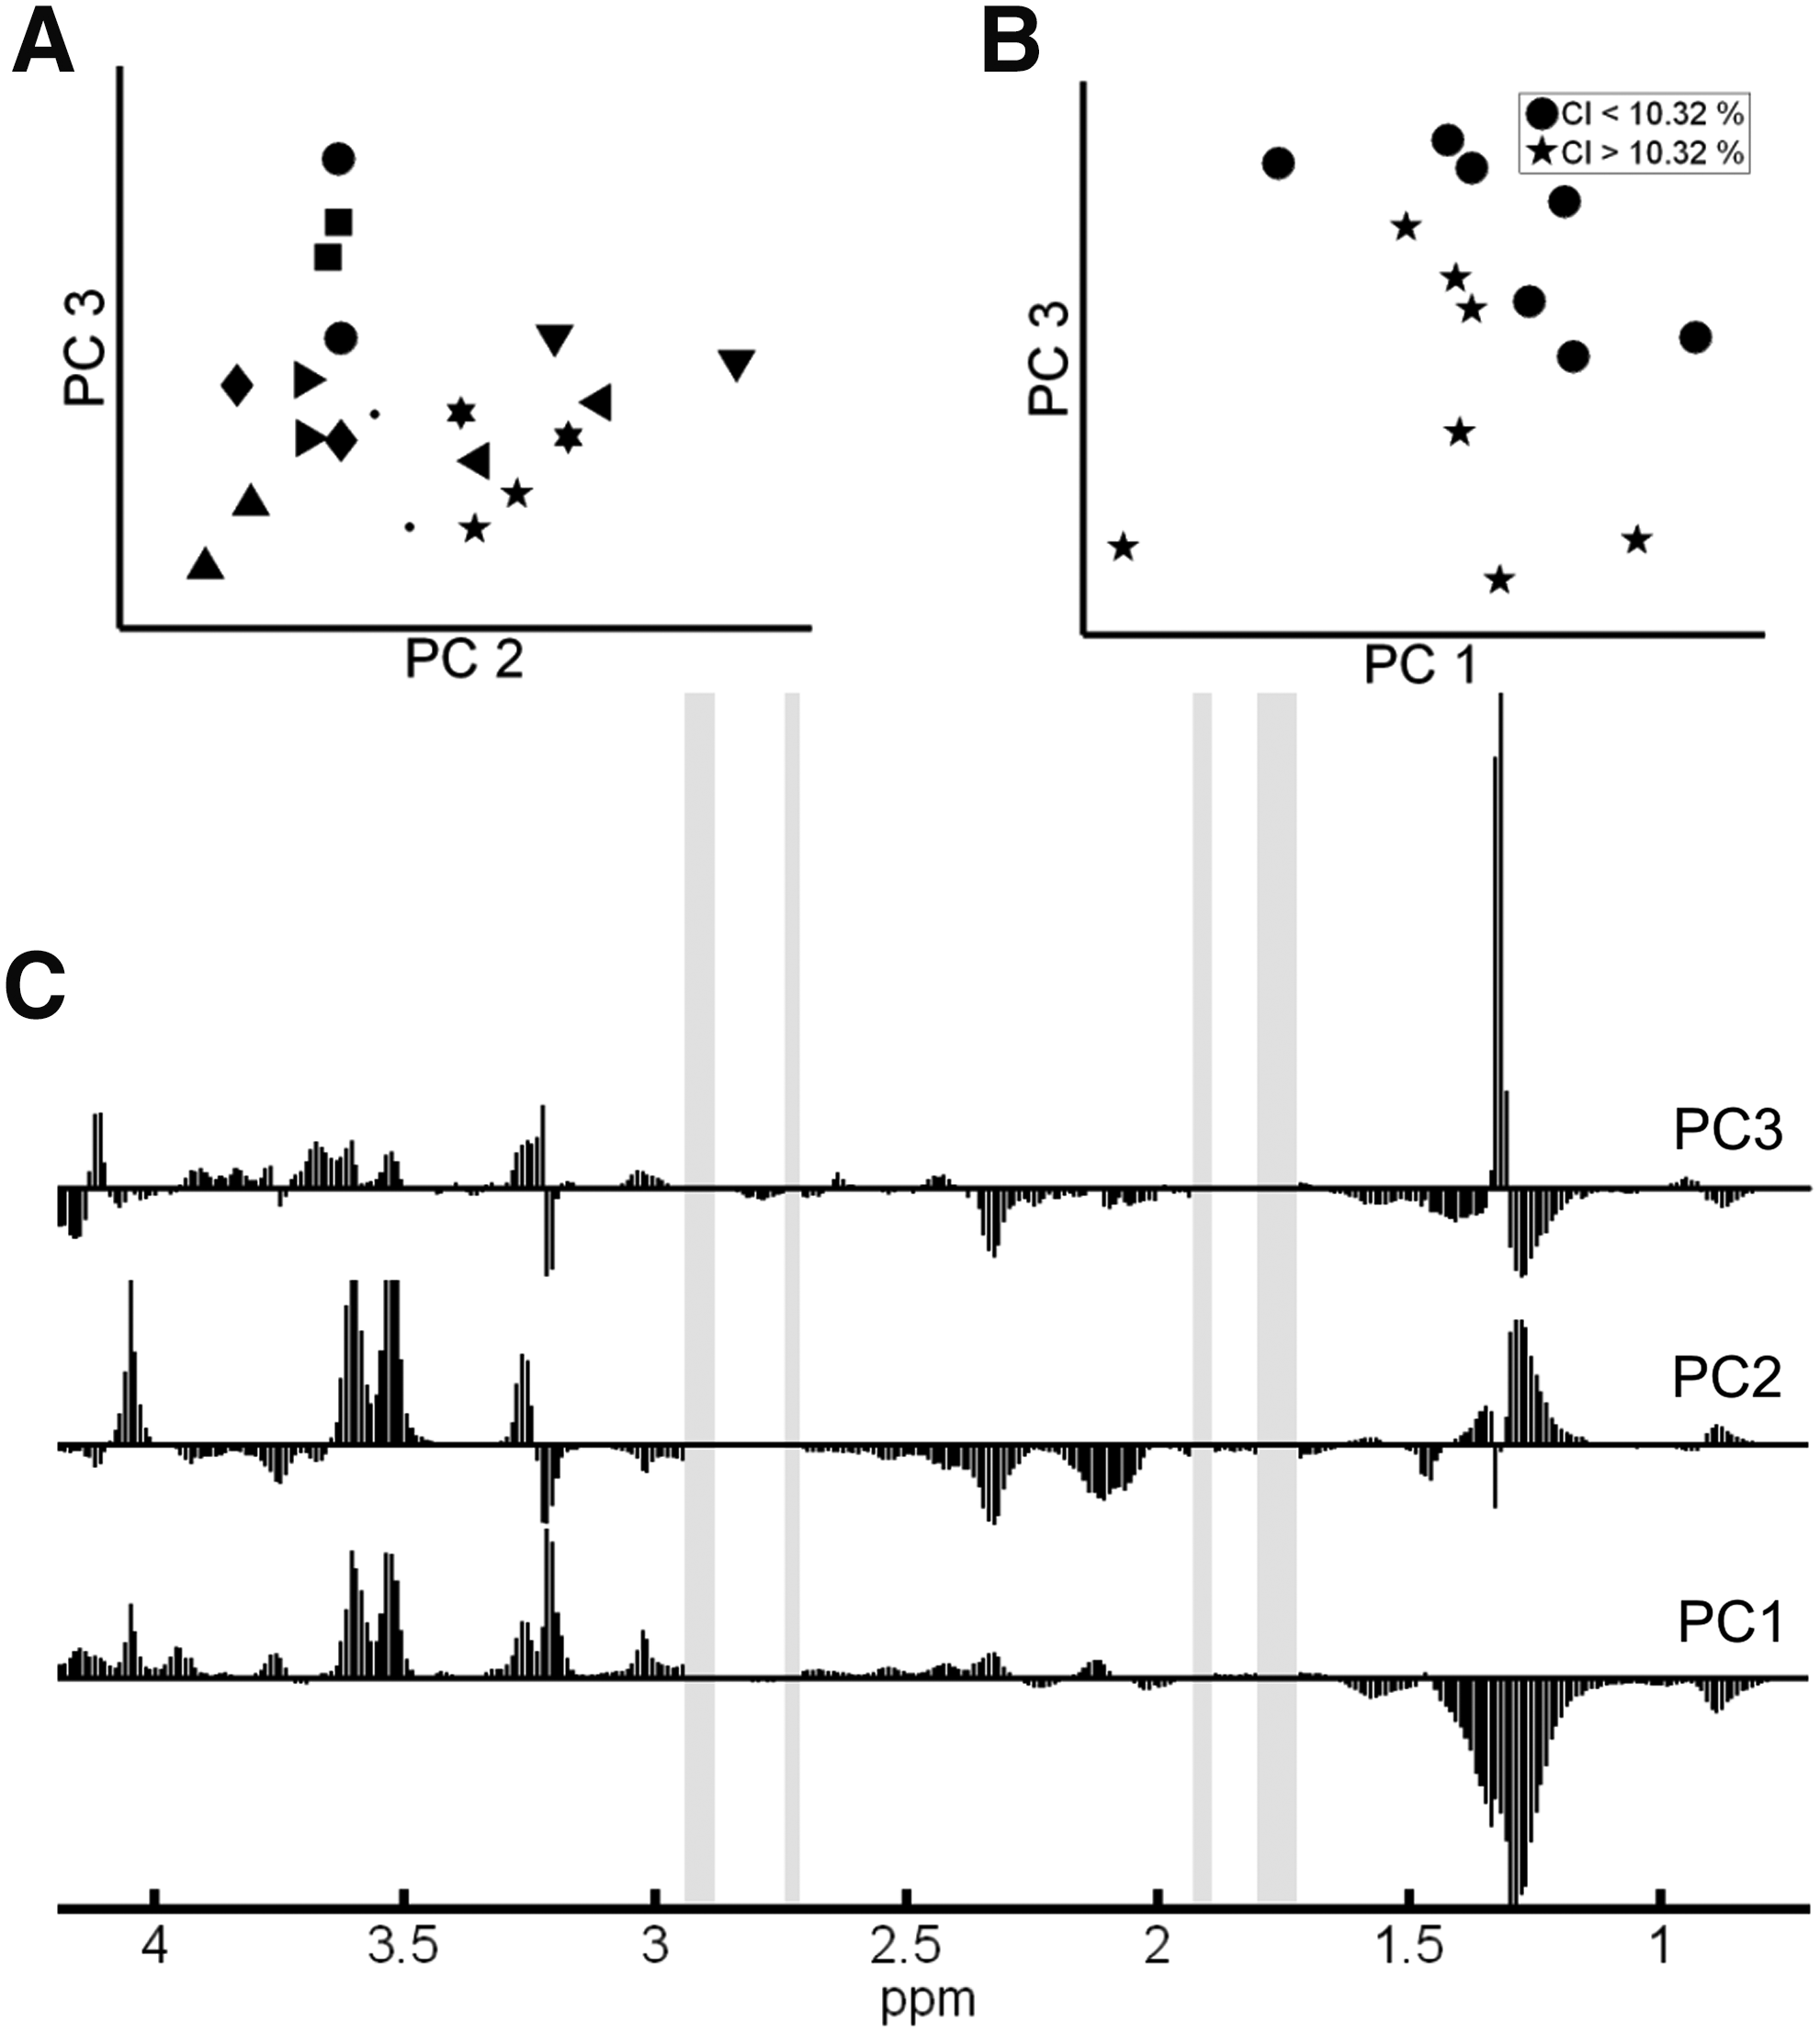
The scores plot of the first principal components (eg, PC2 vs. PC3 in Fig. 2B) did not show a distinct clustering of the 10 different CSC cell lines, but a relative closeness between each pair of measurements. For further cluster discrimination for stem cell-related properties, we excluded samples with a high proportion of dead cells (>40%, 6 samples), which may bias or mask relevant cluster. Based on the first 5 principal components, PCA scores plots broken down to samples' clonogenic index and CD133 expression were evaluated and revealed virtually no cluster discrimination between samples with high or low (ie, higher/lower than median) CD133 expression. However, PCA resulted in a clustering of samples with a clonogenic index higher/lower than the median in the 2-dimensional scores plot of principal components 1 and 3 (Fig. 2C), suggesting the presence of CSC-associated patterns within the NMR spectra. From the loadings plot of the first 3 principal components (Fig. 2A), the high-clonogenicity clustering can be attributed to high levels of M2, ML2, M3, glu, M6, and ML4 and low levels of lac and m-Ino.
Principal component analysis outcome.
Correlations between NMR spectra and biological properties of CSC lines
The high biological variability between CSC lines allowed a correlation analysis between biological properties and NMR spectra to generate hypotheses on the functional relevance of spectral regions. High/moderate correlations (I) to clonogenicity were found for spectral regions 2.38–2.28 ppm (glu, M6, ML4, R=0.65, P=0.002), 2.08–1.97 ppm (glu, gln, M5, ML3, R=0.51, P=0.023), and 1.48–1.45 ppm (ala, R=0.53, P=0.015), (II) to CD133 for 3.80–3.73 ppm (glx, R=−0.54, P=0.014) and 1.44–1.34 ppm (M3, ML2, R=0.55, P=0.012), and (III) to cell death for 1.29–1.15 ppm (ML2, R=0.43, P=0.059) and 0.92–0.80 ppm (M1, ML1, R=0.52, P=0.019).
However, only the correlation between the spectral region 2.38–2.28 ppm and clonogenicity remained significant after Bonferroni correction for multiple testing at a significance level of P<0.05.
With respect to cell death, the spectral regions around the mobile lipid peaks (ML2 and ML1) yielded the highest correlation coefficients (R=0.43; R=0.52), corresponding well to an earlier publication of our group [30]. Because the mobile lipid peak at 1.28 ppm constitutes a putative marker for neural stem cells [36], we evaluated the correlation between the quantified mobile lipid peak obtained by the fitting/deconvolution procedure and the biological assay outcomes. This confirmed the high positive correlation of the 1.28 ppm resonance and cell death within CSC lines (R=0.54, P=0.014; Fig. 3A). In line with our previous report, there was virtually no correlation to CD133 or clonogenicity (R=−0.04, P=0.86 and R=−0.13, P=0.59 for CD133 and clonogenic index, respectively; Fig. 3B, C).

Correlation of mobile lipids and biological properties. Correlation analyses of the deconvolved and quantified mobile lipid peak at 1.28 ppm (ML2/ML1+M1) versus percentage of dead cells per sample
Discussion
Although 1H-NMR spectroscopy is a widely available modality for the noninvasive investigation of brain tumors, the overall informative value of spectra obtained by clinical MRI scanners remains limited because of restricted resolution, low sensitivity, and nonstandardized data evaluations. We therefore used high-resolution NMR spectroscopy and reproducible in vitro conditions to viable cells to characterize the spectra of CSCs to overcome these problems. This study provided a first proof of presence of CSC-associated pattern within 1H-NMR spectra, and it also illustrates the difficulty to unambiguously detect CSCs using suspension NMR spectroscopy. Many well-defined resonances such as myo-inositol, cholines, creatines, amino acids, and lactate [37] also originated from the extracellular compartment (eg, leaked out from viable and necrotic cells, also addressed in Ref. [38]) and hardly correlated to stem cell-associated properties. In contrast, macromolecular resonances, that is, mobile lipids and mobile proteins, are located within viable cells but have several drawbacks: (i) their broad line shape and overlap with neighboring resonances urges for close to perfect signal-to-noise ratios and requires sophisticated postprocessing methods, for example, deconvolution/fitting routines, which lose their robustness when small broad signals are overlapped by several bigger peaks. (ii) Although several studies were published addressing the nature of macromolecular resonances both in vitro and in vivo [22 –36], neither the underlying mechanisms nor the biological/clinical relevance of their appearance or variations have been clarified in detail yet.
An additional problem for the definition of CSC-specific resonances remains the vague definition of CSCs. Although several new markers have been recently described [39], the most intensively investigated marker for GBM CSC, CD133, does rather indicate the lack of stemness than the presence of stem-cell like cells in a subgroup of CSC lines. As a consequence, there is no possibility to prospectively isolate pure CSCs, which impairs the search for CSC-specific resonances.
Despite these methodological problems, our study revealed some interesting features of 1H-NMR spectroscopy on CSC suspensions: Different samples from the same CSC cell line showed similar spectral patterns, although some other parameters (eg, different percentages of dead cells) impeded a distinct clustering in the scores plots of the first principal components of PCA. CSC lines with a high viability (>60%) showed moderate clustering of samples according to their clonogenic indices in the scores plot of the first and the third principal component, suggesting that CSC-specific patterns exist. Although the statistical design of this exploratory study implies that the P value of 0.05 may also identify false-positive results, 1 correlation [spectral region 2.38–2.28 ppm (glu, M6, ML4) to clonogenicity (R=0.65)] remained significant even after Bonferroni correction for multiple testing and warrants further investigation in vitro and in vivo. Taken together, our study showed that 1H-NMR spectroscopy may be suitable to differentiate between distinct CSC lines and to detect CSC-specific resonances. In addition, it confirmed that the previously described [36] putative stem cell-specific resonance at 1.28 ppm (ML2/M1+ML1) showed virtually no correlation with the number of clonogenic cells or the stem cell marker CD133. However, it was a good biomarker for cell death within the spectra, confirming previous results [30]. Therefore, it is tempting to speculate about the mobile lipid peak as a marker for cell death not only in differentiated glioma cells, but also in the CSC subfraction of solid tumors in vivo.
In addition, our pilot study suggests that 1H-NMR spectra differentiate between distinct CSC lines and identify CSCs in vitro. In addition, we confirmed that the mobile lipid peak is suitable to detect cell death but not stem cells within human CSC lines. Some spectral ROIs (eg, 2.38–2.28 ppm) might serve as a future marker for stemness in GBM cell lines and possibly in vivo.
Footnotes
Acknowledgments
Parts of the project were performed within the NGFNplus Brain Tumor Network (Subproject 7 No. 01GS0887). Additional funding was provided by the Bavarian State Ministry of Sciences, Research, and the Arts (ForNeuroCell grant) and by EU FP6-project DiMI (LSHB-CT-2005-512146).
Author Disclosure Statement
All authors confirm no conflicts of interest to disclose.