
Abstract
Bone marrow-derived hematopoietic stem/progenitor cells (HSPCs) encompass a wide array of cell subsets with different capacities of engraftment and injured tissue-regenerating potential. The characterization/isolation of the stem cell subpopulations represents a major challenge to improve the efficacy of transplantation protocols used in regenerative medicine. Cystic fibrosis (CF) is one of the diseases whose hope of cure relies on the successful application of cell-based gene therapy. This study was aimed at characterizing murine HSPCs on the basis of their bioenergetic competence and CF transmembrane conductance regulator (CFTR) expression. Positively immunoselected Sca-1+ HSPCs encompassed 2 populations distinguished by their different size, Sca-1 expression and mitochondrial content. The smaller were the cells, the higher was Sca-1 expression and the lower was the intracellular density of functional mitochondria. Reverse transcription–polymerase chain reaction and western blotting revealed that HSPCs expressed CFTR mRNA and protein, which was also functional, as assessed by spectrofluorimetric and patch-clamp techniques. Inhibition of mitochondrial oxidative phosphorylation by oligomycin resulted in a 70% decrease of both the intracelluar adenosine triphosphate content and CFTR-mediated channel activity. Finally, HSPCs with lower Sca-1 expression and higher mitochondrial content displayed higher CFTR levels. Our findings identify 2 subpopulations in HSPCs and unveil a so-far unappreciated relationship between bioenergetic metabolism and CFTR in HSPC biology.
Introduction
C
Despite intensive efforts in finding viable options for CF gene therapy, CFTR gene transfer in vivo is still too poorly efficient to be of clinical relevance [5,6]. This has led to a search for alternative approaches, including the use of stem cell populations.
This approach would require heterologous or gene corrected autologous stem cells to reach the airways and differentiate into epithelial cells. In vivo studies in mouse models have suggested that bone marrow (BM)-derived hematopoietic stem/progenitor cells (HSPCs) can localize to the lung and acquire phenotypic markers of airway and alveolar epithelium, vascular endothelium, and interstitial cells [7 –11]. There is also evidence that blood-borne stem cells may contribute to lung tissue in recipients of BM or lung transplantation [12 –14]. However, homing and engraftment of HSPCs into the lung is a very inefficient process. The current state of the art indicates that only a very small proportion, that is, <0.01%–0.025% of lung epithelial cells, is derived from BM-derived cells (reviewed in [15]). We have recently demonstrated that in a model mimicking the early phases of bacterial infection and airway remodeling occurring in CF patients, the local administration of lin− Sca-1+ HSPCs resulted in a limited (∼1%) transformation of HSPCs into respiratory epithelial cells [16]. Although technical problems can be invocated, it could be that whole BM cells or selected populations have inherent problems in lung engraftment and subsequent transformation into epithelial cells. The animal model employed and the type of damage occurring at epithelial level could be another variable.
Primitive hematopoietic stem cells are sequestered in the BM in the regions with diminished perfusion [17]. It can be inferred that a hypoxic microenvironment may protect HSPCs from the toxic and mutagenic effects of free radicals generated from oxygen. To strengthen these findings, proteomics analysis showed that lin− sca+ kit+ HSPCs express high levels of anerobic glycolytic enzymes and proteins involved in protection against oxidative damage and DNA repair [18]. Nevertheless, HSPCs have to differentiate and egress from the BM. They perform this task by migrating from their endosteal niche toward the central venous sinuses [19], where they eventually encounter an aerobic environment. In this study we aimed to characterize subsets of HSPCs with different bioenergetic potential that might possibly be utilizable in optimizing stem cell-based tissue-regenerating protocols. In addition, given the specific interest in CF, CFTR expression and function were studied in these isolated HSPCs.
Materials and Methods
BM cell isolation
All animal procedures were approved and controlled by the Italian Ministry of Health and carried out according to the guidelines of the Italian law of protection of animal life. C57Bl/6 male mice (6–8 weeks old) were sacrificed to obtain total BM, as previously described [16]. Recovered total BM cells were filtered (Cell trics 100 mm; Partec), centrifuged, washed, and re-suspended in an appropriate medium (depending on the negative or positive selection kit used, see below).
EasySep negative selection
Negative selection of BM stem/progenitor cells by EasySep (EasySep Mouse Hematopoietic Progenitor Enrichment Kit; StemCell Technologies) was done accordingly to the manufacturer's instructions and as previously described [16].
Phenotypic characterization of lin− cells
About 2×10⁵ lin− progenitor cells were incubated for 30 min at 4°C in PBS with a fluorescein isothiocyanate (FITC)-conjugated anti-Sca-1 antibody (rat anti-mouse IgG2a; Becton Dickinson; 0.2 mg/mL) or FITC-conjugated isotype control IgG2a (Becton Dickinson; 0.2 mg/mL), and then they were washed 2 times and analyzed by flow cytofluorimetry. The same number of cells was incubated for 1 h at room temperature with anti-CD45R (rat anti-mouse IgG2a; Santa Cruz Biotechnology; 4 ng/mL), washed 1 time, and incubated with an FITC-conjugated secondary antibody (anti-rat; Santa Cruz; 5 ng/mL) for 45 min at room temperature, washed, and analyzed by flow cytometry. Data were collected using a Coulter Epics XL flow cytometer (Beckman Coulter) and analyzed with WinMDI 2.9 (
EasySep positive selection
Positive selection of BM stem/progenitor cells by EasySep (Mouse Sca1 selection kit; StemCell Technologies) was done accordingly to the manufacturer's instructions. Briefly, recovered total BM cells were filtered, centrifuged, washed, and re-suspended in PBS supplemented with 2% FBS, 1 mM EDTA. Subsequently, the Sca-1 phycoerythrin (PE) antibody was added to isolated BM cells. Then, tetrameric antibody complex that recognizes both PE and dextran was added, which was followed by addition of dextran-coated magnetic nanoparticles. Magnetically labeled target cells were then separated from unlabeled unwanted cells using the EasySep magnet by pouring the unlabeled cells off. The vitality of each HSPC preparation was evaluated by Trypan Blue exclusion assay, which resulted to be 97%±2% (n=6).
Analysis of cell cycle and SP cells
About 1×10⁶ positively selected Sca-1+ HSPCs were re-suspended in prewarmed PBS containing 2% of FBS and 10 mM N-[2-hydroxyethyl]piperzazine-N′-[2-ethanesulfonic acid] (HEPES) and added with Hoechst 33342 (Sigma-Aldrich; 5 μg/mL) and placed at 37°C for 90 min. To verify the authenticity of side population (SP) cells we then added verapamil, the direct inhibitor of the ABC transporter Bcrp1 (also known as Abcg2 murine/ABCG2 human) [20], which allows the exclusion of the Hoechst 33342 dye. Briefly, samples were incubated with verapamil (Sigma-Aldrich; 100 μM) for 30 min at 37°C before adding Hoechst 33342. The tubes containing cells were shaked every 30 min. After incubation, the cells were centrifuged at 20,000 g at 4°C for 5 min, and then the pellet was re-suspended in cold PBS containing 2% FBS and 10 mM HEPES. The tubes were kept at 4°C until cytofluorimetric analysis. Data were collected and analyzed using a Cell Lab Quanta SC flow cytometer (Beckman Coulter).
MTG staining
About 2×10⁵ Sca-1 selected stem/progenitor cells were added with 500 nM MitoTracker Green (MTG; Invitrogen Life Technologies) and incubated for 30 min at 37°C. After 2 washings, the cells were re-suspended in PBS and analyzed by cytofluorimetry.
Continuous cell lines
Human bronchiolar epithelial cells 16HBE14o− (a generous gift of Professor D. Gruenert, California Pacific Medical Center Research Institute, University of California at San Francisco, CA) were grown as described previously [21]. Human embryonic kidney 293 cells were grown in IMDM (Sigma-Aldrich) supplemented with 10% FBS and 1% glutamine. Murine macrophages M1 (American Type Culture Collection) were grown in Dulbecco's modified Eagle's medium (Sigma-Aldrich) supplemented with 10% FBS and 1% glutamine.
CFTR cytofluorimetric assay
About 2×10⁵ Sca-1 selected HSPCs were first fixed in PBS containing 3% paraformaldehyde and 2% sucrose for 5 min, permeabilized in PBS containing 20 mM HEPES, 300 mM sucrose, 50 mM NaCl2, 3 mM MgCl2, and 0.5% Triton X-100 for 10 min, and then were incubated with CFTR antibody (MAB25031 mouse IgG2a used at 1:500; R&D Systems) for 1 h at 4°C, followed by the FITC-conjugated secondary antibody (anti mouse used at 1:1,000; eBioscience) for 45 min at 4°C, washed 2 times, and analyzed by flow cytofluorimetry. Controls included the incubation of Sca-1+ HSPCs with the isotype control antibody FITC rat IgG2a κ (clone RTK2758, Biolegend), used at 1:500, and the secondary antibody only. 16HBE14o− and 293 cells were used as positive and negative controls for CFTR expression, following the same conditions of HSPCs.
LSMC analysis
About 3×10⁶/mL of either lin− progenitor cells or Sca-1+ HSPCs were incubated with 2 μM TetraMethyl-Rhodamine (TMRE) or 500 nM MTG (30 min, 37°C), washed with PBS, fixed with 3.7% paraformaldehyde (5 min, room temperature), resuspended in PBS plus 1% bovine serum albumin, and incubated with an anti-Sca-1 monoclonal antibody (30 min, 4°C). The cells were then washed 3 times with PBS/bovine serum albumin, pH 7.4, and incubated (1 h, room temperature) with a secondary FITC- or TRITC-conjugated antibody. Stained cells were analyzed by a Nikon TE2000 microscope coupled to a Radiance 2100 confocal dual-laser scanning microscopy system (Bio-Rad). Fluorescent signals emitted by MTG or FITC-conjugated secondary antibody (λ ex, 490 nm; λ em, 516 nm) and by TMRE or TRITC-conjugated secondary antibody (λ ex, 544 nm; λ em, 572 nm) were quantified by LaserSharp and LaserPix software from Bio-Rad.
The specificity of the MTG and TMRE signals was assessed under uncoupled condition in the presence of 4 mM valinomycin plus 10 mM carbonyl cyanide m-chlorophenylhydrazone (CCCP).
Fluorescence chloride efflux measurements
Chloride efflux was measured using the Cl− sensitive dye MQAE as previously reported [21]. Cells seeded on 0.1% gelatin-coated glass coverslips were loaded overnight in culture medium containing 5 mM MQAE. Fluorescence was recorded with a Cary Eclipse Varian spectrofluorometer.
In some experiments the Cl− efflux was detected at the level of single cells using a video imaging system as previously reported [22].
All experiments were performed at 37°C in HEPES-buffered bicarbonate-free media [Cl− medium (in mM)]: 135 NaCl, 3 KCl, 1.8 CaCl2, 0.8 MgSO4, 20 HEPES, 1 KH2PO4, 11 glucose, and Cl− free-medium: 135 NaNO3, 3 KNO3, 0.8 MgSO4, 1 KH2PO4, 20 HEPES, 5 Ca(NO3)2, 11 glucose. The rates of chloride efflux were calculated by linear regression analysis of the first 30 points taken at 4 s intervals, whereas the change of fluorescence was still linear. As in other cell types, positively selected Sca-1+ HSPCs exhibited a low chloride efflux under baseline conditions when chloride was replaced by nitrate. CFTR-dependent chloride efflux was calculated as the difference in alterations of forskolin (FSK) (10 μM) plus 3-isobutyl-1-methylxanthine (IBMX) (500 μM) stimulated fluorescence in the absence and presence of either of the CFTR inhibitors glibenclamide (100 μM; Sigma-Aldrich) or CFTRinh-172 (5 μM; Calbiochem).
Patch clamping
To facilitate adhesion, HSPCs (3×10⁵) were cultured on glass coverslips (diameter 12 mm) previously coated with Cell-Tak™ (BD Biosciences) according to manufacturer's adsorption protocol. Cell morphology was not significantly affected by culturing HSPCs on Cell-Tak. Patch-clamp experiments in cell-attached configuration were performed as reported [23]. Pipette solutions were optimized for detecting Cl− currents. In single-channel patches, pipette resistance was 8–9 MΩ when filled with (in mM): 115 N-methyl-
Western blot analysis
Cells were lysed in lysis buffer (110 mM NaCl, 50 mM TRIS, 0.5% Triton X-100, and 0.5% Igepal CA-630, pH 8.0 with added protease inhibitor cocktail), sonicated for 10 s, and centrifuged for 10 min (16,000 g).
Forty micrograms of samples was loaded onto 7% sodium dodecyl sulfate–polyacrylamide gels and then transferred to polyvinylidene difluoride membranes. Membranes were probed with anti-hCFTR monoclonal antibody against the C terminus (MAB25031, dilution 1:500, R&D Systems) and with anti-β-actin monoclonal antibody (dilution 1:5,000; Sigma-Aldrich). Immunocomplexes were detected with ECL plus reagent (Amersham Biosciences). Densitometric analysis of the stained bands was carried out on digitalized images by the freeware ImageJ 1.38× (Wayne Rasband, NIH;
RT-PCR and nested PCR
Total RNA was extracted from 1.5×10⁵ cells using Trizol reagent (Invitrogen) following the protocol suggested by the manufacturer. The concentration of RNA was estimated by Nanodrop 1000 spectrophotometer (Thermo Scientific) at 260 nm wavelength and the purity was confirmed by measuring the absorbance ratio at 260/280 nm wavelengths.
Total RNA (1 μg) was used to prepare the first-strand cDNA. The primer used in reverse transcription reaction was (CFTR reverse) 5′-TTC CCC AAA TCC CTC CTC-3′. Reverse transcription was performed under the following conditions: initial incubation for 10 min at 25°C, followed by 120 min at 37°C and for 25 s at 85°C. RNA was reverse transcribed in the presence of 2.5 units Reverse transcriptase (Applied Biosystems), 0.4 μM of primer, 4 mM of nucleotide mix, and commercial buffer (Applied Biosystems).
The primer sets for CFTR-polymerase chain reaction (PCR) amplification were forward 5′-CTT TCC AAC AAC CTG AAC AA-3′ and reverse 5′-TTC CCC AAA TCC CTC CTC-3′, which produced a DNA segment of 653 bp. PCR was performed under the following conditions: initial denaturation for 2 min at 94°C, followed by 35 cycles of denaturation (15 s, 94°C), annealing (30 s, 56°C), and extension (1 min, 72°C).
The primers used in nested CFTR-PCRs were forward int 5′-CTC TTC TGA TGG GGC TTC T-3′ and reverse int 5′-GGA ACT GCC GTG TGA CTG-3′, which produced a DNA segment of 430 bp. PCR was performed under the following conditions: initial denaturation at 94°C for 2 min, followed by 35 cycles of denaturation (15 s, 94°C), annealing (30 s, 57°C), and extension (1 min, 72°C). All primers were designed using homologous region for human and mouse gene. In the PCR, cDNAs (150 ng) were used in the presence of 1 units Taq polymerase (Fermentas), 0.4 μM of each primer (CFTR reverse and forward), 0.2 mM of nucleotide mix, and commercial buffer containing 2 mM MgCl2 (Fermentas).
The random primers were used to reverse transcribe the mRNAs to their corresponding cDNAs. To attest the validity of extracted cDNAs, we performed the β-actin PCR after using the following primers: forward 5′-CAA CTG GGA CGA CAT GGA–3′ and reverse 5′-ACG TCA CAC TTC ATG ATG GA-3′, which produced a DNA segment of 610 bp. PCR was performed under the following conditions: initial denaturation for 2 min at 94°C, followed by 35 cycles of denaturation (15 s, 94°C), annealing (30 s, 56°C), and extension (1 min, 72°C). Primers were designed using homologous region for human and mouse gene. All primers were obtained from Eurofins MNG Operon.
The identities of amplified products were confirmed by determination of molecular size on agarose gel electrophoresis (1.5% agarose in buffer containing 40 mM Tris/acetate and 1 mM EDTA) and observed by ethidium bromide staining (0.5 μg/mL) under ultraviolet light.
ATP assay
Cellular adenosine triphosphate (ATP) content was assayed by bioluminescence using a luciferin–luciferase (rL/L) reaction system (Enliten ATP assay; Promega), as previously described [24]. Briefly, 1×10⁴ HSPCs were centrifuged at 12,000 g for 10 min and the surnatant was stored at −80°C. To lyse the cells, 200 μL of boiling ATP-free water was added to the pellet. After centrifugation at 12,000 g for 5 min, 20 μL of sample was added to 100 μL of rL/L reagent and read at the TD-20/20 luminometer DL-Ready (Turner Design Instruments) at 560 nm. A standard curve was performed adding 20 μL of ATP standard diluted to the proper concentrations at 100 μL of rL/L reagent. Oligomycin (8 μg/mL) was added to 0.4×10⁵ HSPCs and the samples were incubated for 2h at 37°C, shaken every 30 min, and processed as above.
Data analysis
Data are presented as mean±standard deviation for the number of samples indicated (n). Statistical comparisons were made using paired or unpaired data Student's t-test. Differences were considered significant when P<0.05.
Results
Phenotypic characterization of mouse lin− stem/progenitor cells
The percentage of stem/progenitor in BM cells oscillates from 0.01% to 0.1% [25,26]. To enrich for HSPCs, a negative immunoselection method was applied to BM-flushed cells. The resultant lin− cells were positive for Sca-1 (20.5%±3.1%; n=3) and CD45 (5.3%±0.5%; n=3), confirming that the BM population was enriched for stem/progenitor cells and deprived of committed cells. Cytofluorimetric analysis of lin− cells showed 2 populations distinguishable with respect to their dimension and density (Supplementary Fig. S1; Supplementary Data are available online at
Mitochondrial content of lin− cells
Laser scanning confocal microscopy (LSCM) analysis was carried out to investigate the bioenergetic profile of BM-derived stem/progenitor cells, purified by negative immunoselection. The lypophilic cation TMRE, which accumulates in mitochondria by a membrane potential-driven process, was used for detection of energized mitochondria. A representative LSCM analysis is illustrated in Supplementary Fig. S2A, showing a heterogeneous population of cells with different size: some of which displayed a high density of functioning mitochondria, whereas others displayed a fainter mitochondria-related signal. When the cell sample was preincubated with either the oxidative phosphorylation uncoupler CCCP or with potassium cyanide (KCN), no staining by TMRE was observed (Supplementary Fig. S2A). This verified both the specificity of the mitochondrial ΔΨ probe and its dependence on the activity of the respiratory chain. Mitochondrial staining was then coupled with immunodetection of the surface antigen marker of stem cells, Sca-1. As shown in Supplementary Fig. S2B, the mitochondria-linked red signal was inversely correlated with the Sca-1 staining and only 15%–20% of the entire cell population was Sca-1+, confirming cytofluorimetric data.
The mitochondrial content of positively selected cells inversely correlates with Sca-1 expression
Lin− cells were only 20% enriched for progenitor cells and displayed a nonhomogeneous content of energized mitochondria. These features would not be favorable for engraftment into damaged tissues. Thus, it was decided to carry on this investigation by changing the progenitor cell selection method. Therefore, whole BM was processed by anti-Sca-1-positive selection, which raised the percentage of stem/progenitor cells to 93%, as shown by cytofluorimetry (Fig. 1B). Analysis of the cell cycle demonstrated that most of the cells were in G0/G1 (Supplementary Fig. S3A and B) and only 0.76%±0.20% could be identified as side population (SP) on the basis of their ability to extrude the dye Hoechst 33342 and to be inhibited in this property by incubation with the drug verapamil (Supplementary Fig. S3C and D). SP cells comprise a subset (∼10%) of the 1% fraction of Sca-1+ lin− cells from whole BM, thus comprising 0.1% of the BM cells. Further, the SP cells are enriched about 1,000-fold for HSC activity, as determined in competitive repopulation experiments, and provide high long-term multilineage contribution in radioprotection experiments [20].
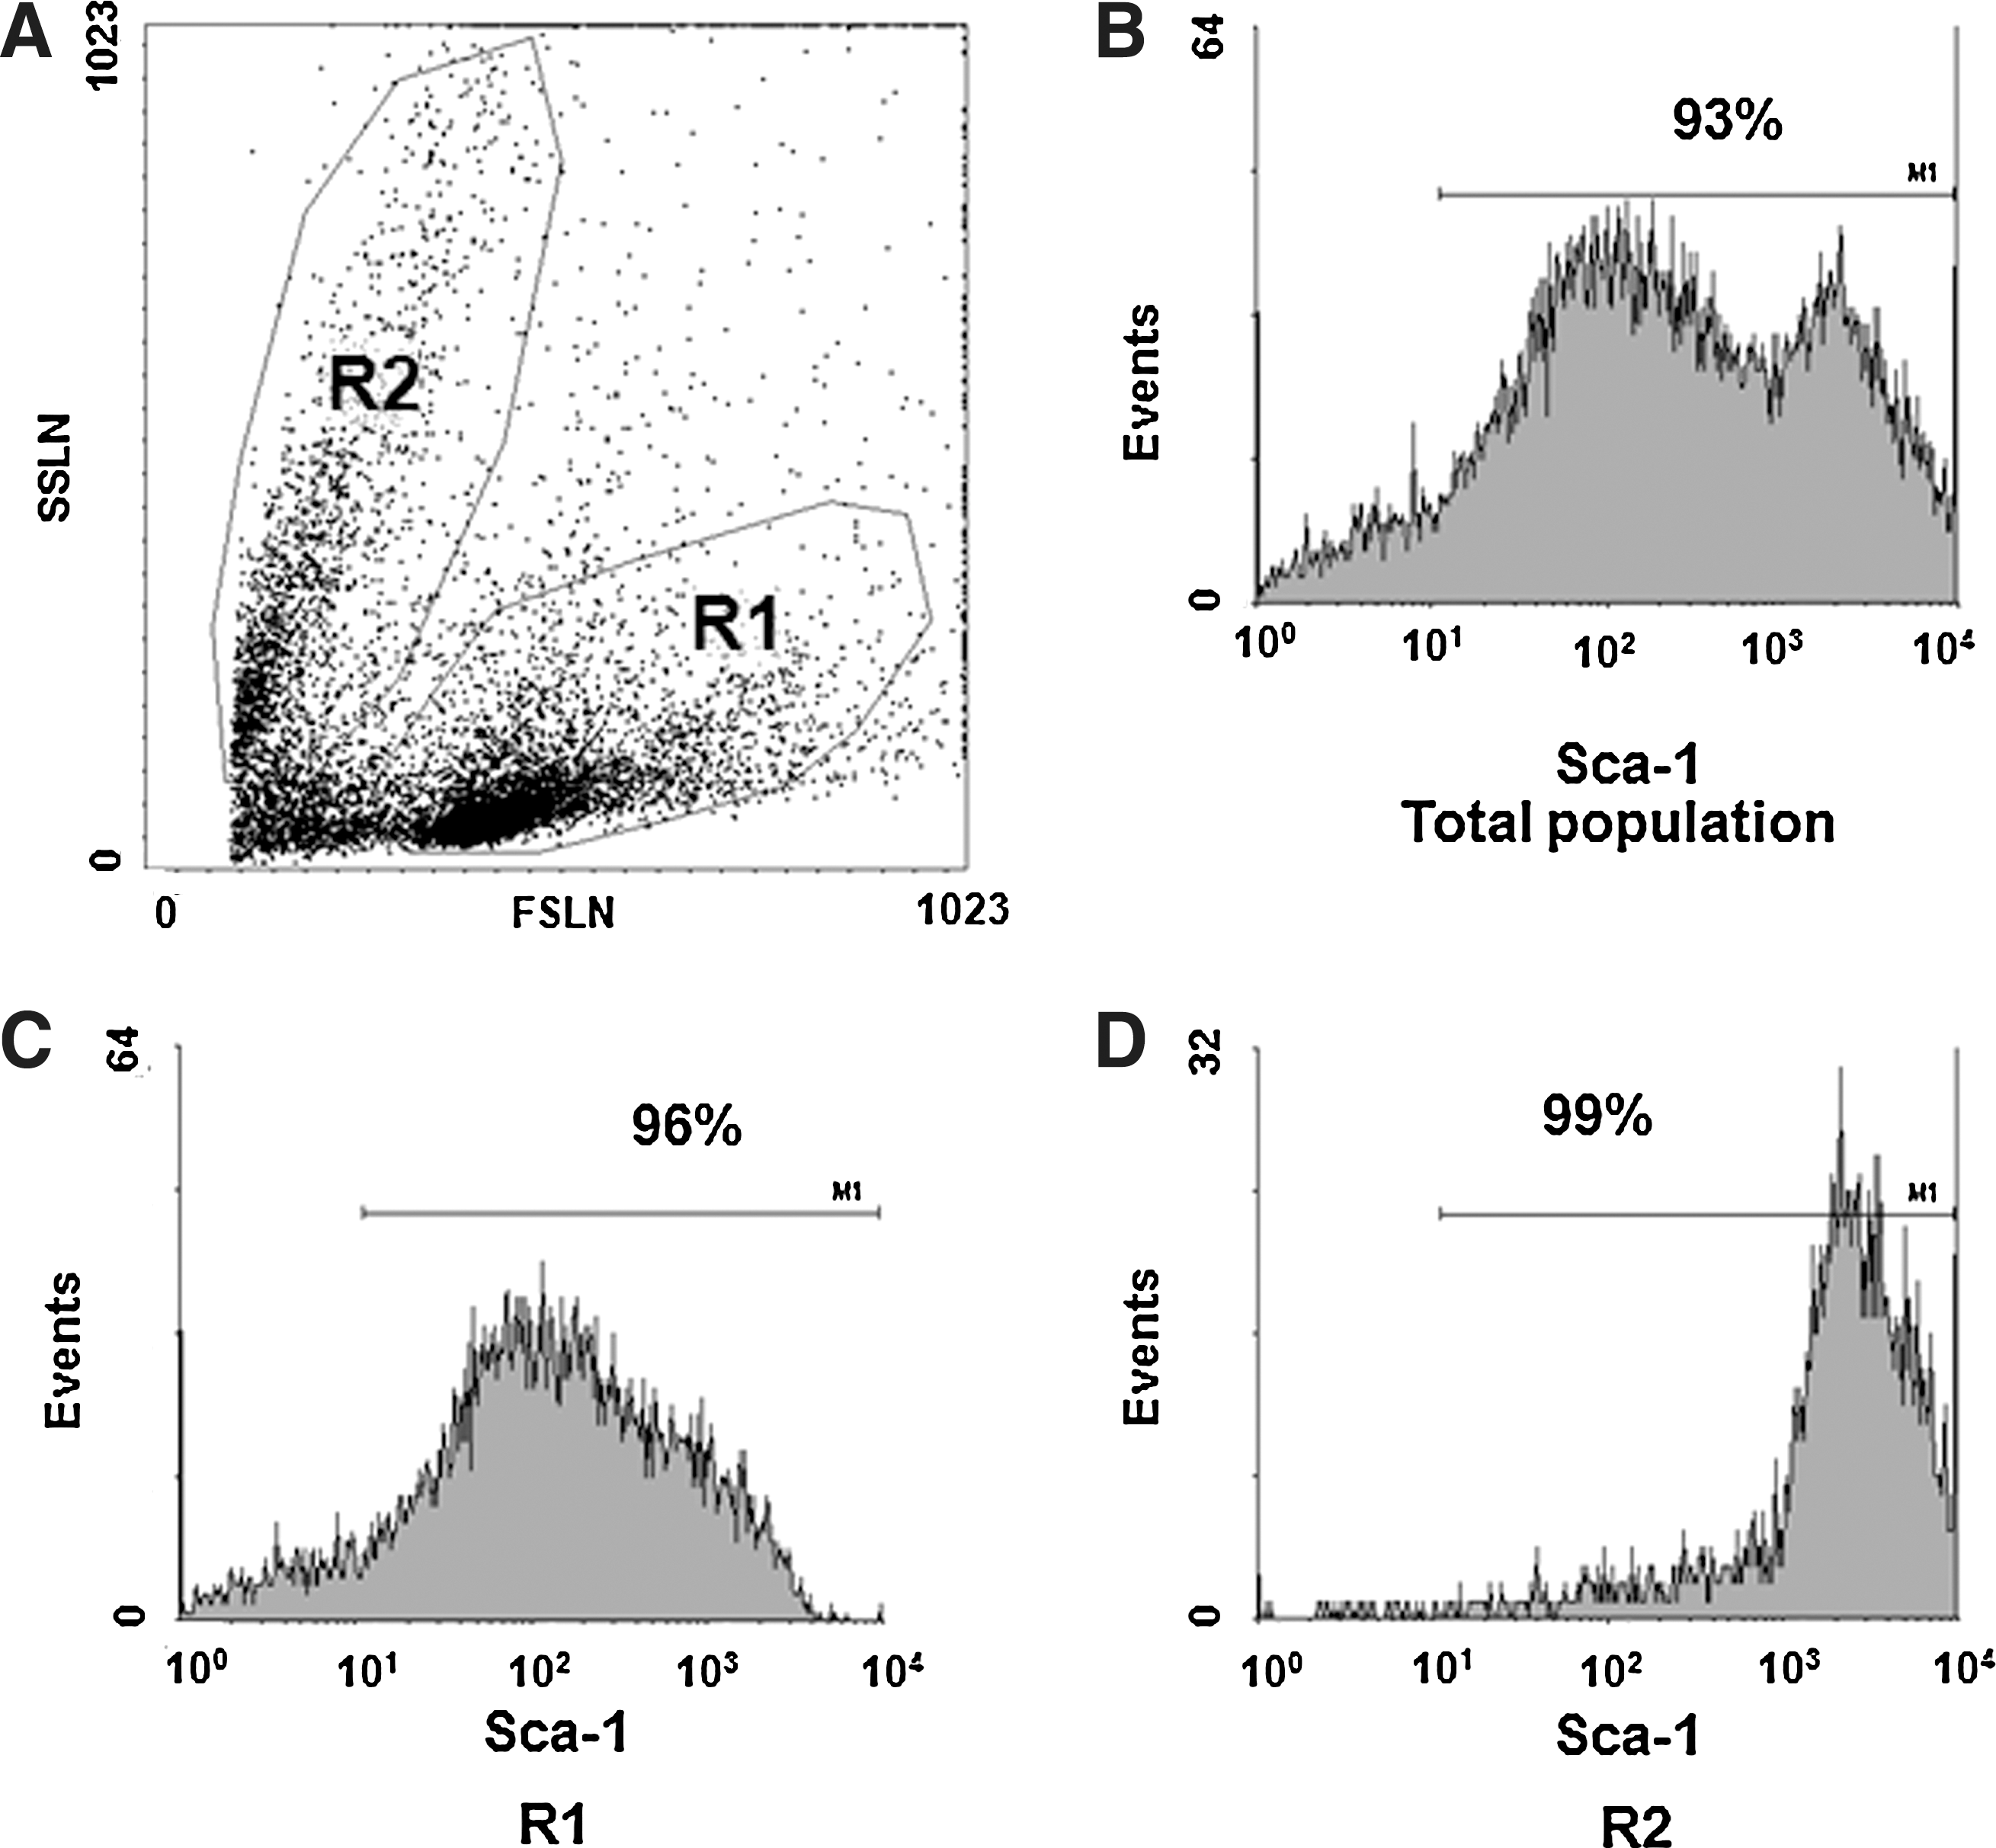
Flow cytometry analysis of positively selected cells. HSPCs were analyzed by flow cytometry 30 min after their selection, since the anti-Sca-1 antibody used for positive selection was PE-conjugated.
As for lin− cells, isolated Sca-1+ progenitor cells showed 2 populations distinguishable by their different size and density (Fig. 1).The mitochondrial content of positively selected stem/progenitor cells was studied by flow cytofluorimetry using the fluorescent MTG dye that stains mitochondria in live cells where its accumulation is driven by the mitochondrial membrane potential. We observed that the smaller the cell was, the higher was the Sca-1 expression and the lower was the MitoTracker fluorescence intensity (Fig. 2). The population of larger cells contained a lower percentage of Sca-1+MTGlow cells (14.8%±0.4%) and a higher percentage of Sca-1+MTGhigh (66.5%±7.7%), whereas the population of smaller cells showed a higher percentage of Sca-1+MTGlow (60.3%±11.9%) and a lower percentage of Sca-1+MTGhigh cells (27.6%±6.5%).
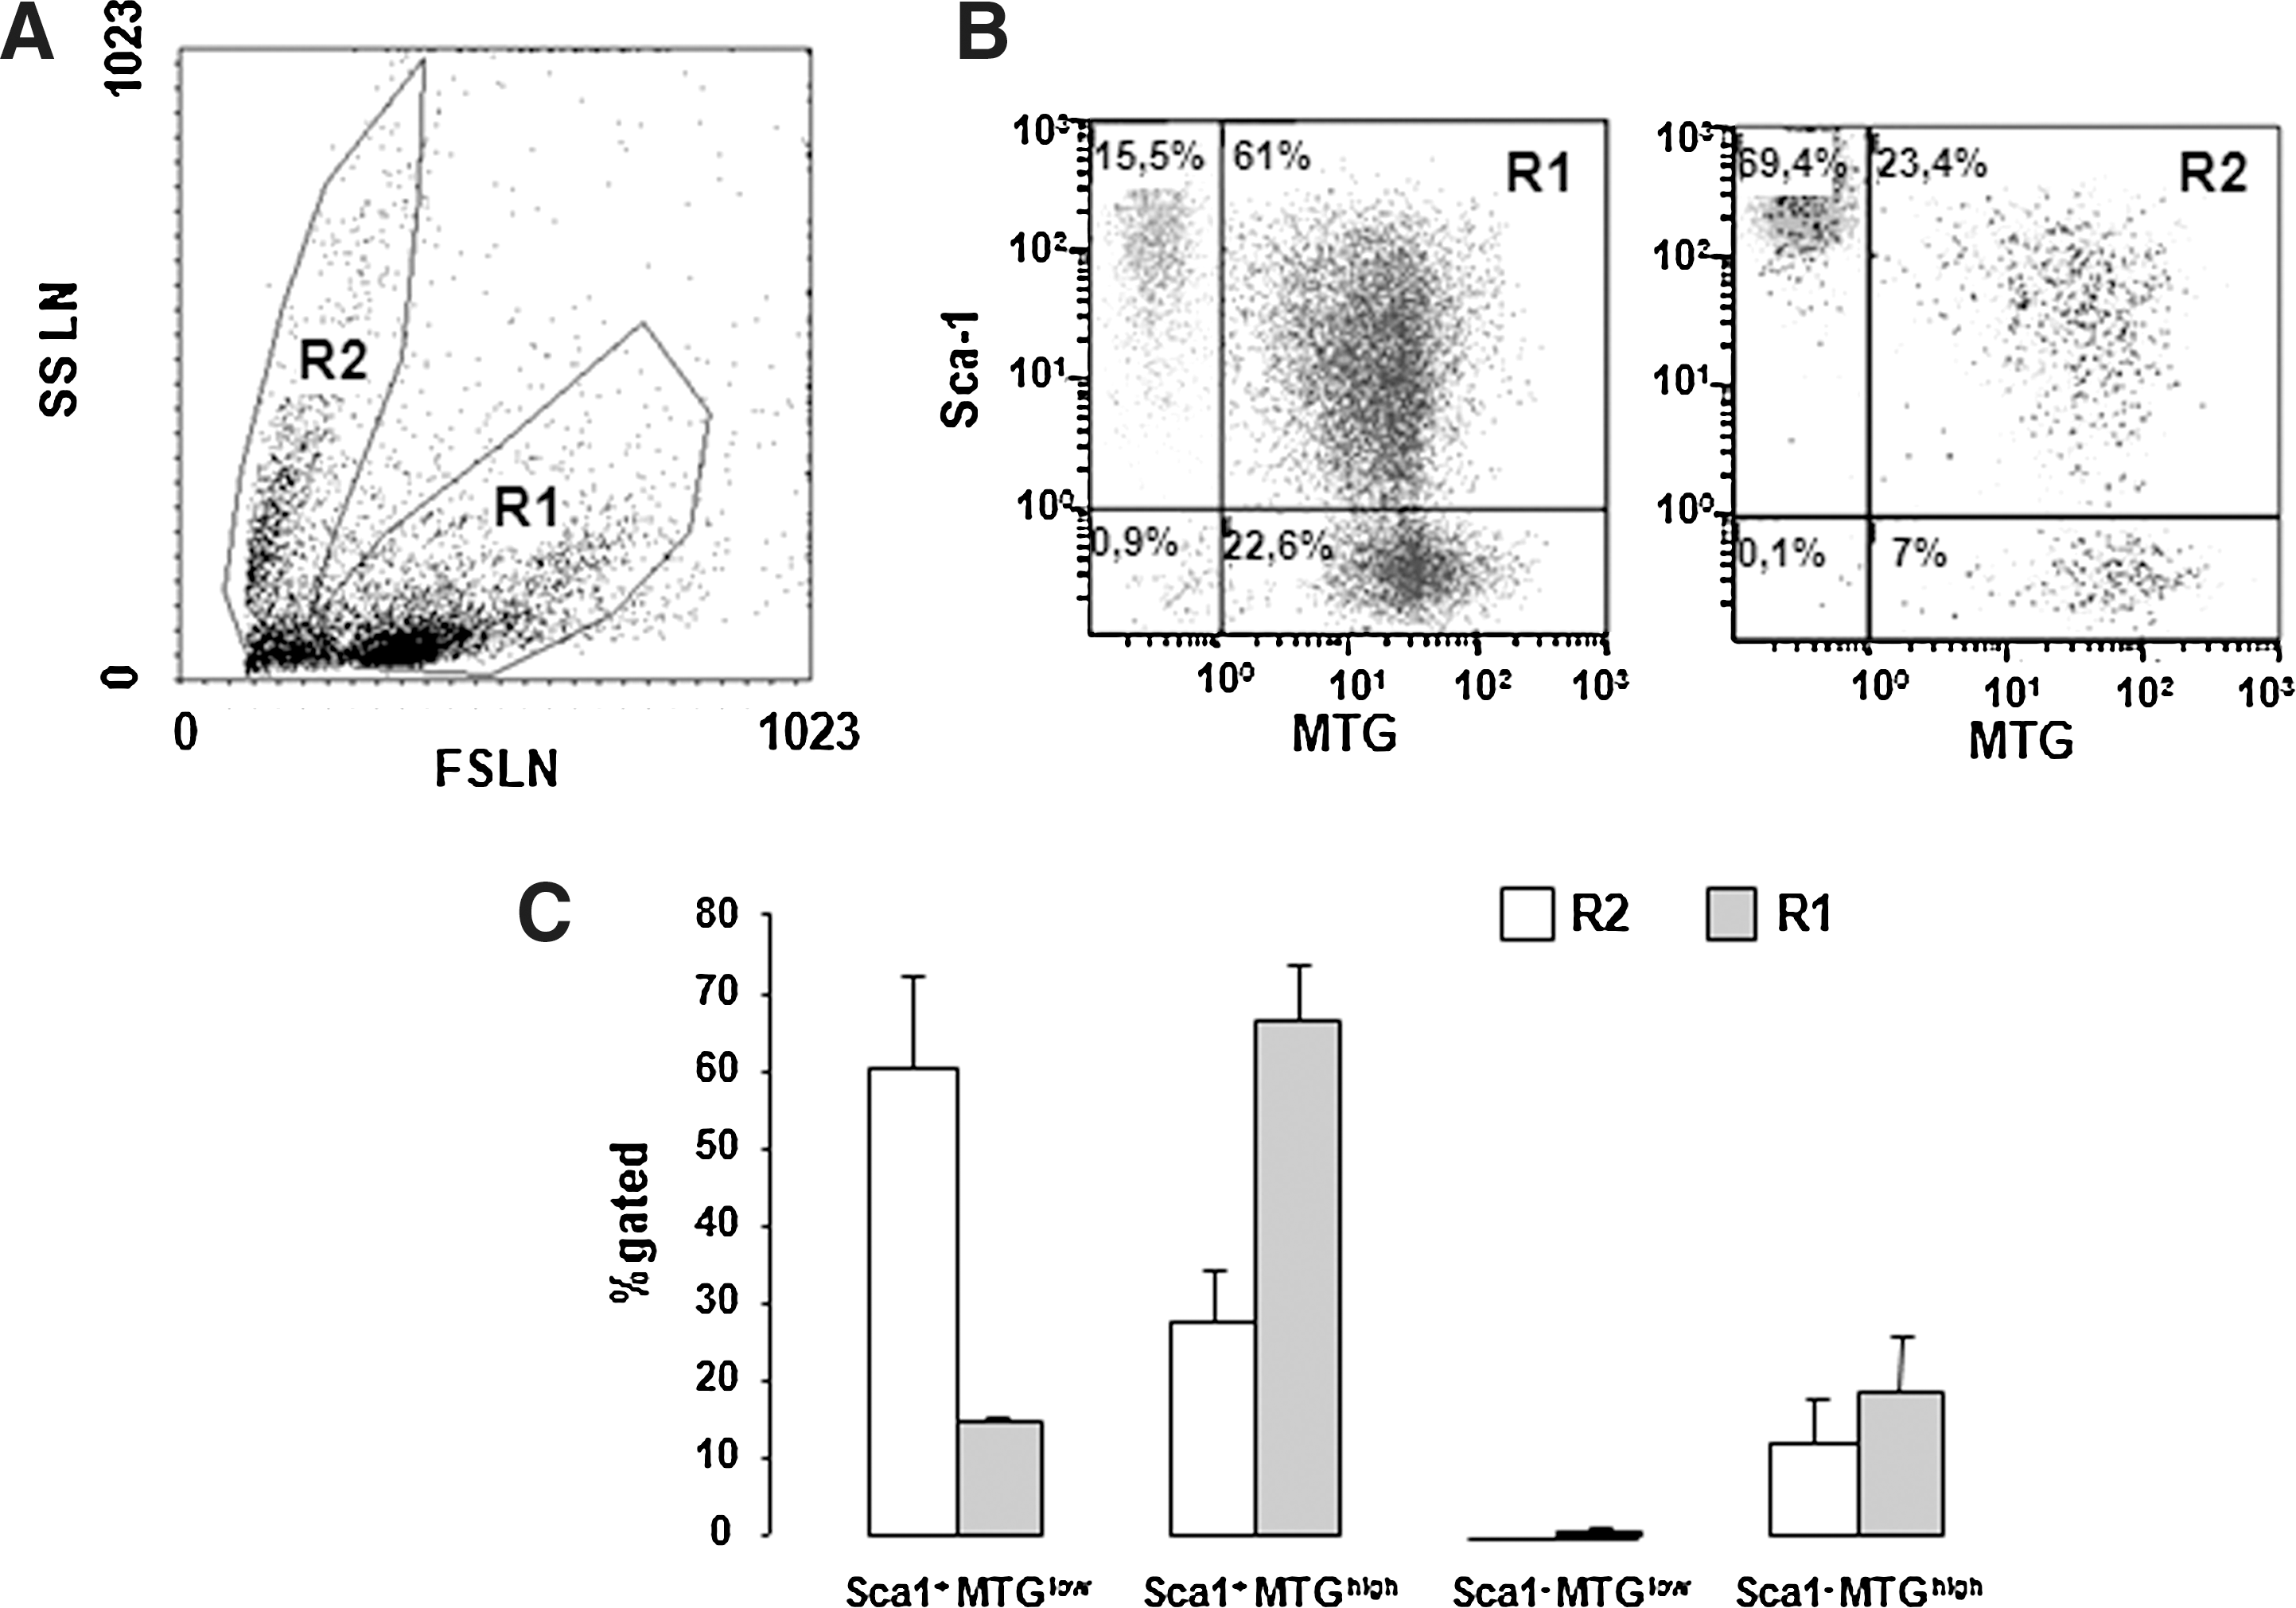
Mitochondrial content of Sca-1+ positively selected cells.
LSCM revealed that almost 95% of the cells were Sca-1+ (confirming flow-cytometry analysis). Sca-1+ HSPCs were again clearly dishomogeneous for the mitochondrial content (Fig. 3C). The Sca-1 signal was inversely correlated with the mitochondrial content, as shown in Fig. 3D, suggesting that the population is still heterogeneous but the number of cells with low mitochondria signal and expressing a strong Sca-1 signal has been clearly increased. Pretreatment of Sca-1+ progenitor cells with the protonophore uncoupler CCCP resulted in a loss of the MTG signal as compared with untreated cells (Fig. 3A & B), indicating the specificity of MTG staining.
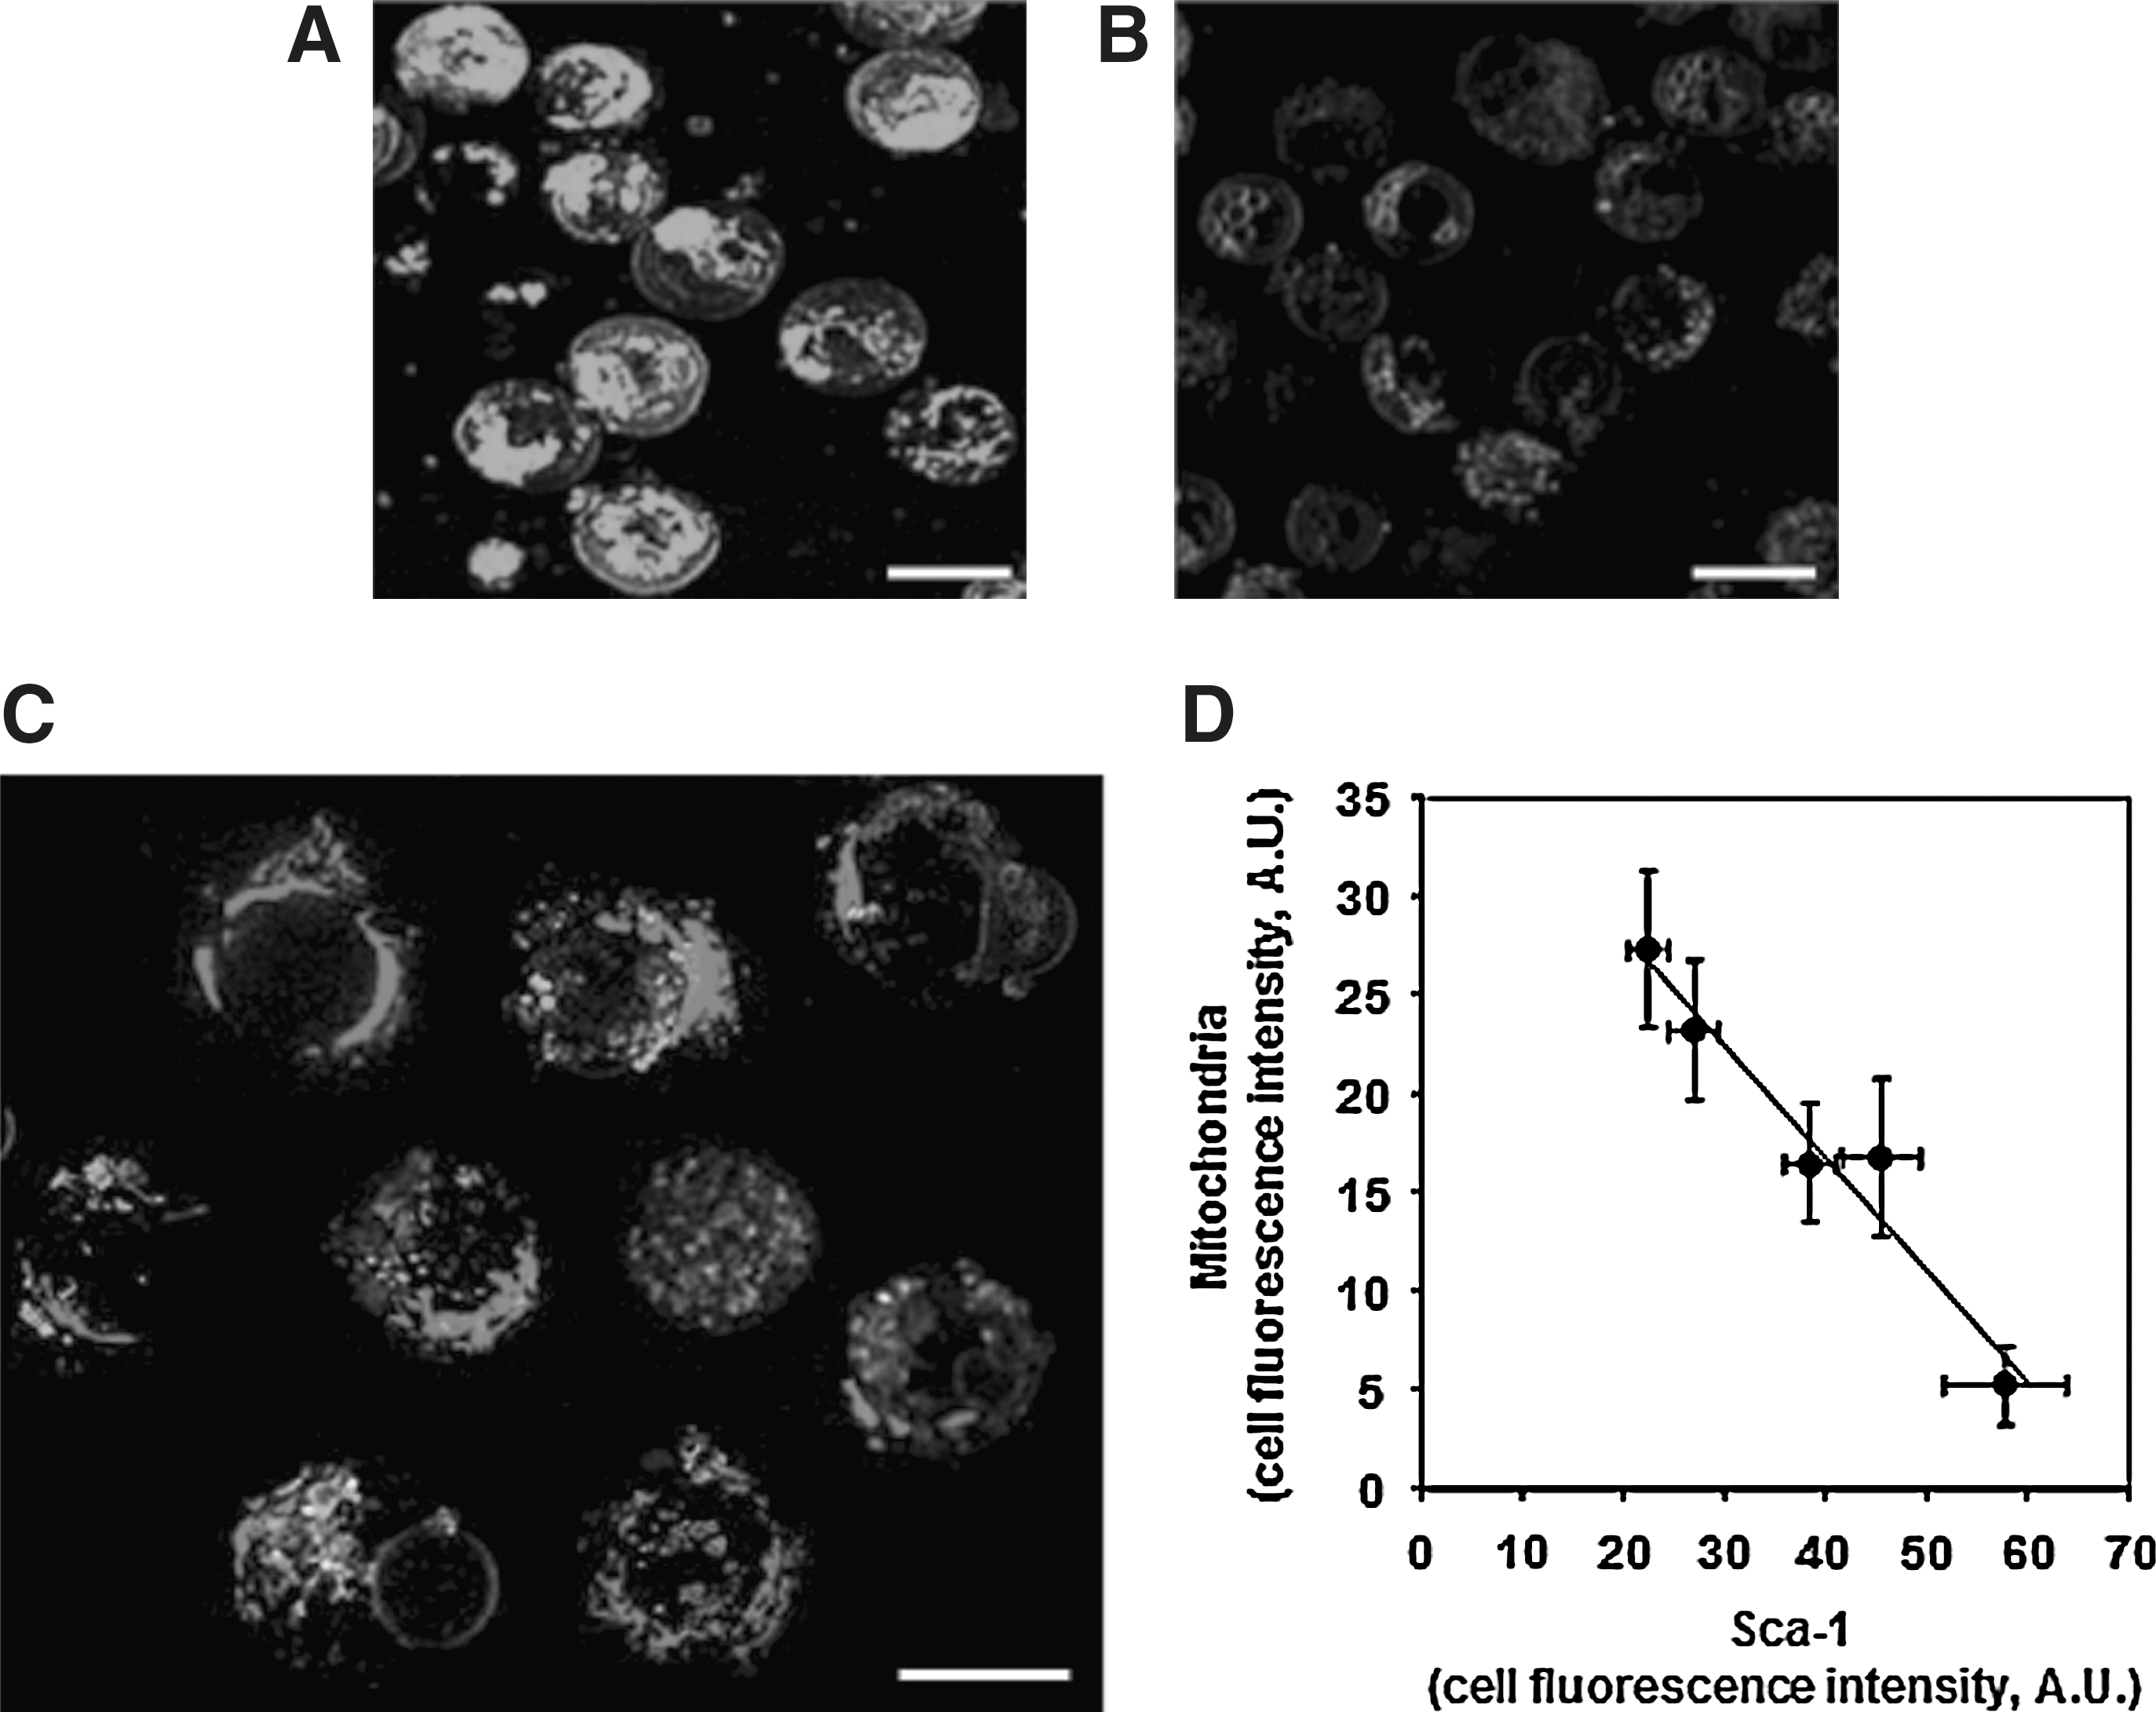
Simultaneous staining of mitochondria and Sca-1 in mouse BM-derived stem/progenitor cells isolated by positive immunoselection.
CFTR expression in positively selected Sca-1+ stem/progenitor cells
Since our ultimate goal is a cell-based therapy for CF, we tested these cells for the presence of CFTR mRNA and protein. A reverse transcription (RT)–PCR was designed to amplify either murine or human CFTR by the same set of primers (see Materials and Methods section). A specific CFTR band was detected in positive controls M1 murine macrophages and human bronchiolar epithelial 16HBE14o− cells, but not in human embryonic kidney 293 cells, that do not have endogenous CFTR expression [27], nor in HSPCs (Fig. 4A). A specific CFTR band in HSPCs was detected only after a nested PCR following the first run PCR (Fig. 4B), suggesting a very low level of CFTR expression in Sca-1+ progenitor cells. The identity of murine CFTR was confirmed by sequencing and comparison to BLAST database (
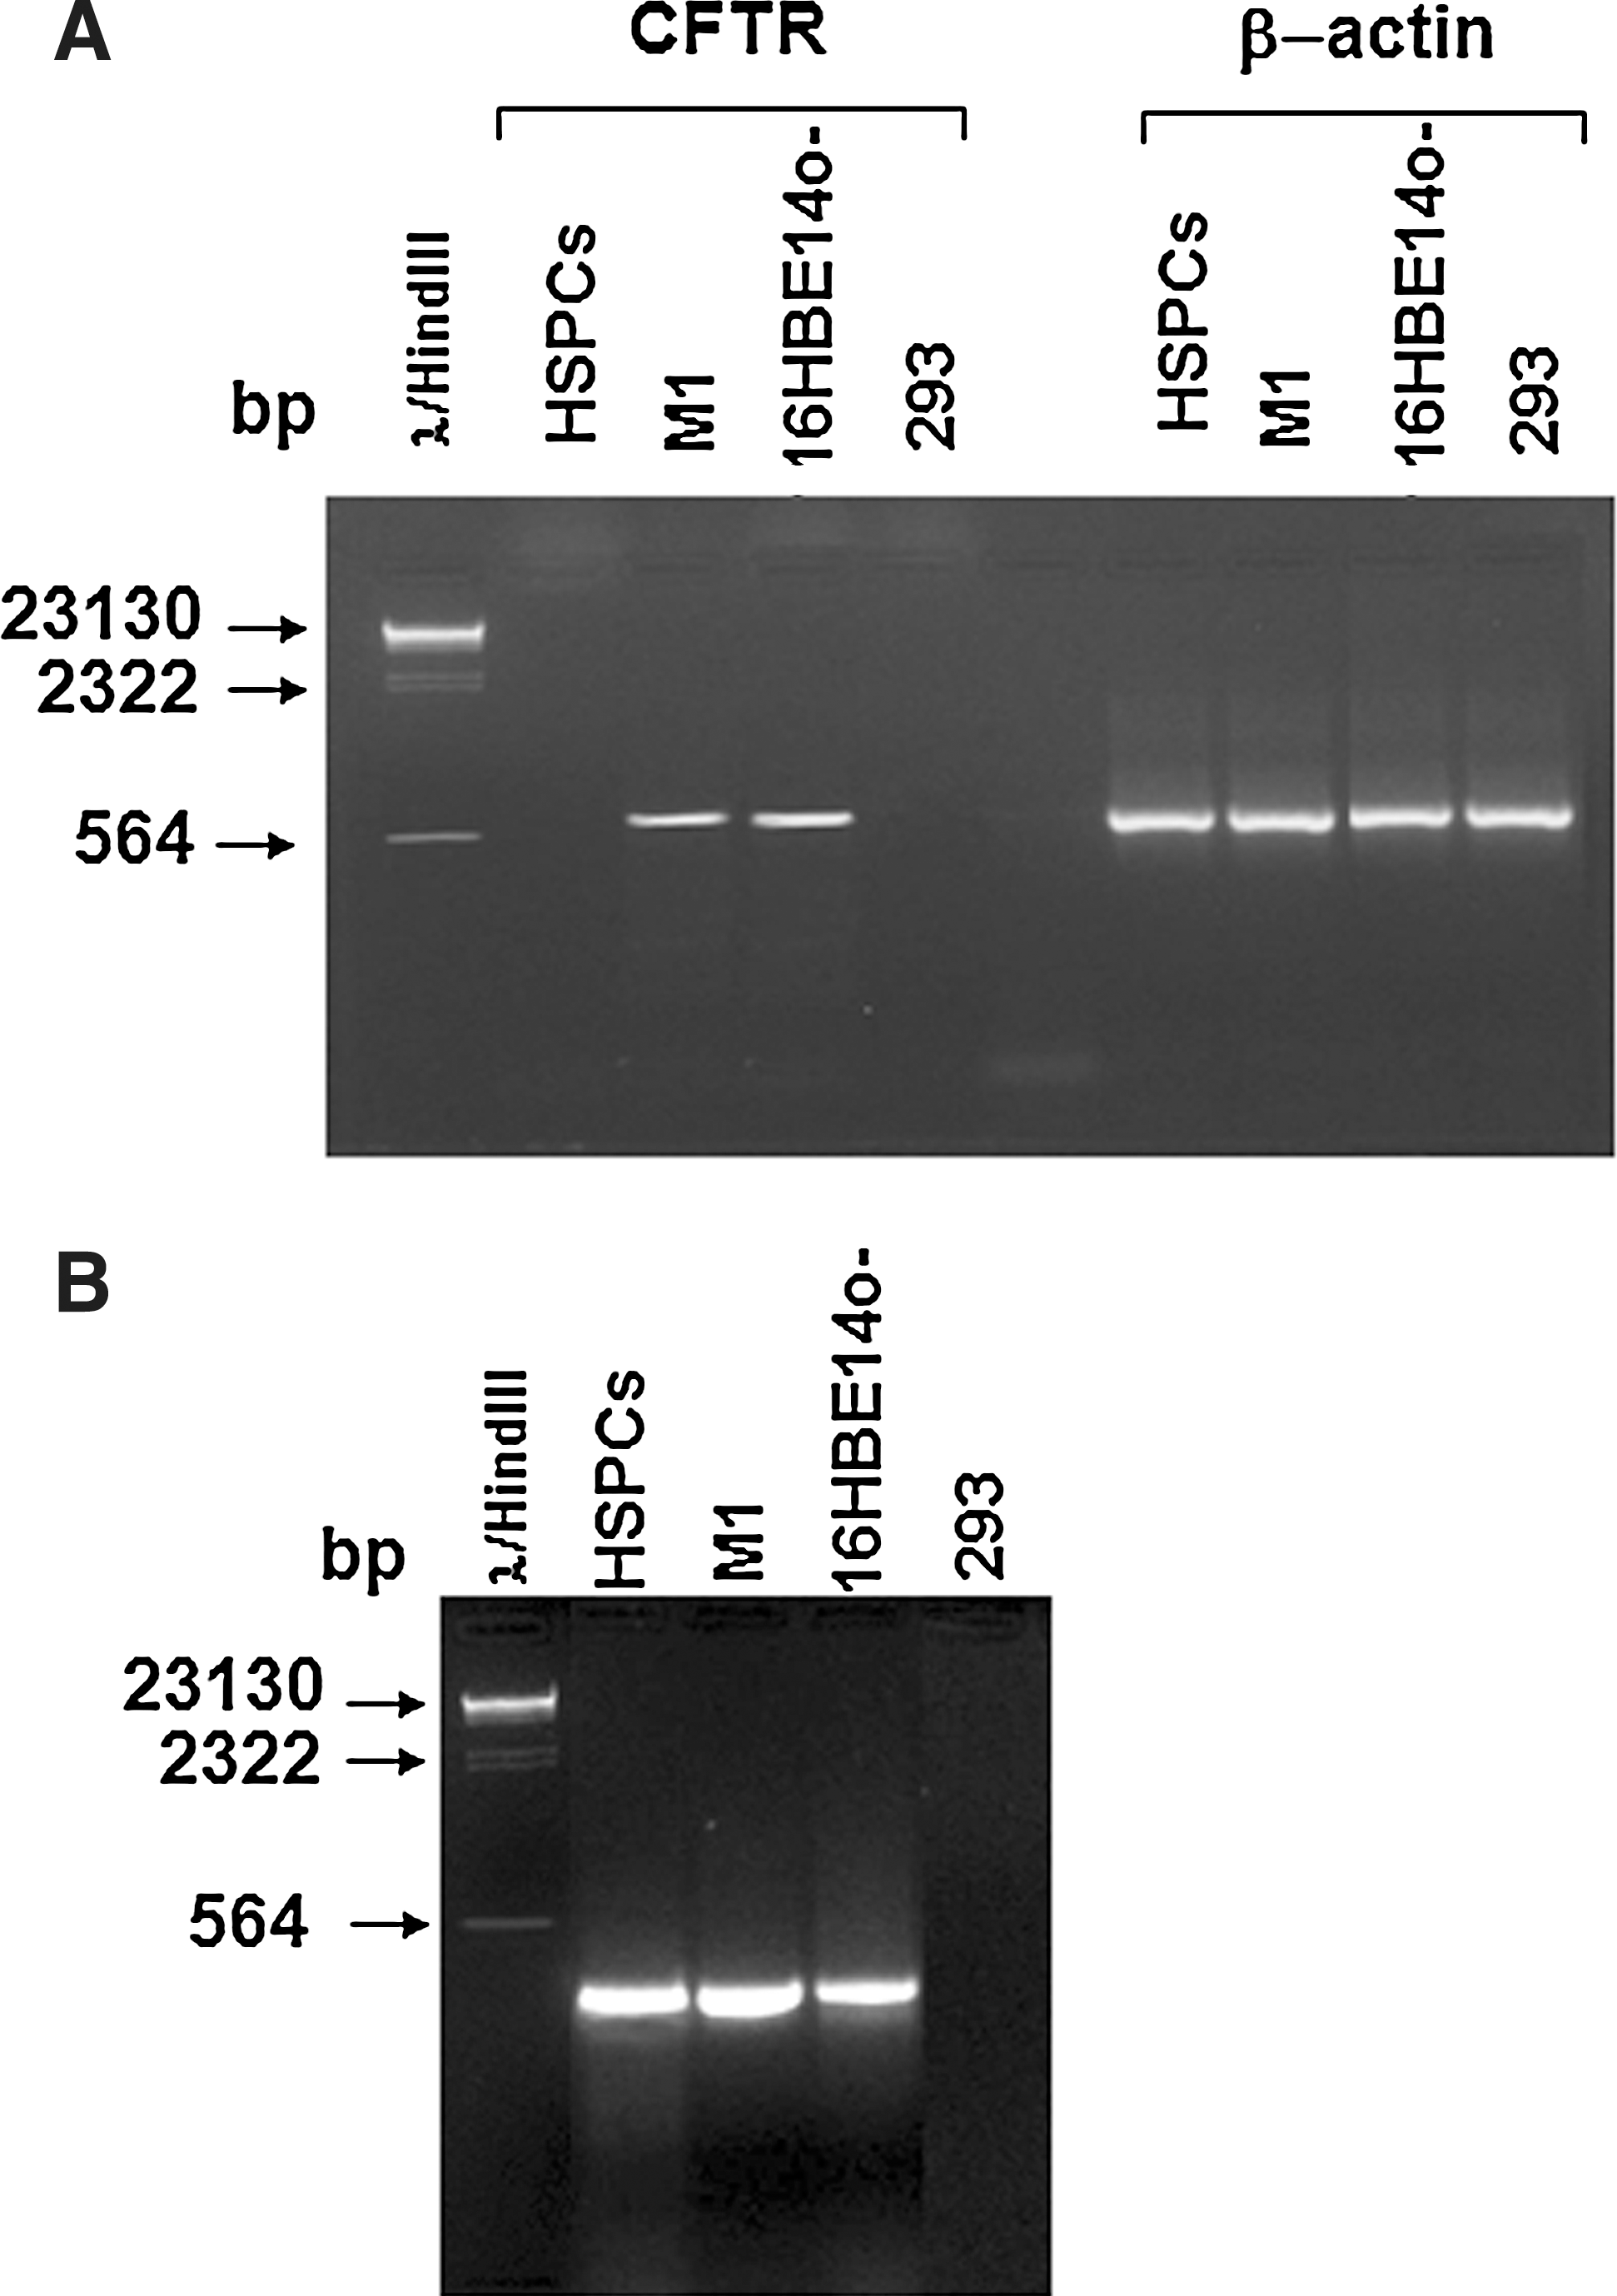
Expression of CFTR mRNA in positively selected Sca-1+ HSPCs.
The relatively low expression of CFTR was confirmed at the protein level by western blotting analysis (Fig. 5A). Two bands were immunodetected corresponding to the mature (180 kDa, band C) and the immature (160 kDa, band B) forms of CFTR, with the mature peptide being 65% less expressed than in the 16HBE14o− cells (Fig. 5A). No specific CFTR bands were detected in human embryonic kidney 293 cells. To verify the identity of bands B and C we used endoglycosidase H and N-glycosidase F. As expected, while N-glycosidase F reduced both bands B and C and increased the nonglycosylated form of CFTR (140 kDa) in both 16HBE41o− cells and HSPCs, endoglycosidase H did not exert any effect (Fig. 5B).

Expression of CFTR protein in positively selected Sca-1+ HSPCs.
CFTR function in positively selected Sca-1+ stem/progenitor cells
CFTR function in Sca-1+ cells was first assessed by means of epifluorescence and spectrofluorimetric analyses. In experiments aimed to determine if protein kinase A (PKA) activation is able to stimulate CFTR-dependent chloride efflux, we performed chloride secretion measurements in both single cells and in the entire population seeded on glass coverslips using the chloride sensitive dye MQAE, as we have previously published [21]. To fully activate CFTR channels, we used forskolin (which activates adenylate cyclase) and IBMX, which regulates CFTR function by acting both as a phosphodiesterase and protein phosphatase inhibitor [28] but also by directly interacting with the NBDs to promote ATP-dependent channel gating [29]. Figure 6A shows typical recordings obtained by video imaging analysis in 3 Sca-1+ HSPCs demonstrating changes in chloride efflux after the addition of forskolin and IBMX and the inhibition induced by the addition of the CFTR inhibitor, glibenclamide. Figure 6B shows the summary of the data collected from 12 different murine Sca-1+ cells. The third bar represents CFTR-dependent chloride efflux calculated as the difference in alterations of stimulated fluorescence in the absence (first bar) and presence (second bar) of glibenclamide.

Measurements of CFTR-dependent chloride efflux in single murine hematopoietic stem cells.
A similar pattern of inhibition was obtained using the specific inhibitor CFTRinh-172 [30] (0.0415±0.0053 Δ(F/F 0)/min vs. 0.0192±0.0018 Δ(F/F 0)/min n=3, P<0.01, respectively, in the absence and in the presence of the 5 μM CFTRinh-172).
The CFTR-dependent chloride efflux, as measured in whole HSPC population, displayed the same features of that observed in single-cell analysis. Importantly, the level of CFTR-dependent chloride efflux obtained analyzing the entire population was similar to that obtained in single cells (0.0226±0.006 Δ(F/F 0)/min, n=8 vs. 0.0193±0.009 Δ(F/F 0)/min, n=12, n.s.), confirming not only the validity of our measurements but also the homogeneity of the cell population.
In addition, we analyzed the CFTR-dependent chloride efflux in the same experimental conditions in whole cell populations of the positive control and negative control cell lines used in the RT-PCR and western blot analyses (16HBE14o− and 293 cells, respectively). We found that the CFTR-dependent chloride efflux in the 16HBE14o− cells was not significantly different from that observed in the whole HSPC population (0.026±0.003 Δ(F/F 0)/min, n=5, n.s.), whereas that in the 293 cells was not significantly different from background (0.0009±0.0006 Δ(F/F 0)/min, n=4, n.s.).
Patch clamping of HSPCs
To deepen the knowledge about the properties of the CFTR Cl− channel in HSPCs and confirm the spectrophotometric data, cell-attached patch recordings were carried out and a channel with mouse CFTR properties was observed (Fig. 7). Representative current tracings are shown in Fig. 7A before and after the addition of 10 μM forskolin and 2 μM CFTRinh-172. After forskolin exposure, the mean number of CFTR channels in a patch was 5.0±1.1 (n=7). Channels exhibited a mean slope conductance, between 0 mV and 60 mV, of 5.8±0.26 pS (n=7, Fig. 7B), and an open probability (Po) that was 0.21±0.15 (n=7) after forskolin addition at −40 mV (Fig. 7C). In particular, the channel Po was voltage-independent, increased from 0.005±0.004 (n=3) to 0.21±0.03 (n=3) 9 min after forskolin exposure, and it was zeroed 3 min after CFTRinh-172 addition. The reversal potential (E rev) was −36.2±3.1 mV, well in agreement with a value consistent with the behavior of a Cl− channel, considering the depolarized (∼−10 mV) membrane potential reported for hematopoietic cells [31]. These single-channel properties are similar to those of mouse CFTR expressed in cortical collecting duct and in CHO cells [32,33].
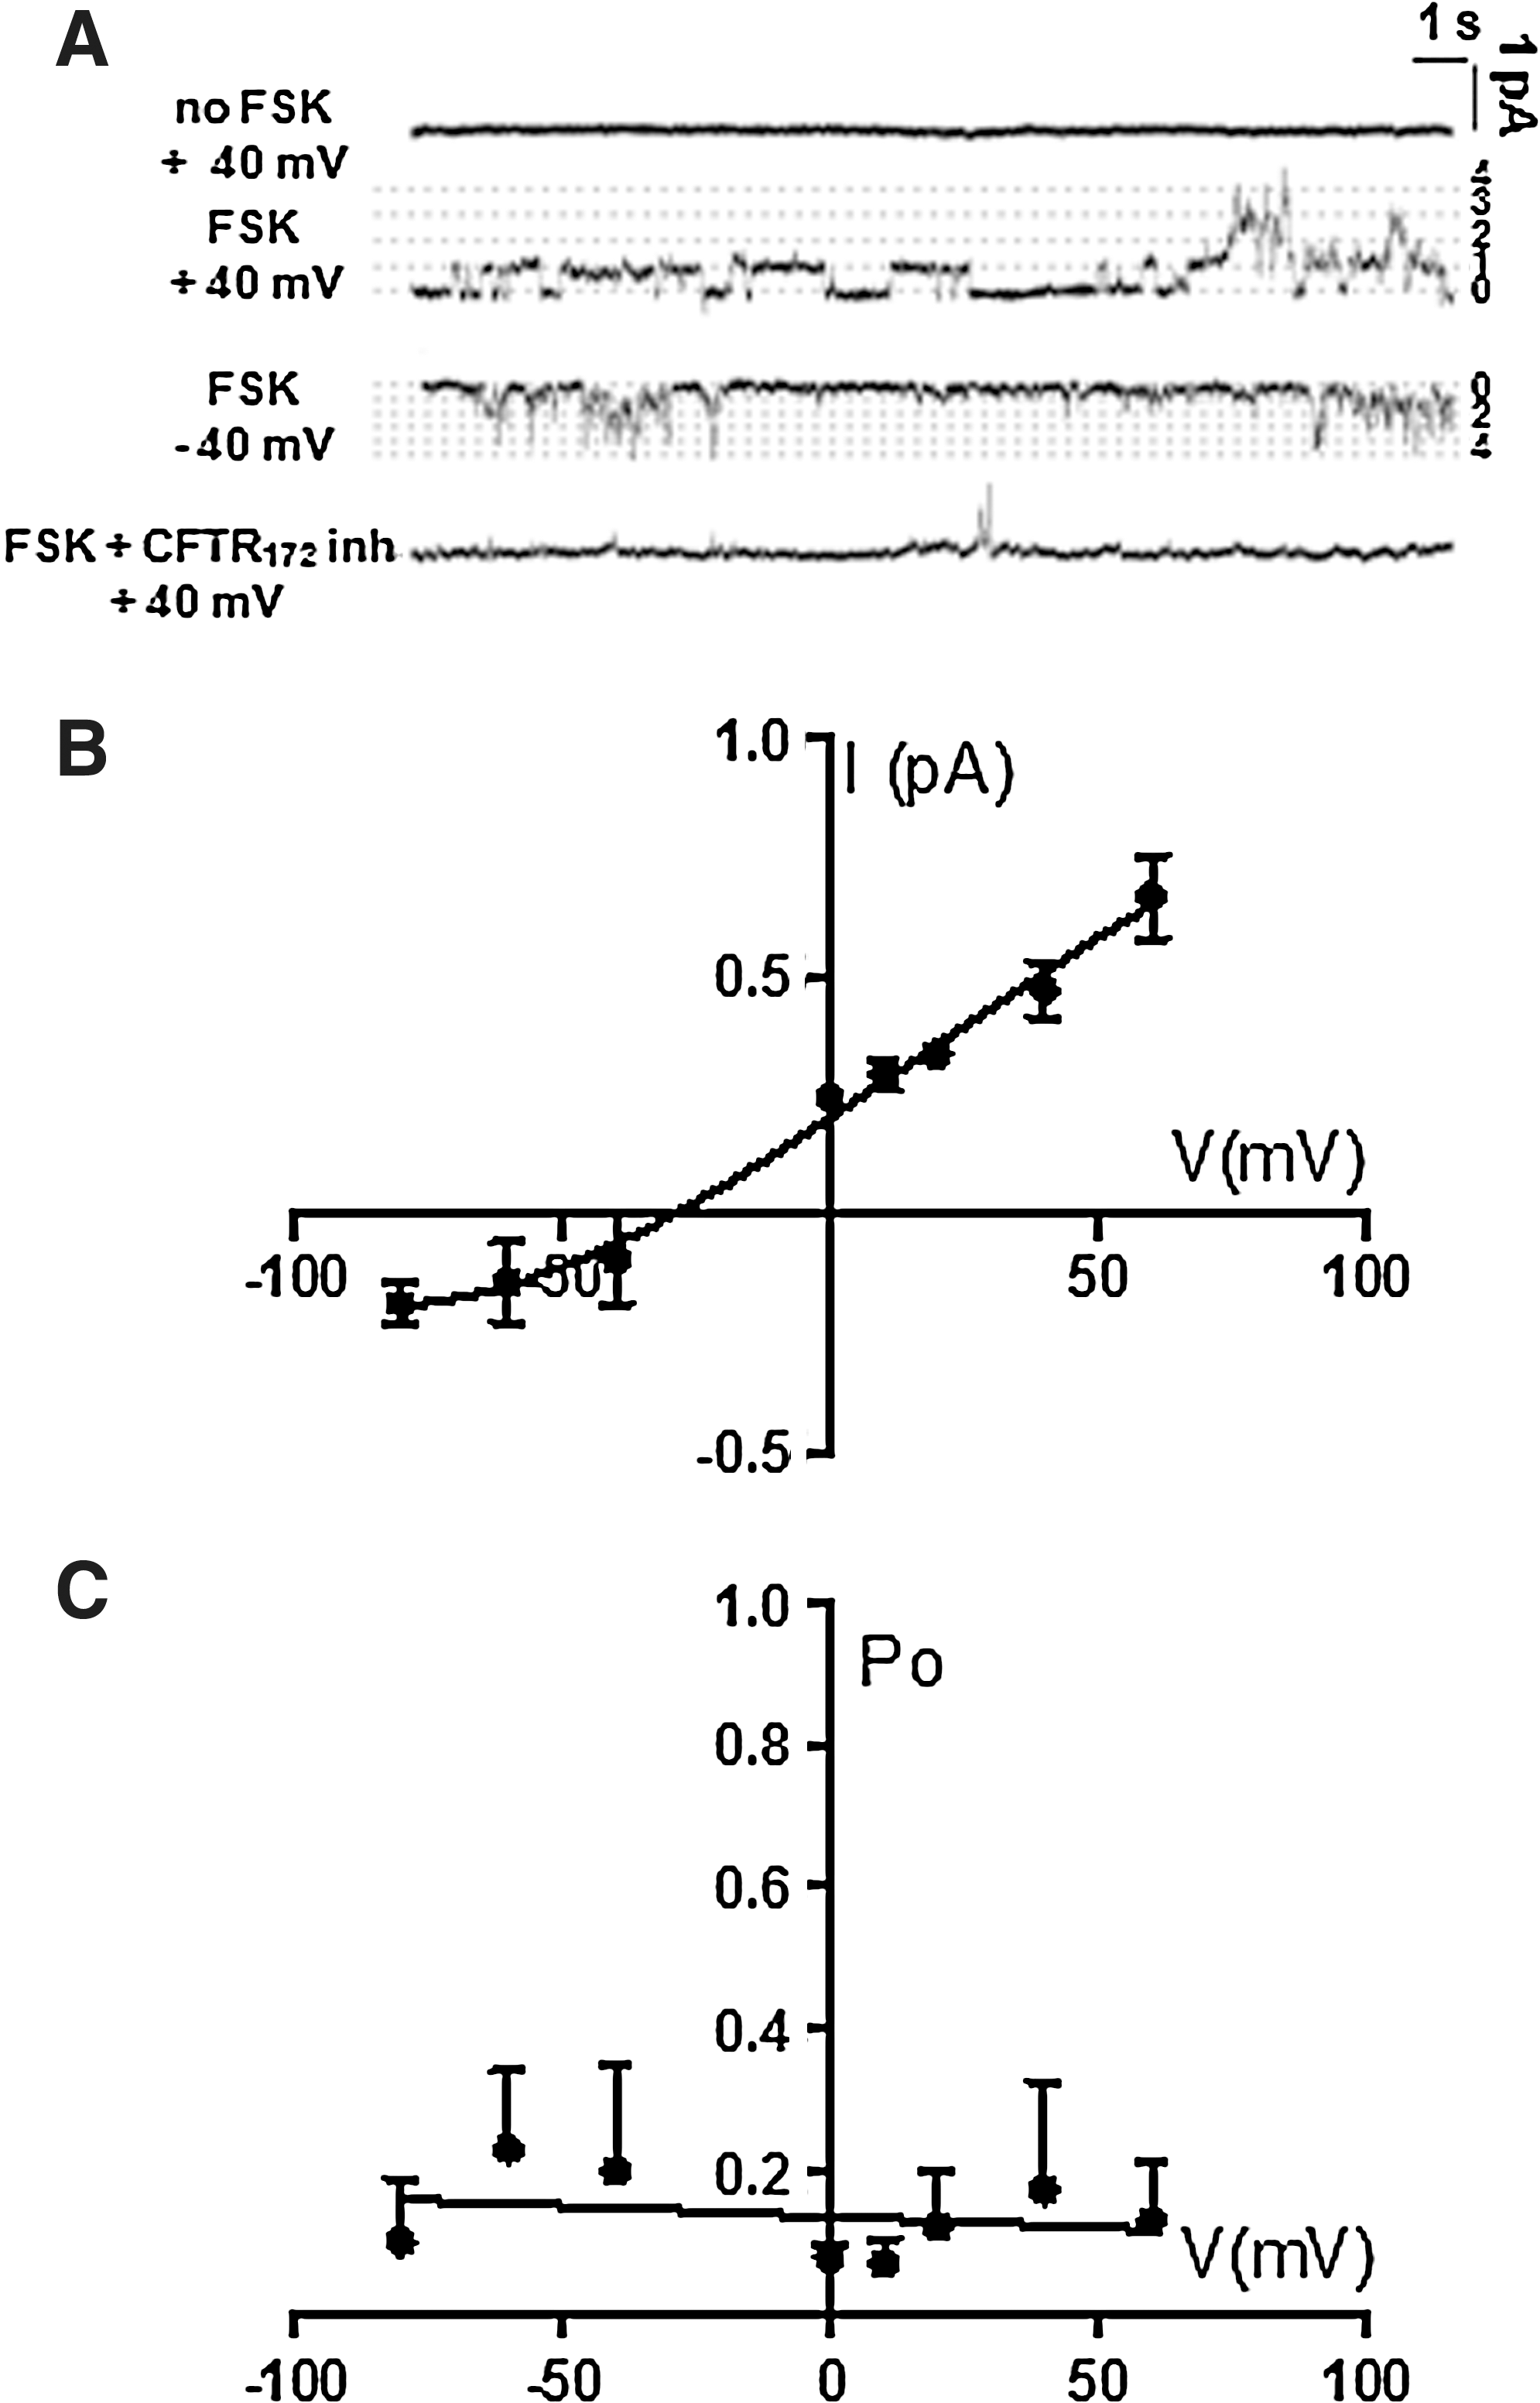
Single-channel recording showing CFTR activity in Sca-1+ selected HSPCs cells in cell-attached configuration.
CFTR channel activity is inhibited by oligomycin pretreatment
The CFTR is a phosphorylation- and nucleotide-regulated chloride channel. CFTR also directly mediates the hydrolysis of ATP and this catalytic activity is loosely coupled to CFTR channel gating [34 –37]. To investigate the functional dependence of CFTR on the cell ATP content, HSPCs were treated with oligomycin, an inhibitor of the mitochondrial F 0 F 1 ATP-synthase. Figure 8A and B shows that inhibition of the mitochondrial oxidative phosphorylation caused a 70% reduction of the intracellular ATP content and a decrease of the CFTR chloride channel activity by the same extent.

Effect of ATP intracellular depletion on CFTR chloride channel activity.
CFTR protein expression in different Sca-1+ subpopulations
To analyze the CFTR protein expression in the different subpopulations of positively selected Sca-1+ cells, an immunocytofluorimetric assay was performed. As a positive control, CFTR labeling by the mAb 25031 was assessed in normal human airway 16HBE14o− cells, resulting in 68.2%±6.30% of positive cells (Fig. 9A, B; n=6). Specificity of the anti-CFTR mAb was assayed in 293 cells, which showed a positive staining in 2.4%±0.37% (n=6; P<0.0001 as compared with 16HBE14o− by unpaired Student's t-test). The entire Sca-1+ population expressed CFTR only in 15.6%±1.91% of the cells (Fig. 9D). When subpopulations were analyzed, the biggest (R1) and the smallest (R2) expressed CFTR in 15.4%±1.36% and 11.36%±1.73% of Sca-1+ cells, respectively (Fig. 9E & F). This difference was statistically significant (P=0.01; unpaired Student's t-test).

CFTR expression in HSPC subpopulations. 16HBE14o− cells and Sca-1+ HPSCs were stained with the anti-CFTR monoclonal antibody against the C terminus of CFTR (MAB25031) and then analyzed by flow cytometry.
Discussion
Despite many efforts to isolate a pure hematopoietic progenitor cell population based on patterns of gene expression in combination with differences in cell size, density, and the uptake of fluorescence probes such as rhodamine-123, the resulting cell population remains heterogeneous [38 –45]. Our data confirm this heterogeneity in both lin− Sca-1+ and positively selected Sca-1+ murine HSPCs. In the attempt to differentiate hematopoietic progenitor cells on the basis of their phenotype and mitochondrial content profile, we identified 2 populations: a population of smaller cells with a higher percentage of Sca-1+MTGlow cells and a population of bigger cells containing a lower percentage of Sca-1+MTGhigh cells. Sca-1 (Ly-6 A/E) is a GPI-linked cell surface protein found on hematopoietic, mammary gland, lung, liver, cardiac, and mesenchymal stem cells in the mouse [46]. Sca-1 has been shown to be necessary for normal hematopoietic stem cell activity, as Sca-1 knockout mice have defects in short-term competitive transplantation and serial transplantation [47]. The homing defect of Sca-1−/− progenitor cells could be correlated to a decrease in c-kit expression, although self-renewal of Sca-1−/− hematopoietic stem cells appeared to be normal [48]. Since HSPCs loose Sca-1 upon commitment to myeloid and lymphoid progenitors [49,50], our data indicate that mitochondrial biogenesis is linked to and likely required in the first steps of stem/progenitor cell differentiation [51]. This is substantiated also by the evidence that primitive hematopoietic stem cells in the BM are sequestered in a hypoxic microenvironment [17], implying that low oxygen levels play a fundamental role in the maintenance of normal stem cell function. One of these functions could be to keep low levels of CFTR expression, as suggested by the work by Guimbellot et al. [52], who presented evidence that CFTR mRNA, protein, and function are reversibly depressed by hypoxia in human cultured cells, and that CFTR mRNA is repressed in murine and human tissues in vivo. Our data are in good agreement with Spangrude and Johnson [38], who have shown that hematopoietic stem cells with higher clonogenic capacity display low-staining with a mitochondrial fluorescent dye, rhodamine-123. This may partly be due to cell subset-specific expression of the multidrug-resistance 1a/b (MDR1a/b) gene in resting stem cells. MDR1a/b encodes P-glycoprotein, an ABC transporter that can efflux this dye [53]. However, low staining of stem/progenitor cells with TMRE could be likely due to the low energized status of mitochondria, as previously shown for human HSPCs [51]. This conclusion is supported by the low number of SP cells (0.76%), which exclude Hoechst 33342 (Supplementary Fig. 3C), an indication of cells expressing MDR1a/b [25] or, more likely, Abcg2 [54,55].
Bone marrow-derived stem cells may have the capacity to transdifferentiate and repopulate various organs. Various groups have attempted to assess if HSPCs can transdifferentiate into airway epithelium [56]. However, in reports that provided evidence of engraftment and differentiation by systemic administration of BM-derived stem cells, the frequency in airways is very low (<1%). We and others [11,16] have delivered BM cells directly (by intratracheal instillation) to the lung after lung injury in mice, with results similar to the systemic administration route. Meanwhile, engraftment studies have been made also in CF mice. Transplantation of wild-type cultured stromal marrow cells [57] or whole BM [58,59] into CF mice resulted in the engraftment of donor-derived airway epithelial cells in small numbers only (between 0.01% and 0.025%). Interestingly, Bruscia et al. [58,59] found a partial resumption of the CFTR-mediated chloride currents to wild-type levels in both gut and nose, although they could not explain this effect in face of a very low engraftment level.
It has been shown in vitro that only 6% to 20% of CFTR-expressing cells were required to restore normal levels of chloride secretory activity in an in vitro epithelium model [60,61]. However, in vitro and in vivo studies suggest that nearly every cell in the sample must be corrected with CFTR to reverse the excess activity of ENaC and possibly have a therapeutic impact on the hydration of CF lung periciliary fluid and mucus [60,62,63].
So far extensive studies testing the direct application of BM-derived stem cells to the CF lung are missing, as those using different subpopulations.
CFTR expression has already been detected in freshly isolated BM-derived stem cells. Shu et al. [64] found that mesenchymal stem cells from adult rats expressed CFTR mRNA but not protein. Wong and colleagues [65] identified 2 subpopulations in the murine BM as identified by the expression of Clara cell secretory protein (Ccsp). All Ccsp+ cells expressed CFTR, whereas most Ccsp− cells did not. Interestingly, more Ccsp+ cells were found in naphthalene-injured airway epithelium compared with Ccsp− cells when cells were delivered transtracheally to the airways [65]. It is worth mentioning that both these studies [64,65] investigated CFTR expression/function after having cultured HSPCs on permeable filters that allow their transformation into epithelial cells and both found that CFTR was not functional, whereas our data show that CFTR is active on freshly isolated HSPCs. Overall, these results would imply that in vitro compartmentalized culture conditions do not give raise to a well-differentiated epithelia with specialized function such as ion transport. The limit of our study is that the difference of functional CFTR expression between the biggest and the smallest subpopulations was not investigated. Future studies will be focused on sorting the 2 populations and assaying their capacity to becoming blood cells or airway epithelial cells.
Using the same techniques of this article, we previously showed that also mouse embryonic stem cells show CFTR channel activity mediating a measurable chloride efflux [22]. Further, the CFTR channel properties measured here resemble those observed in differentiated epithelial cells [33], as shown by patch-clamp experiments. In both hematopoietic and embryonic stem cells, the extent of chloride efflux is similar to that found in respiratory epithelial cells [21]. Little is known about the relationship between CFTR gene expression and the corresponding transport of chloride. Endogenous CFTR mRNA appears to be expressed at very low level. Apparently, 1 to 2 transcripts/cell [61,66] can result in several hundred CFTR channels/cell, thereby suggesting that low levels of wt CFTR mRNA expression may be sufficient to determine normal function. Thus, although HSPCs show lower levels of mRNA and protein than 16HBE14o− cells, they display a CFTR-dependent chloride efflux similar to bronchial epithelial cells.
In HSPCs, oligomycin pretreatment determined a decrease in both ATP intracellular levels and CFTR chloride channel activity, indicating that CFTR is strictly dependent on mitochondrial ATP synthase activity to be fully functional. Whether this mitochondrial ATP is required for hydrolytic or nonhydrolytic gating of CFTR, or for activation of CFTR by PKA, deserves further investigation. Our finding sounds quite surprising given the generally accepted view that HSPCs rely for their energetic demand mainly on glycolytic ATP production and highlights the need to re-evaluate the role of mitochondrial bioenergetics in the stem cell homeostasis, as recently reported [67].
In a recent study, Adams et al. showed that HSPCs depend on the Gas-mediated signaling to engraft BM [68]. HSPCs from adult Gas −/− mice were able to undergo differentiation and chemotaxis but failed to engraft. Interestingly, if deleted after engraftment Gas deficiency did not affect HSPCs retention but impaired cytokine-induced mobilization in the blood. In keeping with the notion that activation of CFTR is accomplished by cAMP-mediated phosphorylation of its regulatory domain [69], this latest report would warrant further investigation on the role of CFTR in the stem cell biology.
The occurrence of an active CFTR to such degree in HSPCs makes them potentially suitable for the treatment of the CF lung disease by means of BM transplantation. It might well be that the functional heterogeneity of subpopulations identified in this work is reflected also by the different capacity of progenitor/stem cells to home to epithelia-lined organs and transform into epithelial cells, as it has been previously demonstrated [65]. It will undoubtedly be interesting to see which of the 2 subpopulations is the more efficient in this setup.
While BM transplantation remains a possible future treatment modality for CF, there are major impediments to its widespread use, namely, the complications of heterologous transplant, the low engraftment rate of HSPCs, and the small change in functional CFTR in the lungs. At the same, other potential cures appear to be closer to clinical use then gene or cell therapy. Three drug-based approaches are supposed to give clinical benefit and are being validated in ongoing clinical trials [70]: (i) correctors, which are compounds that promote trafficking of the mutant CFTR to the membrane; (ii) potentiators, which promote activity of an already CFTR inserted in the membrane; (iii) agonists of P2Y(2) receptors that activated alternative chloride channels by increasing calcium.
In conclusion, these results show that BM-derived stem/progenitor cells do not have a homogeneous mitochondrial content, which may influence their capacity to migrate to a damaged tissue. CFTR function in these cells is dependent on mitochondrial ATP synthesis, and CFTR protein is expressed at a higher level by less primitive cells. Although CFTR may be envisioned as a HSPC differentiation marker, further studies will elucidate how CFTR expression is related to the differentiation state and energetic metabolism in HSPCs.
Footnotes
Acknowledgments
We greatly appreciate the gift of 16HBE14o− cells from professor D. Gruenert (California Pacific Medical Center Research Institute, University of California at San Francisco). We thank professor Maurizio Margaglione, who helped us with sequencing. This work was supported by a grant (FFC No. 2/2006) from the Italian Cystic Fibrosis Foundation. We thank Stephan J. Reshkin for critically reading this article.
Author Disclosure Statement
No competing financial interests exist.
References
Supplementary Material
Please find the following supplemental material available below.
For Open Access articles published under a Creative Commons License, all supplemental material carries the same license as the article it is associated with.
For non-Open Access articles published, all supplemental material carries a non-exclusive license, and permission requests for re-use of supplemental material or any part of supplemental material shall be sent directly to the copyright owner as specified in the copyright notice associated with the article.