
Abstract
Even before the first appearance of the developing pancreas, glucose is the major substrate in the growing embryo. The transport of glucose across cell membranes is facilitated by a family of membranal glucose transporters (GLUT). We analyzed changes in expression of class 1 glucose transporters (GLUT1–4) during human embryonic stem cell (hESC) and human induced pluripotent stem cell (hiPSC) differentiation, from undifferentiated cells to 28-day-old embryoid bodies (EBs). We also examined the potential use of GLUT2 as a marker for differentiating pancreatic progenitor cells. Using quantitative real time polymerase chain reaction (qPCR), western blot, and immunofluorescence, we observed enhanced expression of GLUT1 and GLUT2 during differentiation, but only minor change in GLUT3 expression. GLUT4 expression was found to be very low both at the RNA and in the protein levels. Expression of the early pancreatic transcription factor, pancreatic duodenal homeobox gene 1 (PDX1), correlated with GLUT2 expression, suggesting the potential use of GLUT2 as a surface marker for tracking pancreatic precursor cells. After sorting EBs according to their membranal GLUT2 expression, GLUT2 and PDX1 expression were found elevated, as was expression of other endodermal markers such as PAX4, NGN3, CXCR4, and SOX17. This simple method may be used to differentiate embryonic stem cells and to isolate from them, using GLUT2 as a surface marker, an enriched pancreatic progenitor cell population in order to achieve insulin-producing cells. The sorted GLUT2 cells may potentially be used in the future as insulin-producing cells for beta cell therapies.
Introduction
G
Glucose transporter expression in mammalian embryos is diverse, reflecting the importance of glucose as the major metabolic energy substrate. Glucose uptake is mediated by a family of facilitative glucose transporters (GLUT). Together they afford efficient, stage- and cell-specific glucose uptake and utilization. The 14 GLUT isoforms share a common structure, exhibited by a high degree of sequence homology. However, they differ in their tissue-specific expression pattern and in characteristics such as alternative splicing, specific (sub) cellular localization, and affinities for a spectrum of substrates [1]. The class 1 facilitative transporters, comprised of GLUT1–GLUT4, are the most abundant transporters, and as such, their structure, function, and tissue distribution has been extensively characterized [1].
GLUT1 is expressed ubiquitously in many tissues and throughout the embryonic period, from the 1-cell zygote to the blastocyst stage. This GLUT isoform is considered responsible for basal glucose uptake.
GLUT2 is expressed primarily in the pancreatic beta cells, liver, and kidneys. The capability of beta cells to release insulin in response to changes in glucose concentration is dependent, in part, on the presence of GLUT2 transporters in the cell membrane. GLUT2 has a particularly low affinity for glucose, as expressed by high Km (Michaelis–Menten kinetics), thus ensuring rapid equilibration of glucose between the extracellular space and the cell cytosol at all physiological and diabetes-associated glycemic conditions [2]. It has been suggested that beta cells arise from GLUT2-expressing epithelial cells in the developing rat pancreas [3]. In addition, GLUT2 positive cells may be responsible for the differentiation into islets of some of the beta cells generated after injury [4].
With its high affinity for glucose, GLUT3 has the highest turnover number of the GLUT isoforms. In the embryo, GLUT3 is expressed in the mRNA level at the late 4-cell stage and in the protein level first at the late 8-cell early morula stage. It is most clearly seen at the late morula stage on the apical surface of the polarized outer cells, and finally in the blastocyst stage on the apical surface of the trophectoderm [5, 6].
GLUT4, expressed in adipose and muscle tissues, is largely sequestered in intracellular compartments in the basal state and is translocated from an intracellular storage compartment to the cell membrane in response to insulin [7].
Human embryonic stem cells (hESCs) and human induced pluripotent stem hiPSCs provide an experimental model for analyzing embryonic development that is not possible in human embryos. Embryonic stem cells are undifferentiated cells isolated from the inner cell mass of the blastocyst. In recent years, hiPSCs cells have been successfully derived using a combination of transcription factors and cell sources [8]. Similar to hESCs, hiPSCs are capable of developing into all 3 primary germ layers [8 –10]. In the future, hESC or hiPSCs may be used in transplant therapy to rectify diseases, including transplantation of beta cells to treat type 1 diabetes.
In the current study, hESCs and hiPSCs provided an experimental model for analyzing GLUT expression, glucose uptake during early cell differentiation, and the effect of reduced glucose concentration on GLUT isoforms. After discovering that GLUT2 and the early pancreatic transcription factor, pancreatic duodenal homeobox gene 1 (PDX1) co-express during embryonic development, we investigated the possibility that GLUT2 may serve as a surface marker for beta-cell differentiation.
Materials and Methods
Cell culture
The hESC lines H9.2 [11] and I3 [9] and foreskin-derived iPSC line [8,12] were used. Undifferentiated cells were grown on mitotically inactivated mouse embryonic fibroblasts (MEF) in 80% Dulbeco's modified Eagle's medium (DMEM)/F12 medium (Biological Industries), 20% knockout serum replacement, 1 mM GLUTamx, 1% nonessential amino acid, 0.1 mM 2-mercaptoethanol, and 4 ng/mL basic fibroblast growth factor (bFGF) (all from Gibco Invitrogen). The cells were then dissociated by applying 1 mg/mL type 4 collagenase (Worthington Biochemical Corporation). One hour later, they were transferred into plastic petri dishes (Miniplast) to allow aggregation. The resultant embryoid bodies (EBs) were cultured in 80% DMEM, 20% knockout serum replacement, 1 mM Glutamax, 1% nonessential amino acid (Gibco Invitrogen), with a change of medium every 3 days. EB medium with low glucose concentration was the same as the EB medium described above, except for the dilution of DMEM medium by 1:5 in DMEM without glucose.
Fluorescent-activated cell sorting and magnetic-activated cell sorting
Two days prior to sorting, 12-day-old EBs were plated at a density of 300 EBs per well in 6-well culture plastic plates in DMEM and supplemented with 20% fetal bovine serum (FBS), 1 mM Glutamax, and 1% nonessential amino acid. To prepare for sorting, the cells were dissociated by applying 0.5 mL of TrypLE Select (Invitrogen) to each well for 15 min at 37°C. The cells were collected and centrifuged at 1,000 g for 5 min, washed once with phosphate-buffered saline (PBS), and blocked in 1% bovine serum albumin (BSA) for 15 min. After 2 additional washings in PBS, single cells were obtained by passing through a 40-micron mesh, followed by antibody straining with GLUT2 (R&D) for 30 min at 4°C, and for 15 min with secondary antibody [goat anti mouse fluorescence isothiocyanate (FITC) (Chemicon) or goat anti mouse immunoglobulin G (IgG) microbeads (Miltenyi Biotec) for fluorescent-activated cell sorting (FACS) or magnetic-activated cell sorting (MACS), respectively].
For FACS analysis and sorting, the cell pellet (as described above) was incubated in buffer containing: PBS, 0.5% BSA, and 25 mM Hepes. The cells were separated using the FACS Aria system (BD Biosciences). For MACS the cells were incubated with PBS, 0.5% BSA, and 2mM EDTA, and separated according to the manufacturer's instructions. The experiments were repeated at least 3 times for each cell line.
For FACS analysis hESCs and 7- to 28-day-old EBs were dissociated with TrypLE select (Invitrogen) as described and incubated with either GLUT1, GLUT2, GLUT3 or GLUT4 antibodies (Table 1), for 30 min at 4°C, followed by 15 min incubation with secondary antibody Donkey anti mouse indocarbocyanine (Cy3) for GLUT2 or donkey anti rabbit Cy3 for GLUT1, GLUT3 and GLUT4.
Secondary antibodies: Donkey anti goat indocarbocyanine (Cy3), donkey anti mouse Cy3, donkey anti rabbit Cy3 (all from Jackson Laboratories), goat anti mouse fluorescence isothiocyanate (FITC) (Chemicon). The conjugated antibodies were used as secondary antibodies and diluted 1:100.
Quantitative real time PCR
Total RNA from sorted and unsorted cells were isolated using the RNeasy kit (Qiagen). cDNA was synthesized using SuperScript II reverse transcriptase (Invitrogen) according to the manufacturer's instructions. Real-time PCR reactions were performed in triplicate with SYBR Green quantitative real time PCR (qPCR) and normalized by the internal endogenous GAPDH gene expression. The reaction was performed in an ABI Prism 7000 (Applied Biosystems) with Supermix-UDG with ROX (Invitrogen) using primer sets listed in Table 2. Analysis was conducted using relative quantification study in the Sequence Detection Software (V.1.2; Applied Biosystems). All experiments were repeated at least 3 times.
Immunofluorescence
EBs were seeded on 13-mm glass cover slides in 6-well culture plates. Forty-eight hours after seeding, cells were fixed for 20 min in 4% paraformaldehyde in PBS, permeablized using 0.5% Triton X-100 in PBS/1% serum, and incubated overnight with the primary antibodies (Table 1). After rinsing, secondary antibodies were added (1:100) to the samples, which were then incubated for an additional hour. Finally, the cells were rinsed once more and their nuclei stained with TO-PRO-3 iodide 1:500 (Molecular Probes). The cells were then mounted with mounting media (Dako). The slides were analyzed using confocal microscopy (Bio-Rad MRC 1024).
Protein isolation and western blot analysis
Undifferentiated hESCs and EBs from day 7 to 28 were lysed using lysis buffer [13). Lysates were centrifuged at 10,000 g for 10 min, and the supernatant (cytosol) was stored at −70°C for protein quantification and western blot analysis as previously described [14]. The antibodies used are listed in Table 1.
Cellular 2-deoxyglucose uptake
Undifferentiated H9.2 cells or 10-day-old EBs were seeded in 12-well plates (1×10⁶ cells/well) and cultured for 48 h. The rates of 2-deoxyglucose uptake after cells were incubated in Krebs-Ringer phosphate buffer (pH 7.4) in either the absence (basal state) or presence (insulin-stimulated state) of 100 nM insulin for 30 min at 25°C, followed by the addition of 2-deoxy-D-2,6-3H-glucose (Dupont NEN) to a final concentration of 0.1 mM (1 μCi/mL) for an additional 5 min at 25° C. Nonspecific 2-deoxyglucose uptake was measured in the presence of 20 μM cytochalasin B (Sigma) and was subtracted from each value to obtain specific uptake rates.
Statistical Analysis
Data are presented as mean±standard deviation of 3 separated experiments. Data were analyzed using Student's t-test. Significance was taken as *P<0.05, **P<0.005.
Results
Differential expression of GLUT1–4 isoforms during hESC differentiation
We used hESCs, foreskin-derived iPSC line and spontaneously differentiated EBs from the different lines to investigate GLUT 1–4 expression during differentiation of early embryonic stem cells. The expression of the glucose transporters was examined during the course of 28 days of differentiation of hESCs to EBs using western analysis, immunofluorescence, FACS analysis and qPCR (Figs. 1A–C and 2C).
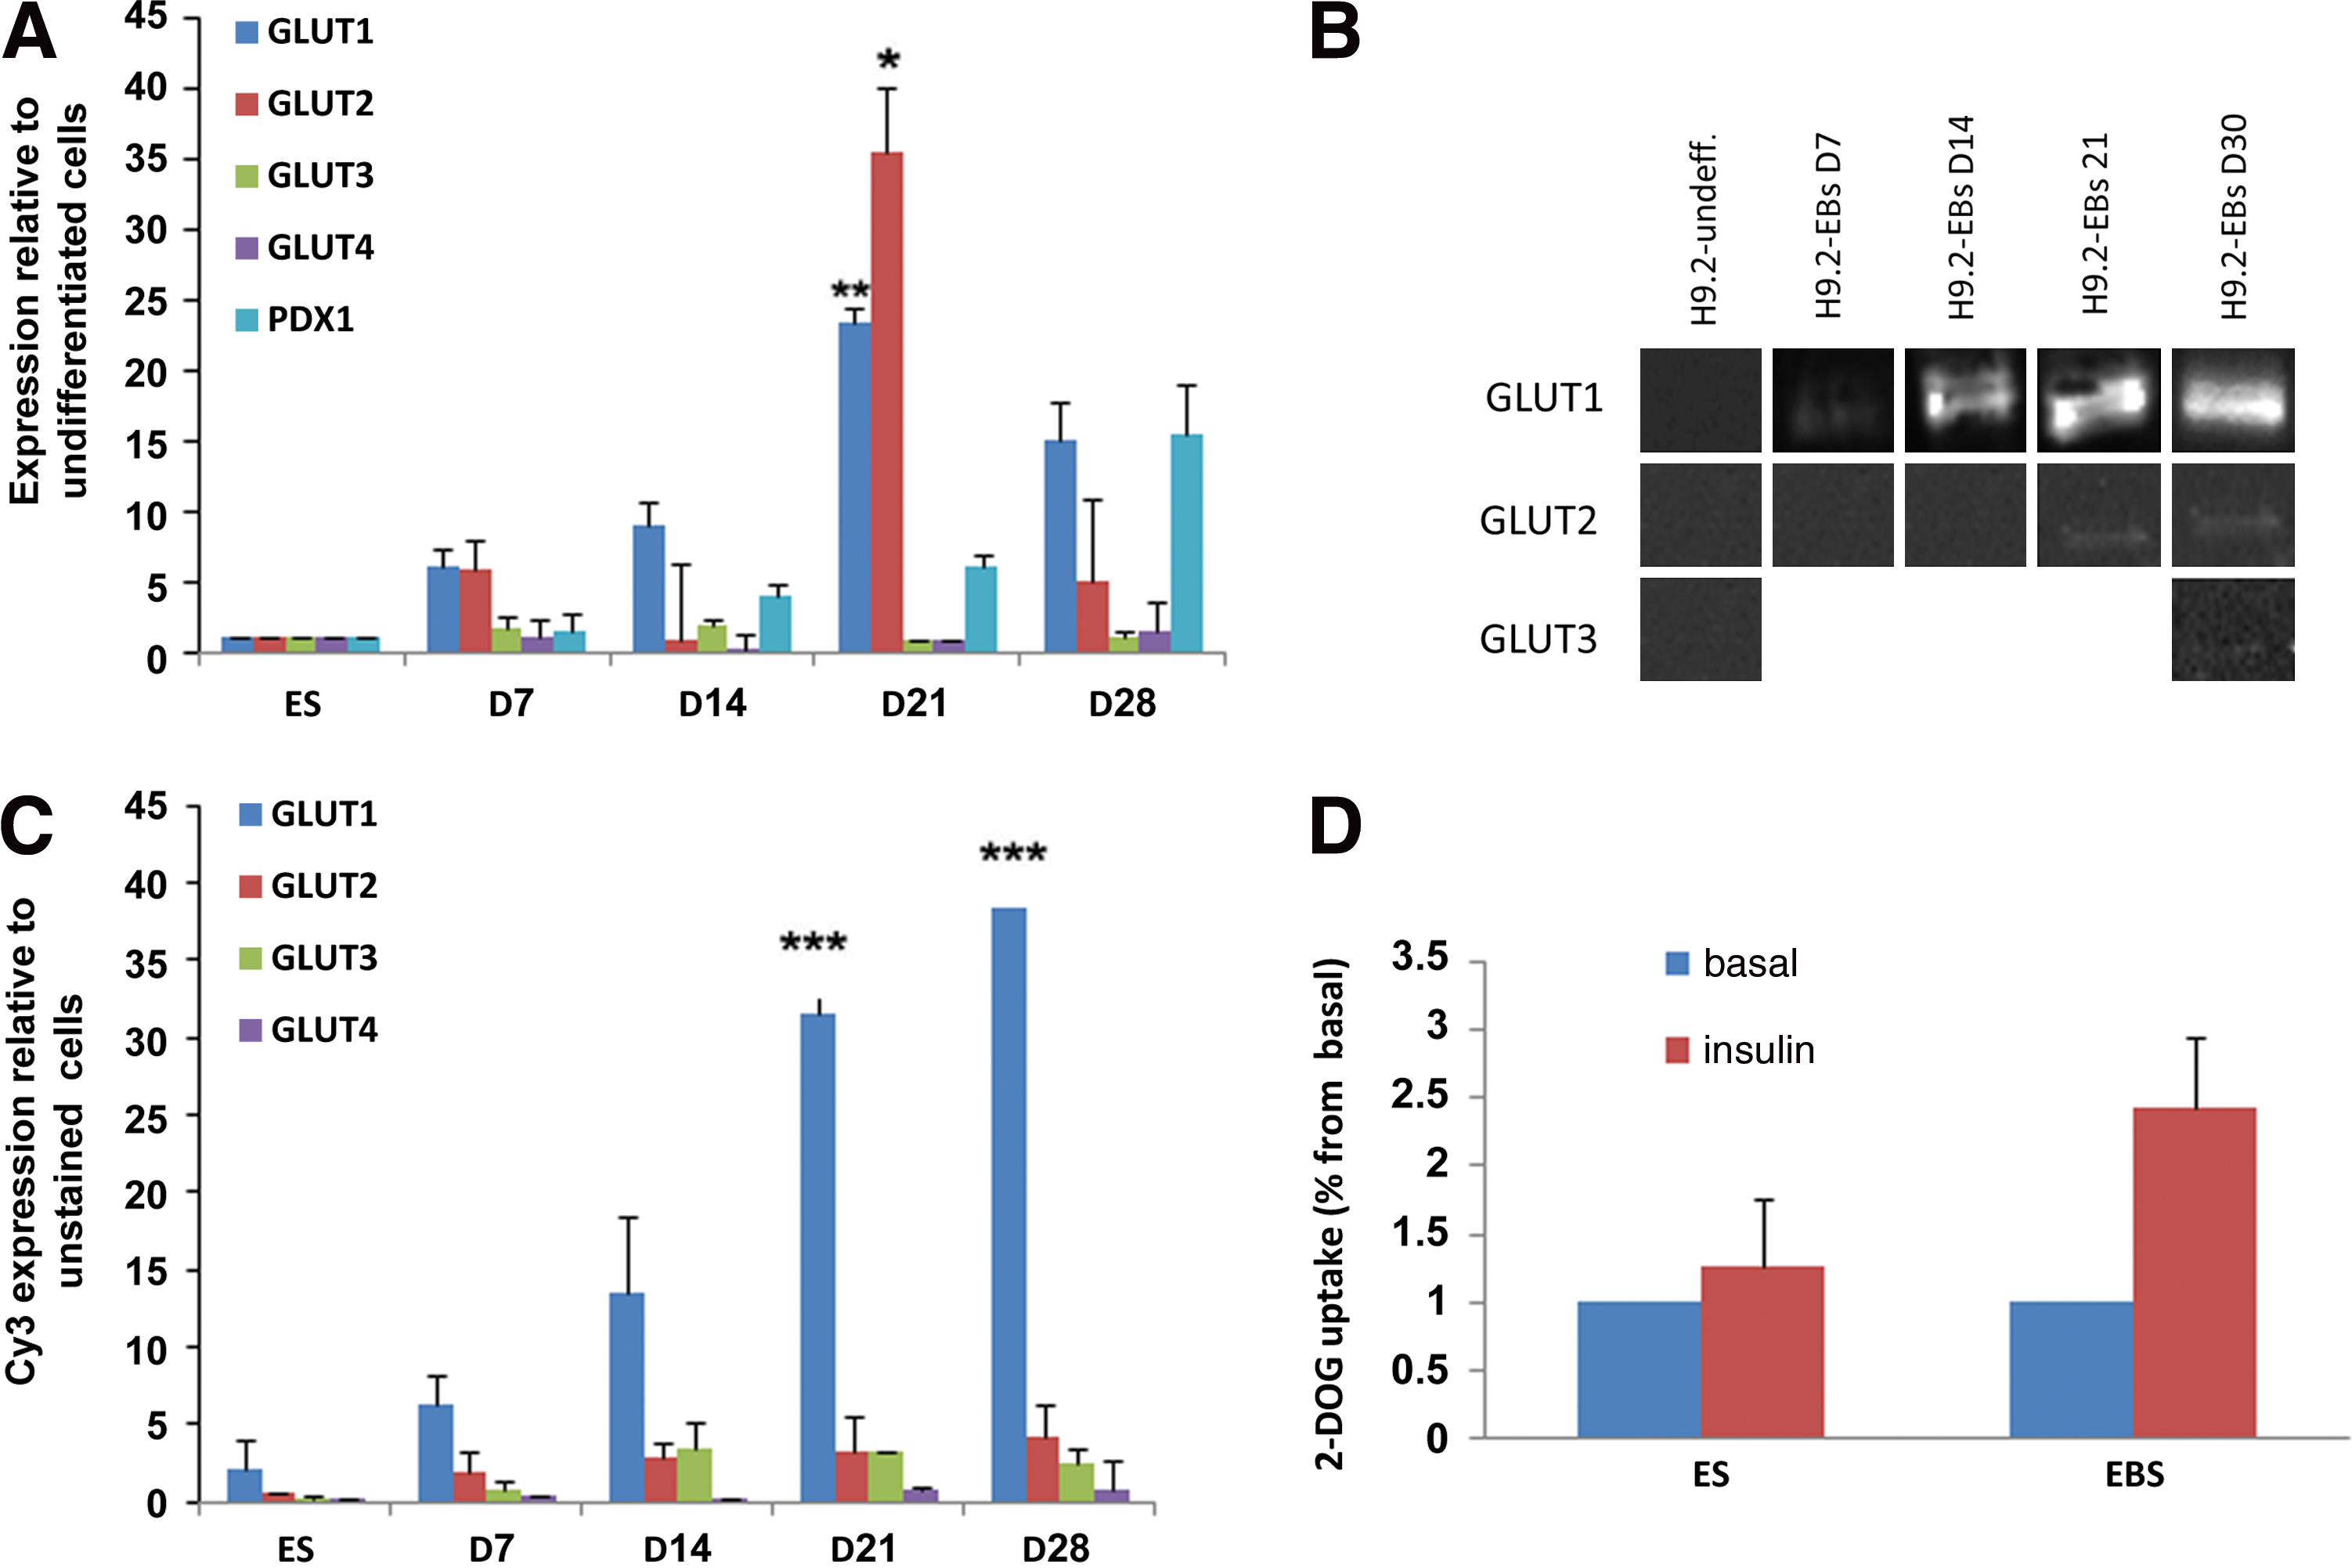
GLUT1 and GLUT2 expression increased with time. While the RNA level expression reached its peak at day 21(Fig. 1A), in the protein level, maximum expression was observed only at day 28 (Fig. 1B–C).
GLUT3 RNA showed low expression throughout the period with a slight increased expression in 7- to 14-day-old EBS. (Fig. 1A).Using FACS analysis, GLUT3 protein was detected in low levels in EBs from day 7 and on (Fig. 1C), but in western blot in 28-day-old EBs only (Fig. 1B) (probably due the higher sensitivity of the FACS analysis technique).
GLUT4 RNA was expressed in very low levels as detected by qPCR (Fig. 1A), while GLUT4 protein was detected in low levels using FACS analysis (Fig. 1C), but not in the western blot.
Comparison of the expression of GLUT isoforms to PDX1 revealed increased expression of both GLUT2 and PDX1 in EBs starting at day 7. But while GLUT1 and GLUT2 RNA expression peaked at day 21, PDX1 expression increased reaching maximum expression at day 28 (Fig. 1A).
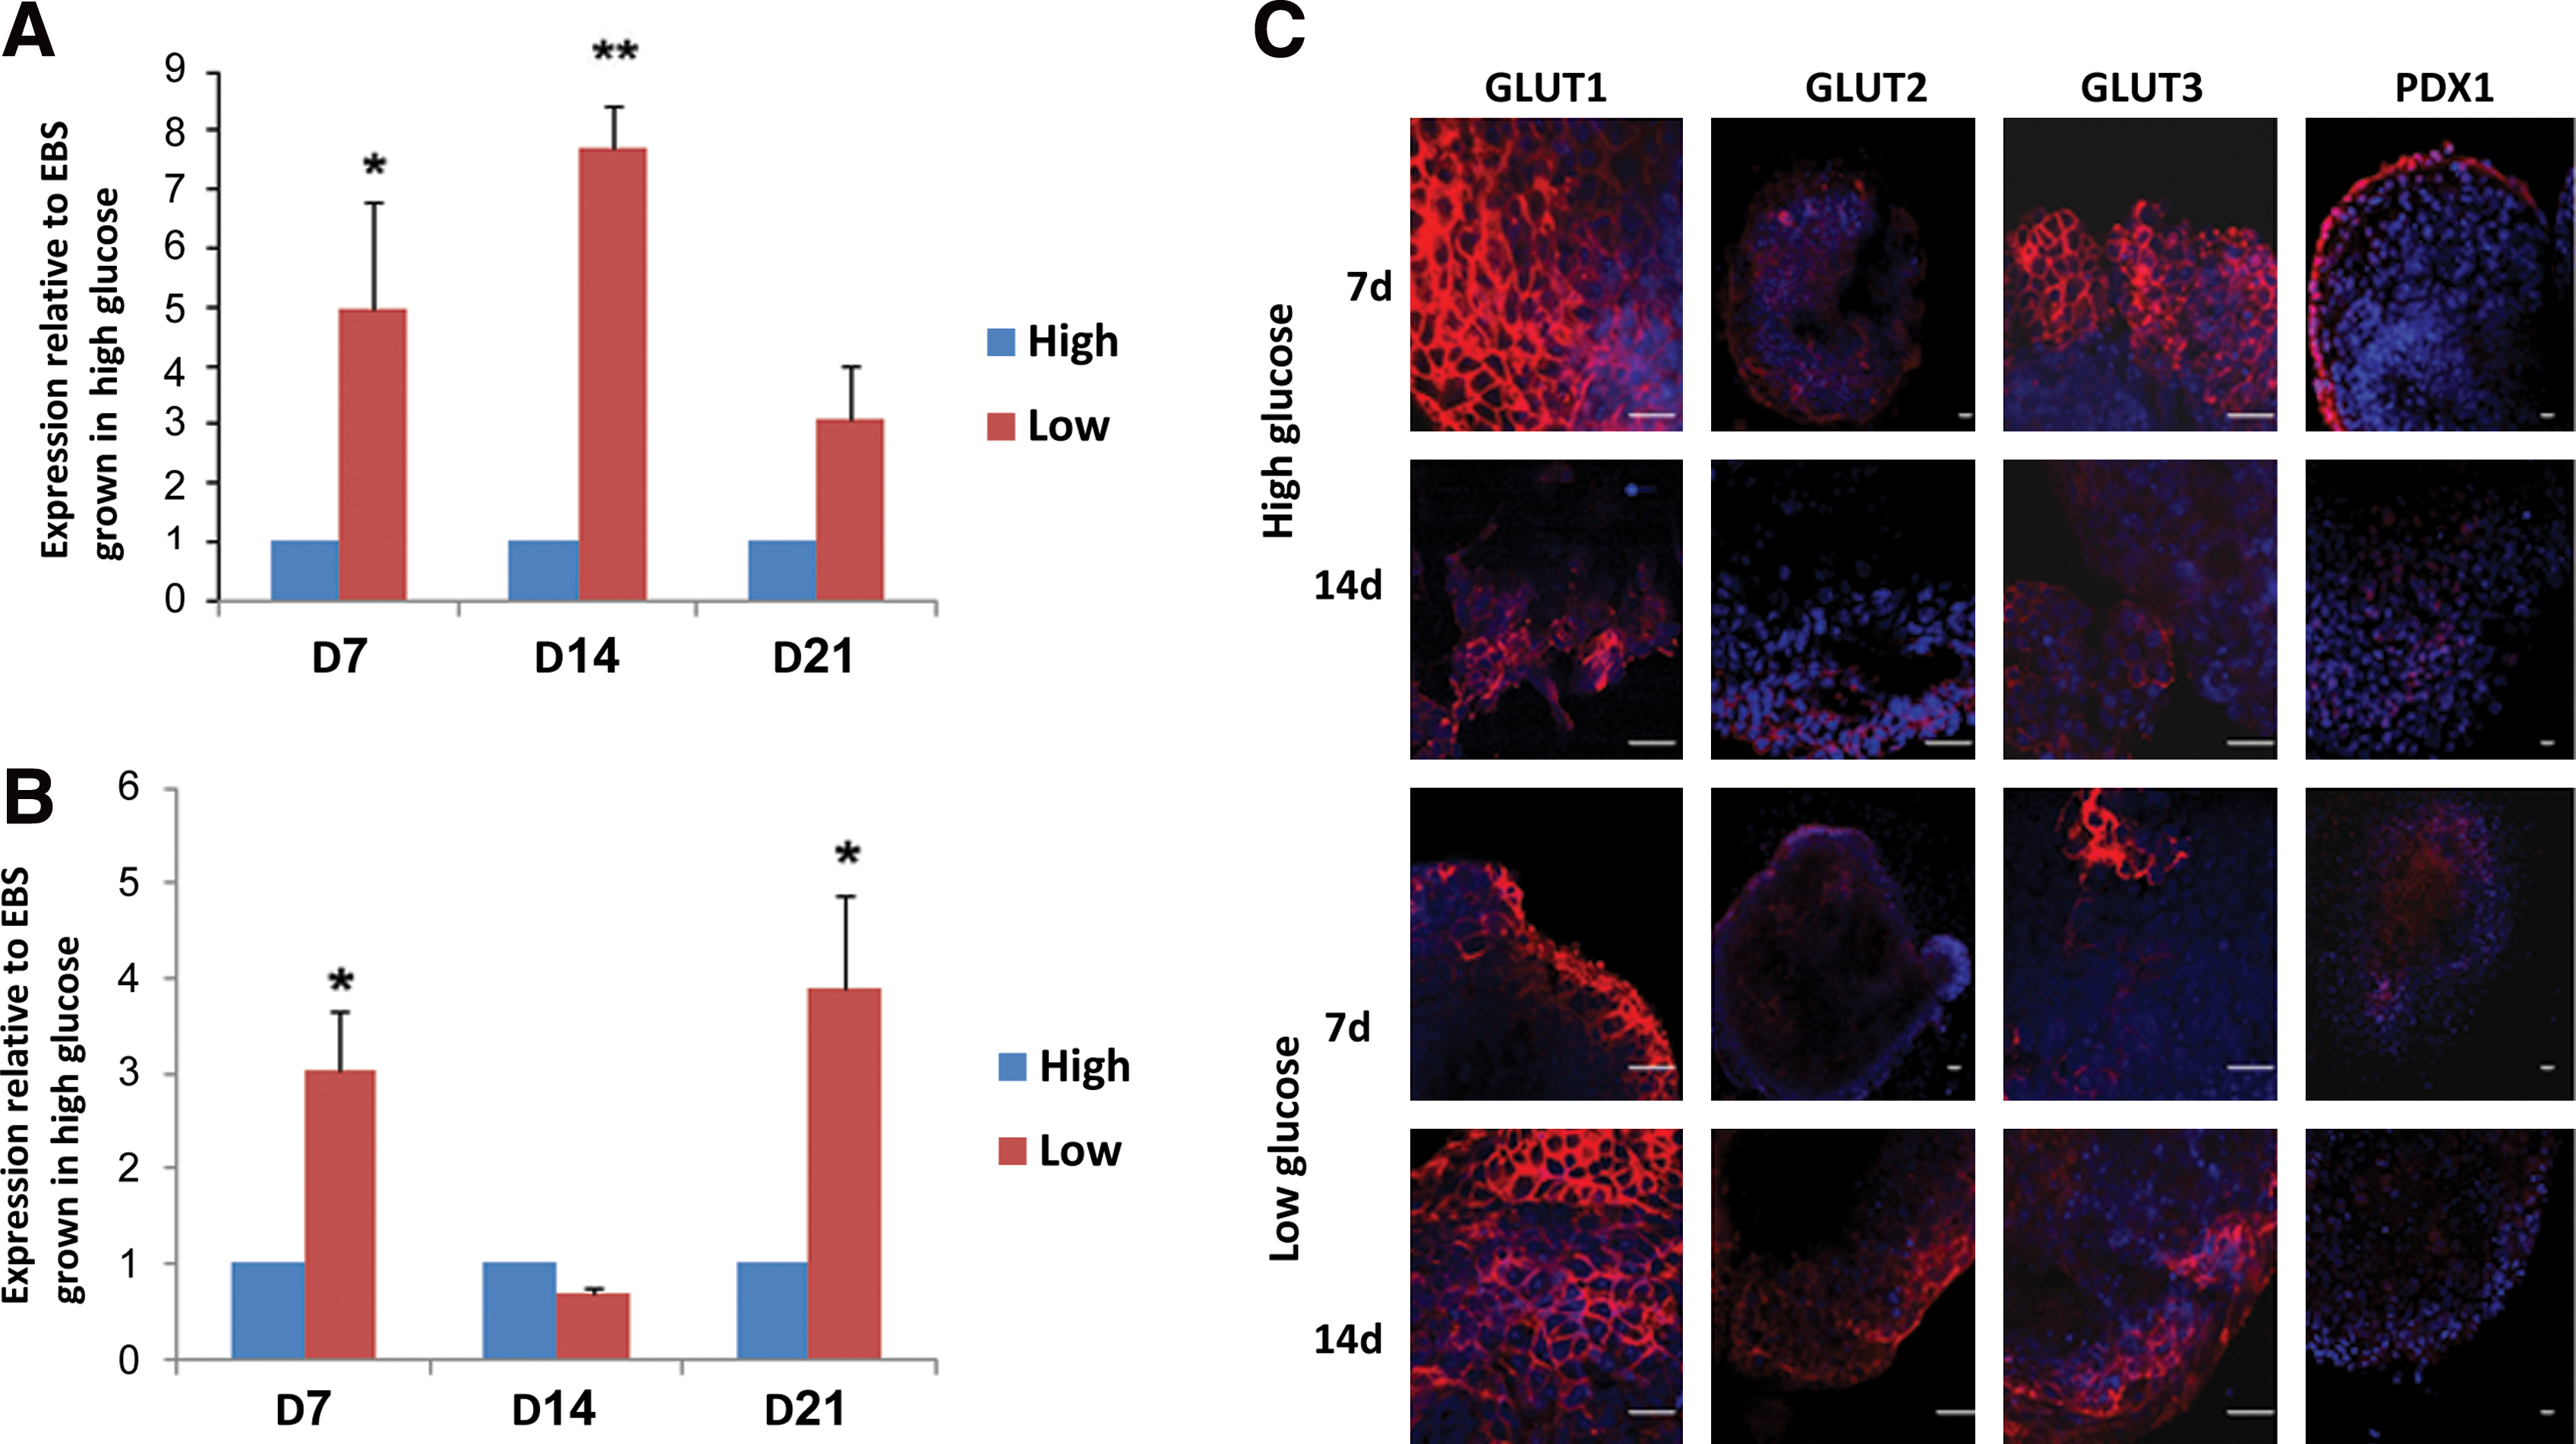
To demonstrate the influence of glucose concentration on EB morphology and differentiation capacity, EBs were cultured in medium with high (25 mM) or low (5 mM) glucose levels. The expression levels of the glucose transporters GLUT 1–4 and PDX1 as well as the undifferentiated marker NANOG, octamer binding transcription factor 4 (OCT4), the ectodermal marker sex determining region Y (SRY)-box 1 (SOX1), and the mesodermal marker T-box transcription factor 5 (TBX5), were quantified by qPCR. While the expression of OCT4, SOX1, TBX5, GLUT1, GLUT3, and GLUT4 were similar in both treatments (data not shown), the expression of GLUT2 (Fig. 2A) and PDX1 (Fig. 2B) was elevated in the EBs grown in medium with low glucose concentrations.
Using immunofluorescence (Fig. 2C), we were able to monitor the expression of GLUT1–4 in EBs and compare them to the PDX1 expression. GLUT1 was visualized mainly in the outer layer of the EBs. At day 7, this isoform was localized in the cell membrane; from day 14 on, it was detected also in the cytoplasm. When the EBs were grown in medium with low glucose concentration, GLUT1 expression increased and was localized in both the membrane and the cytoplasm.
Contrary to the mouse model in which GLUT2 was localized only in 15- and 20-day-old EBs and was restricted to distinctive cells in the center of the EBs [15], in human EBs, GLUT2 was visualized as early as day 7 and localized mostly in cell membranes in the entire EB area, with enhanced expression in the outer region. When EBs were grown in low glucose medium, cytoplasmic and overall expression of GLUT2 was elevated.
GLUT3 was visualized in the outer region of some of the EBs. In EBs grown in high glucose concentration, GLUT3 expression was low and appeared in membranes of regions of some of the EBs. In contrast, in EBs grown in low glucose medium, the number of cells expressing GLUT3 was increased; GLUT3 was noticed in the center of the EBs and in the cytoplasm as well as in the membrane.
GLUT4 was not detected in the EBs by immunofluorescence (up to 28-day-old EBs; data not shown) and western blot (28-day-old EBs; data not shown).
PDX1 expression in 7-day-old EBs grown in high glucose was mainly localized in the outer region of the EBs, while in EBs grown in low glucose medium, PDX1 was scattered throughout the EBs and was mainly localized in the center of the EBs. The percentages of PDX1-expressing cells were higher in low glucose versus high glucose medium, similar to qPCR results (Fig. 2B). On the contrary, in 14-day-old EBs, PDX1 was visualized at the entire EB area, with enhanced expression in the outer region and with no significant differences in the expression between EBs grown in high versus low glucose (Fig 2C).
No significant differences were found in the glucose transporters and PDX1 expression between human ES cell lines and foreskin-derived iPSC lines.
Glucose uptake in differentiated and undifferentiated hESCs
Glucose transporter function was determined by the rate of cellular glucose uptake in undifferentiated hESCs and in 10-day-old EBs. Cells were incubated with or without insulin (100 nM) for 30 min (Fig. 1D.) The EB cells were more responsive to insulin stimulation, which enhanced glucose uptake by as much as 2.5-fold above the basal level. In the undifferentiated hESCs, insulin had only a minor effect on glucose uptake.
GLUT2 expression in cells
After observing the correlation of GLUT2 and PDX1 expression at the RNA levels (Fig. 1A) and examining their expression in EBs (Fig. 2C), we used immunofluorescence to examine their expression in 14-day-old EBs and found that most of the cells expressing GLUT2 also expressed PDX1 (Fig. 3A). We then decided to sort 14- to 21-day-old EBs from 2 hESCs lines, H9.2 and I3, and from foreskin fibroblast-derived iPSCs [12] on the basis of GLUT2 expression, using first the FACS ARIA sorter (sorted population is represented in Fig. 3B) and then the MACS kit (magnetic sorting) to obtain GLUT2 positive and GLUT2 negative populations.

GLUT2 and PDX1 expression were elevated by more than 100-fold (Fig. 3C) in the GLUT2 positive population that was sorted by the FACS ARIA system. The GLUT2 positive cells also showed a 10-fold increase in endodermal marker expression, including paired box 4 (PAX4), neurogenin 3 (NGN3), chemokine receptor 4 (CXCR4), SRY box 17 (SOX17) and the liver marker albumin (ALB) (data not shown). SOX1, an exodermal marker, was not enhanced, indicating the endodermal linage of these cells (data not shown).
Unlike FACS sorting, MACS does not enable gating the positive population. The result is a larger but less purified positive population. This technique is often preferred when a large number of sorted cells are required for continual growth and differentiation after sorting. Sorting 14- to 19-day-old I3 and H9.2 EBs with the MACS kit resulted in a larger but less purified GLUT2 positive population (GLUT2+) with fewer enhancements of the endoderm markers. In the GLUT2+ MACS sorted cells, GLUT2 was 10- to 30-fold higher, and PDX1 5- to 10-fold higher than in the GLUT2– cells. In addition, the endodermal markers PAX4, NGN3, and CXCR4 were enhanced by 5- to 10-fold, as shown in Fig. 4A.
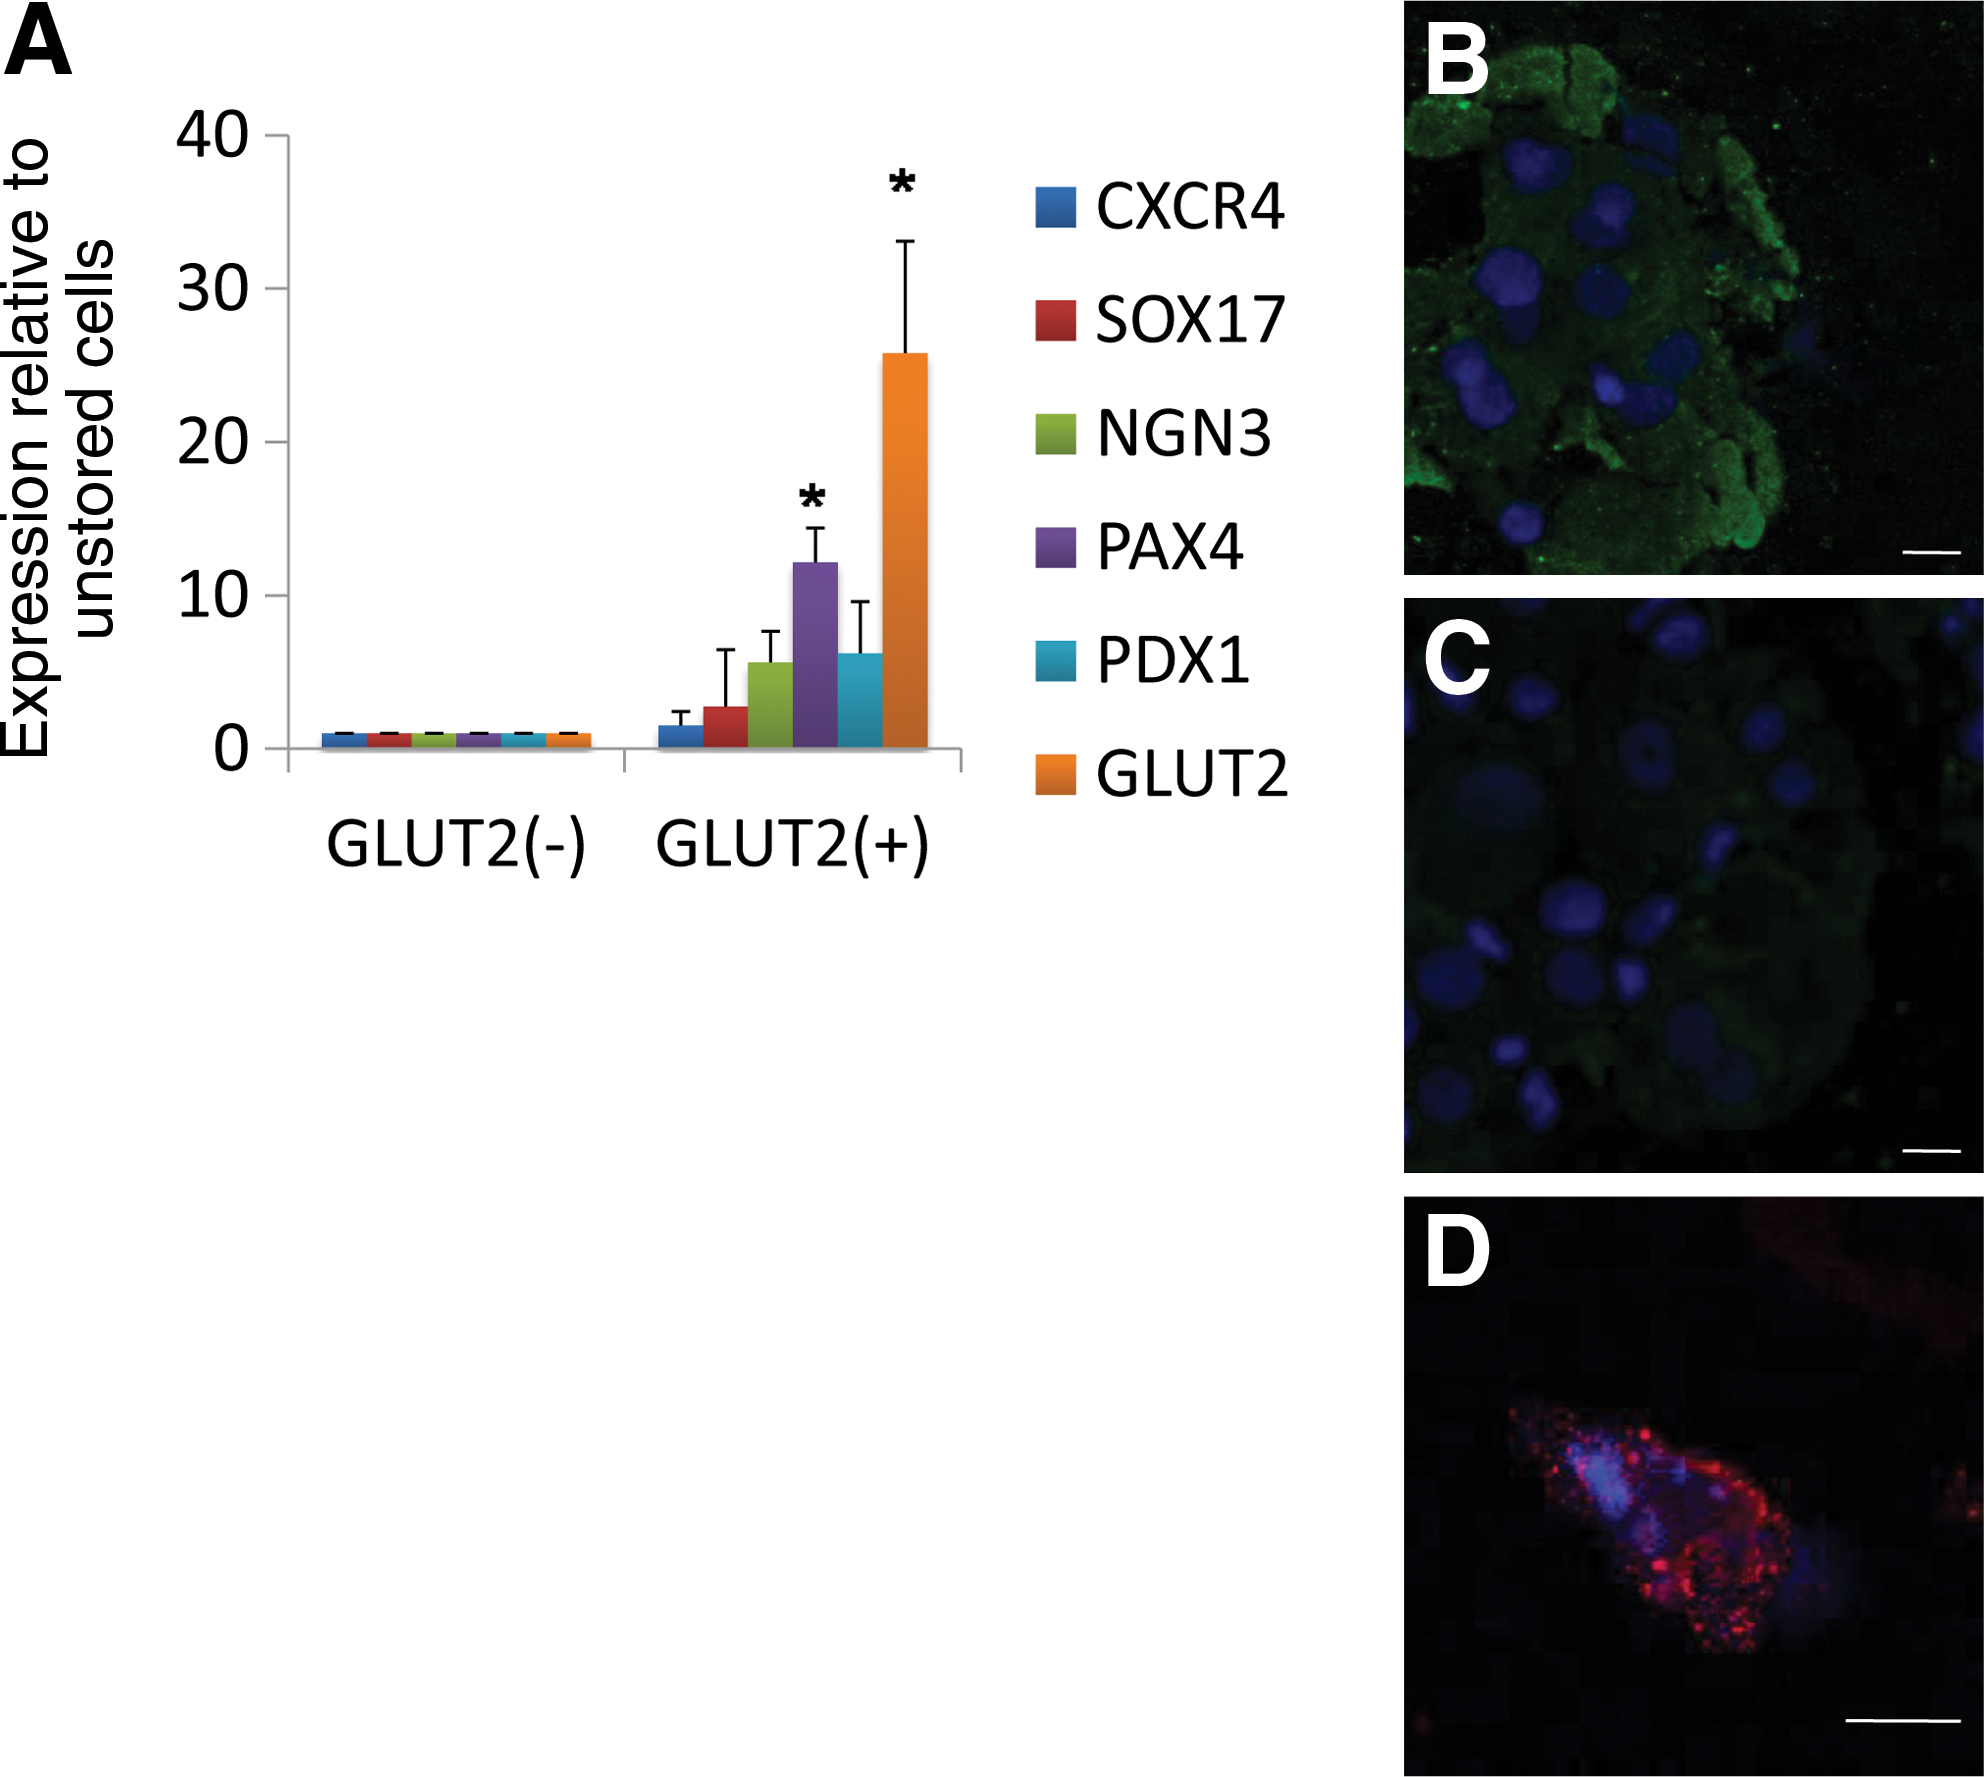
Staining the cells for GLUT2 protein reveled that GLUT2 was apparent only in the GLUT2 positive cell population and not detected in the negative population (Fig. 4B and 4C, respectively). In addition, high levels of PDX1 were detected by immunofluorescence in the GLUT2 positive cells (Fig 4D).
Discussion
This is the first documentation of changes in expression of class 1 glucose transporters during the course of hESC differentiation, from the undifferentiated stage to 28-day-old EBs. In addition, the potential use of GLUT2 as a surface marker for the use of pancreatic progenitor cells isolation was examined.
GLUT1 and GLUT2 expression was enhanced during hESC differentiation, compared with a minor change in GLUT3 expression. GLUT4 expression was found to be very low both at the RNA and in the protein levels. These results contrast with those from mouse ESCs. Unlike previous works describing mouse ES cells [15], in our work low levels of GLUT1 were found in the undifferentiated cells, and its level increase with the differentiation time. In the mouse, GLUT2 was detected only in EBs that were cultured for at least 15 days. Moreover, in mouse ESCs, expression of GLUT3 and GLUT4 was enhanced, with GLUT4 expression increasing with time [15]. The differences in the results between these 2 studies are probably due to differences in GLUT expression in mice and humans [16 –18] and to variations of GLUT isoforms in different species. While GLUT1, which is responsible for basal glucose uptake, is expressed in most species and in all tissues from the oocyte stage and on, GLUT2 and GLUT3 appear from the 8-cell stage in mice and only from the blastocyst stage in humans [15,16,18].
We found that insulin enhanced glucose uptake in the 10-day-old EBs by 2.5-fold over control levels but had little effect in the undifferentiated ES cells. The increase in the glucose uptake correlated to the increase of the GLUT1 expression. The insulin-stimulated increase in glucose uptake was probably mediated mainly by the translocation of GLUT1 and to some extent also by increasing GLUT2 expression. Other studies have shown that in tissues predominantly expressing GLUT1, the number of GLUT1 transporters in the plasma membrane, and their activity level, determine the rate at which glucose is transported and that glucose deprivation promotes this process [19 –21]. In addition, GLUT1 protein and 2-deoxy-d-glucose have been shown to be up-regulated by insulin in a number of cell lines [22,23].
Protocols for ESC differentiation generally use media containing high glucose concentrations (25 mM), based on the presumption that high glucose media is needed to maintains ESCs. This is despite the implication in a number of studies that high glucose concentration downregulates endoderm differentiation. Hyperglycemia in preimplantation mouse embryos has been shown to cause downregulation of GLUTs, resulting in lower intracellular glucose, abnormal metabolism, and increased apoptosis at the blastocyst stage [24 –26]. The exposure to sustained high glucose concentration can cause loss of differentiation [27] and insulin secretion impairment in adult pancreatic beta cells [28]. Additionally, maternal diabetes affects the preimplantation embryo, leading to downregulation of GLUTs at the blastocyst stage in the mouse and subsequent lowering of intra embryonic free glucose levels [29]. Moreover, it has been shown that growth and differentiation of human and mouse EBs in high compared to low glucose (5 mM) concentration affected differentiation [17,30].
This data, taken together, raises doubts regarding the use of high glucose media for ES differentiation. Therefore, we compared the expression of different differentiation markers in EBs grown in low or high glucose concentration. Growing EBs in low glucose concentration increased the differentiation rates, as apparent from reduction in Nanog expression and enhanced differentiation of markers such as PDX1 and GLUT2 at the RNA and protein levels. The use of low glucose concentration for the differentiation to definitive endoderm and pancreatic progenitors seems more applicable and should be further investigated.
A major step in the differentiation of hESCs or iPSCs into insulin-secreting cells is the generation of PDX1-expressing cells. The transcription factor PDX1 marks the earliest pancreatic progenitor at the onset of the earliest commitment stages towards development of the pancreas. It is expressed throughout the pancreas during the first several days of pancreatic development, as the organ grows and branches. PDX1 regulates the insulin gene, and from E15.5 onward its expression becomes mainly restricted to beta cells [31]. While several protocols have been developed to increase the proportion of PDX1 positive cells, the search for a surface marker that correlates to pancreatic progenitors or developing endoderm continues. Recently, different works tested the correlation between pancreatic progenitors and various candidate surface markers including CD133 [32,33], CD49F [34], and CD24 [35]. In addition, CXCR4, CD49e, CD141, and CD238 surface markers were found to be correlated to SOX17 [36]. Such a marker will enable the sorting and enrichment of the pancreatic progenitor cell population and will facilitate the development of strategies for in vitro differentiation toward insulin-producing cells.
It has been suggested that GLUT2 positive cells may be responsible for some of the differentiation of beta cells into islets after injury [4] and that GLUT2 may serve as a putative marker of pancreatic progenitor cells. Since GLUT2 is expressed in the cell membrane, we hypothesized that it may serve as a surface marker for PDX1-expressing cells and could be used for sorting hESCs in the course of beta cell differentiation. In addition, the sorted cells may be directly used for transplantation and further differentiation in vivo in animal models.
Detection of a correlation in the expression pattern of PDX1 and GLUT2 led us to explore the potential use of GLUT2 as a candidate surface marker for tracking pancreatic precursor cells. In the GLUT2 sorted cells, GLUT2 and PDX1 expression were elevated in the GLUT2 positive population, as well as other endodermal markers such as PAX4, NGN3, CXCR4, and SOX17. The liver marker ALB was also increased, suggesting that these cells are not yet fully committed to pancreatic fate.
Using FACS, the cell population obtained was relatively pure and homogeneous and included both membranal and cytoplasmic GLUT2. While using the MACS separation technique, the sorted population was larger but less pure.
In further experiments, MACS may be useful to more easily enable cell culture after sorting, since it is less stressful to the cells and also since continued cell growth may require different cells to serve as supporting cells.
In conclusion, analyzing GLUT expression over time revealed a positive correlation between GLUT2 and PDX1 expression. Sorting the differentiated cells (either hESCs or iPSCs) for GLUT2 increased the proportion of the PDX1-expressing cell population. This simple approach may be used to differentiate embryonic stem cells and to isolate from them, using GLUT2 as a surface marker, an enriched pancreatic progenitor cell population in order to reach insulin-producing cells.
Footnotes
Acknowledgments
This work was supported by Technion R&D Foundation and Rambam Health Care Campus.
Author Disclosure Statement
No competing financial interests exist.