
Abstract
The enhanced proliferation of mesenchymal stem cells (MSCs) can be helpful for the clinical translation of cell therapy. Low-level laser irradiation (LLLI) has been demonstrated as regulating MSC proliferation. MicroRNAs (miRNAs) are involved in various pathophysiologic processes in stem cells, but the role of miRNAs in the LLLI-based promotion of MSC proliferation remains unclear. We found that the proliferation level and cell cycle-associated genes in MSCs were increased after LLLI treatment in a time-dependent manner. Microarray assays revealed subsets of miRNAs to be differentially regulated, and these dynamic changes were confirmed by quantitative real-time polymerase chain reaction (qRT-PCR) after LLLI. miR-193 was the most highly up-regulated miRNA, and the change in it was related with the proliferation level. Gain-loss function experiments demonstrated that miR-193 could regulate the proliferation of MSCs, including human's and rat's, but could not affect the apoptosis and differentiation level. Blockade of miR-193 repressed the MSC proliferation induced by LLLI. By qRT-PCR, we found that miR-193, in particular, regulated cyclin-dependent kinase 2 (CDK2) expression. Bioinformatic analyses and luciferase reporter assays revealed that inhibitor of growth family, member 5 (ING5) could be the best target of miR-193 to functionally regulate proliferation and CDK2 activity, and the mRNA and protein level of ING5 was regulated by miR-193. Furthermore, the ING5 inhibited by small interfering RNA (siRNA) could up-regulate the proliferation of MSCs and the expression of CDK2. Taken together, these results strongly suggest that miR-193 plays a critical part in MSC proliferation in response to LLLI stimulation, which is potentially amenable to therapeutic manipulation for clinical application.
Introduction
M
Low-level laser irradiation (LLLI) can exert strong effects on cell proliferation [4]. We previously found that LLLI could promote MSC proliferation, and demonstrated that lasers of 0.5 J/cm can promote proliferation and slightly affect MSC differentiation [5,6]. Until now, the mechanism of LLLI treatment for cell proliferation remains unclear. Several possible mechanisms and related signaling pathways have been found to be involved in LLLI treatment. It was found that LLLI can regulate mitochondrial signaling, activate calcium channels, and phosphorylate and release certain growth factors, thereby stimulating cell proliferation [4,7 –9].
MicroRNA (miRNA) molecules can potentially regulate every aspect of cellular activity [10]. A subset of miRNAs has been found to have essential roles in the proliferation and differentiation of various types of stem cells [11]. miR-335 has been demonstrated as regulating the proliferation, migration, and differentiation of MSCs [12]. miR-486-5p has been reported as regulating the proliferation of human adipose tissue-derived MSCs [13]. However, investigations into the role of miRNAs in LLLI pro-proliferation bio-modulation are lacking. Therefore, in the present study, we would like to evaluate the (i) expression profile of miRNAs after LLLI treatment in MSCs; (ii) related functions and pathways of the identified miRNA.
Materials and Methods
The study was performed in conformity with the guidelines of humane use and care of laboratory animals published by NIH (No. 85–23, revised 1996), and the animal procedures were approved by the institutional ethics committee of Fuwai Hospital. Human MSCs (hMSCs) were isolated and cultured from 6 patients <18 years old with simple congenital heart disease [3]. All the procedures were approved by the ethics committee at Fuwai Hospital, and all the enrolled patients signed the informed consent.
Cell culture and preparation
Rat MSCs were isolated from male Sprague–Dawley rats (4 weeks; 60 g) obtained from the Institute of Laboratory Animal Science of the Chinese Academy of Medical Sciences (Beijing, China) as previously reported [14]. MSCs were seeded at 1.5×10³ cells per well in 96-well culture plates for the proliferation assay, and at 2.5×10⁵ cells per dish in culture dishes (diameter, 35 mm) for miRNA microarray analyses and quantitative real-time polymerase chain reaction (qRT-PCR) analyses. Before laser irradiation, the culture medium was removed and replaced with fresh medium. The MSCs were then individually irradiated with a low-level laser. The control cells underwent the same procedure without laser irradiation. The cells were then incubated for different culture periods after irradiation, corresponding to the experimental purpose. The detailed study protocol is shown in Fig. 1A.
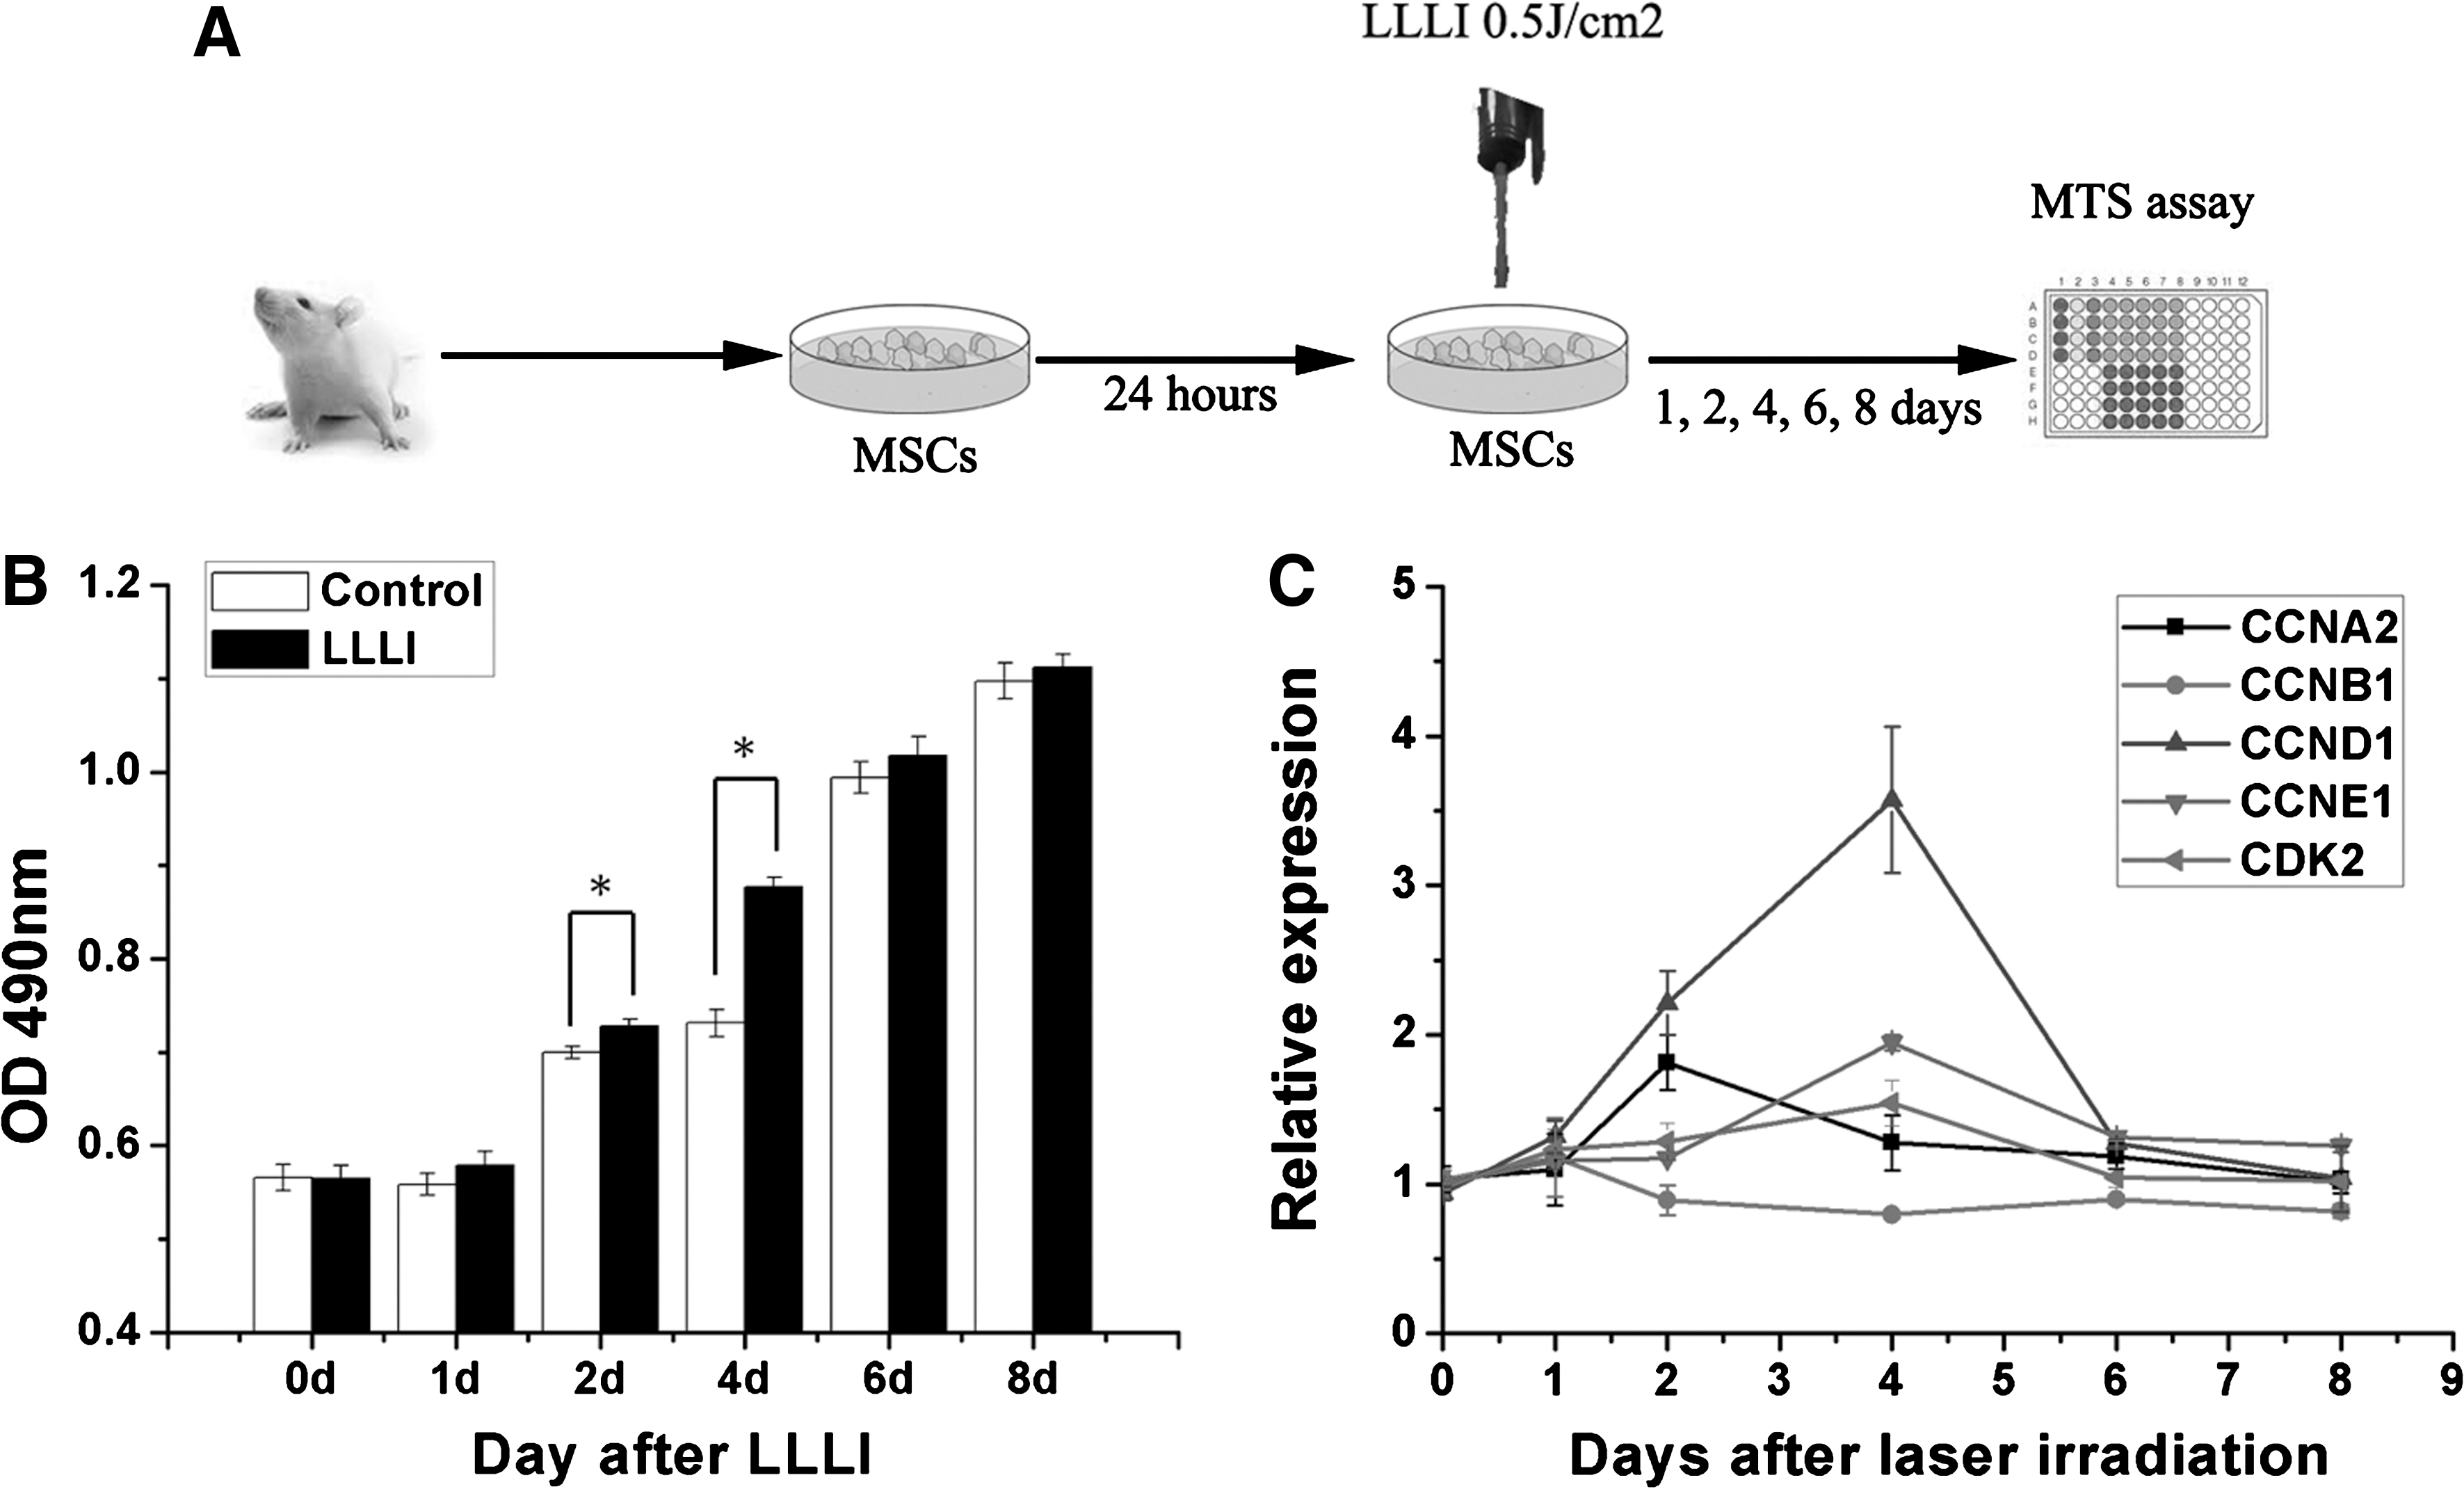
Low-level laser irradiation (LLLI) promotes mesenchymal stem cell (MSC) proliferation and increases cell cycle-associated gene expression.
Isolation and culture of hMSCs
The procedures were carried out as described in our previous study [3]. Briefly, 3–5 mL of bone marrow aspirate was taken from the sternum of patients during operations. Fresh bone marrow was stored in phosphate-buffered saline and heparin. After centrifugation, the residual cells were loaded onto Percoll solution. Then, the mononuclear cells were collected from the upper layer and interface, and the cells were cultured in Dulbecco's modified Eagle's medium (DMEM; Gibco, Grand Island, NY) supplemented with 10% fetal bovine serum (FBS; Gibco BRL, Carlsbad, CA). The proliferation of hMSCs was measured by 5-bromo-2′-deoxyuridine (BrdU) incorporation assay and 3-(4,5-dimethylthiazol-2-yl)-5-(3-carboxymethoxyphenyl)-2-(4-sulfophenyl)-2H-tetrazolium (MTS) assay 48 h after transfection.
Laser irradiation
Laser irradiation was carried out as described in our previous report [5]. Briefly, laser irradiation was undertaken with a diode laser (KDL-300; Beijing KeDian Microwave Electronics Co., Beijing, China) operating at a wavelength of 635 nm (red light). The output power was kept constant at 60 mW. We previously found 0.5 J/cm to be the appropriate laser irradiation dose that induces MSC proliferation [5]. Therefore, an energy density of 0.5 J/cm2 was applied using a power density of 6.61 mW/cm2, a lens–plate distance of 89 mm, and an irradiation time of 75 s. To fit to culture dishes of diameter 35 mm, the width of the laser beam was adjusted to 34 mm. Rat MSCs were seeded in wells away from each other to avoid overlapping or scattered irradiation. Black backgrounds in irradiated areas were used to minimize light reflection, and all procedures were done on a super-clean bench.
Proliferation assay
MSC proliferation was determined by the colorimetric MTS assay (CellTiter 96® AQueous One Solution Cell Proliferation Assay; Promega, Madison, WI) and a colorimetric BrdU Cell Proliferation enzyme-linked immunosorbent assay (ELISA) kit (Calbiochem, Gibbstown, NJ). In irradiation experiments, experiment and control rat MSCs were seeded in culture plates and assayed 0, 1, 2, 4, 6, and 8 days after LLLI. The culture medium was replaced every 2 days. The MTS assay was undertaken by following a protocol [5]. The absorbance of the obtained dye was measured at 490 nm using a microplate reader (Model 680; BioRad, Tokyo, Japan). In addition, a Colorimetric BrdU Cell Proliferation ELISA kit (Calbiochem) was used as previously described [15]. Briefly, experiments were undertaken as just described: 24 h after transfection, the cells were labeled with BrdU for another 12 h, and DNA syntheses were measured using a BrdU ELISA kit according to the manufacturer's instructions.
miRNA microarray analyses
The significant difference of proliferation level between LLLI treatment and the control group was observed at day 4, so we chose this time point to analyze miRNA expression by miRNA microarray. RNA was extracted using the TRIZOL method (Invitrogen, Carlsbad, CA), and miRNAs were isolated with a mirVana miRNA Isolation kit (Ambion/Applied Biosystems, Foster City, CA). miRNA profiling of LLLI versus control MSCs was done using a miRNA microarray, and 2 biological replicates were employed for each condition. miRNA microarray analyses were undertaken by CapitalBio Company with the Rat microRNA Array 2.0 system (Affymetrix Japan Co., Tokyo, Japan) according to the Affymetrix GeneChip Expression Analysis Technical Manual and all 389 rat miRNA probes. Details of the preparation and analysis of samples are described elsewhere [16]. Gene ontology analyses were done for genes regulated by >1.2-fold (P<0.05), showing a correct hybridization signal on the 4 arrays. Hierarchical clustering was carried out by a Cluster 3.0 system using differentially expressed genes. Cluster data were processed and visualized using Java Treeview software.
Quantitative real-time polymerase chain reaction
RNA was extracted as just described. qRT-PCR was done using the ABI 7300HT system (Ambion/Applied Biosystems). miRNA RT-PCR was undertaken using a TaqMan MicroRNA Reverse Transcription kit (Ambion/Applied Biosystems) and TaqMan probes for hsa-miR-15b, hsa-miR-133b, hsa-miR-193, hsa-miR-224, has-miR-320, and hsa-miR-23a (Ambion/Applied Biosystems), based on the protocols from the TaqMan MicroRNA assay (Ambion/Applied Biosystems). Expression levels were normalized to U6 snRNA (Ambion/Applied Biosystems). miRNA levels were quantified with the 2−ΔΔCt relative quantification method. All TaqMan miR assays were carried out in triplicate.
SYBR green chemistry was employed for analyses of the expression levels of cyclin-dependent kinase 2 (CDK2), cyclin A2 (CCNA2), CCNB1, cyclin D1 (CCND1), cyclin E1 (CCNE1), and inhibitor of growth family, member 5 (ING5), CCAAT-enhancer-binding protein (C/EBP), peroxisome proliferator-activated receptors gamma (Pparg), runt-related transcription factor 2 (Runx2), octamer-binding transcription factor 4 (Oct4), sex determining region Y-box 2 (Sox2) mRNA. Glyceraldehyde-3 phosphate dehydrogenase (GAPDH) was used as the housekeeping control. All primers for the SYBR green reactions are shown in Supplementary Table S1 (Supplementary Data are available online at
Western blot analyses
Samples from cultured MSCs were homogenized and lysed. ING5 (1:1,000 dilution; Proteintech, Chicago, IL), Proliferative cell nuclear antigen (PCNA;1:1,000 dilution; Santa Cruz, CA), and GAPDH (1:6,000 dilution; Sigma–Aldrich, St Louis, MO) were used to determine protein expression. Experiments were undertaken using standard procedures as previously described [15]. All western blots were quantified by densitometry using the Quantity One program (BioRad, Hercules, CA).
Delivery of miRNA inhibitors/mimics
Transfection using the SiPORT NeoFX Transfection Agent (Ambion/Applied Biosystems) was undertaken according to the manufacturer's protocols. Briefly, MSCs were transfected with miRNA mimic and inhibitor or small interfering RNA (siRNA) for ING5 (GenePharma Co. Ltd., Shanghai, China) in the suspension situation before detaching and to the final concentration of 50 nM. All the sequences of miRNAs are shown in Supplementary Table S2. Samples were collected 48 h after miRNA transfection. To detect the differentiation of MSCs, the samples were collected 6 days after the transfection.
Immunocytochemistry
Immunocytochemistry was done according to a standard protocol. Briefly, cultured MSCs were fixed in 4% paraformaldehyde and permeabilized with ice-cold methanol. Cells were blocked with 5% serum from the same species as the secondary antibody. MSCs were then incubated with primary antibody Ki-67 (1:100; Abcam, Cambridge, UK) overnight and stained with fluorochrome-conjugated secondary antibodies for 30 min. MSCs were mounted in VectaShield (Vector Laboratories, Peterborough, UK) with 4′,6-diamidino-2-phenylindole (DAPI) to visualize nuclei. The terminal deoxynucleotidyl transferase dUTP nick end labeling (TUNEL) assay was carried out using an In Situ Cell Death Detection kit (Roche, Basel, Switzerland) according to the manufacturer's protocols. DAPI was used for nuclear counterstaining. Images were captured using an inverted microscope (BX61; Olympus, Tokyo, Japan). The percentage of Ki-67- or the number of DAPI-positive cells was counted in 9 regions and divided by the DAPI number.
Luciferase reporter assays
The luciferase reporter assay was carried out as previously described [17]. Briefly, the fragment of the 3′ untranslated region (3′-UTR) of ING5 mRNA containing the putative (WT) or mutated (MU) miR-193 binding sequence was used to construct the vectors. The sequences of the miR-193 binding site and mutant site were: WT (5′-ATTTAATAATT CAGTGGCCAGT-3′, from 97 to 118 bp of the 3′ UTR region) or MU (5′-ATTTAATAATTCAGTCCGGUCA-3′). The miR-193 binding sites were constructed using the SacI and HindIII restriction sites of pMIR-REPORT. Overall, 293T cells were transfected with Lipofectamine 2000 (Invitrogen) according to the manufacturer's instructions. The cells were further grown in DMEM containing 10% FBS. Relative luciferase measurements were made 48 h after the transfection using the dual Luciferase Reporter Assay System (Promega) using a luminescence counter.
miRNA target search
Target genes for miRNAs were predicted using open-source software TargetScan 5.2 (
Fluorescence-activated cell sorting analyses
Cells undergoing apoptosis were detected by fluorescence-activated cell sorting (FACS) analyses. Briefly, the cells were cultured in low-serum DMEM for 48 h after the transfection. They were then dyed with an Annexin VAPC Apoptosis Detection Kit (eBioscience, San Diego, CA) for 30 min followed by an FACS analyses with FACS Calibur (BD Biosciences, Franklin Lakes, NJ) according to the manufacturer's protocols.
Differentiation assays
The rat MSCs were transfected with pre-miR-193 or anti-miR-193 and negative control; 2 days after the transfection, the medium was changed by conditioning the medium for 10 days. The procedures were carried out as described earlier [13]. Adipogenic differentiation was induced by an adipogenic medium (5% FBS, 1 mM dexamethasone, 0.5 mM/mL 3-isobutyl-1-methylxanthine, and 200 mM indomethacin in alpha-modified Minimal Essential Medium [a-MEM]). Osteogenic differentiation was induced through the osteogenic medium (10% FBS, 0.1 mM dexamethasone, 10 mM b-glycerophosphate, and 50 mM ascorbic acid in a-MEM). After 10 days of differentiation, the cells were collected to extract RNA and to perform qRT-PCR.
Statistical analyses
Data are the mean±standard error of the mean. Differences among the groups were tested by 1-way analysis of variance. Statistical analyses between 2 groups were evaluated based on the Student's t-test. Differences between the groups were evaluated using Fisher's least-significant difference test. P<0.05 was considered significant.
Results
LLLI promotes MSC proliferation and increases cell cycle-associated gene expression
Cultured MSCs were detected by flow cytometric analyses of expressed surface antigens as comprising a unique phenotypic population as shown in our previous study [18,19]. The number of viable cells increased rapidly after LLLI treatment from day 1 to day 4, and peaked at day 6 (Fig. 1B). A positive difference was observed at day 2 and day 4 after treatment compared with nonirradiated cells, which was consistent with previous reports [5].
Cell cycle-specific proteins can be elevated by LLLI treatment [9]. We found that CCND1, CCNE1, and CDK2 were up-regulated at day 4 after LLLI treatment, and CCNA2 was up-regulated at day 2, and the changes were time dependent (Fig. 1C).
miRNA expression after LLLI treatment
To determine changes in miRNA expression, we identified global changes in miRNA expression patterns after LLLI treatment (Fig. 2A). A total of 34 miRNAs were differentially regulated after LLLI treatment: 19 miRNAs were up-regulated, and 15 miRNAs were down-regulated (Table 1). We chose the most significantly changed miRNAs and previously reported pro-proliferation miRNAs as target miRNAs, including miR-15b, -23a, -133b, -193, -224, and -320. These changes were detected by qRT-PCR analyses in a time-dependent mode. Surprisingly, most of the significantly up-regulated miRNAs were initially down-regulated after laser irradiation, and then, they gradually increased. The expression level of miRNAs peaked at day 2 and day 4, and most of them attenuated at day 6 and were back to normal levels at day 8 (Fig. 2B, C). We also found miR-193 was the most significantly up-regulated miRNA.
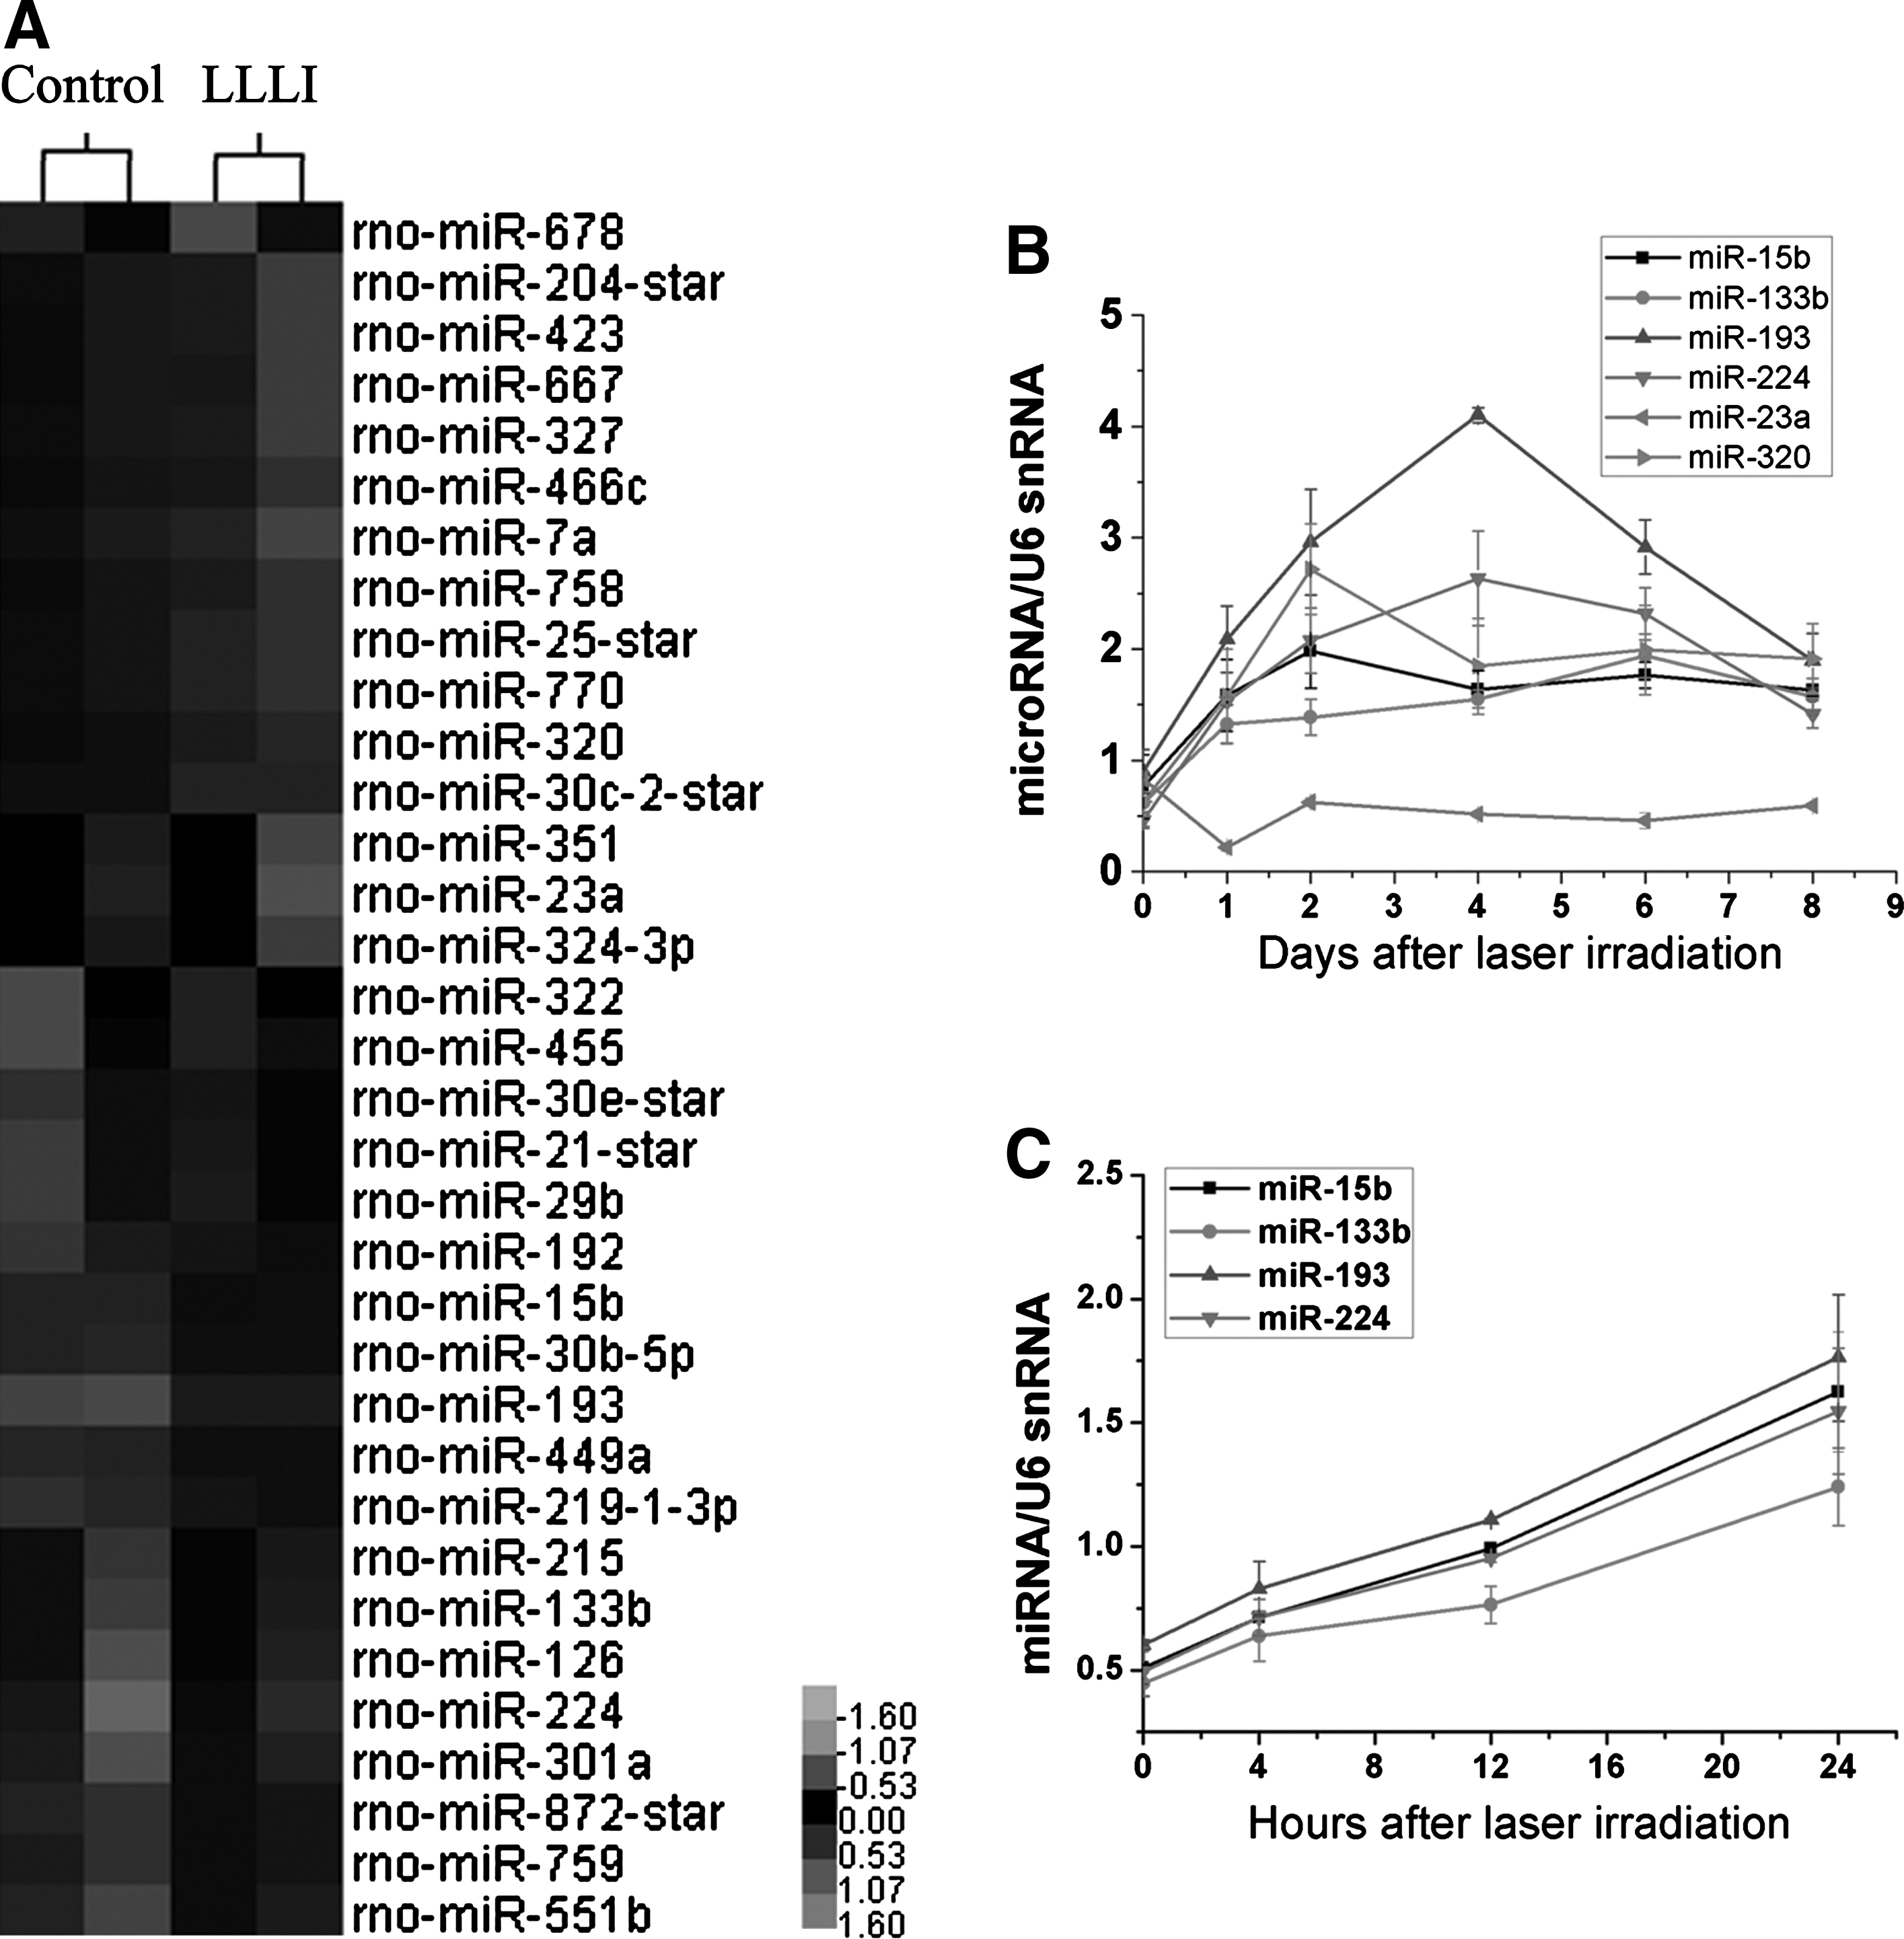
Profiling of microRNA (miRNA) expression after LLLI treatment in MSCs.
Using online prediction software (TargetScan), the 6 differentially expressed miRNAs (miR-15b, miR-23a, miR-133b, miR-193, miR-224, and miR-320) were analyzed for proliferation with potential 102 target genes (Table 2).
Using the online prediction software TargetScan, 102 possible proliferation-related target genes were predicted for the 6 broadly conserved microRNAs (miR-15b, miR-23a, miR-133, miR-193, miR-320, and miR-224).
Monitoring the proliferation of MSCs induced by miRNA
To determine the role of target miRNAs in MSC proliferation, antagomirs and mimics of miRNAs were transfected into MSCs. The transfection rate was confirmed by the fluorescence in the MSCs from FAM™ dye-labeled miRNA, and by qRT-PCR assays. The expression levels of miRNA clearly increased (>10-fold) and decreased (<10%) after miRNA mimic and inhibitor transfection, respectively (Supplementary Fig. S1A, B). The overexpression of miR-133b, miR-193, miR-224, and miR-320 in MSCs could moderately increase cell viability 24 h after the transfection compared with cells transfected with a control mimic (Fig. 3A). However, in the inhibitor transfection group, only anti-miR-193 or anti-miR-133b could significantly inhibit cell proliferation. Furthermore, in the 48-h and 72-h groups after transfection, only miR-133b and miR-193 had standard functions that regulate MSC proliferation in the gain-and-loss-of-function experiment.
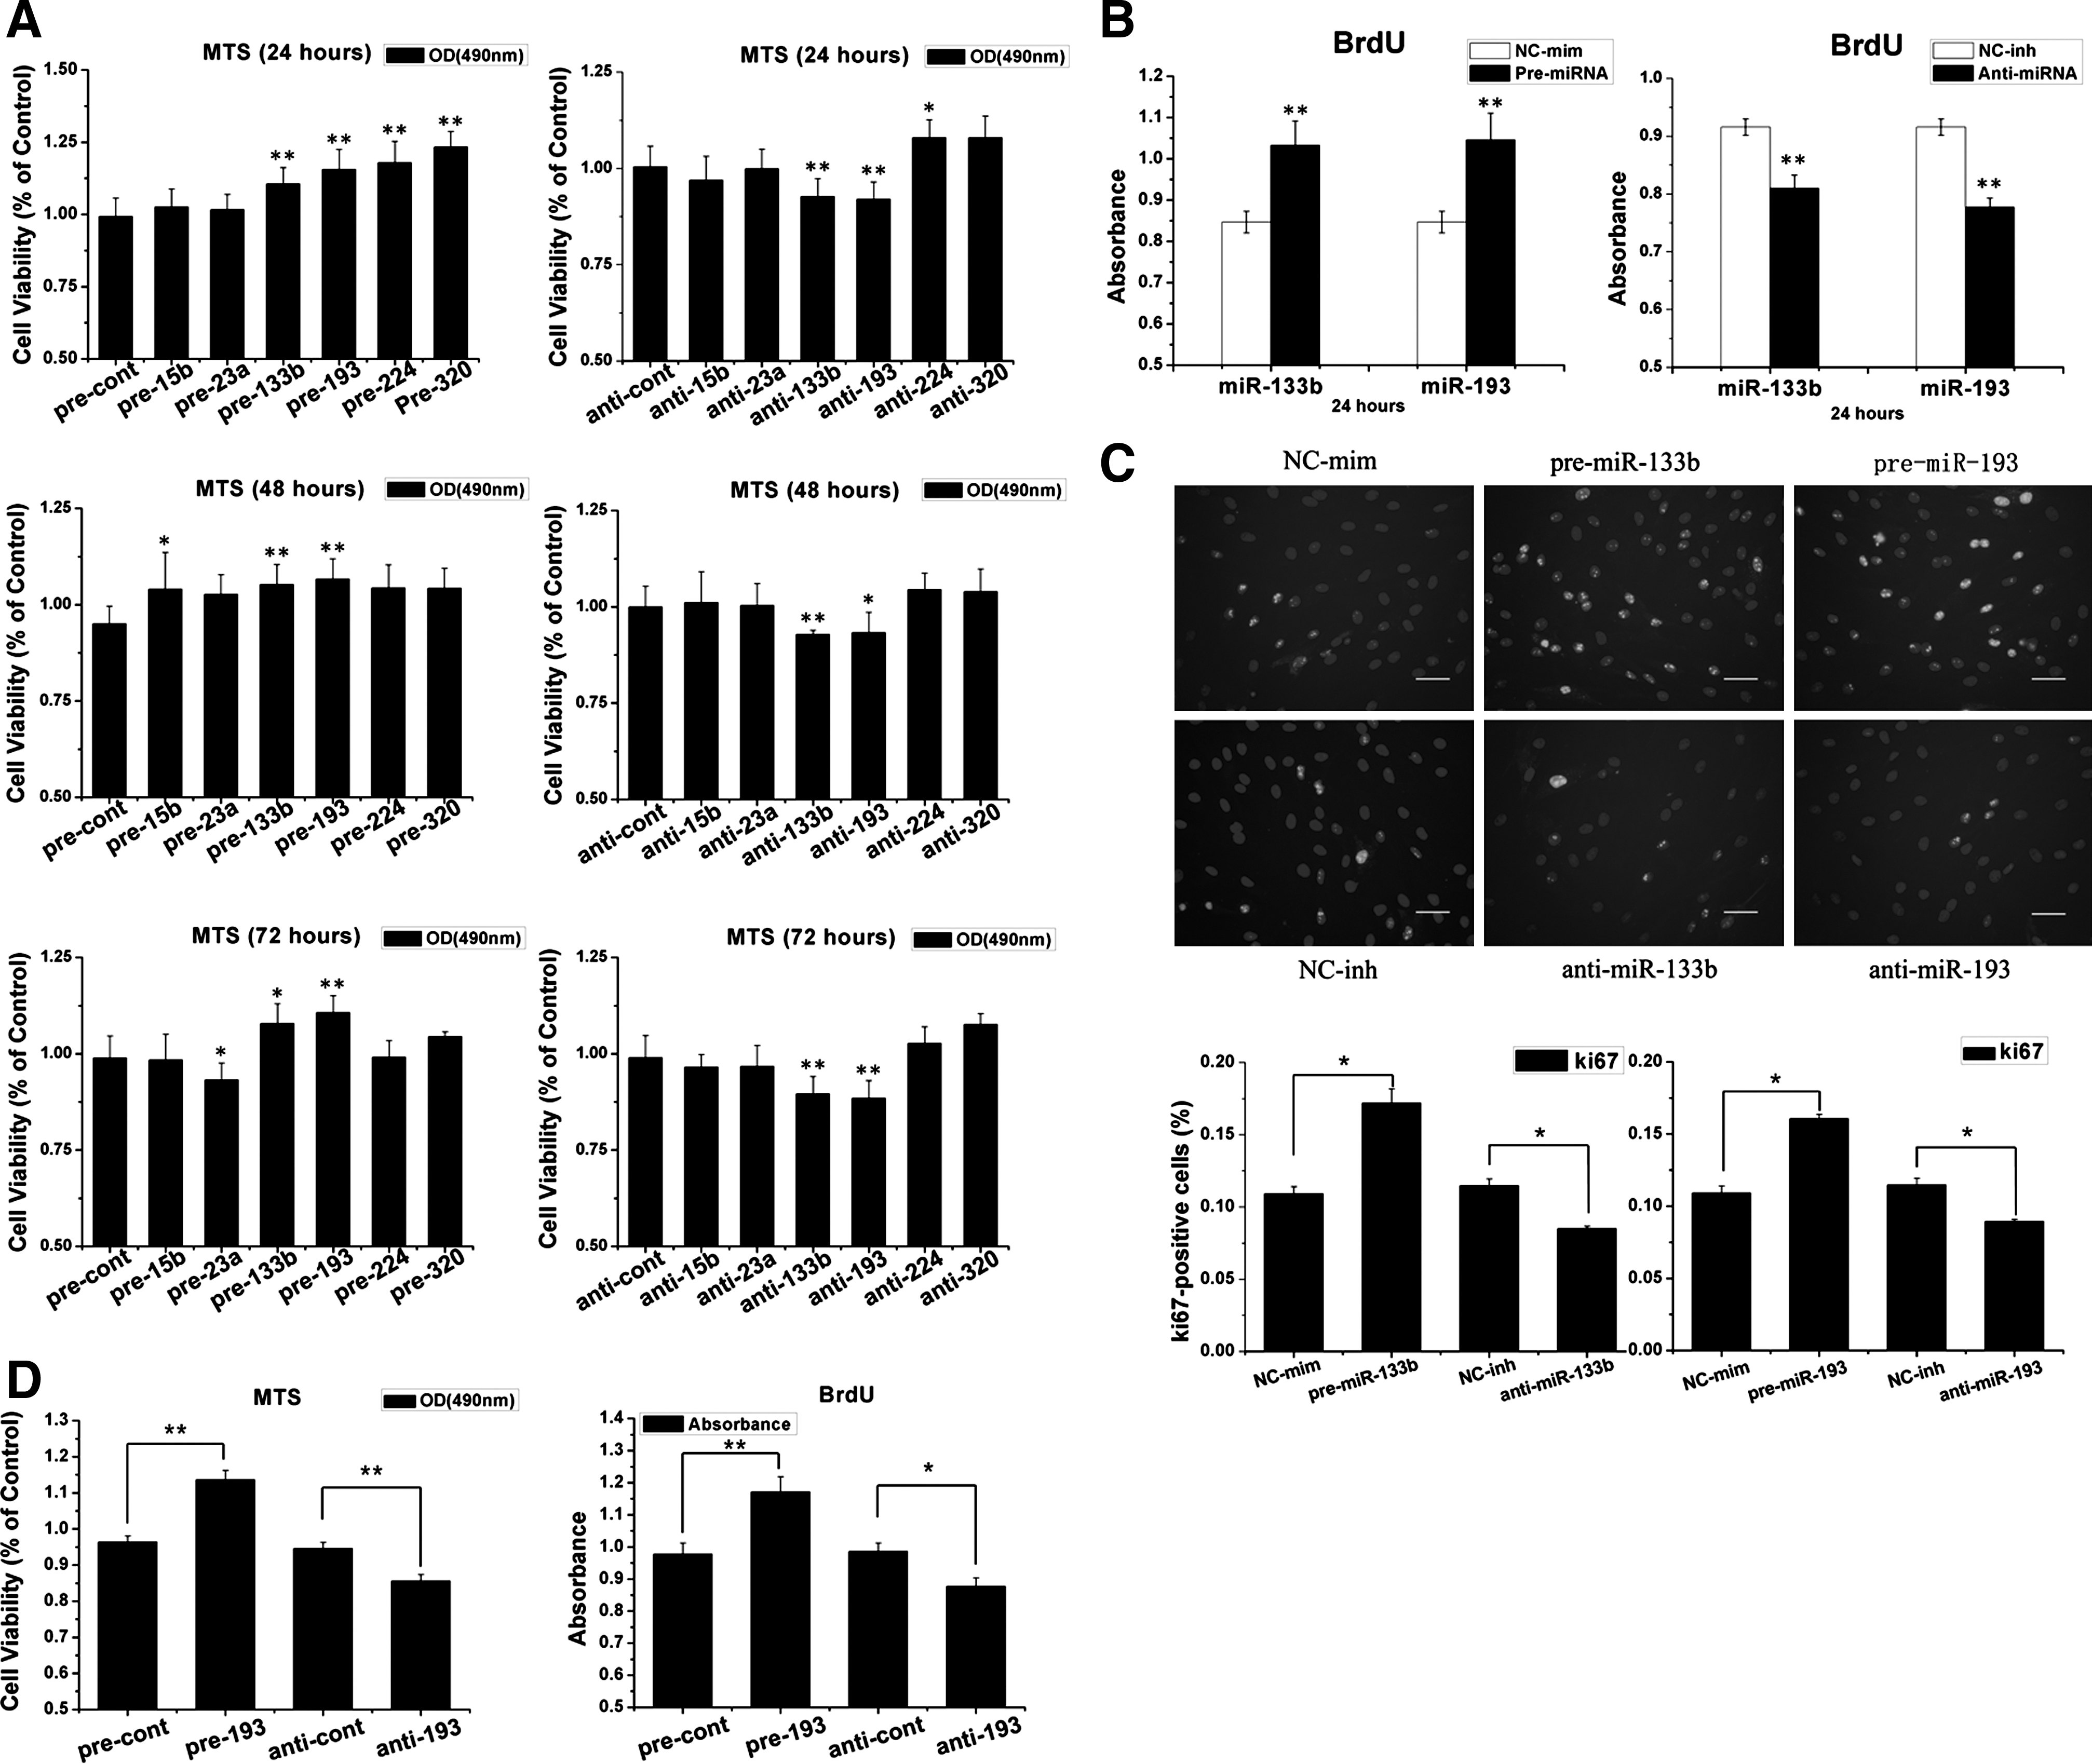
miR-133b/193 regulates MSC proliferation.
To confirm that miR-133b and miR-193 regulate MSC proliferation, we used the BrdU incorporation assay. miR-193 and miR-133b could significantly regulate the proliferation of MSCs (Fig. 3B). Furthermore, we detected Ki-67 protein expression in MSCs 24 h after the transfection by immunocytochemistry. The overexpression of miR-193 and miR-133b could significantly up-regulate Ki-67 expression in MSCs, and inhibiting them decreased Ki-67 expression (Fig. 3C).
To further check whether miR-193 could regulate the proliferation of hMSCs, we transfected the hMSCs with miR-193 and its inhibitor; then, we assessed the proliferation by MTS and BrdU incorporation. We found that pre-miR-193 could promote the proliferation of hMSCs, contrary, inhibit miR-193 would suppress the proliferation of hMSCs (Fig. 3D).
miR-133b and miR-193 cannot regulate MSC apoptosis and differentiation
In-situ TUNEL labeling showed that there was no significant difference in apoptosis levels between the miR-193/miR-133b transfect and control groups (Fig. 4A). To further confirm the role of miR-193 and miR-133b in MSC apoptosis, a flow cytometric assay indicated that there was no significant difference between early [annexin V-fluorescein isothiocyanate (FITC)-positive] and late apoptotic/necrotic (annexin V-FITC/propidium iodide-positive) cells (Fig. 4B). To clarify whether miR-193 could affect the MSCs differentiation, we examined the effects of miR-193 on the expression of Sox2 and Oct4 transcription factors, which are known to be involved in the pluripotency and self-renewal of undifferentiated stem cells [20], and in the expression of genes that are specific to the adipose (CEBP and PPARg) or osteogenic lineage (RUNX2) [21]. As shown in Fig. 4C, the transfected miR-193 in MSCs maintained for 6 days did not show significant differences in the expression of these genes by qRT-PCR. Furthermore, MSCs that were cultured in either an osteoblast- or an adipose-inducing medium for 10 days after transfection with miR-193 or its inhibitor also did not show significant differences of these genes in each of these groups
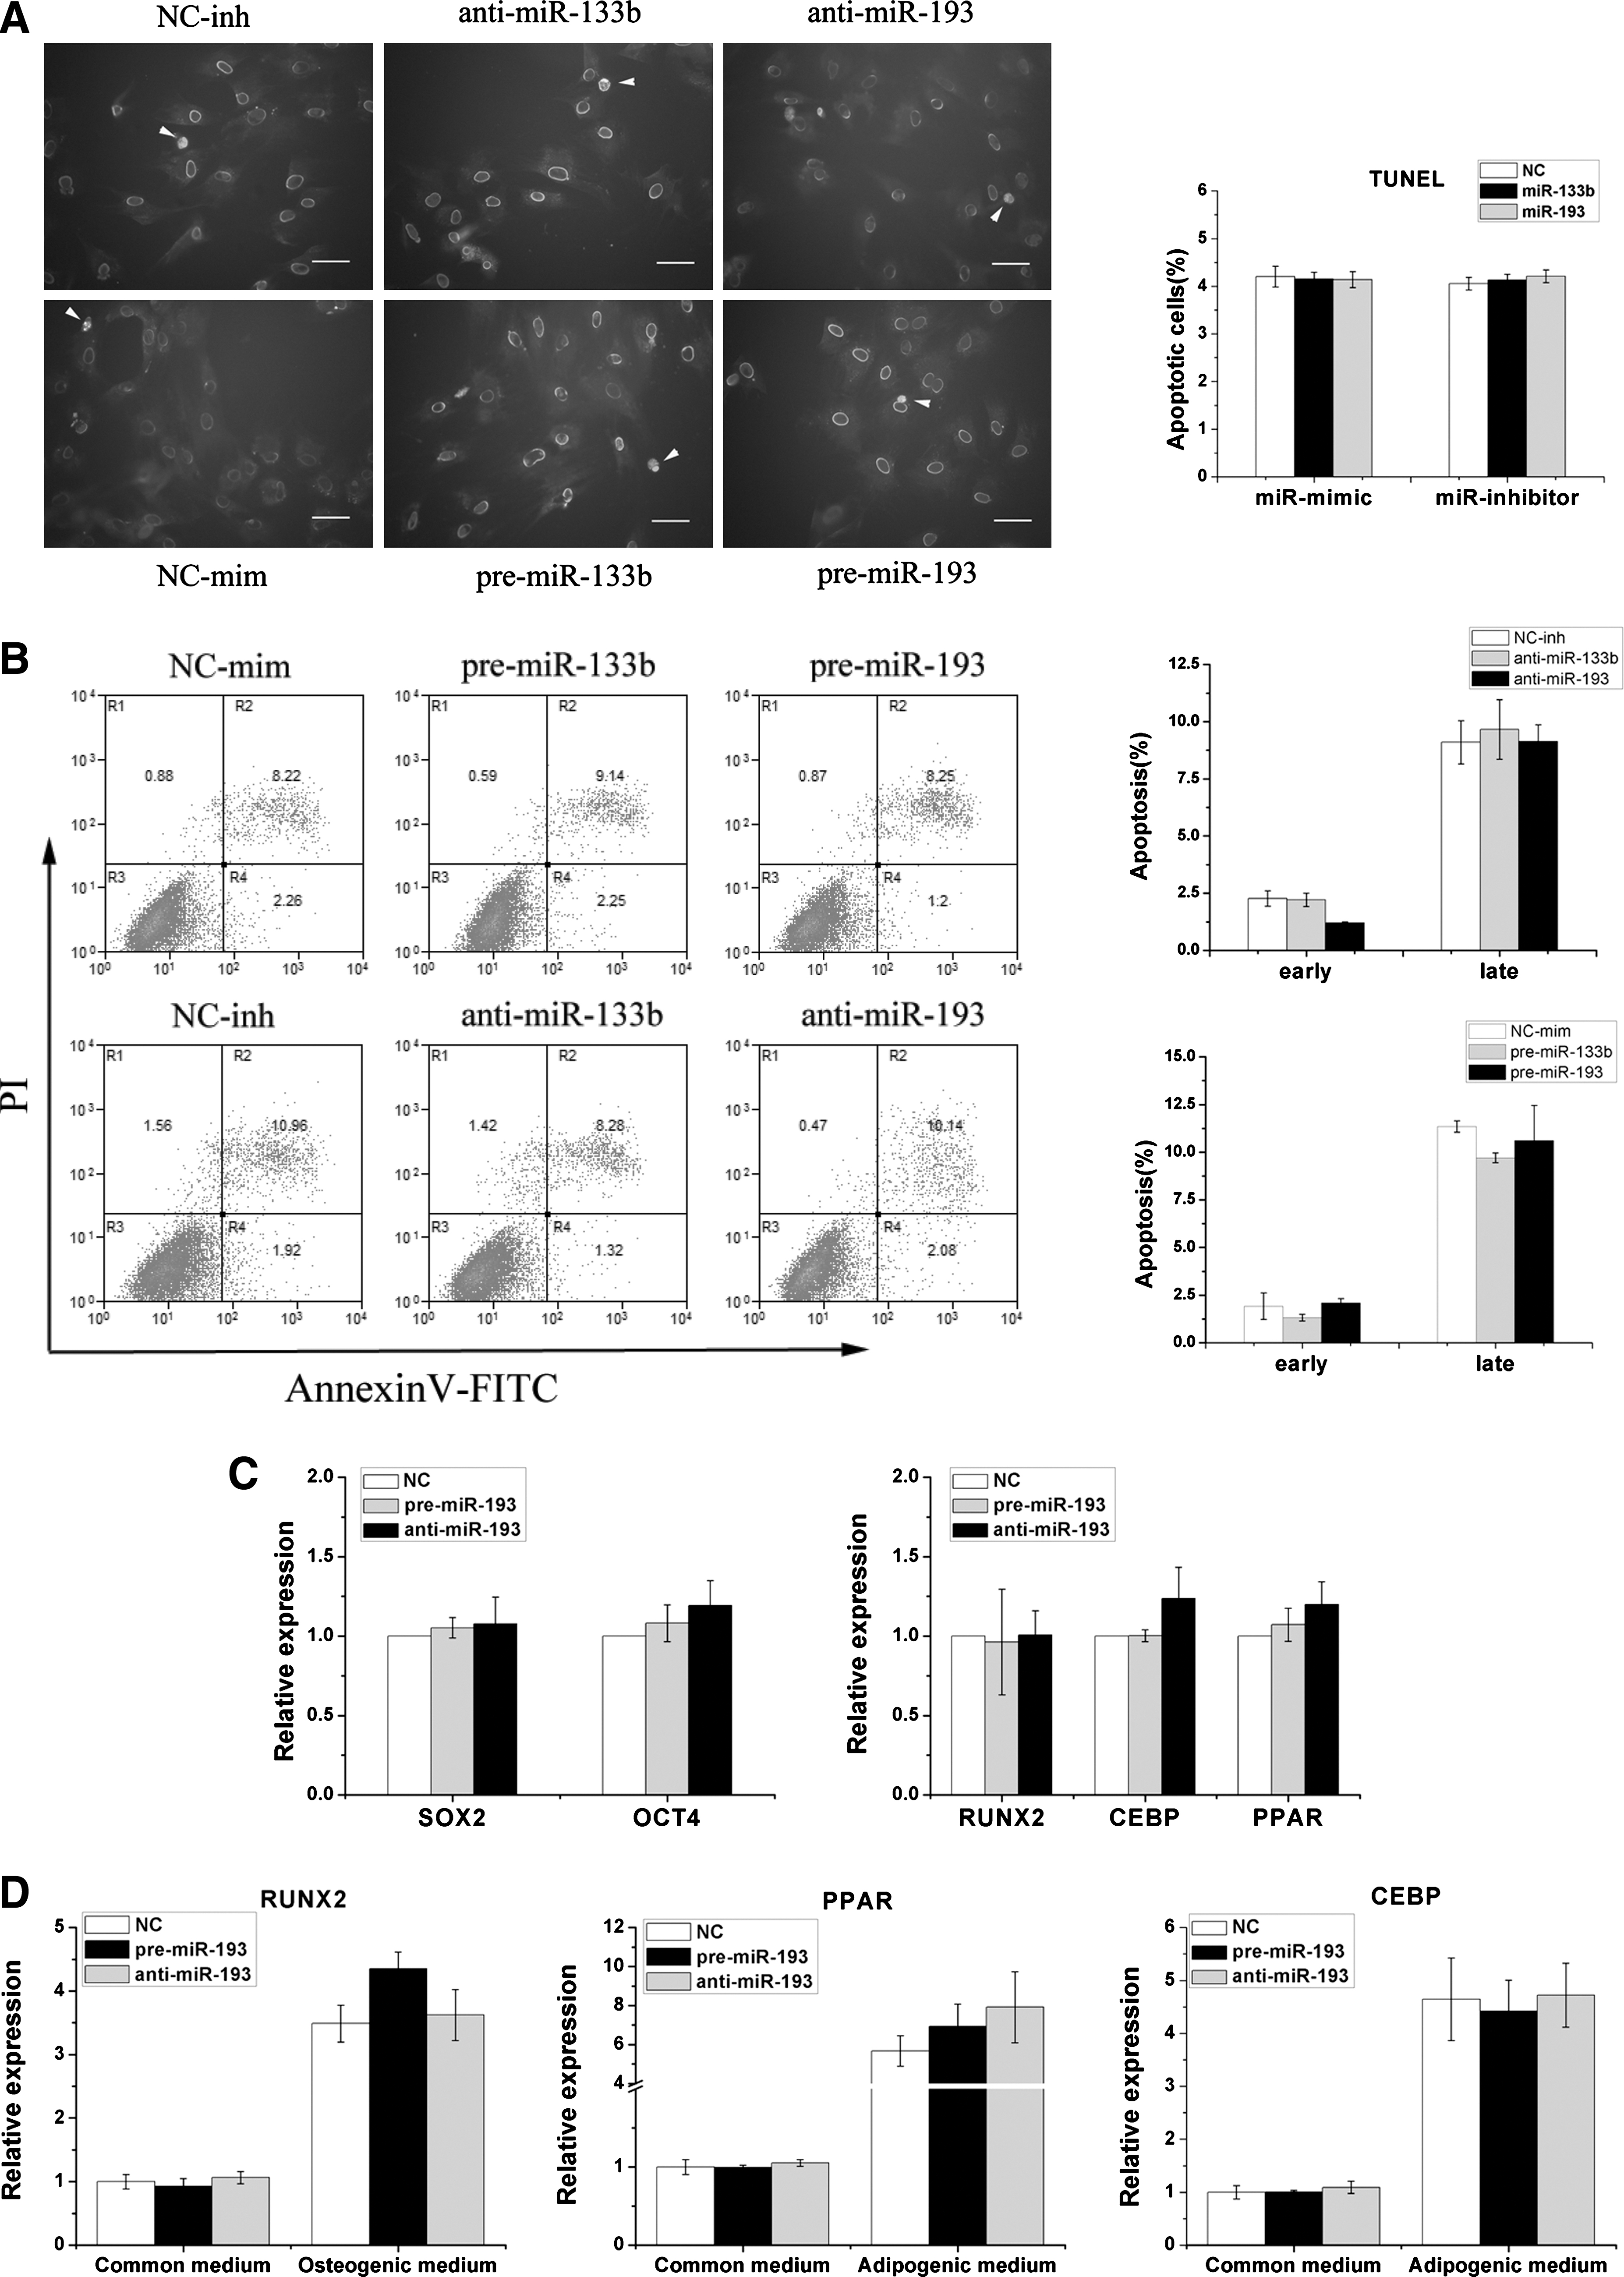
miR-193 cannot regulate MSC apoptosis and differentiation.
Blockade of miRNA inhibits the MSC proliferation induced by LLLI
Compared with nontreated cells, a significant increase in cell viability was observed in MSCs treated with LLLI. The viability of cells treated with LLLI in conjunction with anti-miR-133b and anti-miR-193 transfection was significantly decreased compared with that of cells with LLLI treatment (Fig. 5). These results suggested that miR-133b and miR-193 play crucial roles in cell proliferation induced by LLLI.
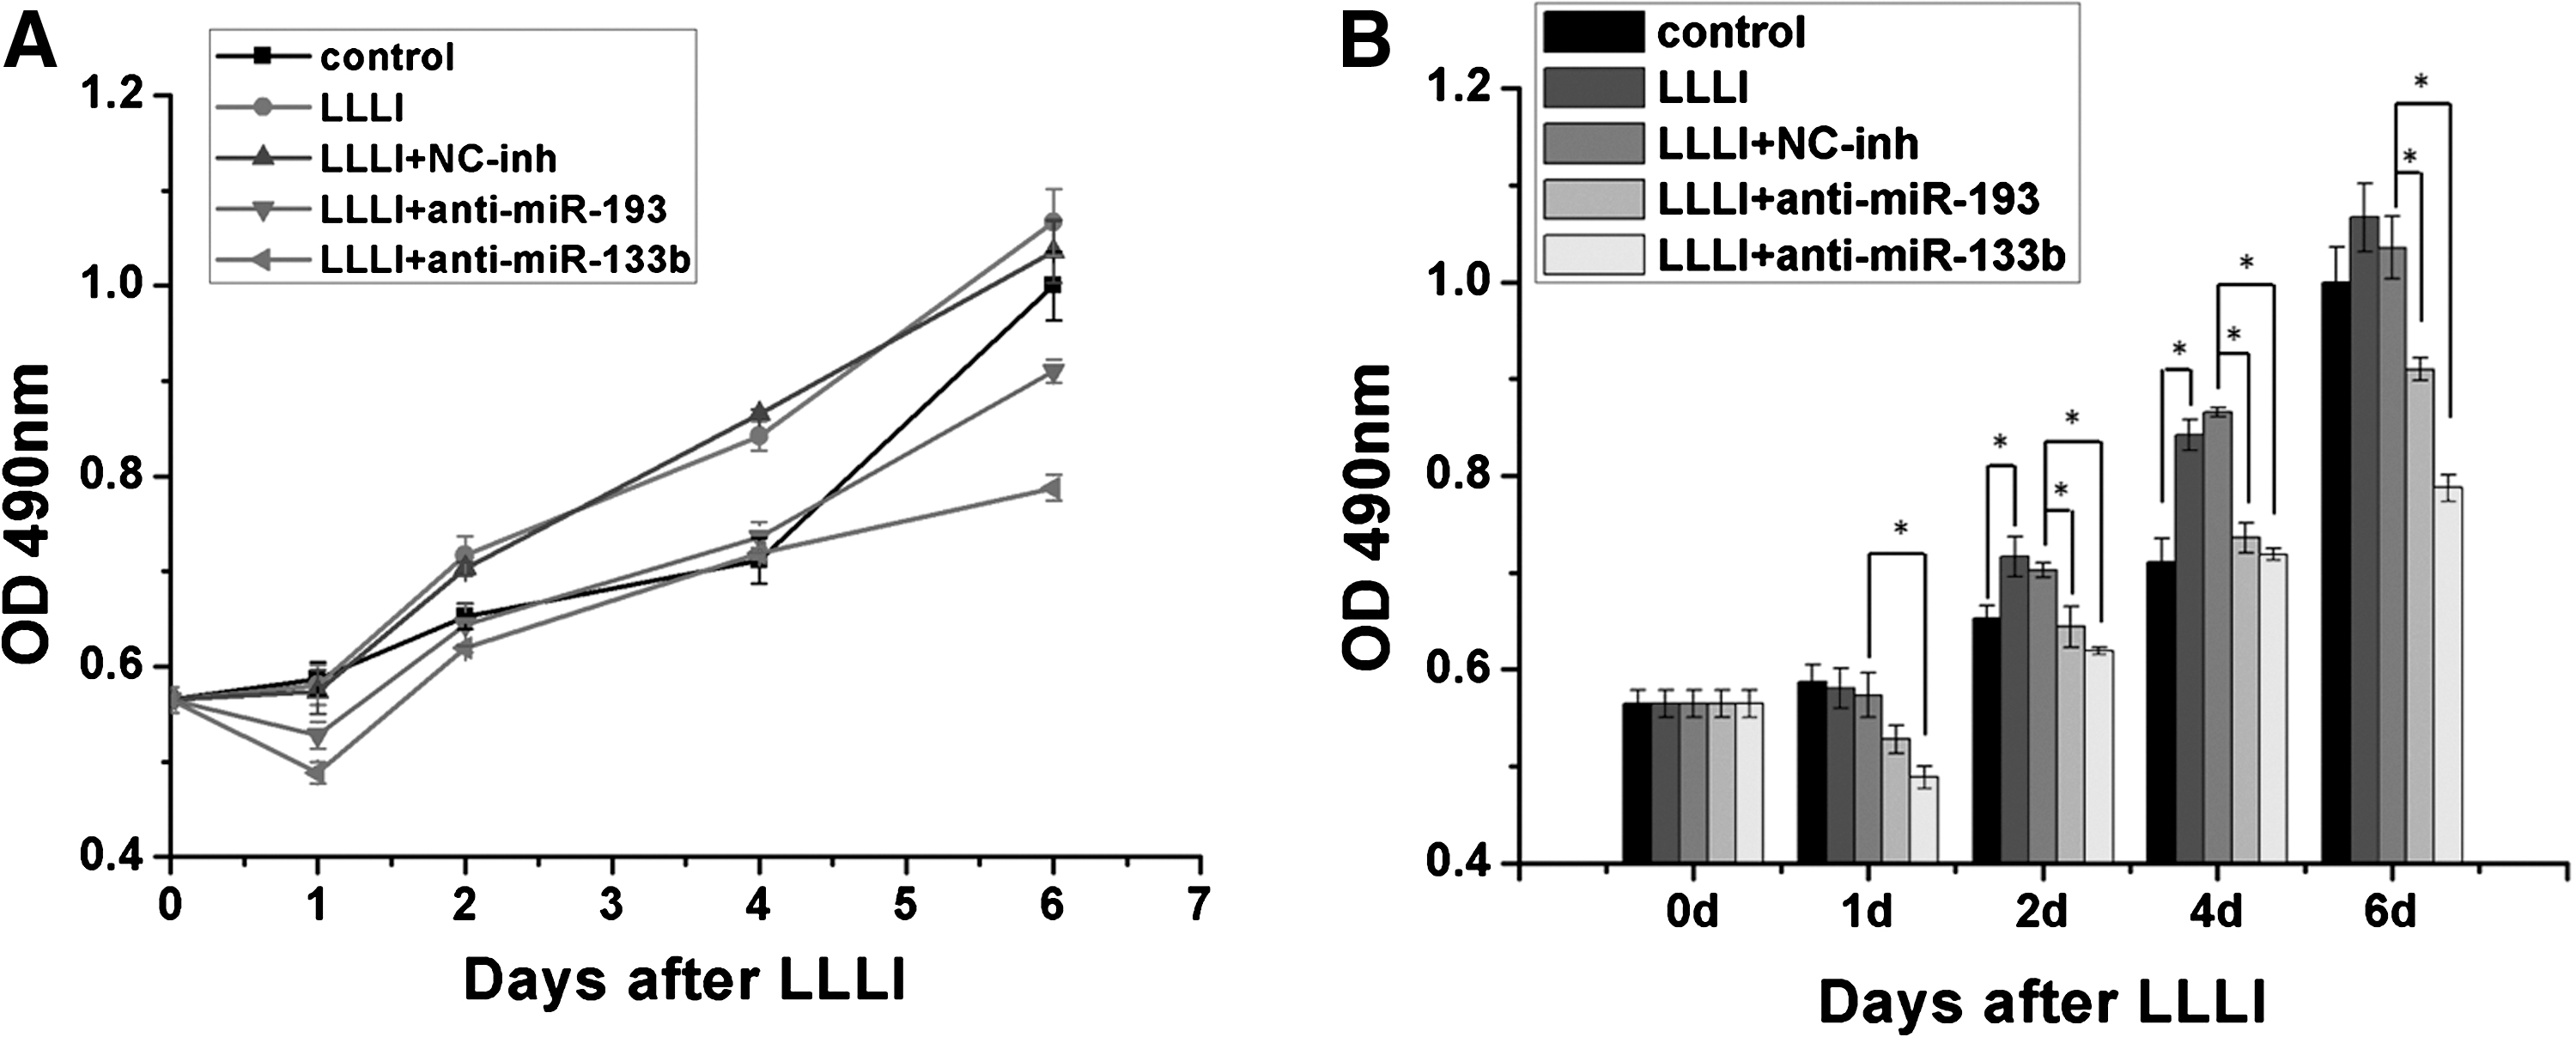
Effects of miR-193, miR-133b inhibitors on LLLI-induced cell proliferation.
miR-193 and miR-133b regulate the expression of cell-cycle genes and the miR-193 target 3 ′UTR of ING5
The overexpression of miR-193 increases the expression of CDK2; inhibiting miR-193 would decrease CDK2 expression (Fig. 6A). In addition, the overexpression of miR-133b regulates the expression of CCND1 and CDK2 (Fig. 6B). These results indicated that miR-193 and miR-133b could regulate the proliferation of MSCs through several cell-cycle genes.
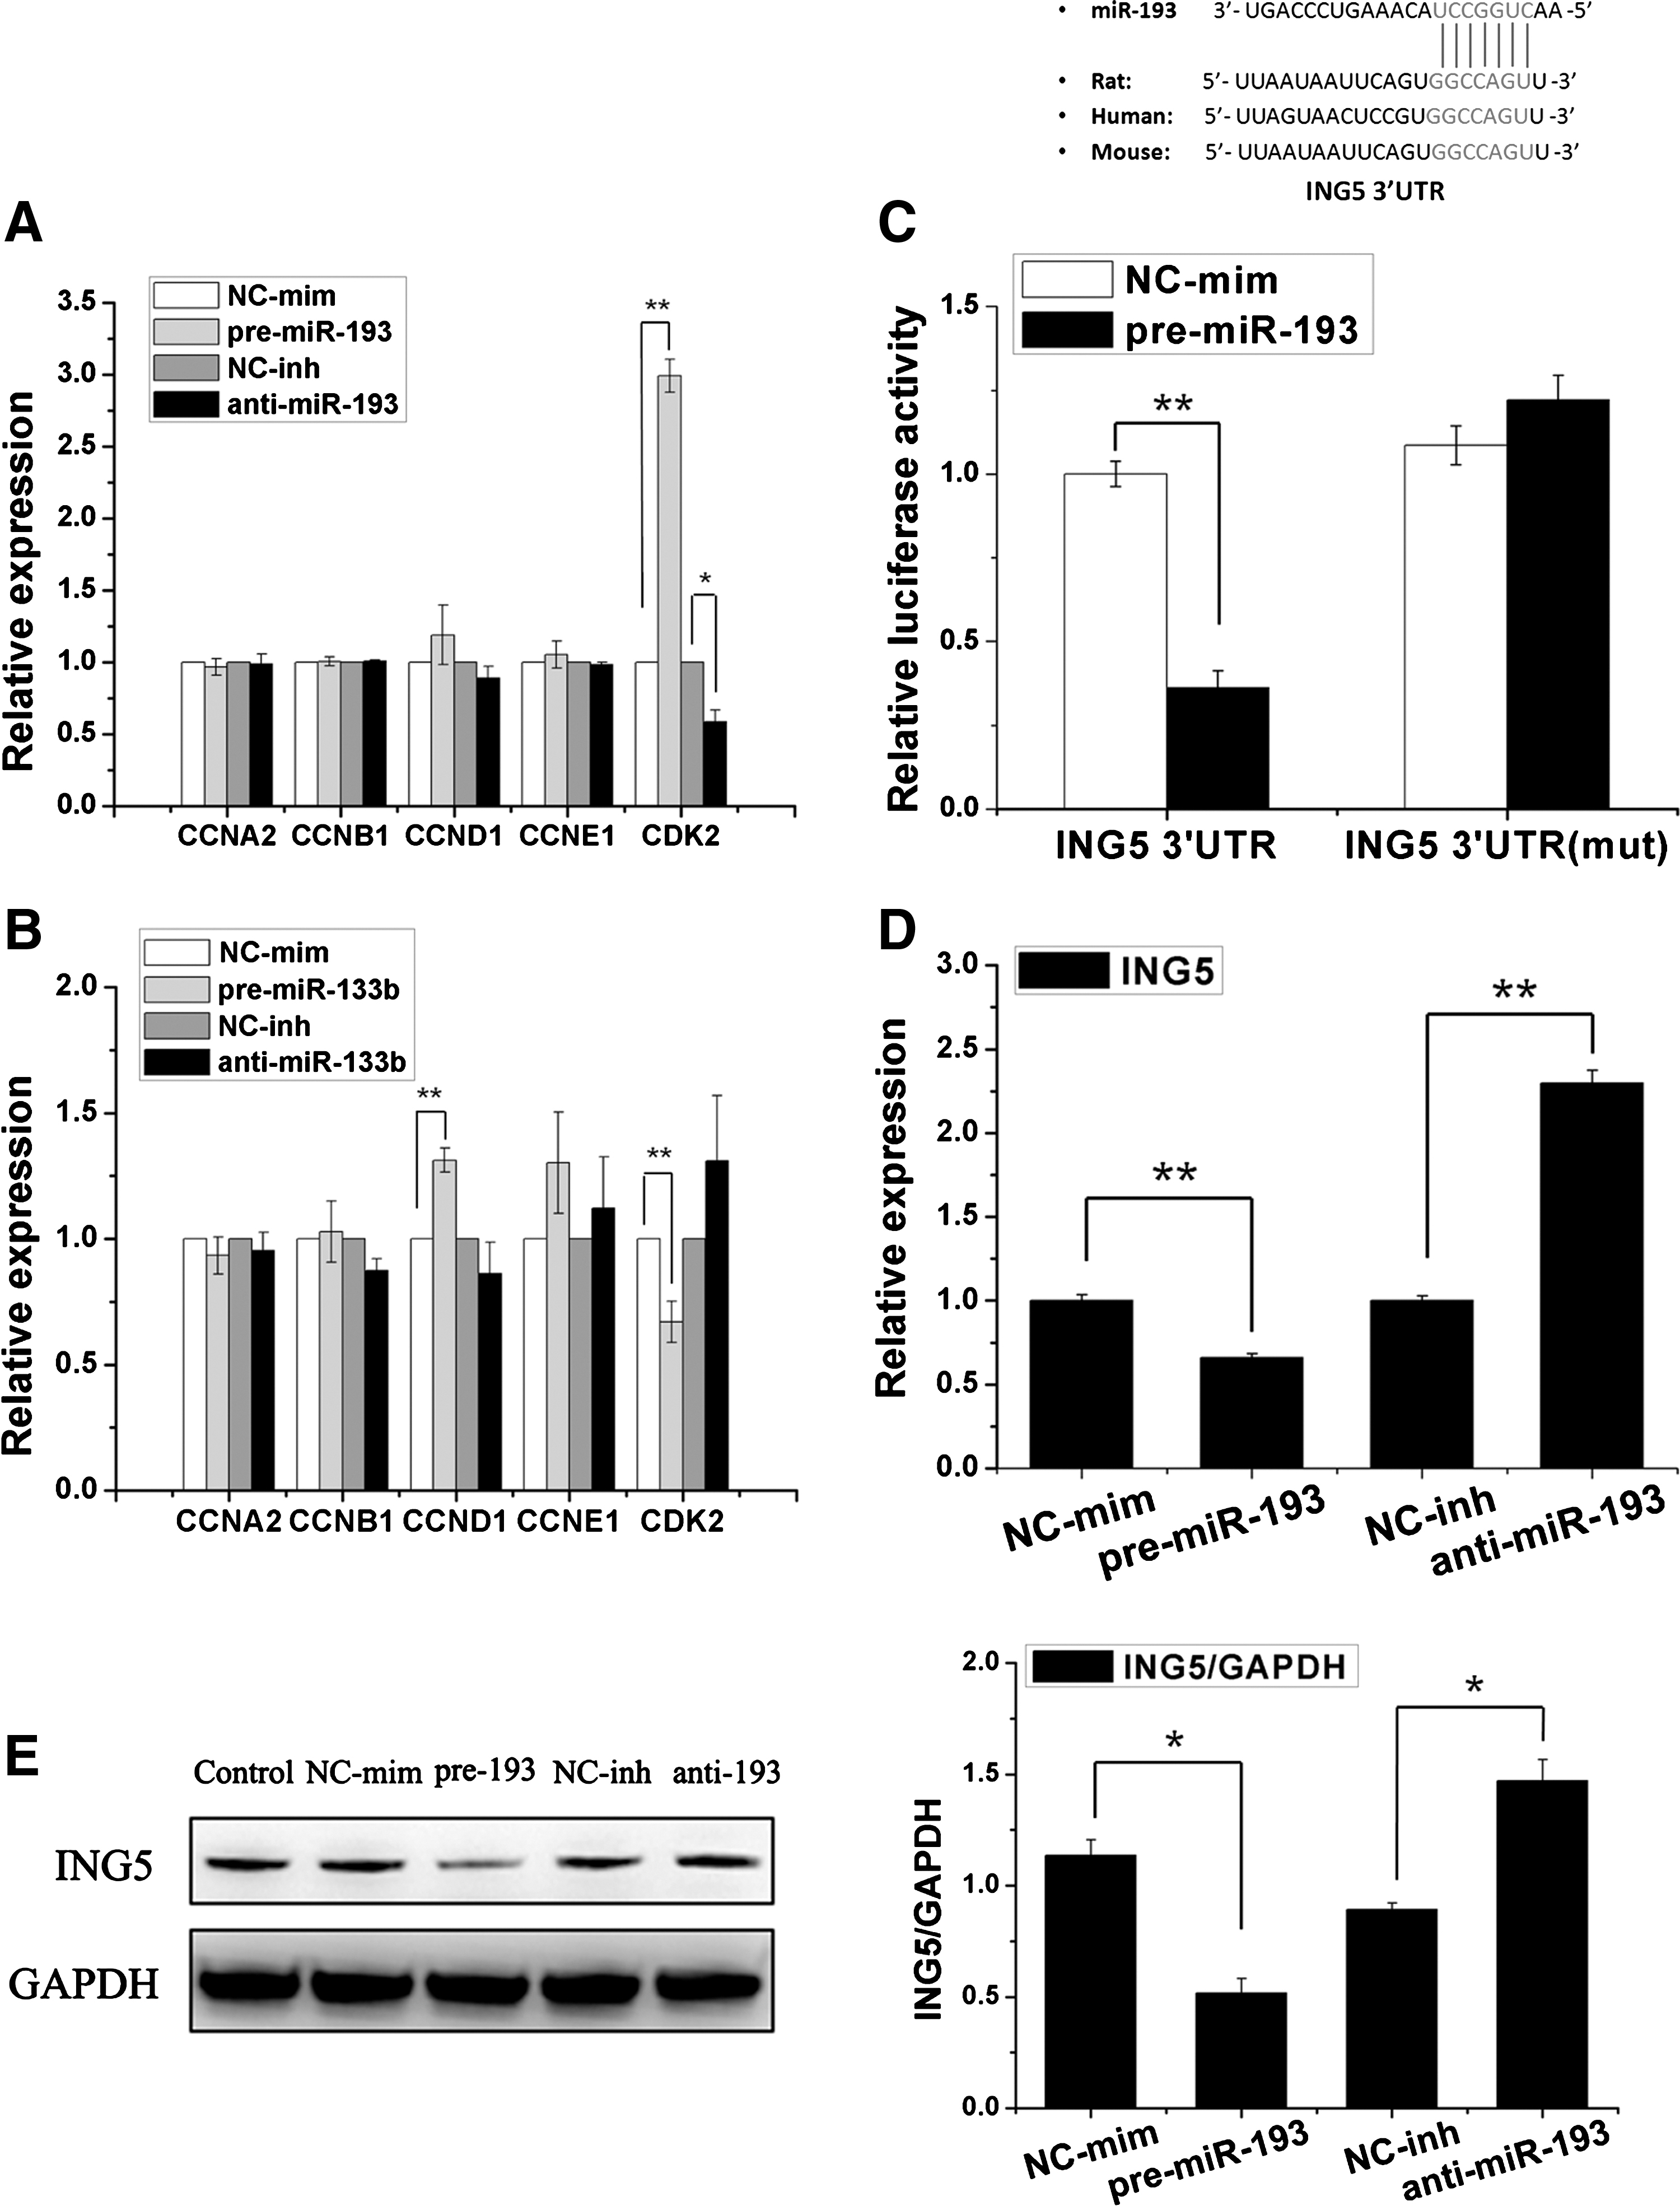
Functional assessment of miR-193/133b.
The conserved target genes of miR-193 were predicted and searched using an miRNA database to further elucidate the function of miR-193-based regulation of MSC proliferation. Among the candidates, ING5 was chosen as an appropriate target of miR-193. The expression of the ING5 protein and mRNA in miR-193-overexpressed MSCs was almost 50% lower than that in control cells 48 h after the transfection. In addition, the inhibition of miR-193 could increase ING5 expression (Fig. 6D, E). According to the miRNA database, the target site in the 3′-UTR of ING5 is conserved in vertebrates and partially complementary to miR-193 (Fig. 6C). The luciferase reporter system was used to test the target site. Compared with the negative control, the luciferase activity for the ING5-WT-transfected cells decreased≈60% in the miR-193 mimic transfections. In addition, the decrease in luciferase activity was rescued by introducing mutations at the seed site in ING5
ING5 down-regulation promotes MSCs proliferation
To detect whether ING5 could regulate the proliferation of MSCs, we used the siRNA of ING5 to inhibit ING5 and assay the proliferation level of MSCs. qRT-PCR and western blotting showed that ING5 was significantly reduced (Fig. 7A, B). BrdU incorporation and MTS assay showed that the inhibition of ING5 could significantly increase the proliferation of MSCs (Fig. 7C, D). Furthermore, we measured PCNA protein expression in the MSCs-Mock and MSCs-siING5 by western blot, and found that the inhibition of ING5 could increase PCNA expression in contrast to the control (Fig. 7A). In addition, we found that the inhibition of ING5 could increase CDK2 expression (Fig. 7E).

Knockdown of ING5 by small interfering RNA promotes MSCs proliferation.
Discussion
Promoting MSC proliferation can facilitate the clinical translation of stem-cell therapy. Some methods have attempted to promote cell proliferation, including cytokines supplement, gene transfection, nanoparticle adhesions, and platelet-rich plasma stimulation [21 –24]. LLLI treatment is a simple, economical, and effective approach that enhances cell proliferation [9]. However, the mechanisms of cell proliferation induced by LLLI are poorly understood [9]. This could be the first study that demonstrates the function of miRNA in LLLI treatment, and provides new insights in LLLI treatment. The major findings were as follows: (i) LLLI induced the activation of miR-193, and was related to cell cycle-associated gene changes; (ii) miR-193 promoted MSC proliferation, but did not affect the level of apoptosis and differentiation; and (iii) the function of miR-193 triggered by LLLI was through the ING5/CDK2 signaling pathway; the inhibited ING5 could promote MSCs proliferation. A proposed model that explains the role of miR-193 in this process is outlined in (Fig. 7F). In addition, we found that miR-193 could regulate the proliferation of hMSCs, and identified a novel approach of using miRNA therapeutics that regulate the proliferation of hMSCs, which may consequently improve efficiency in the application of hMSC for clinical practice.
It was reported that miR-193 could regulate the proliferation of the hepatocellular carcinoma target CCND1 and ETS1 [25]. In a study by Ory et al., miR-193 down-regulation suppressed tumor proliferation through p73 signaling [26]. We found that miR-193 promoted MSC proliferation by regulating the ING5-CDK2 pathway. CDK2 plays an important role in regulating the G1/S transition, and it can phosphorylate Rb and other targets in the progression through the S phase [27]. We found that the change in CDK2 after LLLI treatment for MSCs was correlated with the expression and proliferation of miR-193. In addition, we found that miR-193 could promote MSC proliferation and specifically regulate CDK2 expression. Using bioinformatic analyses, we demonstrated that ING5 was the target of miR-193 according to the following analysis. First, ING5 could directly interact with CDK2, and suppress cell proliferation [28]. Second, ING5 has been demonstrated as interacting with p53, and p53 can indirectly affect CDK2 [27,29,30]. To clarify the association of miR-193 with ING5, we used gain-and-loss-of-function experiments. The overexpression of miR-193 reduced the ING5 protein and mRNA levels in MSCs, and the luciferase reporter assay indicated that ING5 was the direct target of miR-193. ING5 is a member of the ING family; the ING family is involved in multiple cellular functions, such as cell-cycle regulation, apoptosis, and DNA repair [31]. The overexpression of ING5 suppresses cell proliferation and delays progression of the S phase, with down-regulation of CDK2 activity [28]. ING5 has also been shown to physically interact with p53, and to decrease cell populations in the S phase [30]. Furthermore, in our experiment, the knockdown of ING5 can lead to the promotion of the proliferation of MSCs, indicating that ING5 is a possible target of miR-193 in the process of MSCs proliferation.
Furthermore, to elucidate other functions of miR-193, we detected the apoptosis and differentiation level of MSCs after them being miR-193 transfected, and we did not find a difference between the treatment and control groups.
miR-133b is expressed primarily in the skeletal muscle [32]. It has been found to enhance myoblast proliferation by repressing serum response factor (SRF) [33]. We found that miR-133b could be induced by LLLI and could promote MSC proliferation, but we did not observe changes in the SRF gene in MSCs by transfection with miR-133b (data not shown). However, miR-133b could regulate the expression of CCND1 and CDK2. These results indicated that miR-133b may regulate MSC proliferation through complicated signaling pathways; further investigations are needed to elucidate the underlying mechanism of miR-133b.
Several other miRNAs candidates also showed aberrant expression, including miR-15b, -23a, -320, and -224. miR-15b is a member of the miR-15/16 family that has been reported as regulating cell proliferation by targeting the cyclin signaling pathway in some cell lines [34]. miR-23a has been reported as promoting the proliferative potential of a gastric adenocarcinoma cell line through IL6R [35]. miR-320 may affect cell cycles through CDK6 [36] and inhibit the cell proliferation targets transferrin receptor 1 (CD71) [37]. miR-224 has been reported as enhancing the proliferation of transforming growth factor (TGF)-beta1-induced granulosa cells through targeting Smad4 [38]. However, from the gain-and-loss-of-function experiments by the MTS assay, we found that these miRNAs could not affect MSC proliferation.
In summary, LLLI was shown to promote MSC proliferation, and miRNA-193 played an important role in this pro-proliferation effect. The present study provided new insights into the mechanisms of LLLI treatment, and also offered target miRNAs for MSC proliferation.
Footnotes
Acknowledgments
This study was supported by grants from the Natural Science Foundation of China (81070099) and the Fok Ying-tong Education Foundation (121041). The authors thank Drs. Qian Zhang, Bianmei Han, and Chuangjue Cui for the excellent technical assistance rendered.
Author Disclosure Statement
All authors have no conflict of interest.
References
Supplementary Material
Please find the following supplemental material available below.
For Open Access articles published under a Creative Commons License, all supplemental material carries the same license as the article it is associated with.
For non-Open Access articles published, all supplemental material carries a non-exclusive license, and permission requests for re-use of supplemental material or any part of supplemental material shall be sent directly to the copyright owner as specified in the copyright notice associated with the article.