
Abstract
microRNAs are small molecules, about 17–23 nucleotides in length, that act as translational regulators of their target gene. By binding to a target, microRNAs are known to either inhibit translation or induce degradation of the target. Despite the great interest in microRNAs, however, the exact targets of each individual microRNA in different processes remain largely unknown. In this study, we determined that the lymphoid enhancer-binding factor-1 (LEF-1) was expressed during the chondrogenesis of human bone marrow-derived mesenchymal stem cells (hBM-MSCs) and sought to identify a novel microRNA targeting this gene. Through subsequent studies, we have identified, for the first time, one particular microRNA, miR-449a, that recognizes and regulates the expression of LEF-1 in a dose-dependent and sequence-specific manner. In addition, we observed that the inhibition of LEF-1 via miR-449a led to the subsequent repression of Sox 9, which is a well-established regulator of chondrogenesis. Collectively, this study demonstrated that miR-449a directly targets LEF-1, which in turn affects the expression of Sox 9, ultimately leading to the proper regulation of the differentiation and chondrogenesis of human MSCs (hBM-MSCs).
Introduction
M
Small molecules of 17–23 nucleotides in length, microRNAs have been found to be involved in various processes, including cell proliferation [9,10], apoptosis [11,12], immunoresponses [13], protein expression [14 –16], and tissue development [17 –23]. By forming a functional RNA-induced silencing complex [24], microRNAs recognize a complementary sequence of the target genes' 3′ untranslated region (UTR) region and induce the inhibition of gene expression by 1 of 2 mechanisms: mRNA cleavage [25] or translational repression [26]. Currently, only a handful of microRNAs have been experimentally validated as key regulators in chondrogenesis. One study reported that microRNA18a targets the CCN family protein 2/connective tissue growth factor, which is a central player in endochondral bone formation [27]. miR-199a* profoundly inhibited the early stages of chondrogenesis in pluripotent C3H10T1/2 stem cells grown in pellet culture. When treated with miR-199a*, the authors observed a significant reduction in key chondrogenic markers, namely, COMP, Sox 9, and type II collagen, whereas inhibition of miR-199a* increased these genes [28]. In this study, we used high-throughput screening along with experimental validation using semiquantitative and quantitative real-time polymerase chain reaction (PCR) and found that few genes exhibited a distinctive expression pattern during chondrogenesis. Of the genes that did show specific increases during chondrogenesis, we noticed that a critical gene involved in Wnt signaling and known to be a direct target of β-catenin, lymphoid enhancer-binding factor-1 (LEF-1), was distinctively expressed during chondrogenesis. Subsequent studies have confirmed that LEF-1 indeed elicits a significant effect on the overall progression of chondrogenesis, and further study was then carried out to elucidate a novel microRNA that targeted LEF-1. Considering that Wnt signaling in general, along with LEF-1, has been shown to play a critical role in numerous biological pathways and is not solely restricted to chondrogenesis, the identification of a potent microRNA capable of regulating the expression of LEF-1 may allow us to gain a better understanding of human physiology as a whole. Accordingly, this study was conducted to identify a novel microRNA that specifically regulates the expression of LEF-1, which in turn would exhibit a specific function in the overall chondrogenesis process. We identified, for the first time, a microRNA, miR-449a, that specifically targets LEF-1 in a sequence-specific and dose-dependent manner.
Materials and Methods
Primary MSC and chondrosarcoma cell line culture
Bone marrow aspirates were obtained from the posterior iliac crest of 10 healthy adult donors ranging from 20 to 69 years of age under the approval of the Institutional Review Board. MSCs were specifically selected using their natural tendency to adhere to a plastic culture plate surface. After 7 days of culture in Dulbecco's modified Eagle's medium–Low Glucose (DMEM-LG; Invitrogen, Carlsbad, CA) with 10% fetal bovine serum (FBS) and 1× antibiotic–antimycotic solution (Invitrogen), nonadherent hematopoietic cells were removed. The cells were grown to 70% confluence over an average culture period of 10 days, and were then promptly harvested by incubation with 0.25% trypsin/1 mM ethylenediaminetetraacetic acid (Invitrogen) followed by a 3-min centrifugation at 1,300 rpm. This initial batch of cultured cells was designated as passage 1, and the cells were subcultured in a new 10-cm2 dish up to passage 6–7. Two human chondrosarcoma cell lines, SW1353 and JJ, were cultured in Dulbecco's modified Eagle's medium–High Glucose (DMEM-HG; Invitrogen) with 10% FBS and 1× antibiotic–antimycotic solution (Invitrogen).
Chondrogenesis in a micromass culture
The cultured hBM-MSCs between passages 3 and 5 were harvested using the method described previously. For micromass culturing, the cells were resuspended in DMEM-LG with 10% FBS at a specified density of 8,000 cells/μL of media, and 10 μL of the suspended cells was dotted on the center of each well of 24-well plates. A single drop of 1× phosphate-buffered saline (PBS; Thermo Scientific, Logan, UT) was placed in between each well to suppress overdrying of the cells. The cells were then placed in an incubator at 37°C and maintained at 5% CO2 for 2 h to stimulate the adherence of the cells to the plate. For the control group, 1 mL of the control medium consisting of DMEM-HG (Invitrogen), 1× antibiotic–antimycotic solution, 1× insulin transferrin selenium-A (Invitrogen), and 50 μg/mL of ascorbic acid (Invitrogen) was used, while the chondrogenic medium contained 10 ng/mL of TGF-β3 (R&D systems, Minneapolis, MN) as well. The culture medium was changed every 2–3 days. All experiments were carried out in triplicate using hBM-MSCs from 3 donors.
Validation of gene expression at the mRNA level
The total RNA from hBM-MSCs was isolated using RNAiso Plus reagent (Takara, Shiga, Japan) according to the manufacturer's instructions. Briefly, 1 mL of the RNAiso Plus solution was added repeatedly with a pipette to the collected cells to completely dissolve the cells. The cells were left at room temperature for 10 min, 200 μL of chloroform was added, and the resulting mixture was vortexed until the solution became milky. The solution was then kept at room temperature for 5 min, after which it was centrifuged at 13,000 rpm for 15 min at 4°C. The top liquid layer was then transferred to a new tube, and 500 μL of 100% isopropanol was added. After brief vortex-mixing, the solution was kept at room-temperature for 10 min, and was then promptly centrifuged at 13,000 rpm for 10 min at 4°C. The supernatant was removed without disturbing the RNA pellet, which was washed with cold 70% ethanol via centrifugation at 10,000 rpm for 5 min at 4°C. Finally, the RNA pellet was resuspended in 30 μL of diethylpyrocarbonated-water. The overall quality and concentration of each RNA sample was confirmed using spectrophotometry. For cDNA reverse transcription, an Omniscript Reverse-Transcription Kit (Qiagen, Hilden, Germany) was used. The primer sets for the amplification of specific genes, obtained from Gene Bank and/or the manufacturer, are listed in Table 1. GAPDH was used to normalize the relative expression intensity of all genes for semiquantitative reverse transcription-polymerase chain reaction (RT-PCR).
LEF-1, lymphoid enhancer-binding factor-1; S, sense strand; AS, antisense strand.
In addition to RT-PCR, quantitative real-time PCR was carried out using Takara Ex Taq™ (Takara) according to the manufacturer's instruction. Quantitative real-time PCR was performed using an ABI7500 real-time machine by Applied Biosystems (ABI, Carlsbad, CA). The primers used for quantitative real-time PCR are shown in Table 2. All primers were purchased from Bioneer (Daejeon, South Korea). SYBR fluorescence was detected during the annealing/extension phase, and all real-time PCR products had a final size of approximately 100 bp.
Microarray analysis
The total RNA of cultured hBM-MSCs was isolated by RNAisoPlus (Takara) according to the manufacturer's protocol. The overall quality of the total RNA was validated using spectrophotometry. For cDNA expression, an Affymetrix GeneChip® Human Gene 1.0 ST Array (Affymetrix, Santa Clara, CA) was used. Pearson's correlation analysis was performed to examine genes specifically expressed in chondrogenesis-induced hBM-MSCs. A strict cutoff threshold was implemented to screen for genes with at least a 2-fold difference in the expression intensity.
Western blot analysis
A lysis buffer (Promega, Madison, WI) with 10 μg/mL of protease inhibitors and phosphatase inhibitors was used to prepare whole-cell lysates. Clarified lysates from samples centrifuged at 13,000 rpm at 4°C for 15 min were quantified using a modified Bradford assay. Aliquots of 30 μg of the cell lysates were separated in 10% sodium dodecyl sulfate–polyacrylamide gel electrophoresis under reducing conditions. The samples were promptly transferred to a polyvinylidene fluoride membrane (Amersham Pharmacia, Piscataway, NJ) for 90 min at 50 V in a transfer buffer containing 1.4% glycine, 20% methanol, and 25 mM of Tris-HCL (pH 8.3). For blocking, 1% skimmed milk in 1×TBST (50 mM Tris-HCl, 150 mM NaCl, 0.1% Tween-20) was used for 1 h at room temperature. LEF-1 (Cell Signaling, Danvers, MA) and Sox 9 (Santa Cruz, Santa Cruz, CA) primary antibodies were used at concentrations of 1:10,000 and 1:5,000, respectively, overnight at 4°C. Following repeated washing with 1×TBST, the membranes were incubated with appropriate horseradish peroxidase-conjugated secondary antibodies (Amersham Pharmacia). The β-Actin antibody (Santa Cruz) was used for internal control.
Overexpression and inhibition of microRNA and siRNA for LEF-1
For functional analysis of the screened microRNA and its effect on the target gene, LEF-1, the identified microRNA was overexpressed via microRNA-mimic purchased from Genolution (Genolution, Seoul, South Korea). The purchased microRNA mimic was prepared in a double-strand form, which is processed by endogenous mechanisms once transfected, ultimately yielding mature microRNAs. miR-1 was used as a positive control, as it is known to repress its target gene twinfilin-1. For a negative control, scrambled microRNA was used. The exact sequences of the microRNA mimics used were obtained from the microRNA database (miRanda), and the duplex sequences are shown in Table 3. The constructed microRNAs were transfected with 4 μL of lipofectamine 2000 (Invitrogen) into the human chondrosarcoma cell lines, SW1353 and JJ, according to the provided instructions. For transfection of microRNA into hBM-MSCs, few modifications had to be made, as hBM-MSCs are generally more difficult to transfect and show a lower ability to differentiate from the stress induced during the transfection procedure. Briefly, 7 μL of lipofectamine 2000 (Invitrogen) was used for transfection into hBM-MSCs, and the cells were cultured in growth media for an additional day post-transfection to induce stabilization.
We used 2′-O-methyl RNA with sequence complementary to the microRNA (ST Pharm Co., Seoul, South Korea) to repress the activity of the selected microRNA. For the inhibition of the microRNA, only the antagomir of miR-449a, which showed significant repression of LEF-1, was used. The antagomir was modified by attaching a FAM fluorescent dye on the 5′ end for visualization after transfection, and the exact sequence of the miR-449a antagomir was 5′ ACCAGCUAACAAUACACUGCCA 3′. For siRNA transfection, a prevalidated siRNA duplex with fluorescein isothiocyanate attached to the 5′ end for visualization was used. The exact sequence of the siLEF-1 was 5′ GUUAUUCCGGGUACAUAAU 3′, and the exact sequence of the siControl was 5′ CCUACGCCACCAAUUUGGC 3′.
Reporter vector construction
The 3′ UTR of the LEF-1 gene was cloned into the XbaI site of a pGL3 Luciferase Reporter Vector with a SV40 promoter (Promega) and was called pGL3-LEF-1-UTR. The construct was then cotransfected with the microRNA mimic in SW1353 and JJ cell lines to evaluate the efficacy of the selected microRNA based on its degree of luminescence. The primer sequences used for LEF-1 3′ UTR cloning are as follows, with the underlined regions marking the sequence for the XbaI recognition site.
Sense: 5′-ATGC
Antisense: 5′-ATGC
Safranin-O staining of monolayer chondrogenic cells
Proteoglycan synthesis of chondrogenic cells was visualized using safranin-O staining. Chondrogenic cells in 24-well plates were briefly washed twice with PBS, and then 200 μL of 1% safranin-O staining solution dissolved in 1% acetic acid was added and incubated for 3 h to stain. The cells were then repeatedly rinsed with 1% acetic acid. The safranin-o stained cells were destained with 10% cetylpyridinium chloride monohydrate, and the absorbance value was measured at a wavelength of 490 nm.
Statistical analysis
The statistical analysis for the results of the staining test and the gene expression pattern obtained from hBM-MSCs was carried out using the Student's t-test, and the data are expressed as the mean±standard deviation. Values of P<0.05 were considered to be statistically significant.
Results
Chondrogenesis of hBM-MSCs using micromass cultures
Chondrogenesis of the hBM-MSCs acquired by the previously mentioned methods was induced by micromass culturing. During the 14-day differentiation process, the total RNA was collected on days 7, 10, and 14, and the expression profiles of key chondrogenic marker genes, such as type II collagen and Sox 9, along with the key hypertrophic marker gene type X collagen, were observed using semiquantitative RT-PCR (Fig. 1A). Type II collagen and Sox 9 showed progressively increasing expression, indicating the proper progression of chondrogenesis, while the hypertrophic marker type X collagen showed relatively unchanged expression. To better assess the overall expression profile of genes that showed the most distinctive expression patterns during the chondrogenesis of hBM-MSCs, high-throughput screening with microarray techniques was used. hBM-MSCs from 3 separate individuals were collected and cultured in either the control medium without TGF-β3 or in the chondrogenic medium with TGF-β3 for 10 days. From these samples, microarray analysis was carried out to screen for the genes that were significantly increased only in the differentiated group throughout all 3 donors. The scatter plot and quantitative real-time data show the distinctive expression of LEF-1 in the differentiated group (Fig. 1B, C). Sox 9 and aggrecan, 2 distinctive marker genes that should increase upon the progression of chondrogenesis, were expressed at a significantly higher intensity compared to the day 0 and 10 control hBM-MSCs, further confirming the efficacy of chondrogenesis induced by micromass culturing (Fig. 1D, E). LEF-1 exhibited a dramatic increase specifically in chondrogenesis-induced hBM-MSCs. All experiments have been carried out in triplicate using hBM-MSCs derived from 3 separate donors.

Chondrogenesis of human MSC and identification of LEF-1 as distinctively expressed gene. Human MSCs were induced into chondrogenesis in micromass culture and the expression profiles of key chondrogenic marker genes were observed using semiquantitative PCR
LEF-1 plays a significant role in the progression of chondrogenesis
Of the 418 genes from the initial high-throughput screening whose expression profiles were considered significant, we examined the established ontology of each identified gene for possible implications for the overall progression of chondrogenesis. Briefly, an Affymetrix GeneChip Human gene 1.0 ST Array was used to identify the genes that had altered expression profiles from the controls during the differentiation process. For statistical analysis, Pearson correlation was performed to acquire statistically meaningful candidates. Of the genes, LEF-1 was distinguished from the rest of the genes for its known role in various developmental processes and, more specifically, its role in Wnt signaling. For experimental validation of these expression patterns, we performed quantitative real-time PCR to confirm the expression data obtained from the microarray and found that the 2 results were completely aligned (Fig. 1F).
Based on previous studies that reported the significance of Wnt signaling in the chondrogenesis of hBM-MSCs, we decided to focus specifically on LEF-1, which is a crucial mediator of Wnt, and more specifically, β-catenin signaling. Microarray data indicated that LEF-1 was expressed at 10.4-fold higher abundance in day 10 chondrogenesis-induced hBM-MSCs compared to the day 10 control, which was the sixth highest expression difference among the screened genes (Table 4).
After confirming the accuracy of the high-throughput data with quantitative real-time PCR results, we then moved on to further evaluating the specific effect of LEF-1 in chondrogenesis by performing an inhibition experiment. Human BM-MSCs were transfected with 100 nM of either siControl (purchased from Bioneer) or siLEF-1 and were cultivated in a chondrogenic medium for a period of 10 days. The total RNA was harvested at specific time points: days 0, 1, 3, 5, 7, and 10. RT-PCR was carried out to monitor the efficacy of LEF-1 on the chondrogenesis of human BM-MSCs (Fig. 2, day 10 data not shown because the gene expressions showed rapid recovery). When LEF-1 was inhibited, it was clearly evident that genes involved in differentiation, including type II collagen and Sox 9, were repressed.
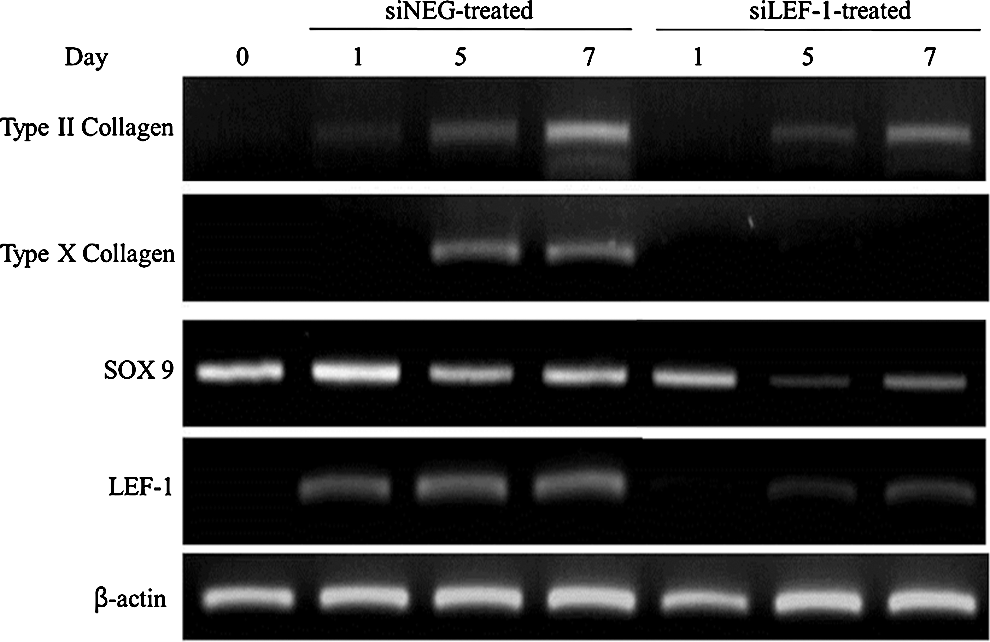
Effect of LEF-1 on chondrogenesis of BM-MSCs. siLEF-1 effectively inhibited LEF-1 expression up to day 7, which was then shown to be recovered by day 10 (data not shown). Two genes involved in differentiation, Col2a1 and Sox 9, and a gene involved in maturation, type X collagen, were monitored.
Screening of microRNAs specifically targeting LEF-1 during the chondrogenesis of hBM-MSCs
After confirming a significant expression pattern of LEF-1 during the early phase of chondrogenesis, we then aimed to identify the microRNA that specifically controls the expression of LEF-1. Using the 2 most-widely used microRNA-target prediction search engines, TargetScan (
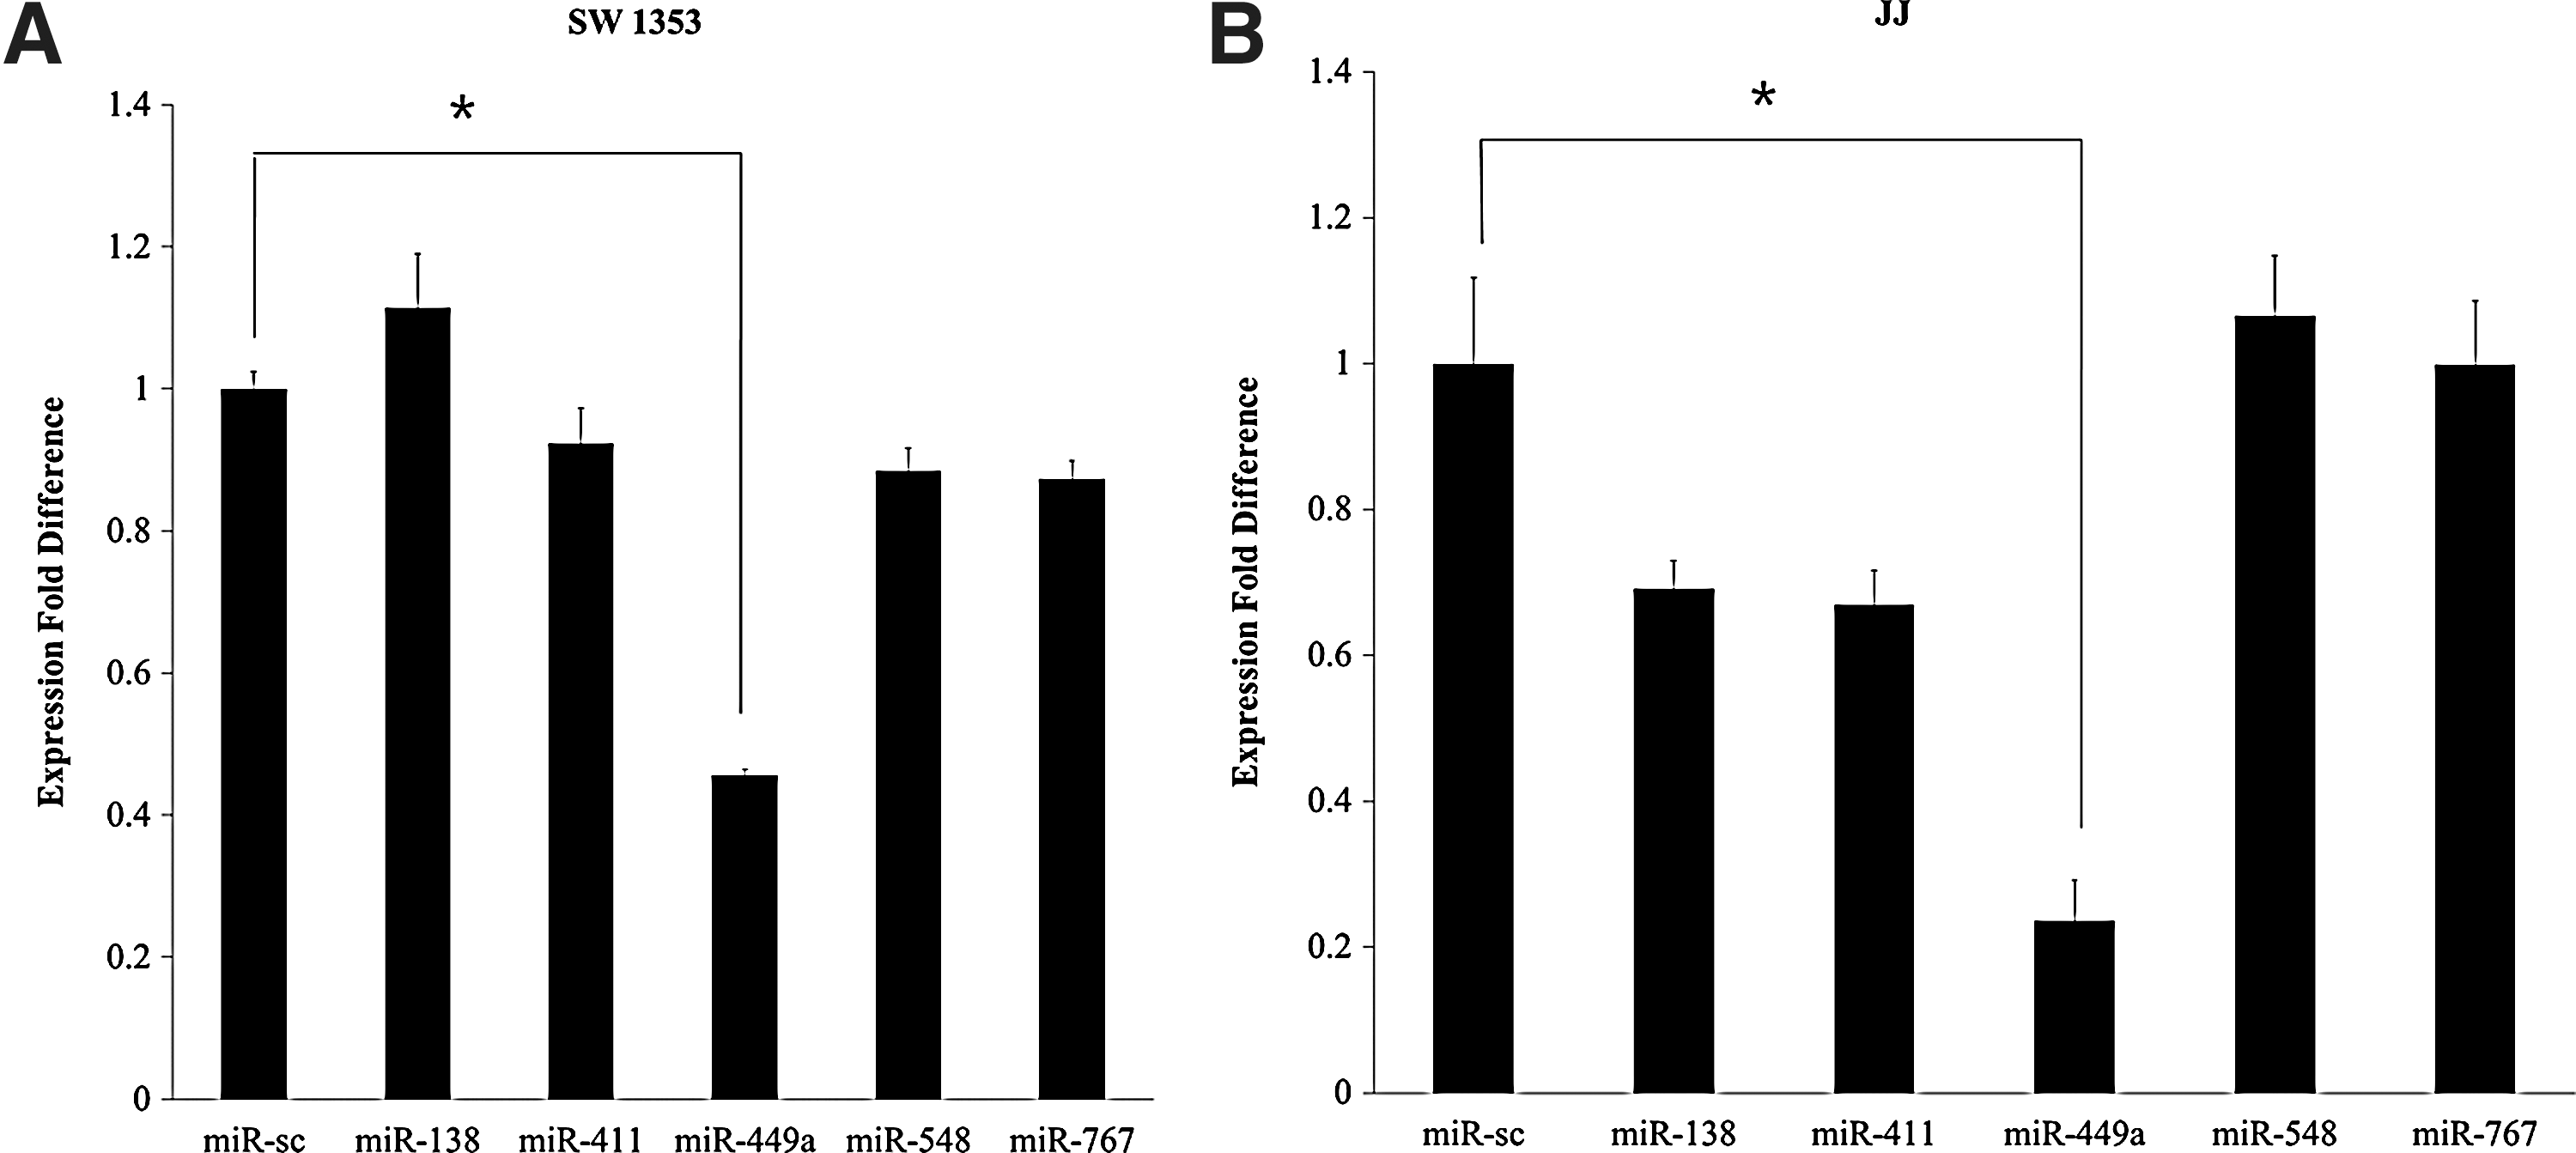
Screening of potential microRNA specifically targeting LEF-1. microRNAs highly predicted by both TargetScan and miRanda to target LEF-1 were selected and were individually transfected into 2 human chondrosarcoma cell lines, SW1353
miR-449a directly targets LEF-1 via binding to the 3′ UTR
To better quantify the effect of the sequence-specific regulation of miR-449a on LEF-1, the LEF-1 UTR was cloned into a pGL3-control plasmid (Fig. 4A, B). As expected, the luciferase activity showed a drastic decrease of approximately 70% in the Hela cell line upon transfection with miR-449a (Fig. 4C). In addition, this reduction of luciferase activity occurred proportionally in a dose-dependent manner against miR-449a, further strengthening the notion that miR-449a targets LEF-1 (Fig. 4D).

miR-449a specifically binds to the seed site within 3′ UTR of LEF-1. A reporter assay utilizing pGL-3 LEF-1 UTR vector cotransfected with 50 nM of miR-449a displayed a sequence-specific reduction of LEF-1 mediated by miR-449a. A schematic diagram of the miR-449a binding to the endogenous LEF-1 mRNA
Following such observations, we then aimed to identify the exact seed site of miR-449a and LEF-1. The entire 3′ UTR of LEF-1 and the expected miR-449a-binding seed site were individually cloned into the pGL3 reporter vector, while a construct with a seed sequence-specific mutation was also constructed to determine the sequence-specific effect of miR-449a (Fig. 5A). In both tested Hela and JJ cell lines, the miR-449a mimic induced an approximately 50% and 60% reduction of luciferase activity, respectively, in constructs containing the entire LEF-1 UTR and the region immediately flanking the miR-449a-binding site (Fig. 5B, C). In contrast, when the predicted miR-449a-binding site within the 3′ UTR of LEF-1 was mutated, there was a complete recovery of luciferase activity, indicating that miR-449a binds to the predicted seed site.

Sequence-specific activity of miR-449a on LEF-1. The exact seed site of miR-449a on LEF-1 UTR was identified by producing various forms of LEF-1 3′ UTR in the pGL3-contruct
After validating the dose-dependent and sequence-specific regulation of LEF-1 by miR-449a, we then aimed to discover the actual change in expression at the level of both mRNA and protein. SW1353 and JJ cell lines were transfected with either microRNA-scramble, miR-449a mimic, or miR-449a antagomir, and the overall change in the expression of LEF-1 was monitored via quantitative real-time PCR and western blot analysis. As expected, the mRNA levels of LEF-1 in both SW1353 (Fig. 6A) and JJ (Fig. 6B) cell lines showed a positive correlation with the presence of either miR-449a or miR-449a antagomir. The same expression pattern was also observed at the protein level (Fig. 6C).
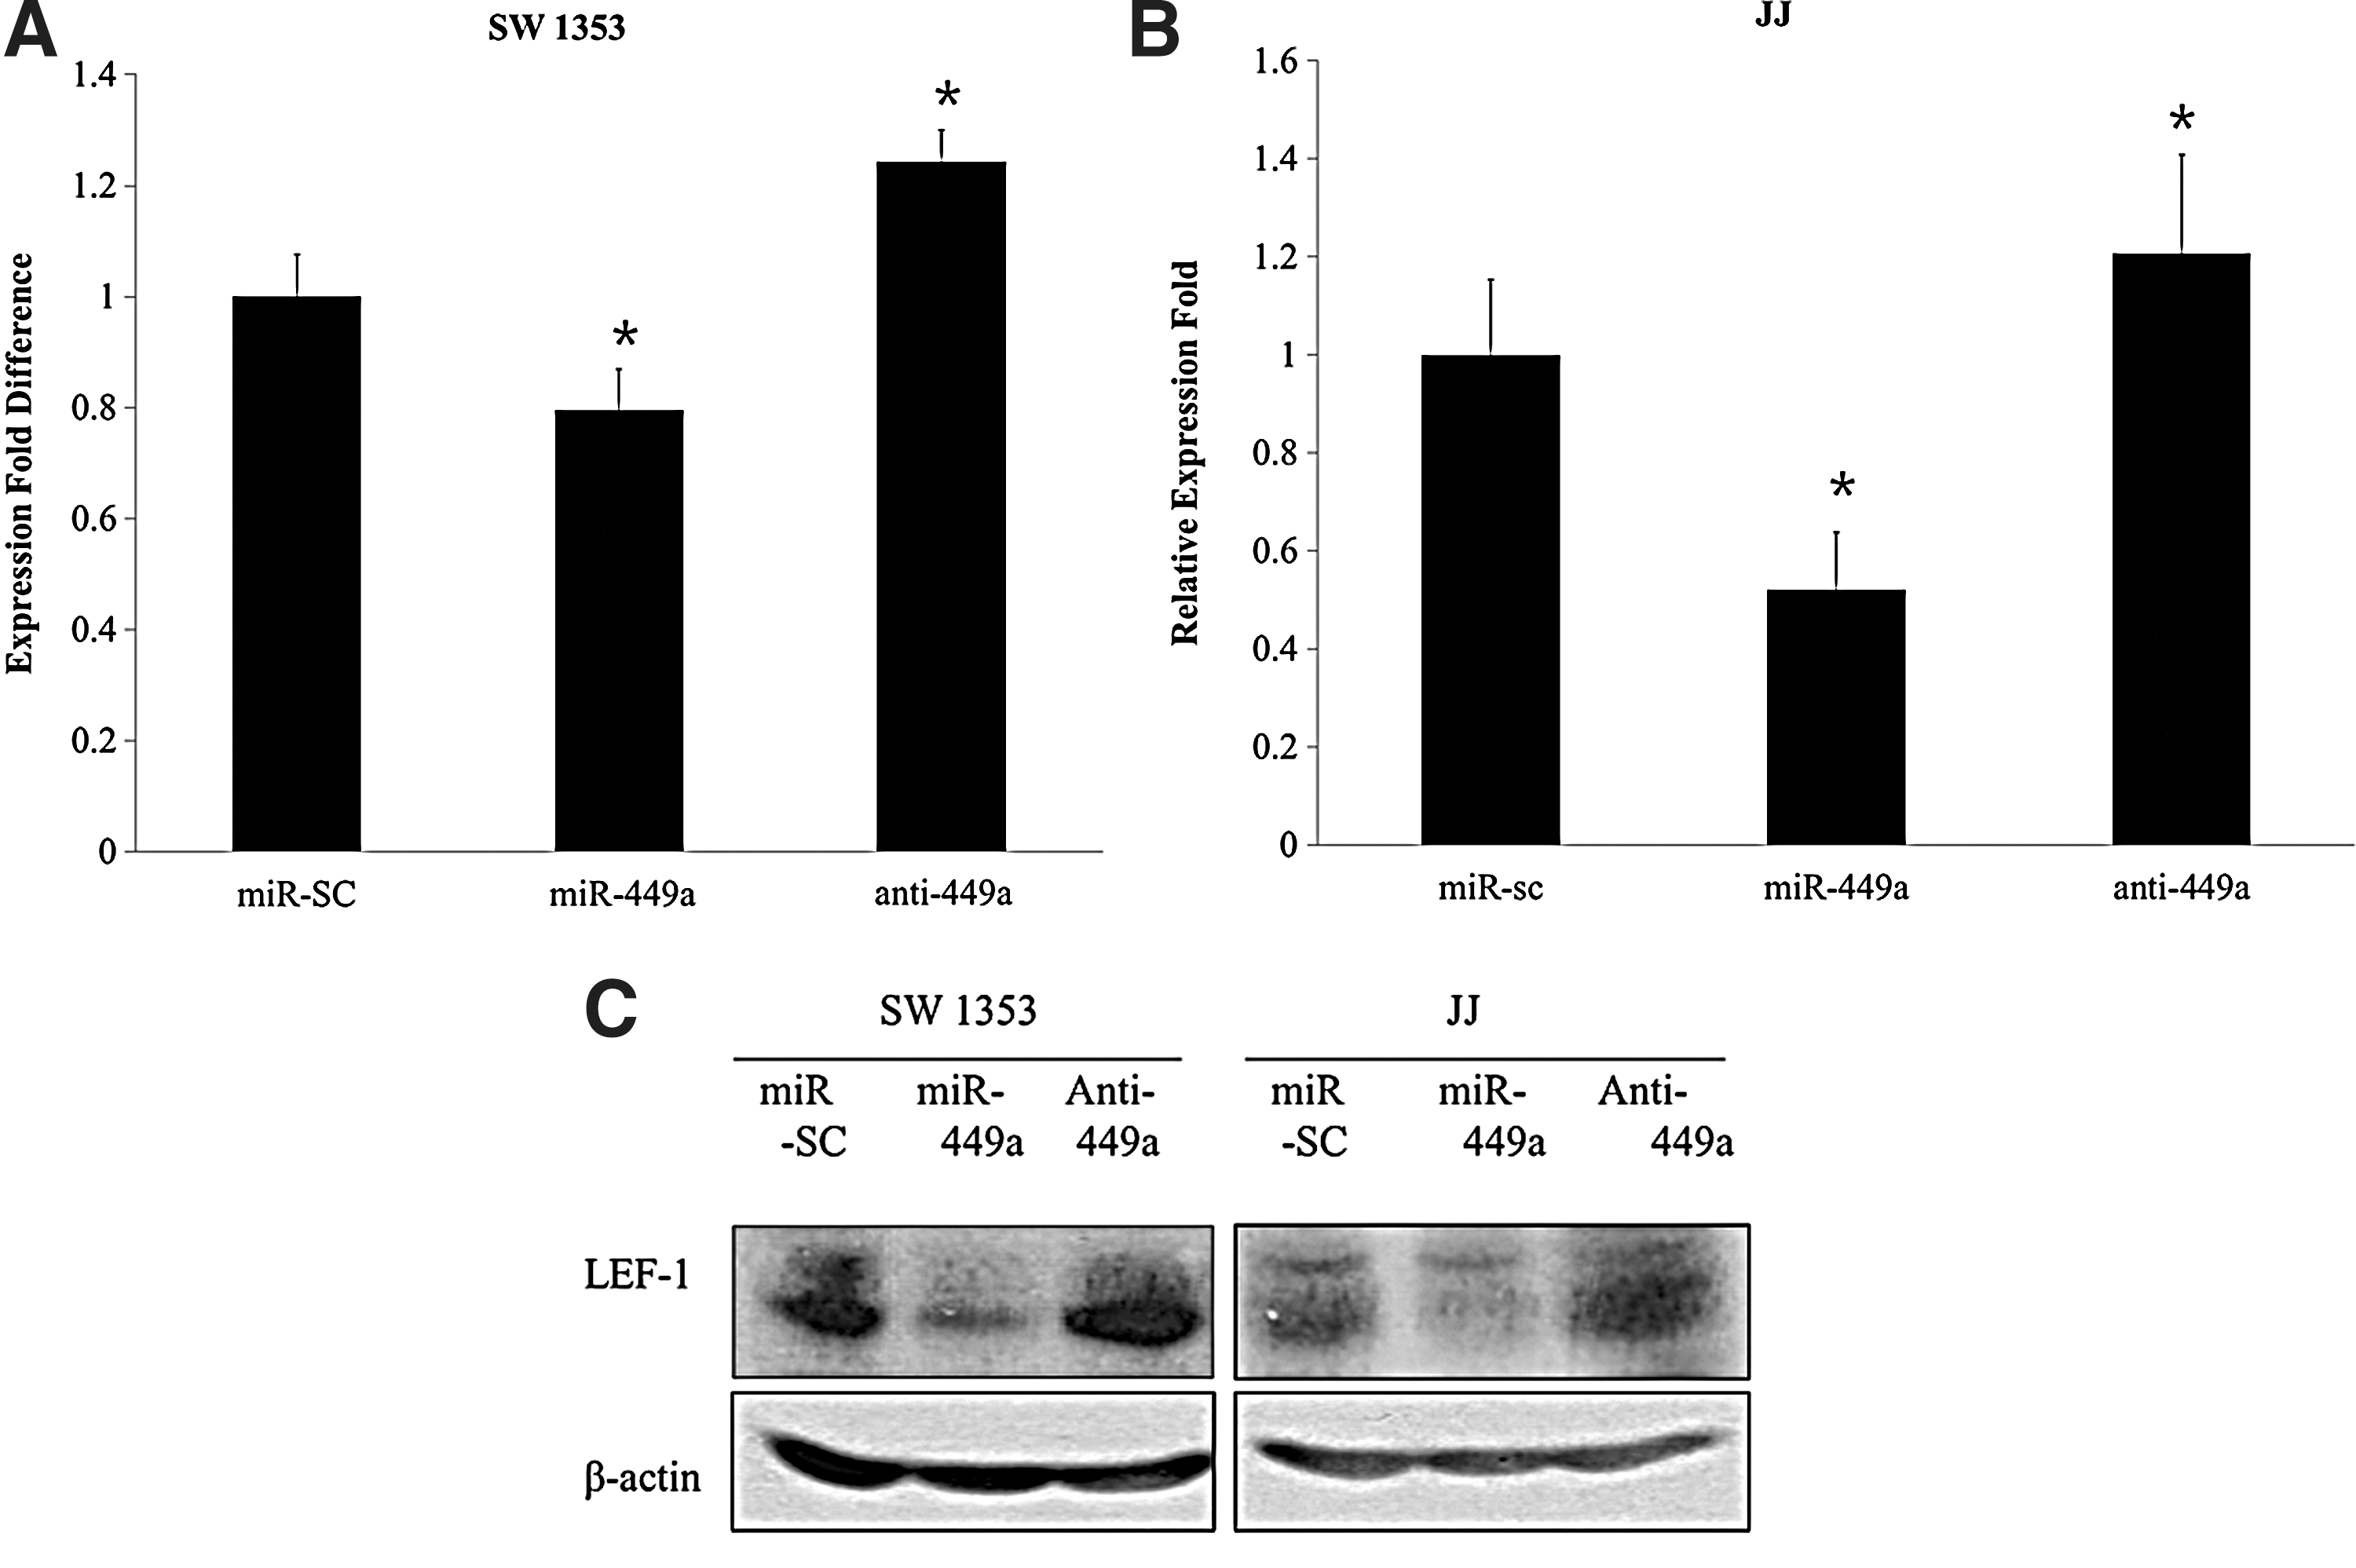
miR-449a modulates expression of LEF-1 and affects chondrogenesis. Overexpression of miR-449a has led to a significant reduction of endogenous LEF-1 expression, whereas inhibition of miR-449a has led to an increase of endogenous LEF-1 expression in 2 separate human chondrosarcoma cell lines,
Inhibition of LEF-1 leads to the subsequent reduction of Sox 9 and the downregulation of proteoglycan synthesis
Sox 9 is a pivotal transcription factor in chondrogenesis that is required for the proper differentiation of hBM-MSCs into chondroblasts as well as for precartilage condensation. Heterozygous mutation of Sox 9 coding genes has been reported to cause campomelic dysplasia, which is a subtype of human dwarfism characterized by hypoplasia of all cartilage-derived skeletal elements [29,30]. In addition, a previous report has indicated that the Sox 9 promoter region contained a binding site for LEF-1 [31], while another study showed direct regulation of Sox 9 expression by LEF-1 [32]. Based on such findings, we then sought to determine whether inhibiting LEF-1 via miR-449a would in turn translate into the proportional repression of Sox 9, and whether the opposite effect would be observed when a miR-449a antagomir was used. To evaluate this hypothesis, we individually transfected miR-scramble, miR-449a, and Anti-449a into SW1353 cells and observed their effect on LEF-1 and Sox 9. As expected, the expression of Sox 9 at the levels of both mRNA (Fig. 7A, B) and protein (Fig. 7C) mimicked that of LEF-1, indicating the regulatory role of LEF-1 on Sox 9. To further ascertain the effect of such repression of Sox 9 on the overall progression of chondrogenesis, we then observed the overall level of proteoglycan synthesis by safranin O staining in alignment with our previous data (Fig. 7D). For further confirmation, the degree of safranin O staining was quantified by destaining the cells as previously described, and a matching pattern was found (Fig. 7E).
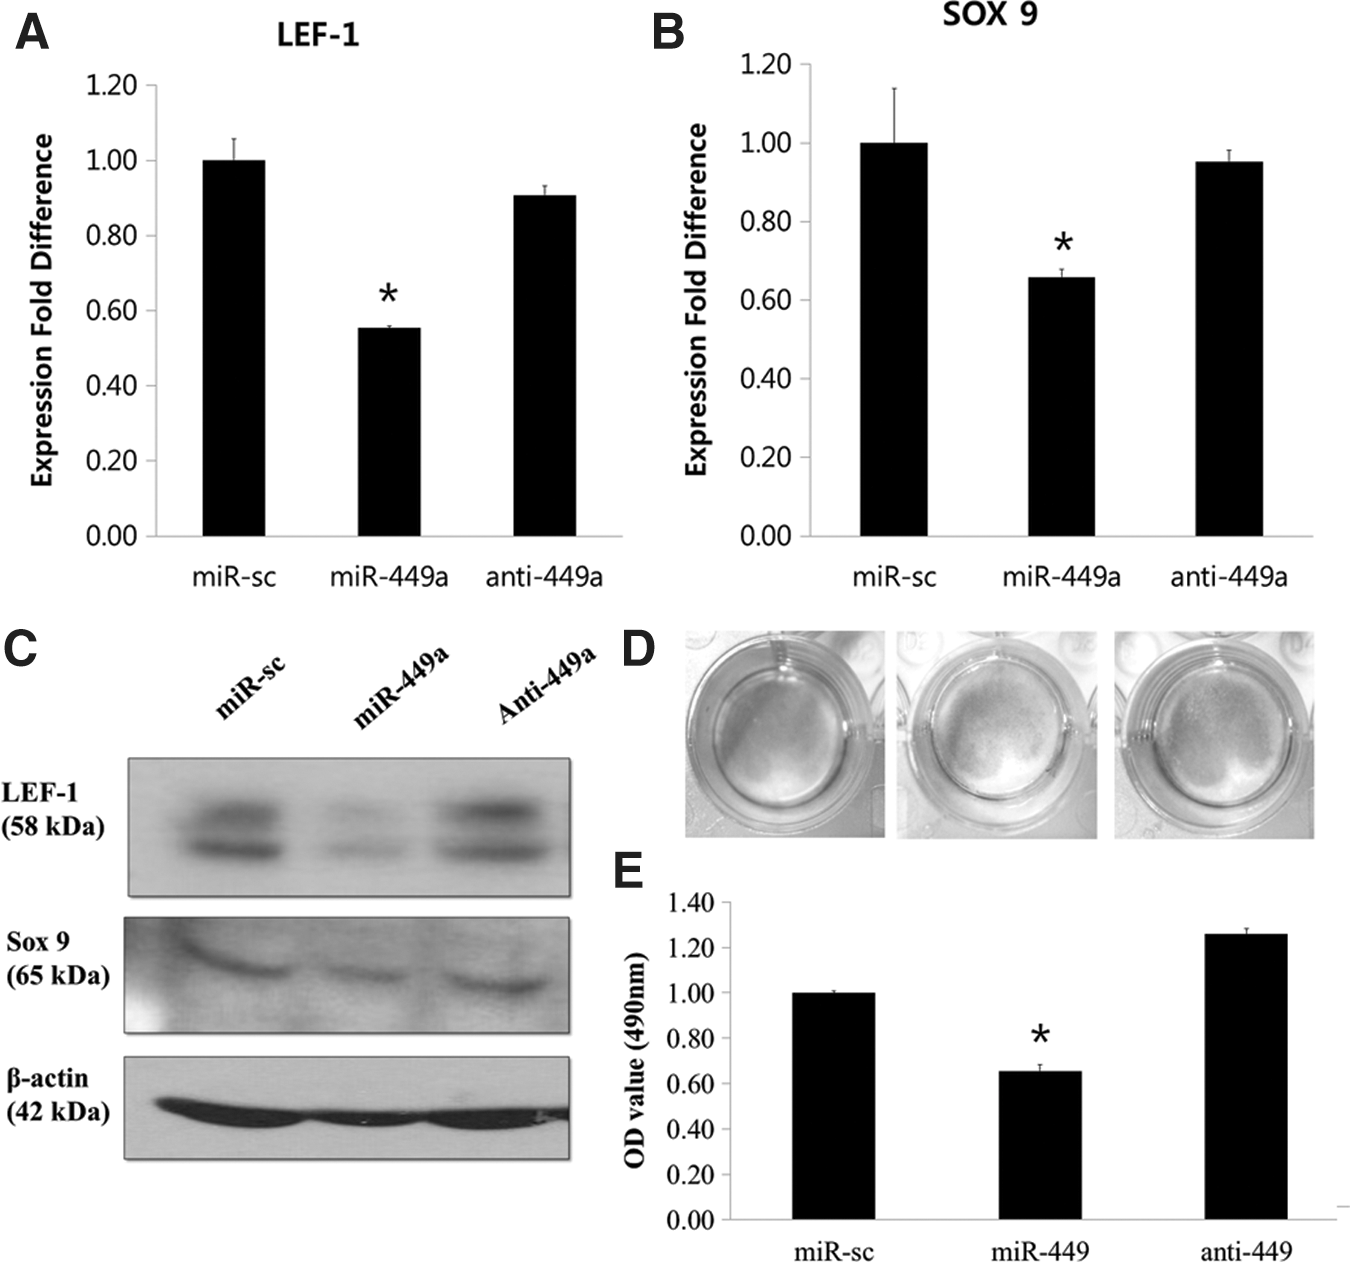
LEF-1 elicits its effect on chondrogenesis via targeting Sox 9. Reduced LEF-1 upon overexpression of miR-449a had resulted in a consequent reduction of critical factors in chondrogenesis. In SW1353 cell line, it was observed that the expression pattern of LEF-1 upon the introduction of either miR-449a or anti-449a showed positive correlation with expression of Sox 9
miR-449a plays a regulatory role in the chondrogenesis of hBM-MSCs
Ultimately, to verify that miR-449a elicited a similar regulatory function in both hBM-MSC differentiation as well as in chondrogenic cell lines, we transfected MSCs derived from 3 separate donors with either miR-449a or a control and monitored the change in expression of LEF-1 and other downstream chondrogenic marker genes. At day 10, in alignment with our previous results, we observed the expected increase of LEF-1, Sox 9, and type II collagen compared to the day 0 control (Fig. 8, the data shown are representative figures from experiments carried out using 3 independent donor-derived hBM-MSCs). This, in conjugation with the successful formation of micromass, confirms that successful chondrogenesis was achieved. In addition, as observed in Fig. 8A, it was clearly evident that miR-449a-transfected hBM-MSCs yielded significantly reduced expression of LEF-1 at differentiation day 10 compared to the cells treated with the scramble control. In alignment with our results obtained from the chondrogenic cell lines SW1353 and JJ, the reduction of LEF-1 via introduction of miR-449a also led to the noticeable reduction of the downstream key chondrogenic marker gene Sox 9 (Fig. 8B). Lastly, we also confirmed that type II collagen was significantly reduced at day 10 of differentiation upon treatment with miR-449a (Fig. 8C).

miR-449a regulates chondrogenesis in hBM-MSC by targeting LEF-1. hBM-MSCs transfected with either miR-449a mimic or miR-scramble control were induced for chondrogenesis for 10 days. At day 10, LEF-1, Sox 9, and type II collagen have shown drastic increase compared to the day 0 control
Discussion
Previous studies have reported that Wnt signaling plays a critical role in determining the overall progression of chondrogenesis [33]. Wnt4 and Wnt9a are highly expressed in developing joints, while Wnt7a and Wnt8a are found in developing cartilage. Wnt5a and Wnt11 are expressed specifically in the perichondrium, whereas Wnt5b is restricted to prehypertrophic chondrocytes. Although a number of Wnts, such as Wnt4, Wnt8, and Wnt11, play an inhibitory role in stimulating hypertrophy and blocking chondrogenic differentiation, other Wnt family members, such as Wnt3a, Wnt5a, and Wnt5b, are known to promote chondrogenesis [34 –40]. In one study, the authors observed a dramatic increase in Wnt3a with treatment of a high-density culture of C3H10T1/2 cells with a well-established chondrostimulatory factor, BMP-2. Additionally, when Wnt-3A and a kinase-dead GSK-3β were overexpressed, the total and nuclear levels of both LEF-1 and β-catenin showed a noticeable increase, which in turn displayed active interaction with BMP-2 during chondrogenesis [41]. These findings indicate that certain members of the Wnt family, such as Wnt-3a, play an essential role during the progression of chondrogenesis and that they exert their effect via the well-established β-catenin/LEF-1 interaction. In perfect alignment with this theory, a study reported that the overexpression of LEF-1 in 3 separate cell sources, namely C3H10T1/2, ATDC5, and primary chondrocytes, showed induction of a key chondrogenic marker gene, Sox 9 [32]. However, upon the prolonged presence of LEF-1 induced by a constitutively active LEF-1 overexpression vector, hBM-MSCs rapidly went into hypertrophy [42]. Similarly, a study by Tamamura et al. indicated that the transgenic overexpression of LEF-1 driven by the type II collagen promoter led to defective chondrocyte maturation, whereas an overexpression of mutated β-catenin in chick embryos resulted in the inhibition of both cartilage development and hypertrophy, suggesting that the canonical Wnt signaling has the unique effect of both hypertrophy and chondrogenic differentiation depending on the developmental stage [43]. The findings from previous studies indicate that LEF-1 plays a pivotal role in the proper progression of chondrogenesis, plays a key role in both initial entry phases of chondrogenesis of hBM-MSCs, and has a significant involvement in the commencement and regulation of hypertrophy. In parallel, our data, from both the high-throughput screening analysis via microarray analysis and the experimental validation using RT-PCR and quantitative real-time PCR, showed the expected increase in LEF-1 during the early phase of differentiation (Fig. 1).
To identify the potential microRNA targeting this gene of interest, we were able to narrow down the potential microRNA with the widely used target prediction databases TargetScan and miRanda. By introducing the mimic of each microRNA into human chondrosarcoma cell lines, we were then able to identify one particular microRNA that elicited the most significant reduction of LEF-1, miR-449a. In 2 of the human chondrosarcoma cell lines tested, SW1353 and JJ, miR-449a induced a significant reduction in LEF-1 expression, whereas the inhibition of miR-449a via the transfection of the antagomir resulted in the drastic recovery of expression (Fig. 6). In addition, we also observed a dose-dependent reduction of luciferase activity when the pGL-3-LEF-1 construct was cotransfected with the miR-449a mimic, further confirming the regulatory effect of miR-449a on LEF-1 (Fig. 4). Finally, via mutation analysis of the predicted miR-449a-binding site, we also successfully identified the exact sequence of LEF-1 that miR-449a recognizes, which validates the fact that miR-449a is indeed a negative regulator of LEF-1 (Fig. 5). Such a result provides solid evidence of the direct repression of LEF-1 via miR-449a. Furthermore, this reduction of LEF-1 resulted in the consequent reduction of Sox 9 (Fig. 7A–C). Established as the master regulator of chondrogenesis, Sox 9 expression is known to precede the upregulation of 2 critical marker genes of chondrogenesis, type II collagen and aggrecan [44], and it is thought to activate the 48-bp enhancer located in the first intron of the type II collagen gene [45]. Collectively, it is widely accepted that Sox 9 plays a critical role in the overall progression of chondrogenesis, with a specific focus on precartilage condensation and proper differentiation of hBM-MSCs into chondrocytes. Accordingly, the reduction of LEF-1 expression by miR-449a resulted in the downregulation of Sox 9, which in turn affected the overall level of proteoglycan synthesis (Fig. 7D). In addition, upon the suppression of LEF-1 via siLEF-1 in hBM-MSCs, the key chondrogenic marker gene type II collagen, along with Sox 9, clearly showed a significant reduction throughout the 7-day differentiation period (Fig. 2), indicating that LEF-1 is indeed a pivotal factor involved in the regulation of chondrogenesis, which is in perfect alignment with the previous reports that have suggested the critical and positive effect LEF-1 has on the overall progression of proper chondrogenesis [32 –35,37 –40].
Upon successful verification of the regulatory role miR-449a elicited on LEF-1, and furthermore, on expression of chondrogenic marker genes, such as Sox 9 and type II collagen in the chondrogenic cell lines SW1353 and JJ, we then tested its effect on hBM-MSCs. Using the identical microRNA mimic used for experiments in cell lines, we transfected 3 separate hBM-MSCs derived from individual donors and induced chondrogenesis. In perfect alignment with the chondrogenic cell lines, the introduction of miR-449a resulted in the significant downregulation of LEF-1 in hBM-MSCs (Fig. 8A). In addition, we also observed a noticeable reduction in the downstream chondrogenic marker genes Sox 9 (Fig. 8B) and type II collagen (Fig. 8C). These data, in combination with the similar results obtained from multiple chondrogenic cell lines, strongly support our initial hypothesis that miR-449a directly regulates the expression of LEF-1, which in turn regulates chondrogenesis, resulting in reduced Sox 9 and type II collagen expression.
In summary, this study has successfully demonstrated that (a) LEF-1 is indeed a critical factor involved in the proper differentiation and maturation of chondrogenesis of human BMSCs and that (b) miR-449a directly binds to the seed sequence of the LEF-1 3′ UTR, causing effective repression of its expression, which ultimately leads to (c) a subsequent reduction in Sox 9 gene expression and the overall progression of chondrogenesis. In addition, considering that previous research has confirmed the critical role played by LEF-1 in various biological processes, not only limited to chondrogenesis, but also in areas, such as tumorigenesis and development, complete experimental validation of endogenous microRNAs targeting LEF-1 may prove to be an asset in the field of human physiology.
Footnotes
Acknowledgments
This work was supported by a grant (Code: A110328) from the Korea Health Technology R&D Project, Ministry of Health and Welfare, Republic of Korea.
Author Disclosure Statement
No competing financial interests exist.