




Abstract
Circulating hematopoietic progenitor cells (CPCs) may be triggered by physical exercise and/or normobaric hypoxia from the bone marrow. The aim of the study was to investigate the influence of physical exercise and normobaric hypoxia on CPC number and functionality in the peripheral blood as well as the involvement of oxidative stress parameters as possibly active agents. Ten healthy male subjects (25.3±4.4 years) underwent a standardized cycle incremental exercise test protocol (40 W+20 W/min) under either normoxic (FiO2 ∼0.21) or hypoxic conditions (FiO2<0.15, equals 3,500 m, 3 h exposure) within a time span of at least 1 week. Blood was drawn from the cubital vein before and 10, 30, 60, and 120 min after exercise. The number of CPCs in the peripheral blood was analyzed by flow cytometry (CD34/CD45-positive cells). The functionality of cells present was addressed by secondary colony-forming unit-granulocyte macrophage (CFU-GM) assays. To determine a possible correlation between the mobilization of CPCs and reactive oxygen species, parameters for oxidative stress such as malondialdehyde (MDA) and myeloperoxidase (MPO) were obtained. Data showed a significant increase of CPC release under normoxic as well as hypoxic conditions after 10 min of recovery (P<0.01). Most interestingly, although CD34+/CD45dim cells increased in number, the proliferative capacity of CPCs decreased significantly 10 min after cessation of exercise (P<0.05). A positive correlation between CPCs and MDA/MPO levels turned out to be significant for both normoxic and hypoxic conditions (P<0.05/P<0.01). Hypoxia did not provoke an additional effect. Although the CPC frequency increased, the functionality of CPCs decreased significantly after exercise, possibly due to the influence of increased oxidative stress levels.
Introduction
C
Second, concerning regeneration, not only the number of CPCs in the peripheral blood, but also their functionality is of great importance. CPCs are considered highly functional, when their self-renewal ability does not decline over time. Even after multiple generations, they still show the ability to form colonies [10,11]. In the context of physical exertion, CPC functionality has not yet been investigated extensively. Only a limited number of studies addressed the effect of exercise on CPC colony formation in human subjects [12], where only the different types of CPCs were studied by colony-forming unit (CFU) assays, but not for their functionality. Animal-based data are also sparse, but some results were given by Stelzer et al. [13]. The influence of voluntary life-long exercise on the decline of bone marrow-derived hematopoietic progenitor cell quality was investigated during aging in rats [13], where a higher proliferative capacity of myeloid progenitor cells in a voluntary life-long exercising group of rats was found. This raises the question whether the exposure to acute stressors, such as high-intensity physical exercise, also forces hematopoietic stem cell renewal and regeneration in the human body, supported by the release of CPCs into the peripheral blood. Third, the proliferation/differentiation capacity of CPCs is also dependent on the oxidative environment of these cells [14]. The formation of oxidative stress by reactive oxygen species (ROS) and the resulting activation of the p38/mitogen-activated protein kinase (MAPK) pathway have been shown to decrease HSC/HPC colony formation capacity in mice [15]. The amount of oxidative stress in the human body can be assessed by biomarkers, traceable subproducts produced through oxidation of body compounds such as DNA, proteins, or lipids. Among several reactive aldehydes, which are formed from the decomposition of lipid peroxides, the most extensively assayed so far is malondialdehyde (MDA) [16]. Its validity, however, might be questionable in some cases, and it might be more useful in combination with other biomarkers [17]. Myeloperoxidase (MPO), which is an abundant heme protein secreted from activated phagocytes, is able to generate ROS [18] and therefore serves as a biomarker in various cases [19,20]. The relationship of exercise-induced stem and progenitor cell mobilization and oxidative stress markers has been addressed by only a couple of studies [9,21]. Their outcomes indicate that mobilization of endothelial progenitor cells following an exercise intervention may be influenced by the plasma antioxidant capacity. Furthermore, short-term moderate-intensity aerobic exercise improved carotid artery compliance by forcing endothelial repair, possibly due to reduced oxidative stress [21]. A recent study by Antoncic-Svetina et al. [8] reports that mild oxidative stress, triggered by physical exercise, stimulates the antioxidant defense system. Additionally, biomarkers of systemic oxidative stress correlate strongly with the physical performance of healthy volunteers [8]. Last, but not least, the additional effect of hypoxia on CPC release from the bone marrow has also not yet been thoroughly investigated. Few data are available on the increased levels of circulating progenitor cells after a 1-week sojourn at a moderate altitude [22], or the combination of hypobaric hypoxia and muscle electrostimulation [23].
To link the unanswered questions raised above, this study aims (1) to determine CPC kinetics before and after an incremental exercise test protocol, (2) to study the exercise-induced effects on the proliferation capacity of these cells, (3) to investigate the relationship between oxidative stress parameters and CPC mobilization, and (4) to evaluate the influence of normobaric hypoxia on these response variables.
Methods
Subjects and study design
Ten healthy athletic male subjects (age: 25.3±4.4 years, BMI: 22.9±1.7 kg/m2) were recruited for the study. They all met the inclusion criteria of no medication intake, no previous or current health problems, being nonsmokers, and no intake of dietary supplements. Informed consent was obtained from all participants. The study protocol was approved by the local ethics committee of the Medical University of Graz, Austria (decision number 21–126 ex 09/10). All subjects performed a standardized cycle incremental ergometry test protocol (3-min resting phase, 40-W starting load, increasing 20 W/min) until exhaustion. The subject's ECG was monitored by a physician and the heart rate (HR, PE 4000; Polar Electro), blood lactate concentration (lactate, Biosen S-line; EKF-Diagnostic), and gas exchange variables (ZAN 800, ZAN) were measured throughout the tests as well as during 3 min of active and 3 min of passive recovery. Maximal oxygen uptake (VO2max) and maximal power output (Pmax) were determined as markers of exercise performance. Test duration was depending on the individual physical condition (min–max: 16–23 min under normoxia, 16–20 min under hypoxia, respectively). The hypoxic interventions were done in a sealed normobaric hypoxia chamber (altitude above sea level: Graz, Austria: 383 m), where a simulated altitude of 3,500 m (FiO2<0.15) was generated (Hypoxico, Everest Summit II) for the time of test duration (∼3 h). CO2 content was held constant by continuous absorption.
Blood sample collection and postprocessing
Blood from the cubital vein was collected in EDTA tubes for oxidative stress measurements as well as stem and progenitor cell counts and in ammonium–heparin tubes for stem and progenitor cell isolation and functionality tests. Blood samples were centrifuged (∼1,156 g, 10 min), and plasma was stored at −80°C until analysis. Blood samples were obtained at rest, 10, 30, 60, and 120 min after the intervention. They were kept at room temperature until analysis for counting of total blood cells (Hematology Analyzer KX-21N; Sysmex) and estimation of CPC numbers by flow cytometry (FACS Calibur; BD Biosciences). All blood preparations for the flow cytometry analysis for all 5 different time points (per subject and test) were done at the same time and day. Oxidative stress markers and CPC counts were obtained from all 10 subjects; progenitor cell functionality tests [secondary CFU-granulocyte macrophage (GM) assays] were done for a subgroup of 6 subjects for normoxic as well as hypoxic conditions. To avoid the influence of diurnal variation, the incremental test was always performed at the same time of day (starting at 8:00 am).
Analysis of CPCs in the peripheral blood
The gating strategy followed the 2-platform ISHAGE guidelines based on light scatter characteristics and presence of CD34+/CD45dim SSClow HSCs/HPCs [24] (Fig. 1). Gates were established using umbilical cord blood. CPCs in the peripheral blood were analyzed by flow cytometry using the antibody combination CD34-PE/CD45-FITC (BD Biosciences) following the instructions of the manufacturer. Flow cytometry, using a FACSCalibur (BD Biosciences; Cell Quest Pro Software) was performed with correct fluorescent parameters (compensation and light scatter gating), excluding dead cells. In total, 500,000 leukocytes were acquired and the percentage of CD34+/CD45dim CPCs within the leukocyte fraction was determined. The total CD34+/CD45dim cell number per mL peripheral blood was calculated based on the counts of CPCs related to the leukocyte fraction. In addition, CD34+/CD45bright cells were analyzed according to the protocol described by Bellows et al. [25].
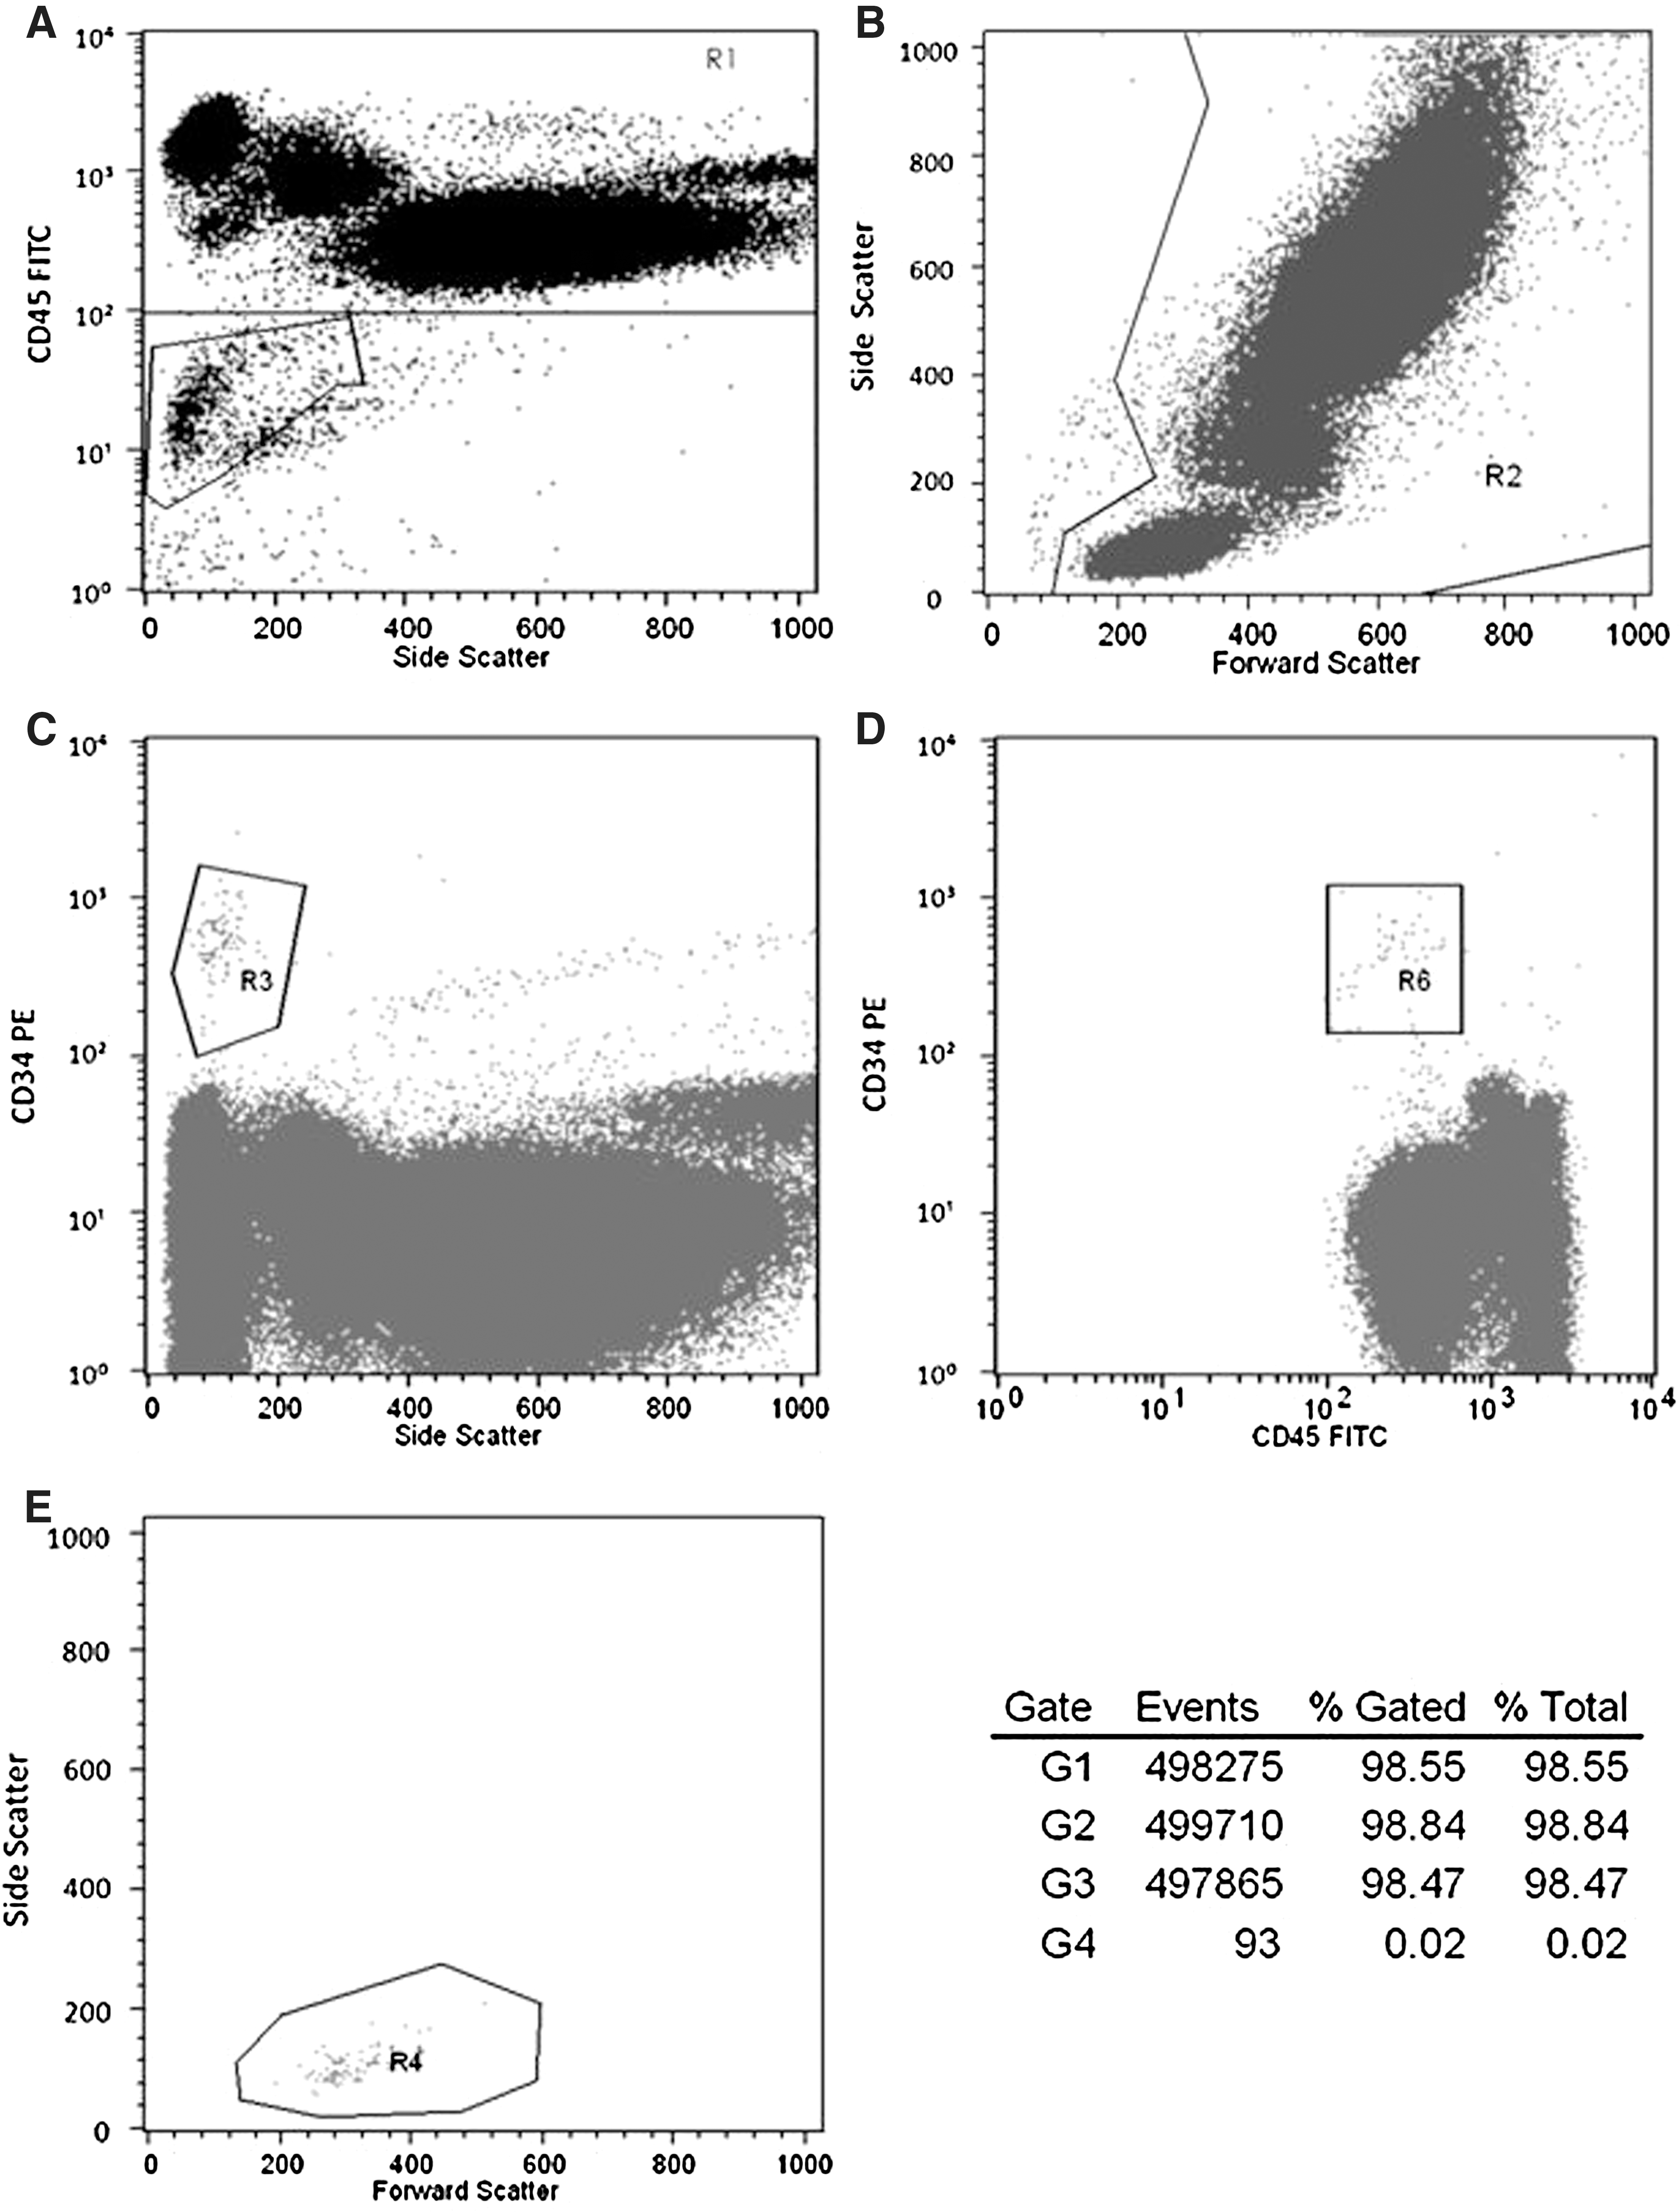
The FACS analysis of circulating hematopoietic progenitor cells (CPCs) in the peripheral blood before and 10 min postexercise. FACS plots of a representative analysis of CPCs in the peripheral blood are shown above (subject 1, before exercise, and normoxia). Total leukocytes were stained with the antibody combination CD34 PE/CD45 FITC and analyzed by flow cytometry. CPCs were defined according to the ISHAGE protocol. To exclude debris and erythrocytes, we selected CD45+ cells

Primary and secondary CFU assays
CFU assays were done for a subgroup of 6 subjects. Peripheral mononuclear blood cells were isolated from heparin-anticoagulated blood by standard Ficoll density gradient centrifugation (Histopaque®; Sigma-Aldrich) according to the manufacturer's instructions using 7–9 mL of heparin-anticoagulated blood. Cells for CFU assays were collected before and 10 min after ergometry. The harvested cell pellet was resuspended in Dulbecco's modified Eagle medium (DMEM/F-12) culture medium (Gibco®, Invitrogen) and cell counts were estimated using a CASY® cell counter (Roche Diagnostics). For the CFU assay with erythropoietin (EPO), mononuclear cells were plated at a concentration of 1.5×10⁵ cells/mL in 500 μL methylcellulose culture medium (MethoCult® H4434; StemCell Technologies) in 12-well flat-bottom suspension culture plates (Greiner Bio One) and incubated at 37°C in a humidified atmosphere containing 5% CO2 for 14 days. Colonies consisting of more than 40 cells were scored and gave information on the frequency of myeloid progenitor cells burst forming unit-erythroid (BFU-E) and CFU-GM.
For the secondary CFU-GM assay, mononuclear cells were plated at a concentration of 1.5×10⁵ cells/mL in 500 μL methylcellulose culture medium without EPO (MethoCult® H4534; StemCell Technologies) in 12-well flat-bottom suspension culture plates (Greiner Bio One) and incubated at 37°C in a humidified atmosphere containing 5% CO2 for 8 days. After counting, 90 primary CFU-GM colonies consisting of more than 40 cells were individually plucked from the methylcellulose culture medium; each single colony was transferred to a separate well of a 48-well flat-bottom microtiter plate, dispersed in an alpha medium (Gibco) supplemented with 15% FBS, and thoroughly mixed with the methylcellulose culture medium to obtain a single cell suspension [10]. After 14–16 days each well was again scored for the presence and number of CFU-GM colonies consisting of more than 40 cells (=secondary CFU-GM). The secondary replating capacity correlates with the proliferative capacity of myeloid progenitor cells [10,11].
Analysis of secondary CFU-GM
For the analysis of secondary CFUs, the number of secondary CFU-GM produced by each primary CFU-GM was used as raw data. Counts exceeding a number of 100 were truncated. The secondary replating capacity of an individual was defined as the mean log 2 of the number of colonies plus one for the following reasons: The log 2 scale is natural as the distribution of the number of secondary colony-forming cells is skewed to the right. One was added as the log 2 of zero cannot be calculated, and the log 2 of this number is a continuous measure of number of duplications of a primary CFU-GM. This measure has properties similar to the measure used by Gordon et al. [10]; as counts of zero are adequately taken into account, the log scale reduces the skewness as well. Cumulative percentages are expressed as the area under the curve (AUC) [13,15,26].
Evaluation of oxidative stress markers
Aliquots of plasma were prepared and stored at −80°C until the analysis. MDA was determined with a high-performance liquid chromatographic method with spectrofluorimetric detection as described by Khoschsorur et al. [27]. MPO concentration was measured by the Architect-i-System (Architect MPO assay; Abbott Laboratories Diagnostics), using the automated chemiluminescent microparticle immunoassay technology [28]. Detection limits were 0.2 μM for MDA and 2.9 μg/L for MPO.
Statistical analysis
Data are given as means±standard error of the mean (SEM), except for physiological exercise variables and subject specifications (age and BMI), which are reported as means±standard deviation (SD), and primary CFU assay statistics, which are presented as median, minimum, and maximum. The statistical analysis was done with SPSS (IBM SPSS Statistics 19). All used variables were tested for normal distribution with the Kolmogorov-Smirnov test (P>0.05). Changes in blood cell counts, CD34+/CD45dim cells, MDA, and MPO levels during both normoxic and hypoxic interventions were tested by repeated-measures ANOVAs with Fisher's-least significant difference, whereas changes in secondary CFUs before and 10 min after the incremental test as well as differences between normoxia and hypoxia were assessed by paired t-tests (one- or 2-tailed tests, depending on the presence/absence of previous hypothesis). For pooling values, the Friedman's test was used to verify if samples came from the same distribution. Pearson's product-moment correlation coefficient [29] was used for calculating the relationship between oxidative stress parameters and absolute CD34+/CD45dim counts. A P value<0.05 was considered as significant.
Results
Exercise performance evaluation
Subjects showed the following physical parameters recorded under both conditions (mean±SD): maximal HR (normoxia:189.5±7.7/min, hypoxia: 185.3±7.3/min), maximal work load (normoxia: 314±49.9 W, hypoxia: 274±29.9 W), maximal blood lactate concentration (normoxia: 12.6±2.1 mM, hypoxia: 12.0±2.0 mM), and maximal oxygen uptake (normoxia: 51.8±7.4 mL/kg/min, hypoxia: 43.1±8.3 mL/kg/min).
Blood cell counting
Red blood cells (RBCs), white blood cells (WBCs), platelets, hematocrit (Hct), and neutrophils showed a significant rise 10 min after the intervention (10 min post) under normoxic conditions. Similarly, all these variables as well as lymphocytes increased significantly under hypoxic conditions. All values went back to baseline after another 20 min (30 min post) and RBCs, Hct, and lymphocytes dropped significantly under baseline values after another 30 min (60 min post) under hypoxic conditions (not apparent under normoxia). At the last blood collection (120 min post), the level of WBCs and neutrophils increased significantly again under normoxia and hypoxia, respectively, whereas RBCs, Hct, and lymphocytes stayed significantly below baseline values under hypoxic conditions (Tables 1 and 2).
Values are means±SEM, n=10.
Significant differences between time points are indicated as follows: a P<0.001, b P<0.01, c P<0.05.
SEM, standard error of the mean; RBC, red blood cell; WBC, white blood cell; Hct, hematocrit.
Values are means±SEM, n=10.
Significant differences between time points are indicated as follows: a P<0.001, b P<0.01, c P<0.05.
Changes of CD34+/CD45dim cells
A significant 2-fold rise (P<0.01) of CPCs was observed 10 min following the exercise intervention under both test conditions (normoxia, hypoxia, Fig. 2 and Table 3 and 4). A significant decrease below baseline (P<0.01) values was only observed under normoxic conditions 120 min postexercise. There was a significant decrease 30, 60, and 120 min postexercise in comparison to the peak value 10 min postexercise (P<0.01).
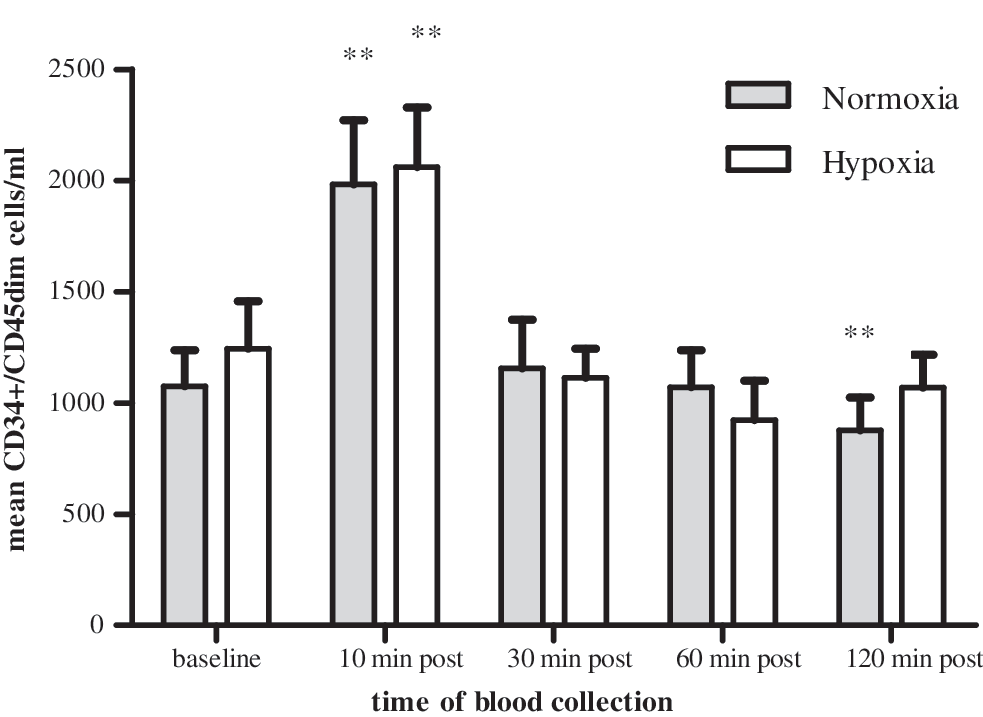
CPC kinetics in the peripheral blood. CPC (CD34+/CD45dim) kinetics triggered by a maximal incremental exercise intervention under normoxic and hypoxic conditions. Time of blood collection: baseline (1), 10 min (2), 30 min (3), 60 min (4), and 120 min (5) after the intervention. Data are reported as means±standard error of the mean (SEM). There was a significant increase in CD34+/CD45dimcell number 10 min after cessation of exercise (2) and also a significant decrease to below baseline values 120 min postexercise (5) during normoxia (**P<0.01). During hypoxia, the CD34+/CD45dim cell level returned to baseline values 120 min postexercise (5). There was no significant difference between normoxia and hypoxia (P>0.05) for all time points of blood collection.
Values are means±SEM, n=10.
Significant differences between time points (ANOVA with Fisher's LSD) are indicated as follows: a P<0.01.
CPCs, circulating hematopoietic progenitor cell; LSD, least significant difference.
There was no significant difference between normoxic and hypoxic conditions regarding the number of CD34+/CD45dim cells released at all time points of blood collection (P>0.05).
Changes of CD34+/CD45bright cells
CD34+/CD45bright cells did not show any significance regarding all time points in comparison to the baseline value under normoxic conditions. Under hypoxia, there was a significant increase (P<0.05) 10 min postexercise (Table 4). There was no significant difference between normoxia and hypoxia regarding released CD34+/CD45bright cells between time points (P>0.05).
Values are means±SEM, n=10.
Significant differences between time points (ANOVA with Fisher's LSD) are indicated as follows: a P<0.01, b P<0.05.
Primary CFU assays with EPO
Primary CFU assays showed no significant difference (the 2-tailed paired t-test, P>0.05) between baseline and 10 min postexercise values under both test conditions (n=6). Descriptive statistics of BFU-E and CFU-GM data is presented in Tables 5 and 6. Pooled values (the Friedman's test, P>0.05) did also not turn out to be significant (n=12, P>0.05).
BFU-E, burst forming unit-erythroid.
CFU-GM, colony-forming unit-granulocyte macrophage.
Secondary CFU assays
Under normoxic conditions, secondary CFUs showed a significant decline in proliferation capacity 10 min after physical exertion (the one-tailed paired t-test, P<0.05, 1-β (power)=0.85, Fig. 3). Under hypoxic conditions, only a trend was seen (P=0.07). As hypoxia had no additional effect (the Friedman's test, P>0.05), values were pooled (n=12), which also resulted in a significant decline of proliferative capacity 10 min postexercise (P<0.05, Fig. 3).
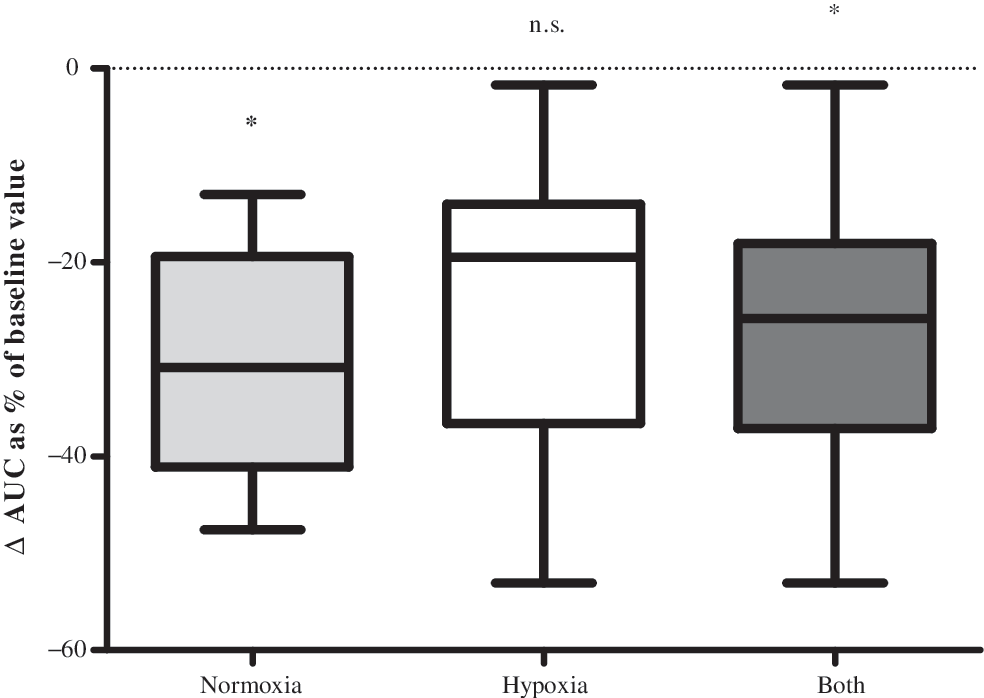
Proliferative capacity 10 min after exercise. Box-plot statistics of the change in functionality/proliferative capacity 10 min after cessation of exercise for normoxia, hypoxia, and all values pooled; data are expressed as the area under the curve (AUC). Secondary-colony forming units were significantly decreased 10 min postexercise under normoxic conditions (*P<0.05), a trend was seen under hypoxic conditions (P=0.07), and significantly decreased as pooled values (both, *P<0.05).
Kinetics of oxidative stress parameters
Parameters of oxidative stress showed a dynamic pattern similar to that of CPCs (Figs. 2, 4, and 5). Under normoxia, MDA rose significantly above baseline values 10 min after the intervention (P<0.05) and dropped significantly below baseline 60 and 120 min postexercise (Fig. 4, P<0.01). There was a significant decrease 30 min, 60 min, and 120 min postexercise in comparison to the peak value 10 min postexercise (P<0.01). Exercise under hypoxic conditions showed the same results, except with no significant increase 10 min after the intervention due to relatively high baseline values. Sixty and 120 min postexercise, there was a significant difference from the peak value 10 min postexercise (P<0.05). On the other hand, MPO only showed a significant (Fig. 5, P<0.01) difference from baseline values 10 min after physical exertion under hypoxic conditions as well as a significant decrease 30 min postexercise in comparison to the peak value 10 min postexercise (P<0.01).

Malondialdehyde (MDA) kinetics. MDA kinetics before and after the maximal incremental exercise intervention for normoxia and hypoxia; time of blood collection: baseline (1), 10 min (2), 30 min (3), 60 min (4), and 120 min (5) after the intervention. Data are reported as means±SEM. MDA kinetics are similar to those of CPCs, which suggests a contemporaneous trigger effect of MDA levels on the release of CPCs. There were significant differences for both normoxia and hypoxia at different time points in comparison to baseline values (*P<0.05, **P<0.01).

Myeloperoxidase (MPO) kinetics. MPO kinetics before and after the maximal incremental exercise intervention for normoxia and hypoxia; time of blood collection: baseline (1), 10 min (2), 30 min (3), 60 min (4), and 120 min (5) after the intervention. Data are reported as means±SEM. The high SEM of the baseline mean under normoxic conditions can be traced back to 2 very high sampling values at this time point, probably due to underlying short-term inflammatory processes. MPO kinetics are similar to those of CPCs, which also suggests a contemporaneous trigger effect of MPO levels the release of CPCs. There was a significant difference 10 min postexercise compared to baseline values (**P<0.01) for hypoxic conditions.
There was no significant difference between the releases of MDA/MPO levels under normoxic vs. hypoxic conditions at all times of blood collection (P>0.05).
Relationship of CPC release to oxidative stress values
A correlation of released CPCs for all 10 subjects between sampling time points and the respective MDA/MPO differences resulted in significant outcomes for normoxia (r=0.389/0.484; P<0.05/P<0.01) and hypoxia (r=0.326/0.427; P<0.05 P<0.01) (Fig. 6) (n=40: 10 subjects, 4 time-differences).
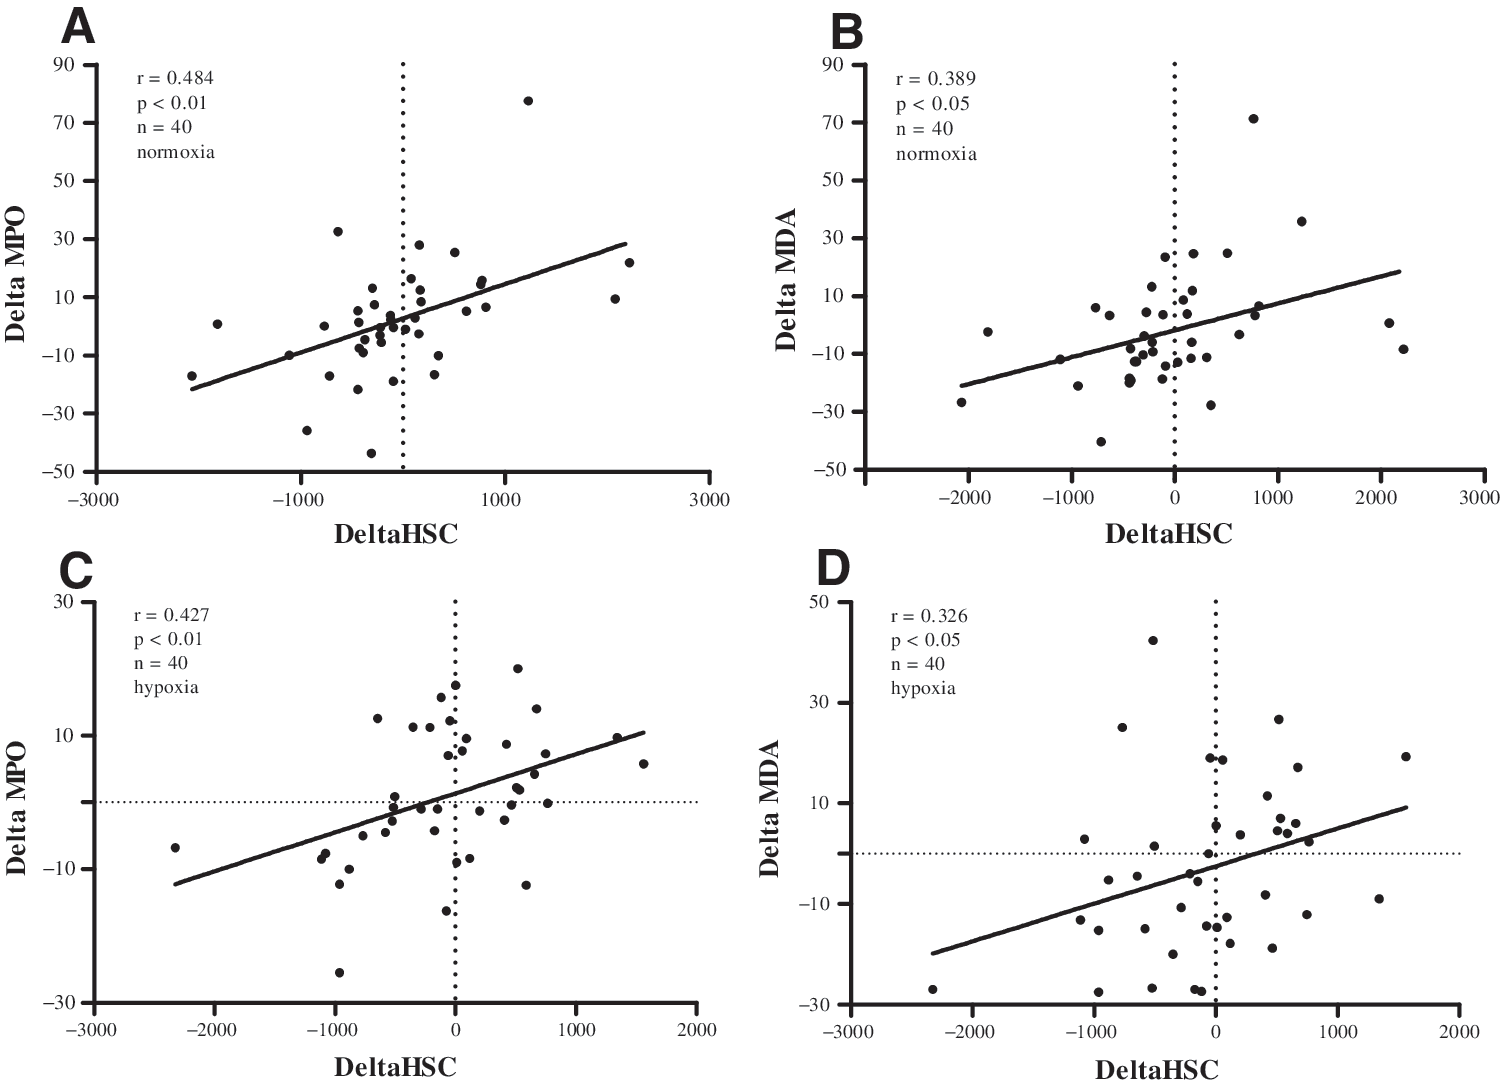
Relationship of CPC release to oxidative stress values. Correlations of released CPCs and respective differences in oxidative stress parameters are shown
Discussion
The main outcome of this study is that ergometry increases circulating progenitor cell frequency 2-fold 10 min postexercise, but at the same time reduces hematopoietic colony-forming capacity.
Little information on kinetics of circulating progenitor cell release can be found in the literature. Mobius-Winkler et al. [30] stated in 2009 that endurance exercise of 4 h cycling led to significant changes in circulating progenitor cells during exercise with a maximum at 210 min after the onset. The pattern of progenitor cell kinetics after the intervention differed from our results. In the Mobius-Winkler study, blood was not collected 10 min postexercise, and 30 min postexercise the stem cell level had already diminished, but values did not return to baseline. In contrast, our results showed a peak release of CD34+/CD45dim cells at 10 min after short-term incremental exercise, where values are already back to baseline 30 min after the cessation of exercise (at this time point there was also a significant decrease to the peak value 10 min postexercise). Furthermore, 120 min postexercise under normoxic conditions, we saw a significant decrease in the progenitor cell level, unlike the Mobius-Winkler group. These findings indicate a different fate of circulating progenitor cells during endurance type and short-term high-intensity exercise. Similar to our findings, Bonsignore et al. [12] reported a different response of hematopoietic progenitors to endurance and maximal exercise. Under hypoxia, the progenitor cell level returned back to baseline values 120 min after the cessation of exercise. Hypoxia at a moderate altitude does not seem to have a significantly different effect on progenitor cell release than exercise under normoxic conditions until 60 min postexercise. Regarding the last time point of blood collection (120 min postexercise), it can be hypothesized that homing dynamics might be different under normoxic and hypoxic conditions, as suggested by Lekli et al. in 2009 [31]. Progenitors could also migrate from the peripheral blood into surrounding tissues, possibly for repair processes [1,32]. Moreover, the CD34+/CD45bright cell fraction, which shows light-scatter properties that are consistent with monocytes [33], significantly increased under hypoxia 10 min postexercise (Table 4). The most interesting finding is the significant decrease of the proliferative capacity expressed as AUC values in the secondary CFU-GM assay. Although the frequency of CD34+/CD45dim cells in the flow cytometry analysis increases significantly after ergometry, the functionality/proliferative capacity of CPCs in the peripheral blood decreases. Moreover, the frequency of colonies in the CFU assay with EPO showed no significant increase, which also suggests that the functionality/proliferative capacity of CPCs decreased significantly 10 min after cessation of exercise. Different outcomes, however, were detected after an endurance exercise model in mice [34], where BFU-E and CFU-GM counts significantly increased in exercise-trained animals versus sedentary controls. Our group also found a significant increase in the proliferative capacity of bone marrow-derived HSCs/HPCs after a life-long voluntary exercise versus sedentary housing condition in a rat model [13]. This additionally suggests a different response of HSC/HPC behavior to endurance and maximal exercise. As far as we know, this is the first study to turn attention to the importance of the functionality/proliferative capacity of CPCs in association with cell frequency and exercise. Our results, as described above, lead to multiple hypotheses. Obviously, the proliferative capacity of hematopoietic progenitor cells in the peripheral blood 10 min postexercise is significantly reduced compared to baseline values. On the one hand this suggests that the cells present are more differentiated progenitors [35] and have already been decreased in their proliferative capacity (shown by secondary CFU-GM expressed as AUC) [13,15]. The measure of CPC functionality by a secondary CFU-GM assay gives only information of the impairment of white progenitor cells. On the other hand, this raises the question whether progenitor release is triggered by increased shear stress in the vascular intraepithelial layer in blood vessels outside of the bone marrow, where CPCs could just be detached from the vessel walls due to the increased blood flow and not directly come from the bone marrow itself [36]. Since the CD34+CD45dim cell fraction also contains circulating endothelial progenitor cells [25], it is to discuss whether the obvious discrepancy between the increase in CPCs and obtained colony counts is due to exaggerated mobilization of endothelial, but not hematopoietic progenitors. According to the manufacturer, the MethoCult culture medium does not support the growth of endothelial progenitor cells. Another hypothesis might be that only cells near to the sinusoids in the bone marrow are mobilized; unlike the ones in the far end of the bone marrow cavity, these do not have very efficient repopulating activity, as summarized by Cross et al. in 2009 [37].
Exercise-induced regeneration might home younger progenitors from the peripheral blood to surrounding tissues where they are needed for repair and substitution processes [38]. In this context, oxidative stress might also play an important role, because it has already been linked to disrupted signal transduction pathways [39]. A rise of oxidative stress markers, as seen in our study, may also lead to a decrease of secondary CFUs in murine HSCs/HPCs [15]. In 2010, Wang and Lin [40] showed that systemic hypoxia could promote lymphocyte apoptosis induced by oxidative stress during moderate exercise. This raises the question whether apoptosis of CPCs could also be induced by oxidative stress triggered by incremental exercise. In this case, our results may suggest that exercise on its own has an influence on apoptotic processes due to oxidative stress (significantly reduced proliferative capacity 10 min post under normoxia). The results of our study also provide evidence that hematopoietic progenitor cell mobilization might be triggered by a contemporaneous induction of oxidative stress as indicated by elevated MDA or MPO levels due to physical exercise. There was a significant positive correlation between the differences in CPCs in the peripheral blood and releases in MDA/MPO plasma levels for both normoxia and hypoxia. It is well known that ROS act as second messenger molecules, but also have the potential to damage cellular structures by oxidation [41,42]. In the case of HSCs/HPCs, the influence of ROS resulted in a dose-dependent decrease of colony formation due to a p38/MAPK-dependent pathway [15]. This pathway is of important physiological relevance, because ROS have a great influence on apoptosis, self-renewal, senescence, proliferation, and differentiation of hematopoietic and endothelial progenitor cells, as documented in the work of Case et al. [43]. Furthermore, a restriction of the self-renewal capacity of HSCs due to an accumulation of oxidative DNA damage was reported in the work of Yahata et al. [44]. Regarding the HSC/HPC release from the bone marrow, Hosokawa et al. found that the N-cadherin-mediated cell adhesion is suppressed by ROS, which results in an exit of HSCs from the bone marrow niche [45]. This finding supports our fairly weak, but significant correlations between the difference in MDA/MPO levels and CPC counts. Within the study-specific observation time, our findings also suggest that short-term hypoxia at a moderate altitude does not have any additional forcing effect on CPC release. Regarding growth of erythroid progenitors, one has to consider the time-delayed effect of hypoxia at moderate altitudes on EPO production and subsequent BFU-E development. According to Bartsch et al. [46], even high altitudes show a delayed effect on erythropoiesis. In addition, intermittent hypoxia at 12%–10% O2 did not show any effect on EPO production [47]. Katayama et al. [48] report that even 3h at 12.3% O2 daily over 14 days did not show any effect on EPO in plasma.
To our knowledge, this is the first study to investigate the effect of physical exercise on the release of CPCs and their functionality/proliferative capacity and the contemporaneous induction of oxidative stress markers. Further experiments are necessary to evaluate the accuracy and importance of our hypotheses. The possible influence of other metabolic variables, such as blood-lactate-concentration, on CPC release will also have to be evaluated. In a pilot study [49], we found a significant relationship between HSC release and maximal lactate values. Its validity will have to be investigated in another study design involving different exercise modes.
Limitations
Only healthy athletic male subjects were used in this study design, which limits the results to a very specific group of people.
Determining cell functionality
Limiting dilution transplant experiments are the gold standard regarding the analysis of stem cell quality, but impracticable for this experimental design due to the following simple reason: the frequency of CPCs in the human peripheral blood is very low. To reach the required number of 1×10⁵ CD34+ cells for transplantation in an NOD/SCID mouse model [44,50], a blood withdrawal of 200 mL would be necessary at each time point, which is infeasible and not justifiable. The secondary CFU assay, however, is a measurement of the clonal myeloid proliferative capacity and therefore function of CPCs [10,13,15] and only requires a reasonable amount of peripheral blood for the procedure.
Footnotes
Acknowledgments
We would like to thank Dr. Werner Groeschl, Mario Frei, and Peter Rohrer for their excellent medical and technical assistance. Furthermore, we would also like to express our gratitude to Dr. Franz Quehenberger for his statistical advice calculating the AUCs. We would like to acknowledge the Franz-Lanyar-Stiftung, Land Steiermark (Wissenschaftsabteilung), and Österreichische Gesellschaft für Alpin- und Höhenmedizin (ÖGAHM) as financially supporting organizations.
Author Disclosure Statement
No competing financial interests exist.