




Abstract
The cell cycle in pluripotent stem cells is notable for the brevity of the G1 phase, permitting rapid proliferation and reducing the duration of differentiation signal sensitivity associated with the G1 phase. Changes in the length of G1 phase are understood to accompany the differentiation of human embryonic stem cells (hESCs), but the timing and extent of such changes are poorly defined. Understanding the early steps governing the differentiation of hESCs will facilitate better control over differentiation for regenerative medicine and drug discovery applications. Here we report the first use of real-time cell cycle reporters in hESCs. We coexpressed the chromatin-decorating H2B-GFP fusion protein and the fluorescence ubiquitination cell cycle indicator (FUCCI)-G1 fusion protein, a G1 phase-specific reporter, in hESCs to measure the cell cycle status in live cells. We found that FUCCI-G1 expression is weakly detected in undifferentiated hESCs, but rapidly increases upon differentiation. hESCs in the G1 phase display a reduction in undifferentiated colony-initiating cell function, underscoring the relationship between G1 phase residence and differentiation. Importantly, we demonstrate inter- and intracolony variation in response to chemicals that induce differentiation, implying extensive cell–cell variation in the threshold necessary to alter the G1 phase length. Finally, gain of differentiation markers appears to be coincident with G1 phase lengthening, with distinct G1 phase profiles associated with different markers of early hESC differentiation. Our data demonstrate the tight coupling of cell cycle changes to hESC differentiation, and highlight the cell cycle reporter system and assays we have implemented as a novel avenue for investigating pluripotency and differentiation.
Introduction
T
The tight regulation of the G1 phase length during development appears to stem from the role G1 phase plays in cell fate decisions [20 –23], with a short G1 phase hypothesized to help isolate cells from promiscuous differentiation signals. Modulation of cell cycle regulatory molecules that control G1 checkpoints and passage through G1 to S phase alters the ability of a cell to undergo apoptosis, enter or remain in quiescence, or differentiate. The differentiation process appears to be regulated primarily by negative regulators of proliferation, such as p21 and p27. Levels of p21 or p27 increase during the differentiation of a broad range of cells, including oligodendrocytes and erythroid progenitors [24 –26], intestinal epithelial cells [27], and keratinocytes [28]. These G1 phase regulatory mechanisms also function in hESCs; levels of p21 and p27 both increase on differentiation [29].
Despite these clear trends, the details of the kinetics of cell cycle changes, such as G1 phase extension onset during lineage-specific differentiation of hESCs, remain unanswered. Investigating the cell cycle status in mammalian cells has been limited by traditional techniques, including BrdU or Ki67 labeling, which necessitates the compromising of cell viability, preventing the prospective isolation of live cells in distinct cell cycle phases. Sakaue-Sawano and colleagues recently broke this impass by developing a live-cell reporter system [fluorescence ubiquitination cell cycle indicator (FUCCI)] that provides unparalled access to the cell cycle progress of viable cells [30]. FUCCI-G1 is a G1-phase-indicating live fluorescent reporter created by fusing the orange fluorophore mKO2 [31] to an N-terminus fragment of Cdt1 [30]. Truncated Cdt1 in this fusion protein contains only the regulatory elements responsible for its degradation and lacks DNA-licensing capabilities. Tight, cell cycle-dependent degradation of Cdt1 results in orange fluorescence only during the G1 phase. We deployed the G1-phase-reporting element of the FUCCI system in human ESCs to investigate historical observations describing the existence of a truncated G1 phase in ESCs. We linked the FUCCI-G1 reporter to H2B-GFP, which demarcates chromatin [32], to ensure that our dual reporter would be compatible with automated microscopy and software-based image quantification. The dual reporter system we have compiled represents a novel multiplexing of 2 extant reporters in hESCs, producing a powerful new tool for investigating cell cycle changes.
Here we use these live-cell reporters of the cell cycle status to describe the cell cycle kinetics of undifferentiated hESCs, and how differentiation imparts changes in the duration of total cell cycle and G1 phase length. We provide data illustrating the relationship between lineage-specific differentiation and cell cycle changes, while also providing a functional proof linking the G1 phase length with the differentiation status.
Methods
Cell culture
H1 and H9 hESC lines [33] were cultured on X-ray-inactivated MEFs on 1.0% gelatin-coated tissue culture plates (Falcon) as previously described [34]. Briefly, cells were passaged by treatment with 1 mg/mL Collagenase IV (Invitrogen) at 37°C followed by mechanical scraping. hESCs were maintained in a KO DMEM (Invitrogen), with 15% serum replacement (Invitrogen), 2 mM Gluta-Max (Invitrogen), 100 μM nonessential amino acids (Invitrogen), and 8 ng/mL bFGF (Peprotech).
Generation of reporter constructs and stable hESC reporter lines
The FUCCI reporter system was obtained from MBL International. The H2BGFP-F2A-mKO2Cd1-IRES-Puro (H2GFOIP) fragment was generated by synthesis of the F2A-mKO2-Cdt1 fragment (GeneArt; Life Technologies) and subsequent insertion of a H2B-GFP fragment between upstream KpnI and ApaI sites. pCAG H2GFOIP was created by ligating the H2GFOIP insert [AvrII (blunt)/BglII digested] into a pCAG expression vector [Age (blunt)/BglII digested], and validated by sequencing (MOBIX; McMaster University).
About 20 μg of linearized CAG-H2GFOIP expression plasmids were electroporated into H1 [33] and H9 (WiCell) hESC parental lines. PiggyBac H1 and H9 hESC lines were created with 20 μg of pB-CAG-H2GFOIP plus 5 μg of transposase pCYL43 (Sanger Institute, UK). The pB-CAG vector was generously provided by Dr. Andras Nagy. Electroporation conditions were based on those previously described [35]. Cells were selected with puromycin (1 μg/mL), and individual colonies manually picked, and expanded once established.
Differentiation
Small-molecule inducers of differentiation were diluted in a complete hESC medium (defined above). Compounds and final concentrations used were 1.0% dimethyl sulfoxide (DMSO) (Sigma-Aldrich); 3 mM HMBA (Sigma-Aldrich); 40 μM RRD-251 (Sigma-Aldrich); and 40 μM LY294002 (Calbiochem).
Endoderm differentiation protocols were based on those previously described [36]. hESCs were grown to near confluence, and then washed 1× with phosphate buffered saline (PBS), and placed in a basal endoderm differentiation medium RPMI (Sigma-Aldrich) with 2 mM Gluta-Max supplemented each day as follows: day 1: 100 ng/mL activin A (Peprotech) and 25 ng/mL Wnt3a (Peprotech); day 2: 100 ng/mL activin A and 0.2% fetal bovine serum (FBS); day 3: 100 ng/mL activin A and 2% FBS.
Neural differentiation was based on a previously described protocol [37]. Monolayer hESCs were cultured to ∼60% confluency, and then the hESC medium without bFGF supplemented with 5 μM SB431542 (Tocris) and 5 μM dorsomorphin (Torcris) was added to cells. The medium was changed every 2 days. Cells were then grown in DMEM-F12 (Invitrogen) with 1× N2 supplement (Invitrogen) and 20 ng/mL bFGF for 6 days. The medium was changed every 2 days.
Fluorescence-activated cell sorting
hESCs were dissociated to single cells with TrypLE (Invitrogen), stained with the viability dye 7-aminoactinomycin D (7-AAD; Immunotech) to exclude dead cells. For the A2B5 sort, co-stained with A2B5 antibody (1:100; APC conjugated; Miltenyi Biotec; #130-093-58), diluted in a staining buffer (1% FBS in PBS with 1 mM EDTA) for 30 min on ice, and then washed 2 times with staining buffer, and stained with 7-AAD. Populations were fractionated using Aria II (BD Biosciences).
Indirect immunofluorescence
CAG H2GFOIP hESCs were passaged and differentiated as described above. Cells were washed once with 1× PBS with Mg+2/Ca+2, fixed at room temperature for 8 min with 4% paraformaldehyde (PFA) in 1× PBS, and washed 3 times with 1× PBS. Fixed cells were permeabilized with ice-cold 100% methanol for 2 min at room temperature and washed 3 more times with PBS. Before staining, cells were blocked for 15 min at room temperature with 1% BSA (Sigma-Aldrich) in 1× PBS and washed once with 1× PBS. Antibodies were diluted in a blocking solution. Primary antibodies were incubated at 4°C overnight, washed 3 times with 1× PBS, and secondary antibodies incubated for 1 hr at room temperature. Stained cells were stored in 1× PBS with Hoechst 33342 nuclear stain. Primary antibodies used were as follows: OCT4 (1:200; BD #611203), NANOG (1:400; Cell Signalling #4903), SOX2 (1:300; BD #561469), p21 (1:400; Cell Signalling #2947), p27 (1:400; Cell Signalling #3686), Ki-67 (1:100; Santa Cruz #sc-23900), Cyclin B1 (1:50; Cell Signalling #4138), LAMIN A/C (1:100; Santa Cruz #sc-6215), EOMES (1:50; Abcam #AB23345), GATA4 (1:300; Santa Cruz #sc-9053), TCF2 (1:250; BD #612504), SOX1 (1:150; R&D #AF3369), and SKP2 (1:100; Santa Cruz #sc-7164). Secondary antibodies used were as follows: goat anti-mouse AF-647 (1:500; Invitrogen #A-21238), donkey anti-rabbit AF-647 (1:500; Invitrogen #A-31571), or rabbit anti-goat AF-647 (1:500; Invitrogen #A-21446). Nuclei were co-stained with Hoechst 33342.
Imaging, analysis, and cell tracking
All imaging of fixed cells was performed on a Cellomics Array Scan HCS Reader (Thermo Scientific) or a Operetta High Content Screening System (Perkin Elmer). For live-cell imaging, H2GFOIP cells were passaged and plated as described above. Two days after passage, the plates were placed in a BioStation CT-integrated cell culture observation system (Nikon) for observation. Colonies were visually selected for time-lapse observation; phase, GFP, and mKO2 images were acquired every 3–6 h for dose–curve experiments and every 15 min for high-resolution cell-tracking experiments for 3 days.
Image analysis of immunofluorescence and reporter fluorescence was performed using Accapella high-content and analysis software (Perkin Elmer). Cell nuclei were identified by Hoechst 33342 staining, and the fluorescence intensity of the same nuclei in the FITC, Cy3, and Cy5 channels was measured. Custom MatLab (Mathworks) scripts were then used to quantify the fluorescent intensity of each nuclei in all channels and output scatter plots and statistics.
Cells were tracked with the MTrackJ plugin for ImageJ (rsbweb.nih.gov/ij/). Cell measurements for H2BGFP and mKO2-Cdt1 intensities from each track were plotted with Prism 5 (GraphPad). Lineage trees were generated using FigTree v1.3.1 software (
Reverse transcriptase quantitative polymerize chain reaction and transgene copy number assay
Approximately 500,000 cells per population for each experiment were collected. mRNA was extracted (RNAeasy kit; Qiagen), and synthesized to cDNA (iScript kit; Bio-Rad). Reverse transcriptase quantitative polymerize chain reaction (RT-qPCR)s were run with SYBR Green (Bio-Rad) on a CFX96 Touch™ Real-Time PCR Detection System (Bio-Rad). Bio-Rad CFX Manager software was used for analysis.
Transgene copy number assay was performed on a ViiA™ 7 real-time PCR system (Life Technologies) using TaqMan® assays (Life Technologies) for RNase P (Catalog #: 4403326), hTERT (Assay ID: Hs06055639_cn), and GFP (Assay ID: Mr00660654_cn) on genomic DNA extracted from wild-type hESCs and H2GFOIP clones. The GFP-transgene copy number was relatively quantified using CopyCaller® software v2.0 (Life Technologies), where RNase P was used as an internal control for each sample, and hTERT was used as the calibrator with a known copy number of 2 in the human genome. Efficiencies of hTERT and GFP assays were assessed using cycle threshold values (Ct) for 1:5-fold dilutions of H1 H2GFOIP clone 6 genomic DNA, ranging from 100 to 0.8 ng. (Supplementary Fig. S1B; Supplementary Data are available online at
Colony-initiating cell assay
H2GFOIP cells were grown in a standard hESC medium until confluent, and sorted by fluorescence-activated cell sorting (FACS) into FUCCI-G1+ and FUCCI-G1− populations as described above. Isolated populations of cells were plated in triplicate at densities of 2.5×10⁴, 5.0×10⁴, or 1×10⁵ cells per well of an MEF-coated 6-well plate. A second replicate of 5.0×10⁴ cells was grown with Rock inhibitor Y27632 added to the medium for 24 h after plating to increase cellular viability [38]. Cells were grown for 12 days until established colonies appeared, and then fixed and stained for alkaline phosphatase activity with a VECTOR Red Alkaline Phosphatase Substrate Kit (Vector laboratories). Plates of fixed and stained cells were scanned on a flatbed scanner (Canon), and image analysis and quantification performed in ImageJ using custom scripts to identify colony units.
Cell motility assay
Eight-μM pore Boyden chamber inserts were precoated with Matrigel and then 1×10⁵ H2GFOIP cells seeded in a feeder-conditioned hESC medium (FCM) supplemented with 10 μM Y27632. After 24 h, the FCM was substituted for fresh FCM (control) or 10% FBS in the upper and lower chamber, the latter serving as a motility and differentiation inducer. After 48 h, the top of the porous membranes was cleared by using a cotton-tipped applicator, and then the migrated cells were fixed with 4% PFA. The inserts were then imaged using the Operetta High Content Screening System.
Statistical analysis
All graphs generated from the automated image analysis are derived from at least 2 cell lines and an n of between 3 and 6. Each n involved the analysis of >10,000 cells. Error bars show standard error of the mean (SEM). Prism 5 (GraphPad) was used for statistical analysis. Statistical significance: *=p<0.01, **=P<0.001, ***p<0.0001.
Results
Generation of hESC lines stably expressing a cell cycle reporter
To establish the kinetics of the G1 phase change during human ESC differentiation, we employed the FUCCI reporter system, which has previously been shown to be an accurate gauge of cell cycle position and is compatible with the development of live mice [30]. Pluripotent ESCs are noted for their truncated G1 phase, so we utilized the FUCCI-G1 reporter, a fusion of the orange fluorescent protein mKO2 to a fragment of Cdt1 (herein referred to as FUCCI-G1) [30]. The periodic nature of the G1 phase during the cell cycle, combined with and the potential for mosaic expression of transgenes in ESCs [39], presented the possibility that the expression pattern observed in hESC lines carrying the FUCCI-G1 reporter lines could be hard to interpret. To address this, we modified the FUCCI-G1 reporter to include a permanent nuclear marker that would confirm the ubiquitous expression of the FUCCI-G1 transgene in live cells. Fusion of the histone-binding protein H2B to GFP (H2B-GFP) effectively demarcates nuclei [32], without the need for DNA staining, which can be cytotoxic and cytostatic [40]. We used a picornaviral 2A sequence [41] to link H2B-GFP to FUCCI-G1, creating a bicistronic message that ensured simultaneous, but separate, translation of the H2B-GFP and FUCCI-G1 proteins (H2GFOIP; Fig. 1A). We placed the H2GFOIP dual-reporter cassette under the control the powerful CAG ubiquitous promoter [42] and linked by an IRES site to a puromycin selection cassette. We then generated stably expressing clones of H1 and H9 hESCs containing the H2GFOIP reporter by electroporation, and picked >3 clones of each cell line for expansion, which had ∼1–18 copies of the H2GFOIP transgene inserted (Supplementary Fig. S1A). Despite the variability in number of transgenes inserted, all hESC clones containing the H2GFOIP reporter behaved similarly and displayed the same phenotype when observed under a fluorescence-based microscope: FUCCI-G1 was absent or weakly expressed in colonies that were morphologically undifferentiated; however, numerous bright FUCCI-G1-positive nuclei were found to surround the undifferentiated hESC colonies or were found in clusters that corresponded to morphologically differentiated hESC colonies (Fig. 1B and Supplementary Fig. S2).
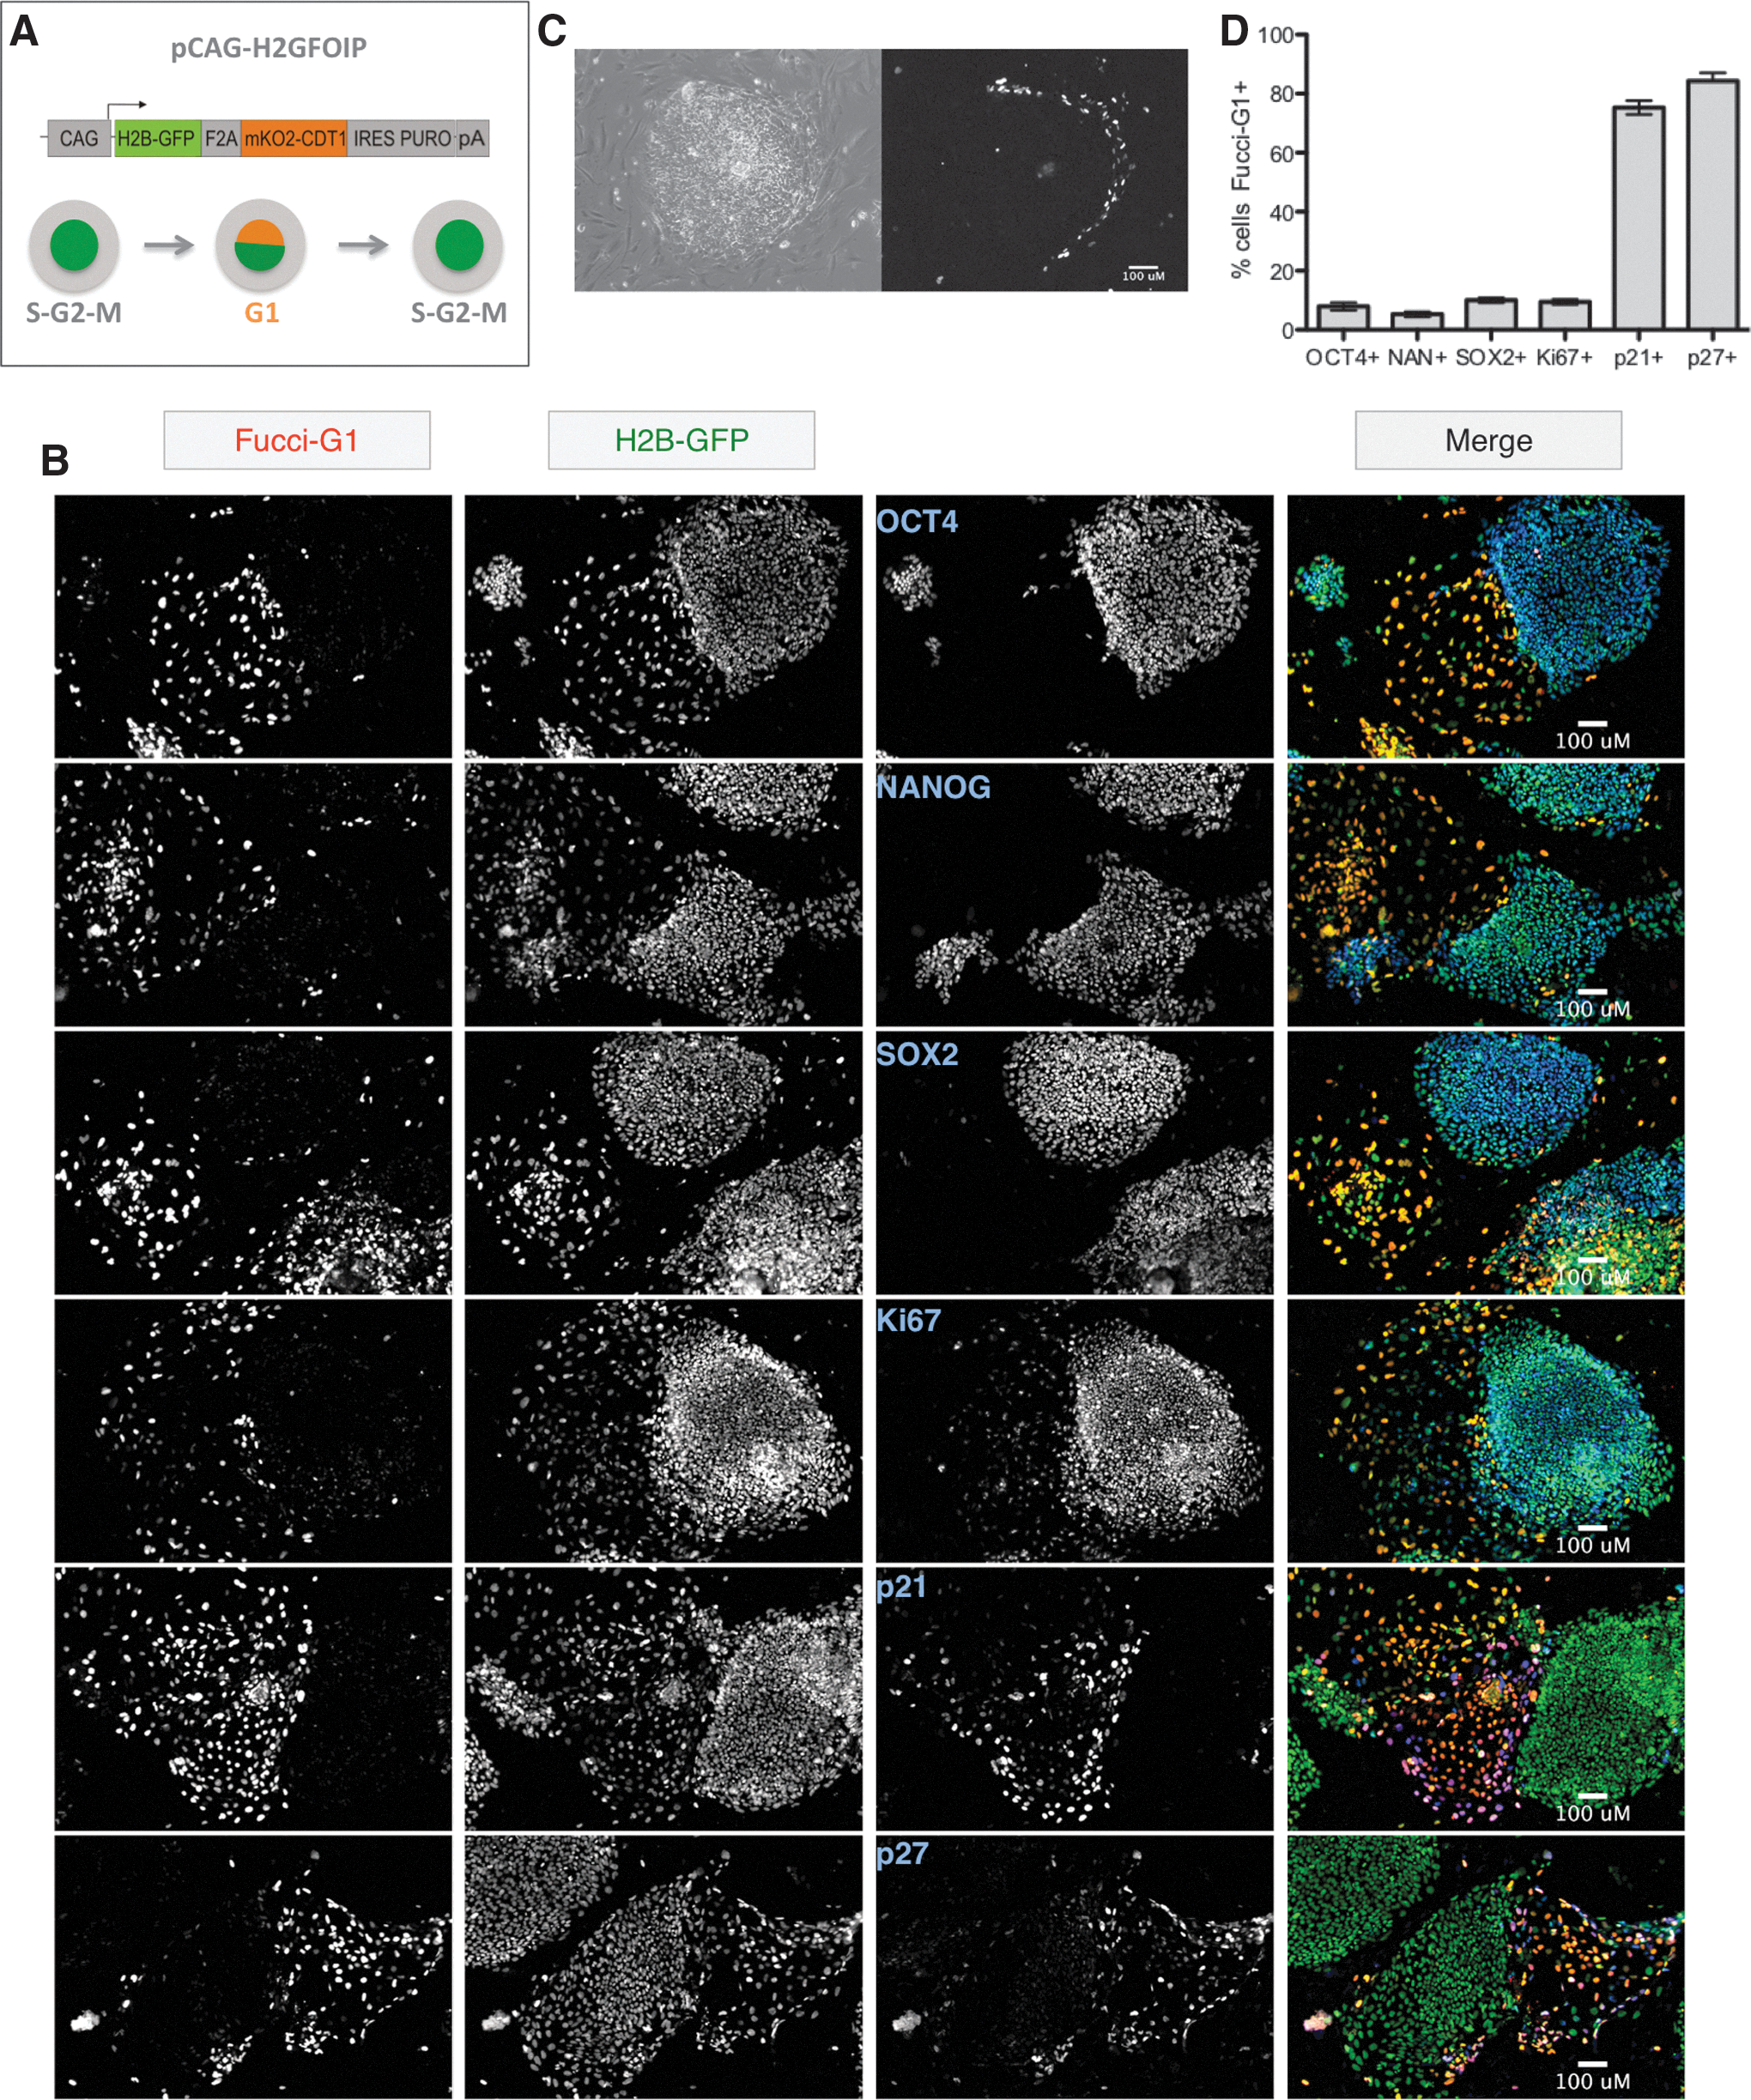
A G1 phase reporter is expressed at low levels in pluripotent human embryonic stem cells (hESCs).
Validation of FUCCI-G1 reporter fidelity in human cells
To ensure that the FUCCI-G1 reporter displayed the same G1 phase cell cycle restriction in human cells as observed in mouse, we co-stained H2GFOIP-expressing hESCs with markers of the cell cycle that indicate cell cycle position. The expression and distribution of Ki67 can be used as a guide for identifying cell cycle position [15,43]. HESCs expressing FUCCI-G1 displayed a pattern of Ki67 distribution most frequently associated with the G1 phase (Supplementary Fig. S3A, B). SKP2 is an E3 ubiquitin ligase that is expressed throughout the S and G2 phases of the cell cycle, but is degraded during the G1 phase [44]. Co-staining of H2GFOIP hESCs with SKP2 and subsequent coexpression quantification demonstrated that FUCCI-G1 expression displays virtually no overlap with SKP2 expression in hESCs (Supplementary Fig. S3C, D). CYCLIN B1 is cytoplasmic from the S phase through late G2, then nuclear during mitosis, and degraded during G1 [45]. CYCLIN-B1 co-staining of H2GFOIP hESCs revealed that FUCCI-G1 was expressed in cells that were absent for CYCLIN-B1 expression (Supplementary Fig. S3E). Together, these observations show that FUCCI-G1 expression is restricted to the G1 phase of the cell cycle in human cells.
A minority of pluripotent hESCs are in the G1 phase
Previous attempts to quantify the distribution of hESCs in the phases of the cell cycle have been performed on bulk cultures of cells, under the assumption that all cells within a given culture are equivalent. More recently, we have demonstrated that heterogeneity due to spontaneous differentiation is a significant and confounding issue when investigating the properties of pluripotent stem cells [46]. To negate the caveats associated with the heterogeneity commonly found in hESC cultures, we co-stained the H2GFOIP hESC lines with markers of pluripotency and then measured the coincidence of FUCCI-G1. Cultures of undifferentiated H2GFOIP hESCs were co-stained with antibodies to the pluripotency markers OCT4, NANOG, and SOX2. The expression of all 3 pluripotency markers, and to a lesser extent the proliferation marker Ki67, was almost completely restricted to the colonies of morphologically undifferentiated hESCs and displayed little overlap with bright FUCCI-G1 expressing cells (Fig. 1C). A converse pattern was observed for the high overlap of FUCCI-G1 expression with that of p21 or p27, both CDK inhibitory proteins that are associated with a lengthened G1 phase and differentiation. To quantify the relationship between pluripotency and the lengthened G1 phase at the cell level, we measured the overlap between antibody staining and the FUCCI-G1 expression by high-content automated imaging and analysis (see Supplementary Fig. S4 for summary of workflow). This analysis revealed that a minority of cells expressing pluripotency markers also expressed FUCCI-G1, in direct contrast to the majority of spontaneously differentiated cells expressing p21 or p27 (Fig. 1D). In addition, the expression of p21 was also most closely associated with the hESCs displaying brighter expression of FUCCI-G1 (Supplementary Fig. S5). The overlap of OCT4 with p21 in undifferentiated cultures was <2% (data not shown).
We next performed a colony-level quantification of FUCCI-G1 and pluripotency marker expression (see Supplementary Fig. S6 for summary of workflow). Images acquired from the high-content automated imaging were stitched together in silico to form seamless montages covering ∼0.28 cm2 of a well, permitting software-based identification and quantification of colonies and their properties. This assay demonstrated that the majority of colonies in undifferentiated cultures of hESCs display a high-average OCT4:FUCCI-G1 intensity ratio of 4.6:1 (Fig. 2A, B). Treatment of H2GFOIP cells with 1% DMSO for 48 h did not impact the OCT4:FUCCI-G1 intensity ratio in every colony to the same extent, but did reduced the average OCT4:FUCCI-G1 intensity ratio to 1.5:1 (Fig. 2B–D). These data illustrate the strong relationship between FUCCI-G1 expression and the loss of OCT4 at the colony level, while also demonstrating hESC intercolony variation in response to differentiation stimuli.
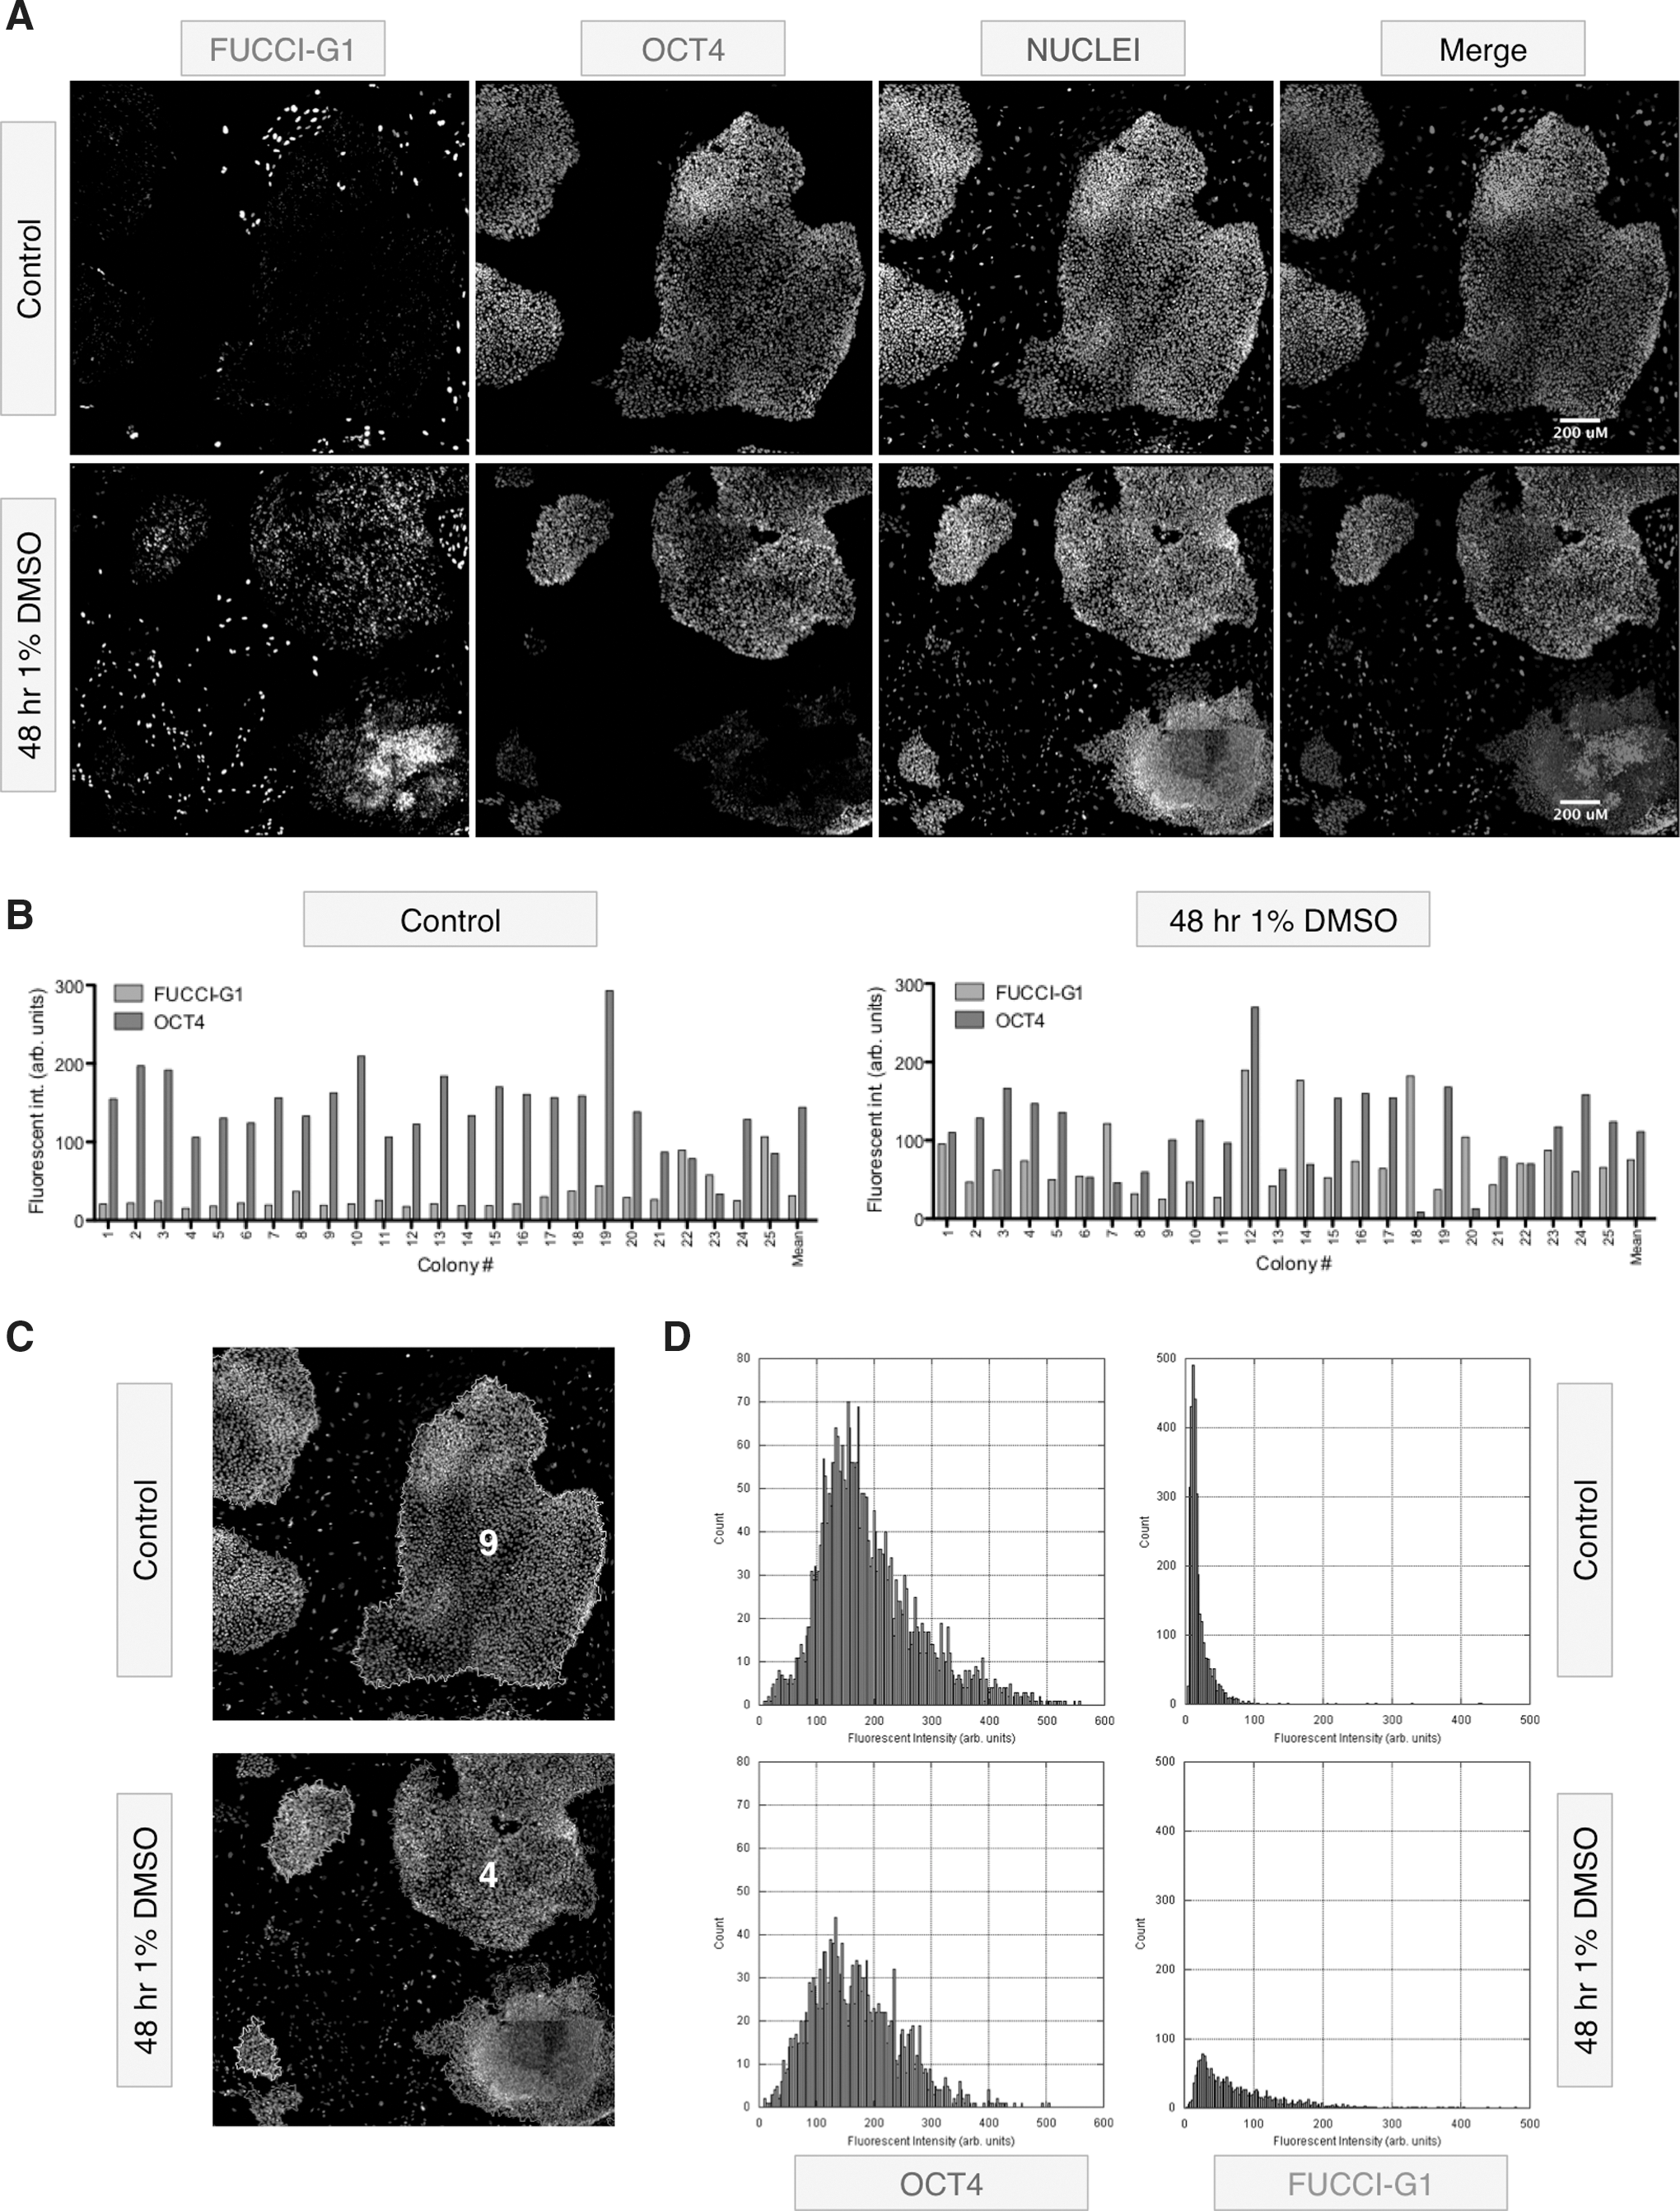
Colony-based analysis of FUCCI-G1 expression.
These observations were consistent between the H1 and H9 hESC lines, and describe that a minority of pluripotent hESCs are in the G1 phase of the cell cycle, and that the expression of FUCCI-G1 is most likely to be found in differentiating hESCs.
FUCCI-G1 expression in hESCs reveals functional differences
The high correlation between hESCs in the G1 phase and differentiation markers (Fig. 1) suggested that expression of the FUCCI-G1 reporter identifies hESCs with functionally distinct characteristics. To test this hypothesis, we fractionated H2GFOIP hESC cultures by expression of the FUCCI-G1 reporter into FUCCI-G1-negative (−) and FUCCI-G1-positive (+) populations using FACS and then performing a colony-initiating cell (CIC) assay, a functional measure of self-renewal capacity [47]. FUCCI-G1+ and FUCCI-G1− fractions were seeded at a range of densities on MEF-coated 6-well plates and then recultured for 12 days in undifferentiated hESC growth conditions. We then used alkaline phosphatase activity to assay the number of pluripotent colonies [48]. The FUCCI-G1− fraction consistently gave rise to significantly more alkaline phosphatase-positive colonies than the FUCCI-G1+ cells across all seeding densities (Fig. 3A, B). Treatment with Y27632, a Rho kinase inhibitor, has been demonstrated to improve the cloning efficiency of hESCs [39]. Post-FACS treatment of both FUCCI-G1 populations with Y27632 elevated the cloning efficiency in both fractions by more than 10-fold, although the FUCCI-G1− cells continued to give rise to significantly more pluripotent colonies than the FUCCI-G1+ fraction.
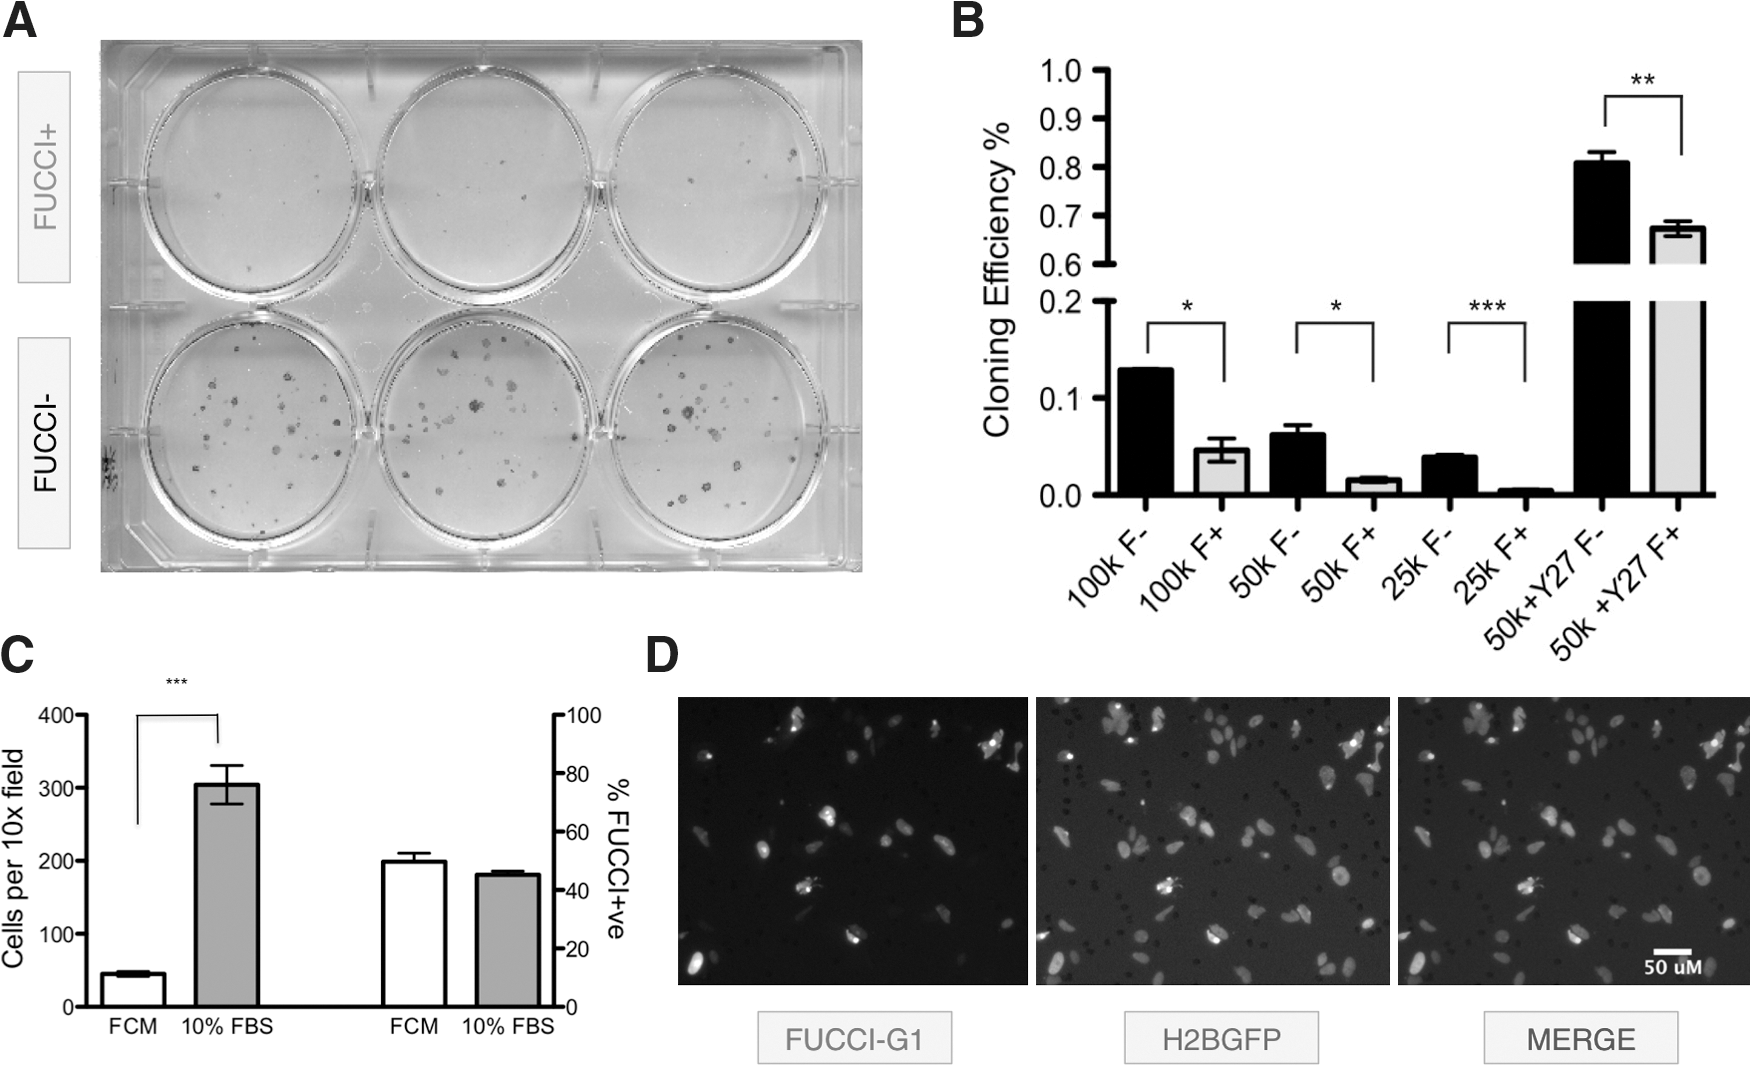
Analysis of hESCs by FUCCI-G1 expression.
We next assessed the cell cycle properties of H2GFOIP hESCs in a cell motility assay. Undifferentiated hESCs display strong epithelial bonds mediated by E-Cadherin, which are lost during differentiation to more motile mesenchymal-like cells [49]. H2GFOIP cells grown in 10% FBS for 48 h displayed a sixfold increase in motility in an 8-μM-pore transwell chamber assay, when compared to cells in control cells treated with FCM (Fig. 3C). Regardless of treatment, approximately half of all cells that demonstrated motility by transiting through the 8-μM transwell pores expressed FUCCI-G1 (Fig. 3C, D).
These data unequivocally demonstrate that residence in the G1 phase in hESCs is most closely associated with a functionally differentiated phenotype, and that identification of hESCs in the G1 phase can be used to enrich cells with distinct functional properties.
Differentiated hESCs display diverse G1 phase profiles
FUCCI-G1 expression is low in cells expressing pluripotency markers; however, little is understood about the cell cycle status of hESCs that have committed to differentiate. To examine the relationship between germ layer differentiation and cell cycle phase distribution, we co-stained H2GFOIP hESCs that had either undergone spontaneous differentiation or been subjected to protocols that induced endoderm or neural differentiation. LAMIN A/C is an intermediate filament protein that has been shown to be upregulated in the spontaneously differentiated cells surrounding undifferentiated hESC colonies [50], and can be associated with a mesenchymal cell fate [51]. In undifferentiated cultures of H2GFOIP hESCs, we found that LAMIN A/C expression was restricted to the cells outside of the undifferentiated hESC colonies (Fig. 4A). Approximately one-third of LAMIN A/C-positive cells also expressed FUCCI-G1 (Fig. 4B). Induction of endoderm differentiation [36] by H2GFOIP hESCs generated cells that stained positive for the endoderm markers EOMES, GATA4, FOXA2, and TCF2 (Fig. 4A). Two-thirds of cells expressing the early endoderm markers EOMES, GATA4, and FOXA2 also expressed FUCCI-G1 (Fig. 4B), whereas almost all TCF2- (HNF1B) positive cells also expressed FUCCI-G1. These data suggest that EOMES, GATA4, and FOXA2, all mark endoderm cells with similar proliferative profiles, but a greater proportion of TCF2-expressing cells is in G1, and apparently represent a population of cells with a slower proliferation rate. In contrast to the cell cycle phase profile of endoderm cells, neural differentiation of hESCs induced SOX1- and SOX2-positive cells, which both displayed a low frequency of cells in the G1 phase (Fig. 4B and Supplementary Fig. S7), an observation consistent with the rapidly proliferating phenotype previously described for neural stem cells. Q-RT-PCR on FACS-isolated populations of FUCCI-G1+ and FUCCI-G1− from endoderm-differentiated hESCs demonstrated that markers associated with endoderm differentiation were enriched within the FUCCI-G1+ cells relative to the FUCCI-G1− population (Supplementary Fig. S8). Similarly, pluripotency markers were depleted in the FUCCI-G1+ population. These observations, supported by our endoderm-associated antibody-based imaging analysis (Fig. 4A), demonstrate the preponderance for cells expressing endoderm markers to be in the G1 phase of the cell cycle.
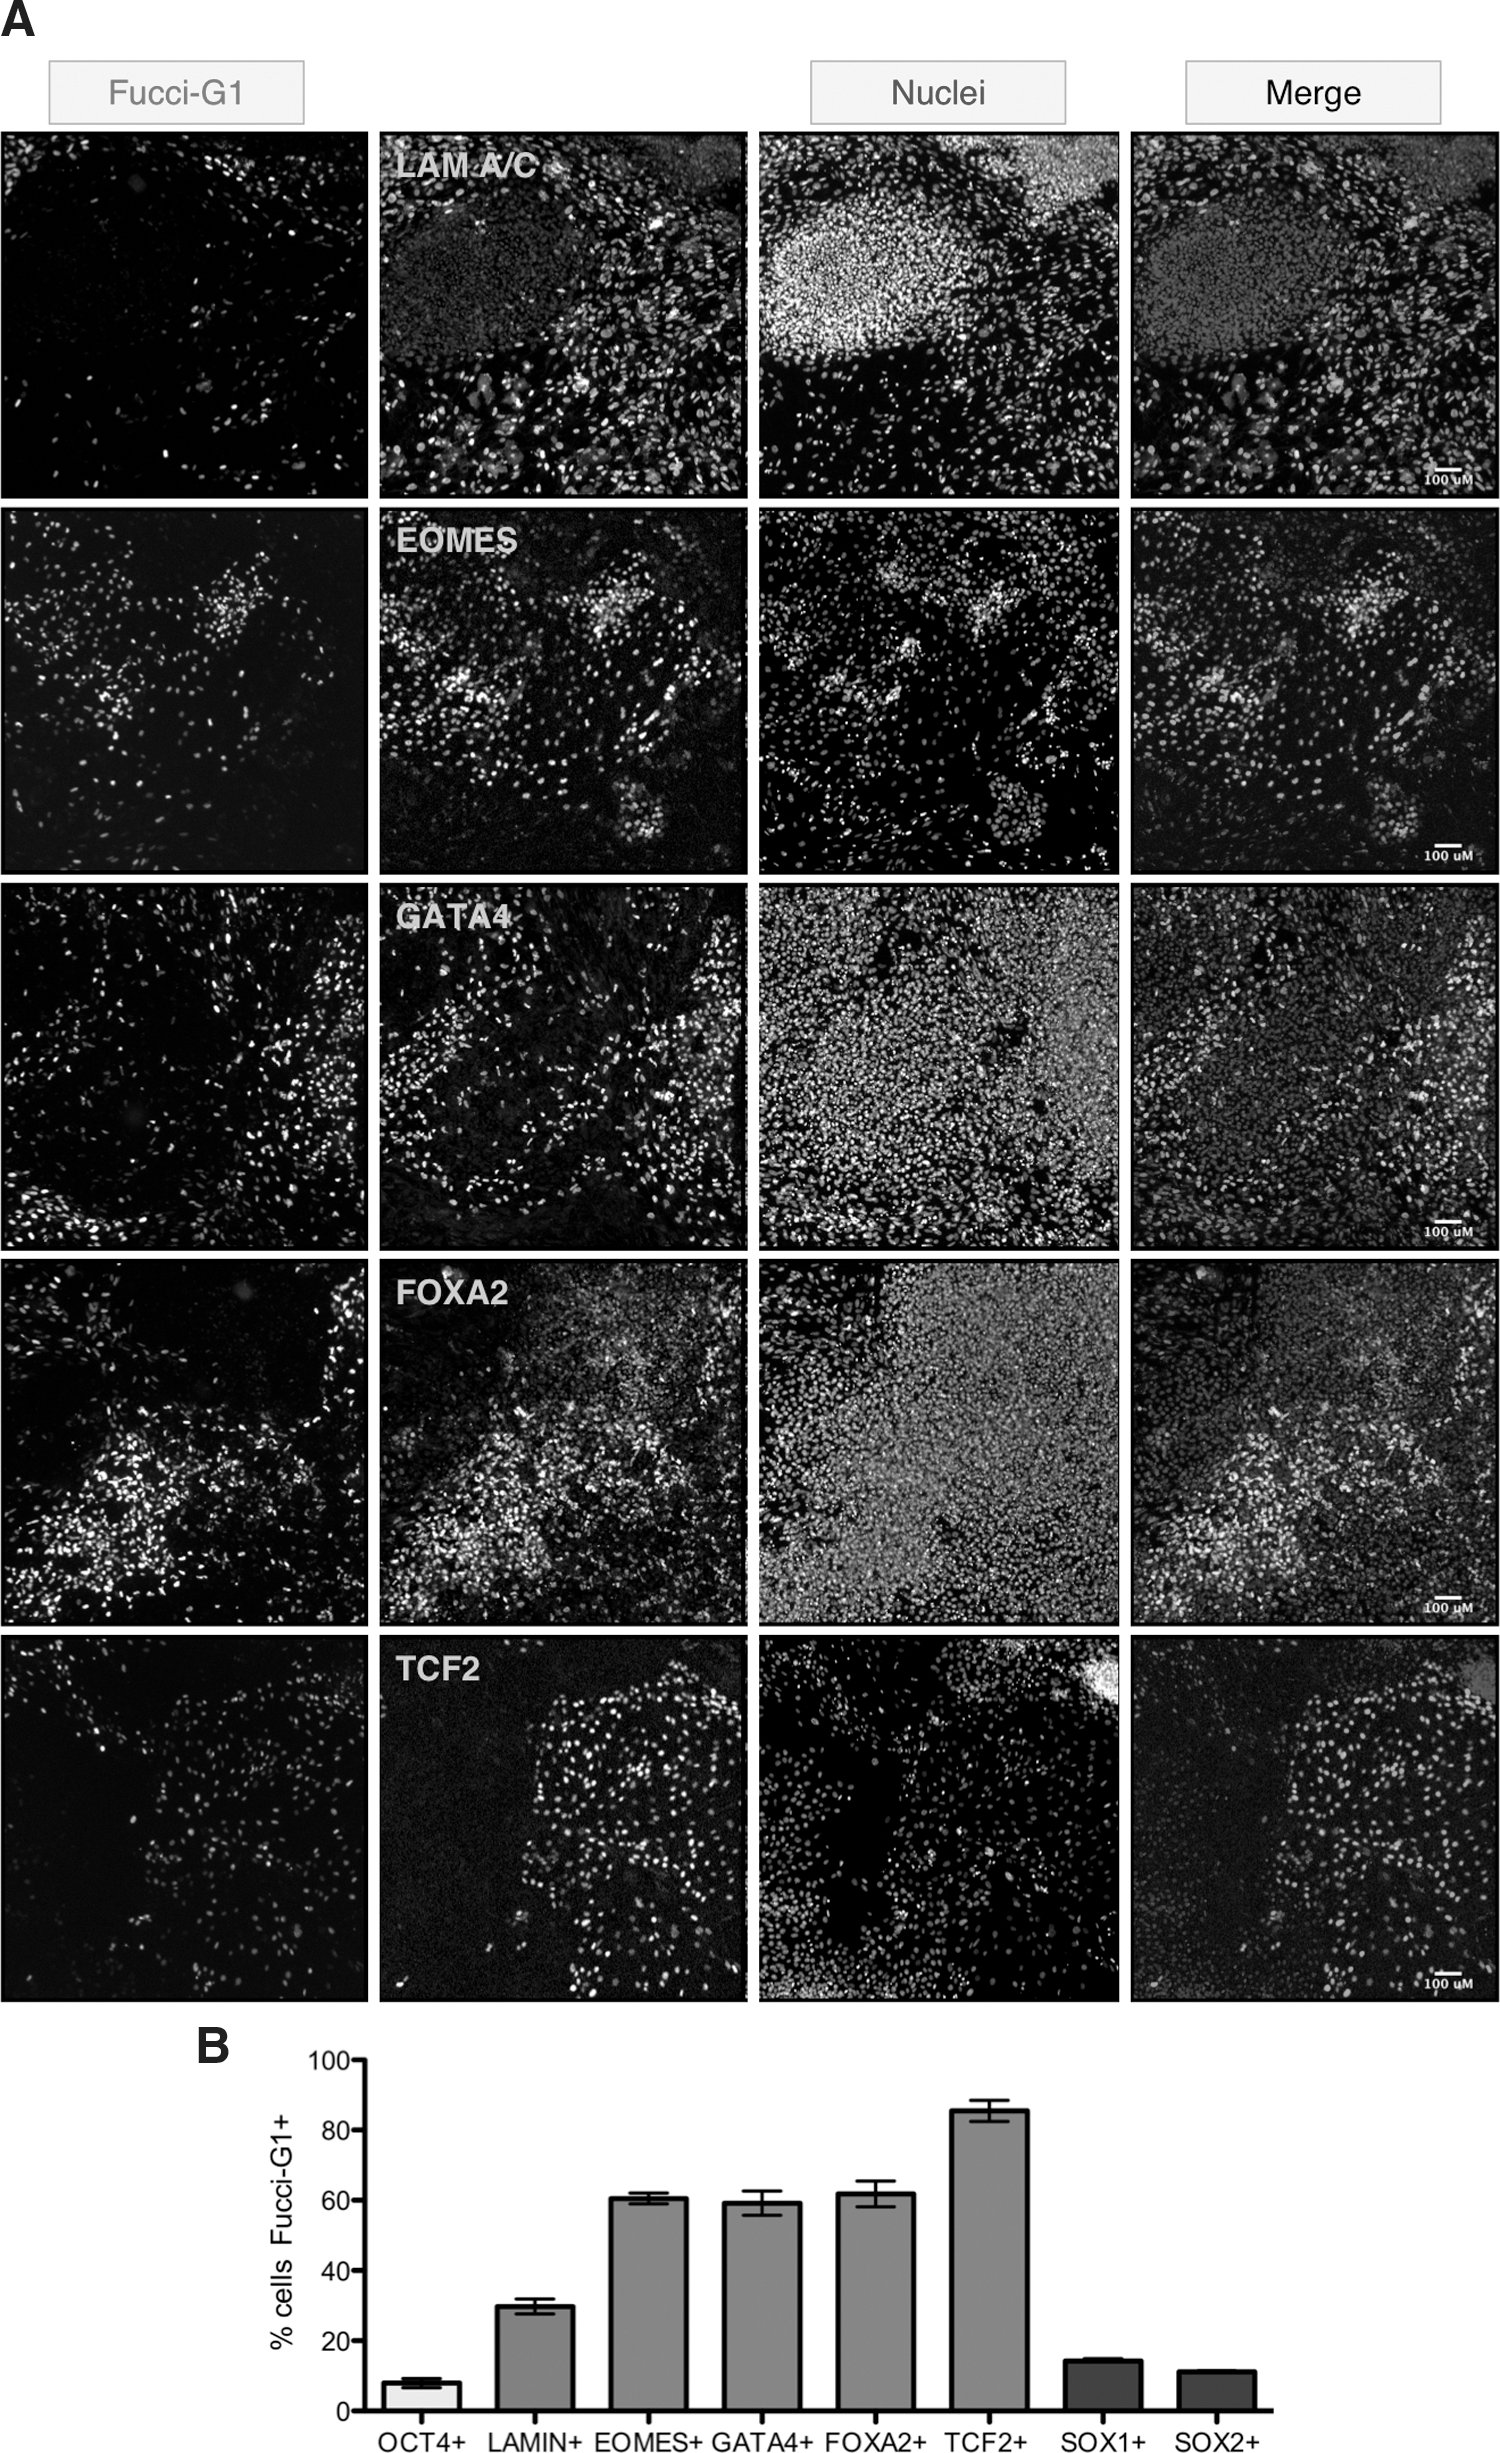
Overlap of FUCCI-G1 with lineage-associated markers.
Time-lapse imaging reveals kinetics of G1 phase entry during hESC differentiation
The inclusion of the H2B-GFP nuclear marker in the H2GFOIP dual-reporter system not only provided an indicator of the ubiquity of H2GFOIP transgene expression in the hESCs but also enabled live quantification of the total cell number within a colony by automated image analysis software. We next used live-cell imaging to record a time-lapse series of the H2GFOIP hESCs in undifferentiated growth conditions or in response to conditions supplemented with differentiation agents (Supplementary Movie S1). Automated software-based image analysis was then used to count all of the nuclei using H2B-GFP fluorescence and then calculated the fraction of cells expressing the FUCCI-G1 fusion protein over the course of 3 days of treatment with differentiation agents (Fig. 5A). Four differentiation agents were tested: (1) two polar molecules, HMBA and DMSO, which are known to initiate the differentiation of hESCs and mouse ESCs; (2) the PI3K inhibitor LY294002; and (3) the RB/RAF-1 interaction inhibitor RRD-251, which suppresses the hyperphosphorylation of RB by RAF-1 in the G1 phase, preventing subsequent entry into the S phase. Treatment of H2GFOIP hESCs with 1% DMSO leads to approximately a quarter of the hESCs entering the G1 phase, with the time-to-peak fraction of cells in the G1 phase occurring after around 60 h of treatment (Fig. 5B, C). In contrast, application of HMBA, RRD-251, and LY294002 all peaked at around 36 h of treatment (Fig. 5D and Supplementary Fig. S9), with half of the cells in RRD-251-treated cultures displaying high FUCCI-G1 expression. Regardless of the time required to reach peak FUCCI-G1 expression, the shape of the FUCCI-G1 response curve follows a typical bell-shaped distribution, with a plateauless peak quickly tapering to lower FUCCI-G1-positive cell numbers by the end of the treatment course. Interestingly, the fraction of cells positive for the FUCCI-G1 reporter increased in a dose-dependent manner for all differentiation agents tested, indicating that the individual cells within hESC cultures possess a range of thresholds when responding to differentiation stimuli. A second striking feature apparent from the time-lapse study of the H2GFOIP hESCs was the pattern of FUCCI-G1 expression in response to differentiation agents: initial upregulation of the FUCCI-G1 reporter occurred in the center of the colony and radiated outward (Figs. 5B and 6). This rosette-like pattern of FUCCI-G1 expression is consistent with the restriction of OCT4-positive cells to the edges of the colonies after 3 days treatment with differentiation agents like HMBA (Supplementary Fig. S10A). Our data demonstrate that changes to the G1 phase of the cells cycle, communicated by FUCCI-G1 expression, is an early indicator of differentiation, and is detectable in as little as 12–16 h after treatment of hESC cultures with differentiation agents. A 36-h treatment of H2GFOIP hESCs with HMBA caused a marked change in both NANOG, a sensitive marker of pluripotency [52], and FUCCI-G1 expression, but was insufficient to initiate a loss of the more widely expressed pluripotency marker OCT4 despite a significant increase in the percentage of OCT4+ cells expressing FUCCI-G1 (Supplementary Fig. S10B, C). These data show that changes in the expression FUCCI-G1 is at least as sensitive as NANOG in discerning perturbations in pluripotency, and that both FUCCI-G1 and NANOG respond more quickly to differentiation signals than OCT4.
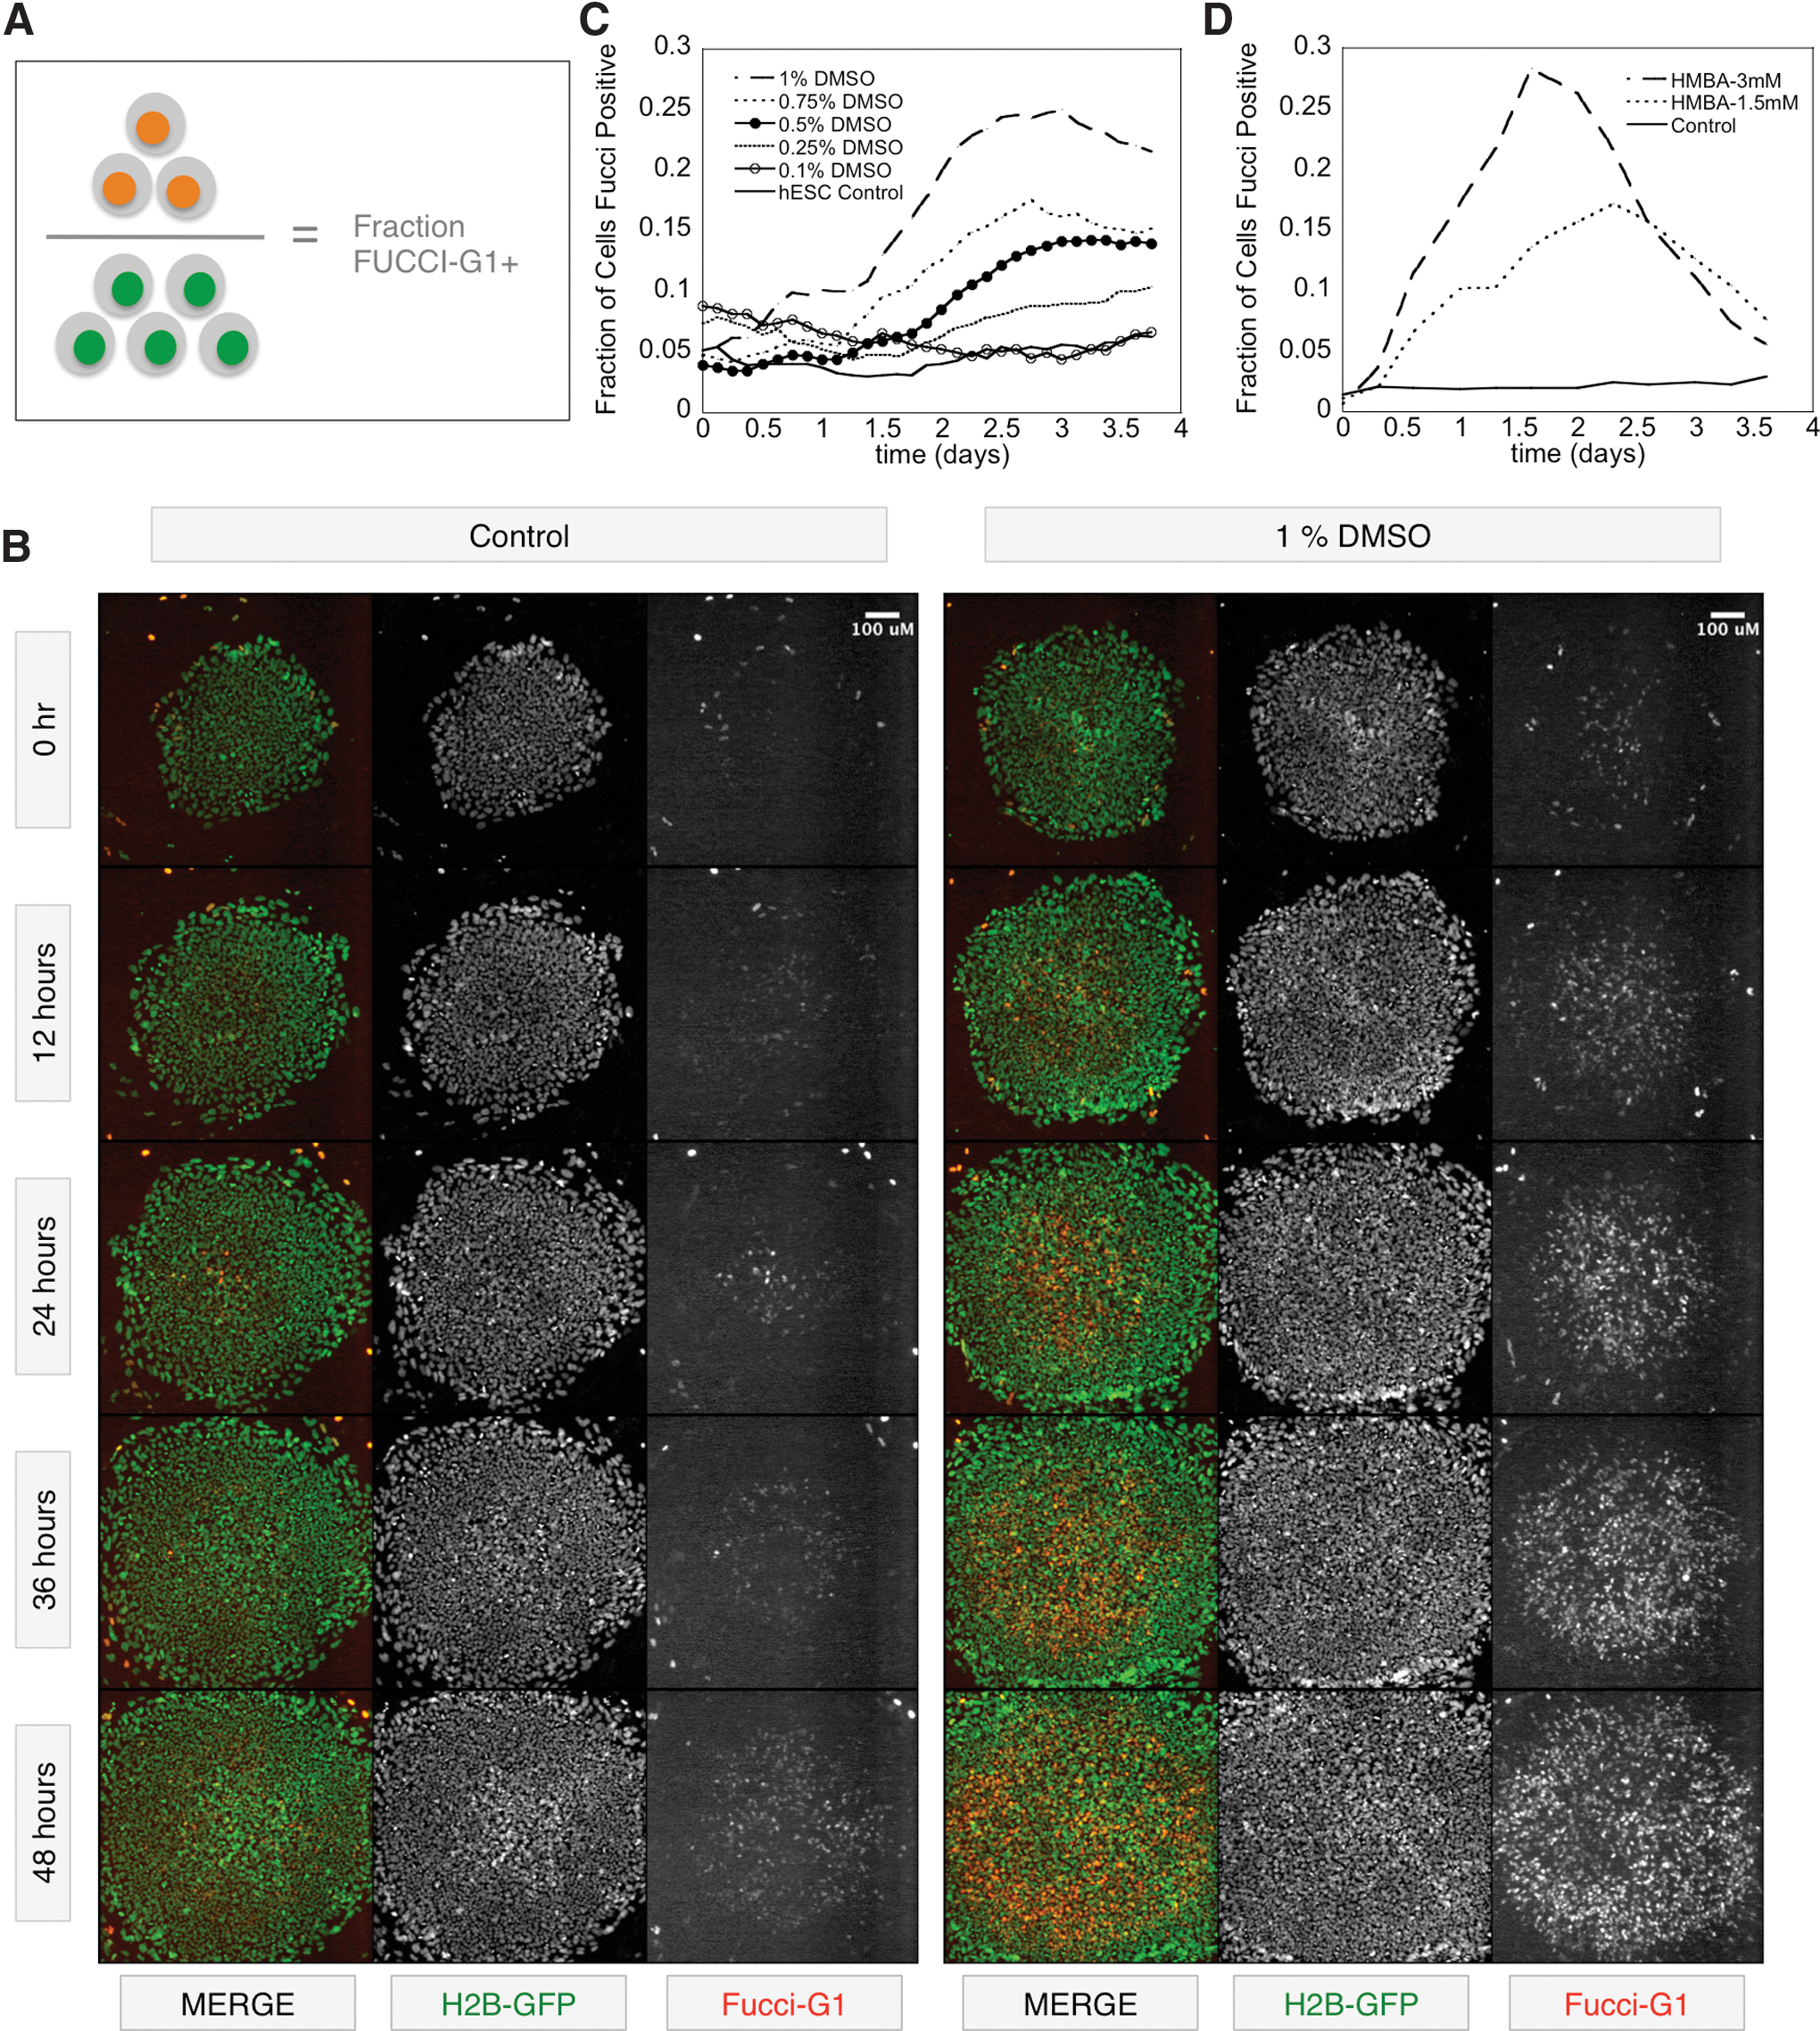
Time-lapse imaging of FUCCI-G1 expression in hESCs.
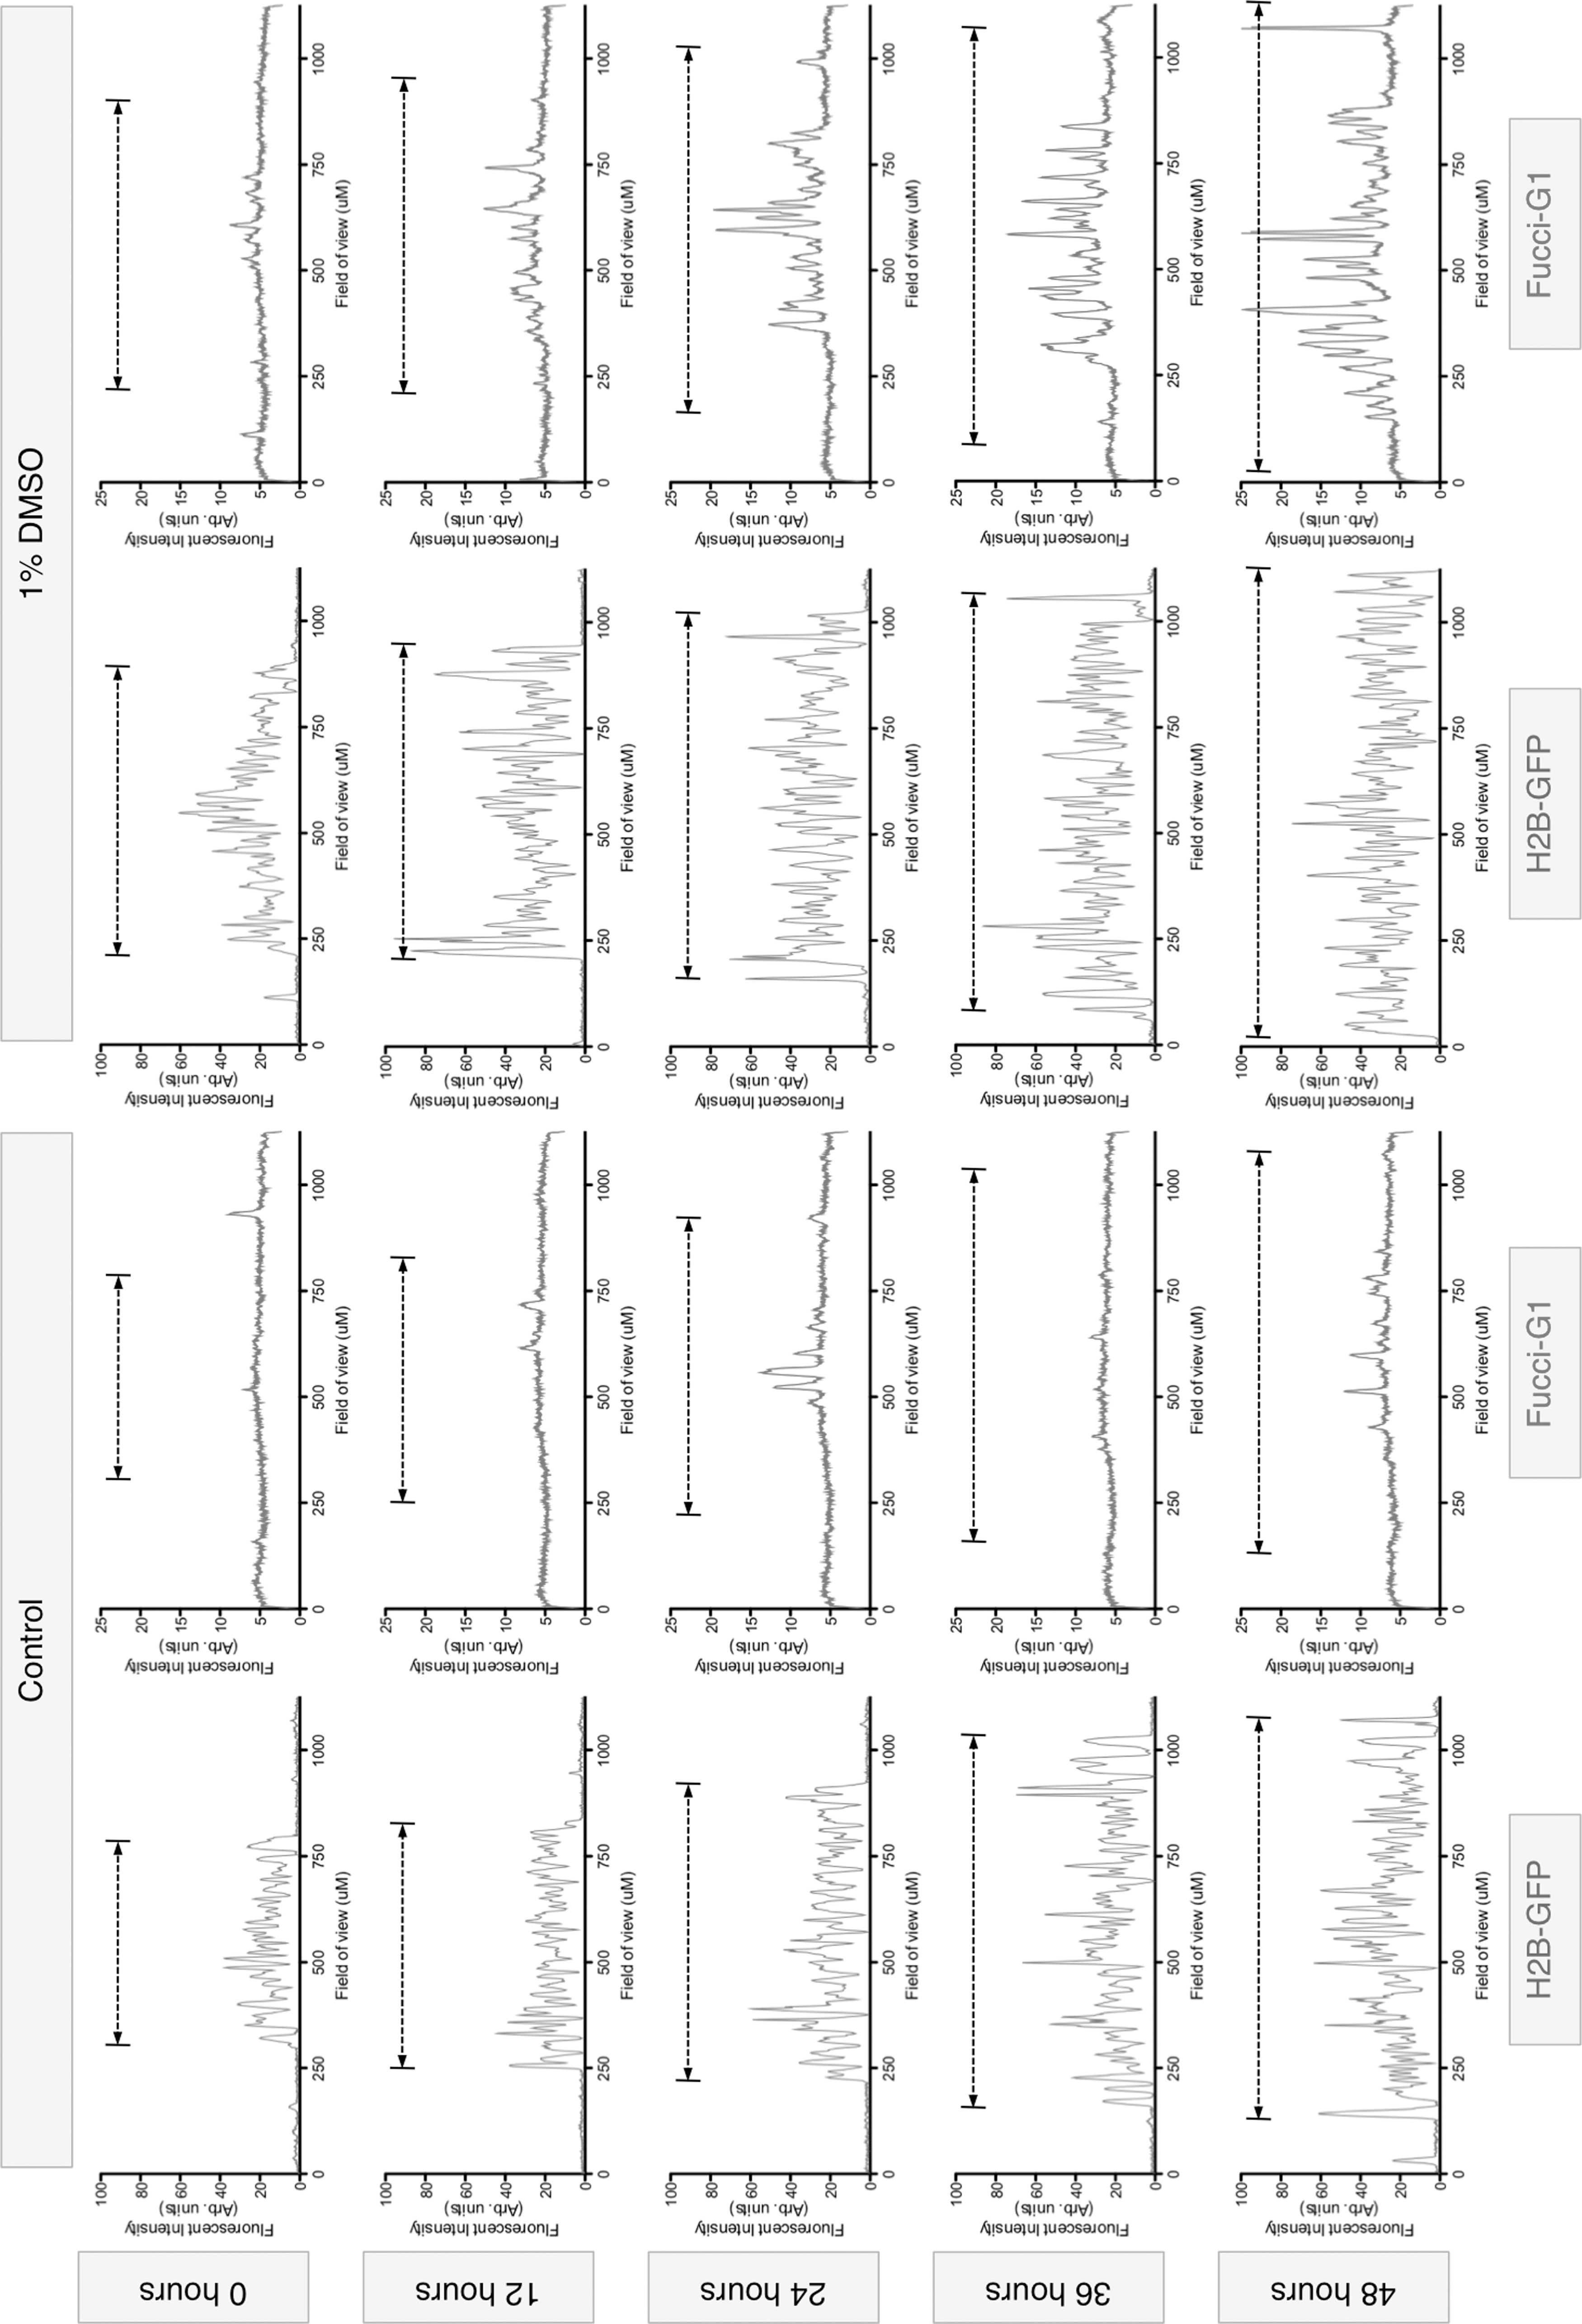
Colony distribution of FUCCI-G1 during differentiation. Measurements of H2B-GFP and FUCCI-G1 fluorescence intensity diagonally across the time-lapse stills shown in the figure demonstrate that initiation of FUCCI-G1 expression in cells treated with 1% DMSO starts in the center of the colony and radiates outward. Black dotted line indicates the extent of the colony boundaries in H2G-GFP and FUCCI-G1 plots.
Individual hESCs display variable FUCCI-G1 expression and total cell cycle times
We next used the H2GFOIP hESC lines to perform a detailed study of the human pluripotent cell cycle. Time-lapse imaging was used to capture images of the H2GFOIP reporter lines every 15 min over a period of 3 days (Supplementary Movie S2). The H2B-GFP fluorescence provided a pan-cell-cycle nuclear marker that facilitated the tracking of individual cells while also enabling the discrimination of cells in the M phase by the significant increase in perceived H2B-GFP intensity due to chromatin condensation during mitosis (Fig. 7E). We tracked over 100 mother and daughter cells in control and RRD-251-treated cultures and recorded the fluorescent intensity of the H2B-GFP and FUCCI-G1 reporters for each cell throughout the time-lapse study. H2GFOIP hESCs in control, undifferentiated conditions displayed a mean total cell cycle length of 15.8 h (SEM±0.3; Fig. 7C). Interestingly, we observed not only variation in the cell cycle length between different cells in the culture (Supplementary Fig. S11A) but also in the total cell cycle length for the same cell between consecutive mitosis (Fig. 7A). The addition of 40 μM RRD-251 to the cells leads to almost a doubling of the mean cell cycle duration (28.6 h SEM±0.3; Fig. 7B, C and Supplementary Fig. S11A) and a significant variability between the response of individual cells. The average duration of FUCCI-G1 expression was 0.6 h (SEM±0.1; Fig. 7D) in undifferentiated conditions, a lower value than the ∼3-h G1 phase time derived by others [15]. RRD-251 extended the average FUCCI-G1 expression duration by a factor of 12 (Fig. 7D), and elicited a range of cell cycle changes, with some cells expressing FUCCI-G1 for over 50 h (Fig. 7B and Supplementary Fig. S11B), likely due to G1 phase arrest. Importantly, all of our results show that an increase in FUCCI-G1 expression is only observed directly after mitosis events, strengthening the fidelity of FUCCI-G1 reporter in hESCs. Together, these data provide novel insight into the kinetics of hESC proliferation, revealing extensive cell–cell variability in the cell cycle duration of pluripotent cells and response to stimuli that perturb the normal cell cycle transit.
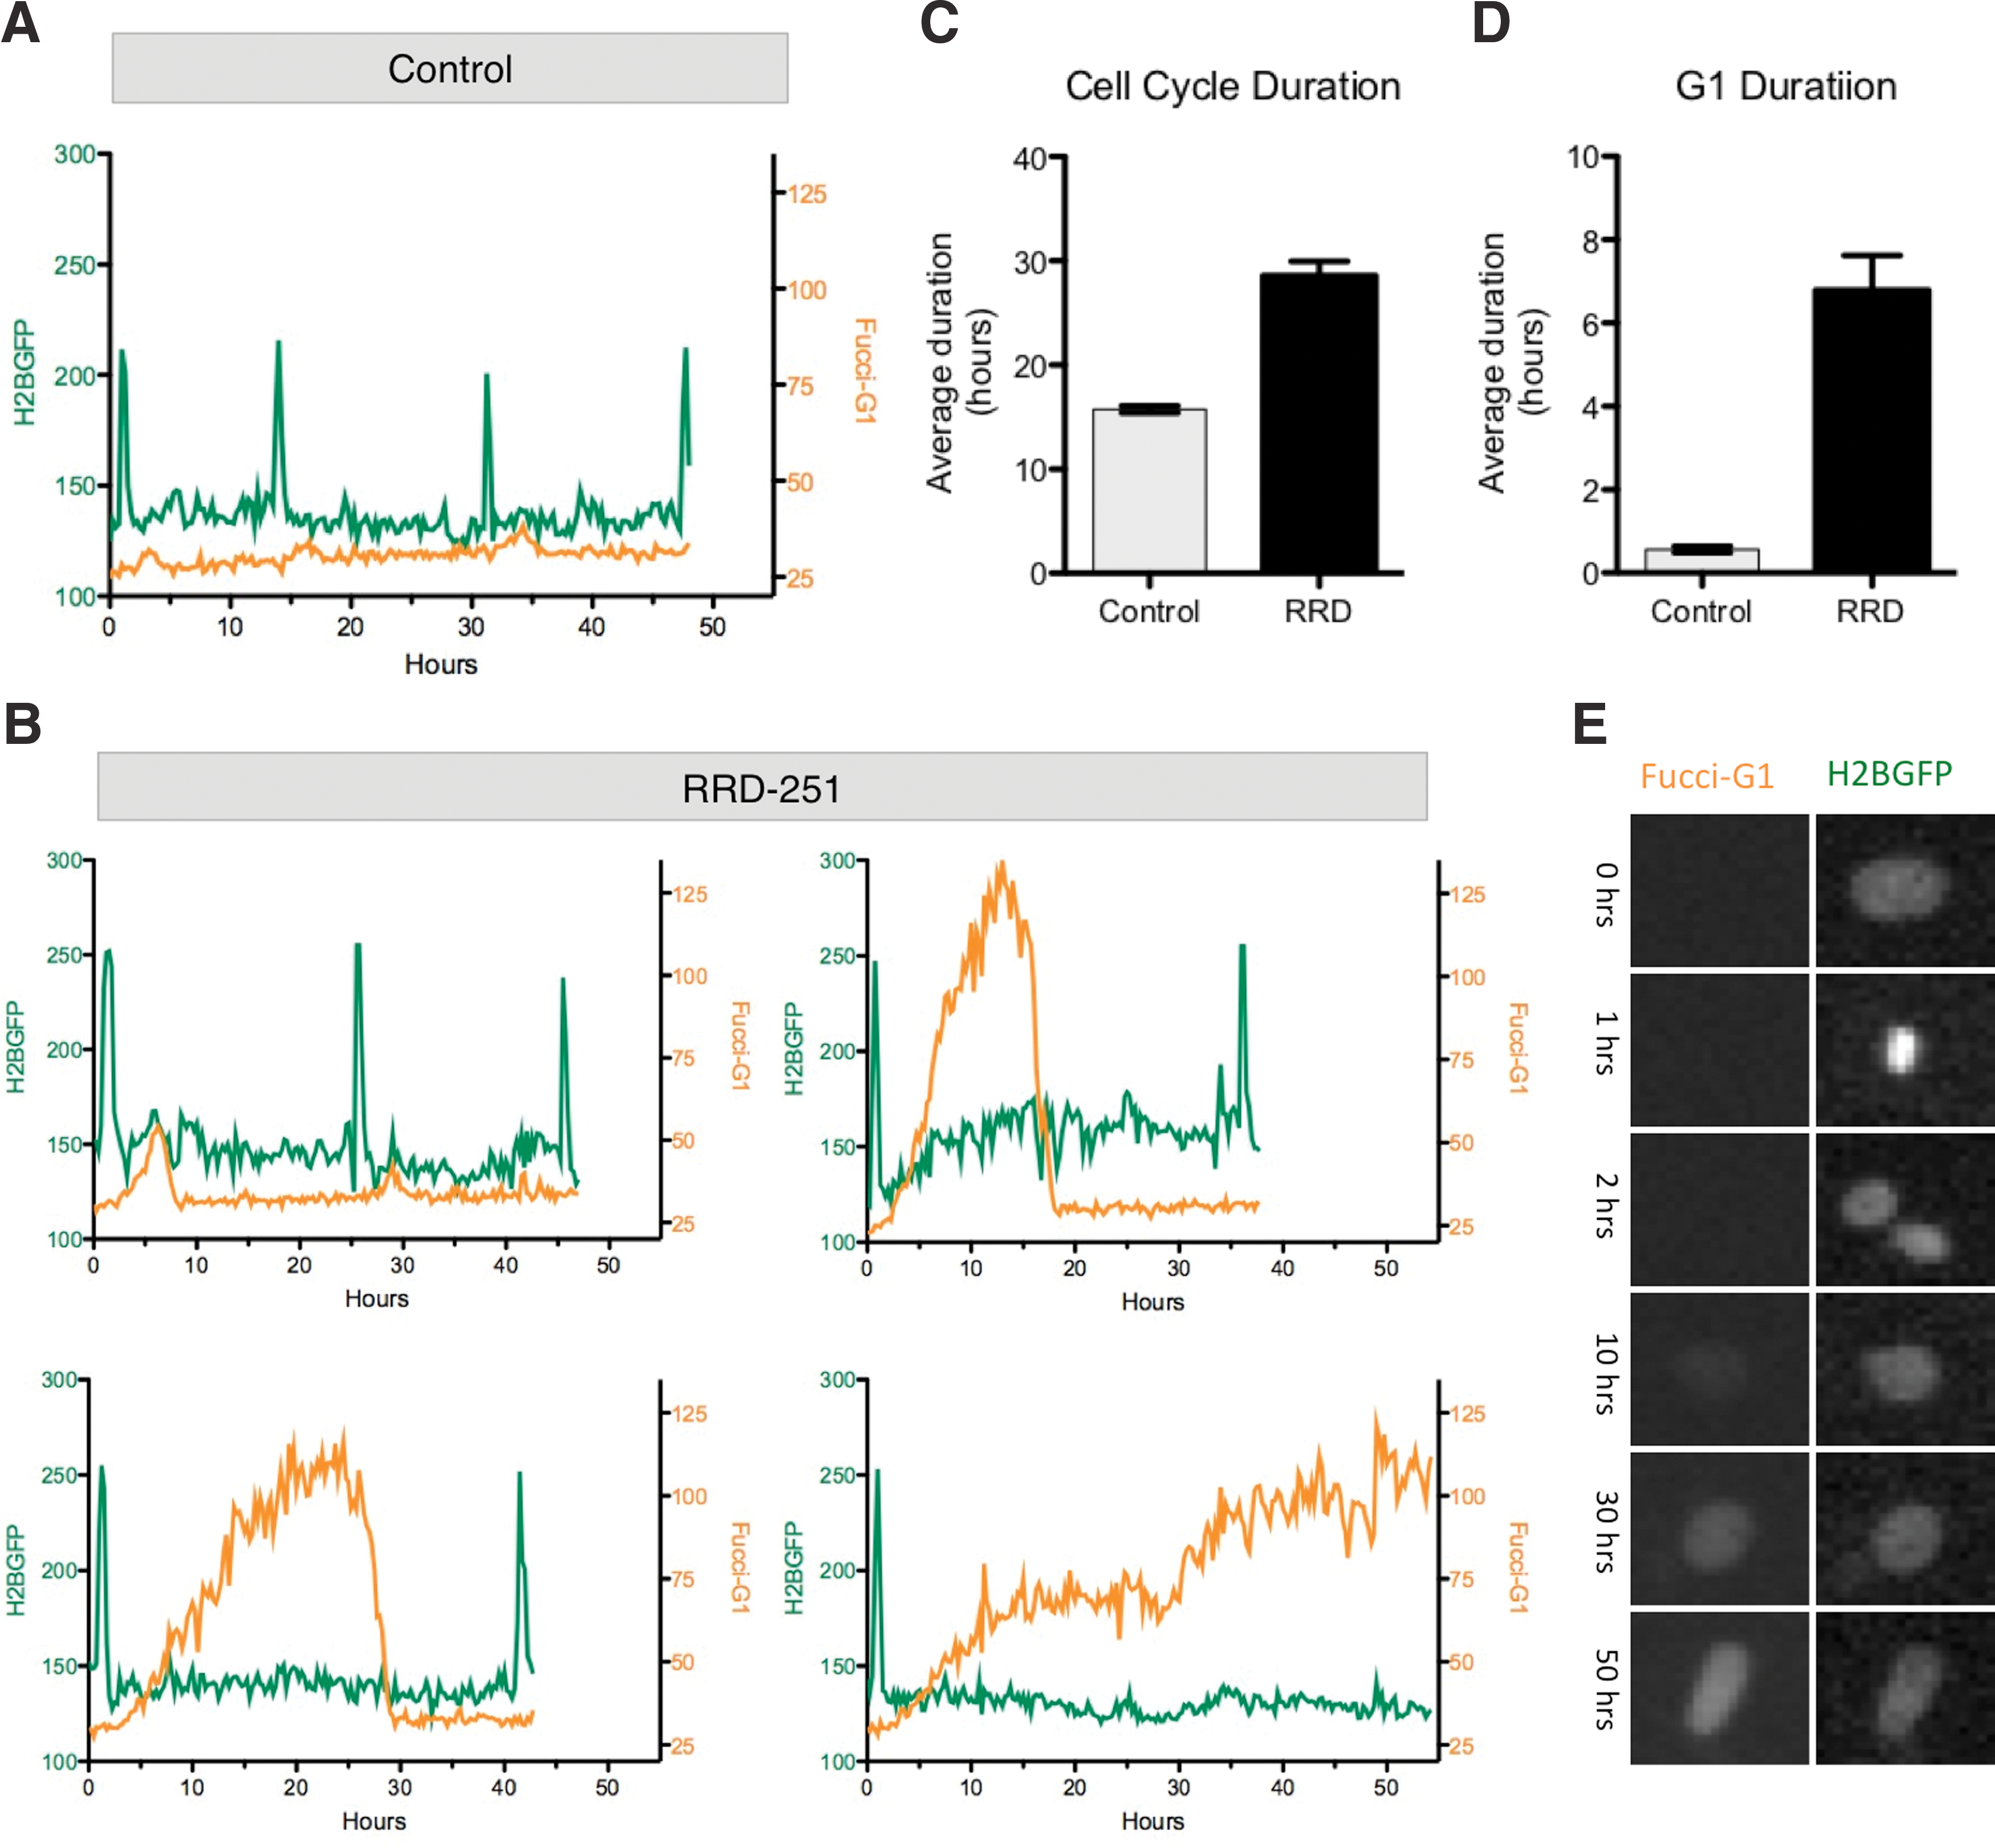
Single-cell tracking of FUCCI-G1 expression in hESCs.
Increased FUCCI-G1 expression duration is concomitant with acquisition of differentiation markers
It is currently unclear if G1 extension in human pluripotent stem cells occurs before or after the onset of differentiation. We next used our H2GFOIP reporter system, in combination with the tracking of single cells from time-lapse imaging, to address this question. H2GFOIP hESCs were placed in endoderm differentiation conditions and imaged over the course of 3 days, immediately fixed, and then endpoint-stained for the endoderm marker GATA4. This approach allowed GATA4-positive cells to be identified and then tracked back through the time-lapse movie, and a lineage tree was generated. In contrast to the regularity of lineage trees from control hESC cultures maintained in undifferentiated conditions that display no GATA4 expression (Fig. 8A, D), the lineage trees of cells that underwent differentiation into GATA4-positive cells displayed less complexity (Fig. 8B). By 24 h of treatment in endoderm differentiation conditions, the average total cell cycle duration underwent a small, but statistically significant, increase from 15.8 h (SEM±0.3) to 17.5 h (SEM±0.5) (Fig. 8C). At 48 h after the start of the endoderm differentiation treatment, the average cell cycle time had undergone a robust increase to 25.6 h (SEM±1.0). GATA4 staining of surrogate endoderm-differentiated H2GFOIP hESC cultures at the same time points revealed a similar pattern: a small, but significant, increase in GATA4-positive cells by 24 h, followed by a robust increase at 48 h to almost 30% of cells (Fig. 8D). These data demonstrate a positive correlation between an increase in the cell cycle length and acquisition of GATA4 expression at 48 h. Interestingly, although the total cell cycle length increased at 24 h, this was not accompanied by a noticeable increase in FUCCI-G1 expression (Fig. 8E). However, by 48 h, FUCCI-G1 expression had increased in cells that were demonstrably GATA4 positive. Our results indicate that the extension of the duration of FUCCI-G1 expression is concomitant with the expression of differentiation markers like GATA4, suggesting that differentiation and G1-lengthening are simultaneous events in hESCs.

FUCCI-G1 expression during endoderm differentiation. Representative lineage tree derived from tracking single H2GFOIP hESCs in control-undifferentiated conditions
Discussion
The cell cycle is a finely regulated process that enables cellular growth, replication, and differentiation. In particular, the G1 phase appears to function in the mechanism that governs the choice between proliferation and differentiation of stem cell populations [53]. The unusually short G1 phase that is common to pluripotent stem cells from a range of species, including mouse, monkey, and human [13,15,54], seems to be an obligatory step in attaining pluripotency. Despite the striking nature of this observation, extant tools for unlocking the significance of the abbreviated G1 phase kinetics in pluripotent stem cells have been lacking. Here we provide a significant new insight into the G1 phase and total cell cycle kinetics of undifferentiated and differentiating human pluripotent stem cells, by deploying cell cycle reporters that function in live cells. Our new data solidify the linkage between a shortened G1 phase and pluripotency in hESCs, while providing compelling new insights that describe the transition steps and functional outcomes linking differentiation with changes to the cell cycle.
We have used the H2GFOIP reporter, in conjunction with markers of pluripotency, to provide a characterization of G1 phase kinetics in hESCs that is not obscured by the heterogeneity common in hESC cultures. We find that a small minority of OCT4-, NANOG-, or SOX2-positive cells are in the G1 phase of the cell cycle, as reported by FUCCI-G1. Our data for the percentage of hESCs in the G1 phase are lower than previous estimates for bulk cultures of hESCs, which are typically in the range of 20% of hESCs in the G1 phase [15,55]. There are at least 2 potential reasons for this discrepancy: 1. By gating only on cells expressing OCT4, NANOG, or SOX2 when evaluating FUCCI-G1 expression, we have filtered out differentiated cells that have longer G1 phases. The inclusion of differentiated cells in the data set would artificially inflate the percentage of cells in the G1 phase. 2. The FUCCI-G1 reporter is under-reporting the duration of the G1 phase, probably due to the rapidity of the undifferentiated hESC G1 phase not permitting sufficient time for full maturation of the mKO2 fluorescent protein. Other estimates for the G1 phase duration in hESCs have produced a result of about 3 h [15]. A 3-h G1 phase represents a tight window for the mKO2 fluorescent protein, which has a 1.2-h maturation half-time [56], to fully mature before CDT1-mediated degradation occurs in the S phase. Indeed, our cell-tracking data show a small lag between the end of mitosis and the peak FUCCI-G1 expression (Fig. 8B, C), which may contribute to the average FUCCI-G1 expression duration of 0.6 h in undifferentiated hESCs (Fig. 8D, E). We have shown that FUCCI-G1 expression always follows mitosis, as expected for an accurate reporter of the G1 phase (Fig. 8B, C). When the time from the end of mitosis to the subsequent loss of FUCCI-G1 expression is measured in undifferentiated hESCs, a figure of ∼3 h is derived. Therefore, measuring the duration of FUCCI-G1 expression may underestimate the actual G1 phase length by up to 2 h. This observation is consistent with our introduction of the FUCCI-G1 reporter into undifferentiated mouse ESCs, which have a total cell cycle length of 8–10 h and a G1 phase length of ∼1.5 h [57,58], where it was difficult to detect even low-level FUCCI-G1 expression, except in morphologically differentiated cells (data not shown).
Thus, it is likely that both heterogeneity and fluorescent protein maturation time may have some impact upon the G1 phase profile reported here. Despite these caveats, our observations provide a state-of-the-art evaluation and new insights into the G1 phase kinetics of undifferentiated hESCs.
One striking finding that has arisen from our use of a cycle status reporter in live cells is the ability to use G1 phase to isolate functionally distinct cell types from undifferentiated hESC cultures. We have previously shown that lineage-associated markers are capable of isolating hESCs with discrete lineage differentiation preferences from undifferentiated cultures [46], but to our knowledge, this is the first proof of functional differences between hESCs residing in different stages of the cell cycle. Human ESCs resident in the G1 phase display a significant reduction in the ability to initiate new undifferentiated hESC colonies. This demonstration underscores the significance of the coupling of cell cycle changes to differentiation in pluripotent stem cells, and offers a new mechanism for isolating functionally distinct populations during the differentiation of hESCs.
The H2GFOIP reporter system has also permitted us to begin addressing important, but unanswered, questions concerning how lineage-specific differentiation is coupled to changes in the human cell cycle. We quantified the expression of FUCCI-G1 in conjunction with differentiation markers, like LAMIN A/C, GATA4, or TCF2, and demonstrated for the first time that differentiation states marked by the expression of different proteins do not necessarily display equivalent fractions of cells residing in the G1 phase of the cell cycle. Our data also reveal variation between markers of the endoderm germ layer, with a lower fraction of EOMES-, GATA4-, or FOXA2-expressing cells in the G1 phase than TCF2-positive cells. In the endoderm lineage, EOMES, GATA4, and FOXA2 expression is initiated earlier during mouse embryonic development than the expression of TCF2 [59 –62], affording the possibility that EOMES, GATA4, and FOXA2 may identify an earlier, more-proliferative, precursor population. Similarly, the cell cycle reporter we have deployed in hESCs now offers a realistic opportunity to explore the cell cycle properties of a range of developmentally relevant tissues, allowing cell types to be indexed by their proliferation profile.
These data confirm that we have developed a powerful new assay for measuring the cell cycle properties of distinct precursors and tissues that could have utility in future cell therapy applications. We are currently using the H2GFOIP reporter to screen conditions that modulate the fraction of lineage-marked cells that reside in the G1 phase, with the intent of identifying protocols that invigorate the proliferative potential of lineages like endoderm.
Using the data from time-lapse microscopy experiments, we have developed a new assay for measuring cell cycle kinetics in cultured cells. The total cell cycle time for hESCs has been estimated to take from 16 h through to 30+ h [15,63,64]. Here we derive a definitive cell cycle time for hESCs as averaging around 15.8 h by tracking individual cells through consecutive mitosis events. Additionally, we can use this same assay to detail changes in the G1 phase length, and discriminate between a prolonged and arrested G1 phase. Given that FUCCI-G1 expression increases in hESCs treated with compounds intended for chemotherapeutic use, such as HMBA [65] and RRD-251 [66], the system we describe here may provide a novel mechanism for describing the cytostatic nature of compounds with potential anticancer drugs. The extension of G1 phase can also presage induction of a differentiation program, making this assay also of a potential value in the discovery of compounds that cause hESC differentiation.
A second notable observation arising from our time-lapse data is the variation in the transit time through the cell cycle between independent hESCs, and even the daughter cells of previously tracked cells. Our results show that pluripotent stem cells do not represent a uniform phenotype, but instead are highly dynamic entities displaying diverse responses to internal or external stimuli. Our time-lapse data demonstrate that (1) FUCCI-G1 expression responds in a dose-sensitive manner to chemical differentiation agents, like DMSO and HMBA; and (2) that the cells at the center of a colony respond first to these stimuli. These observations have corresponding implications (1) that some cells that are resident within hESC cultures require a higher signaling threshold before committing to increase FUCCI-G1 expression; and (2) the cells with lower thresholds reside in the central regions of colonies.
The signaling thresholds that control hESCs fate are understudied, but some progress has been made in describing those that operate to control the self-renewal machinery in murine pluripotency. In mouse ESCs, the signaling pathways that control the undifferentiated state are now understood to operate in an analog manner, and not with binary on–off thresholds [67], and that the spatial organization of the cells within the colony is directly related to the signal responsiveness of a cell [68]. Measurements of the proliferation activity of hESC colonies, drawn from static time points, demonstrate that the most mitotically active cells are located toward the colony center [69]. Our data show that cells at the colony center are also most susceptible to differentiation agents. Rapid proliferation is directly coupled to pluripotency [70], so the central region may be a reservoir of the most naïve pluripotent cells in the colony. Lineage priming, a process in which pluripotent cells begin to differentiate, is known to involve the extension of the G1 phase duration and a concomitant increase in the total cell cycle length [71]. In combination with these factors, our data imply that a ring of lineage-primed cells may encircle the central pool of naïve pluripotent cells at the colony center.
Finally, we have used our H2GFOIP system to investigate the order in which hESC differentiation and G1 lengthening occurs. The short G1-phase length found during early development has been suggested to help maintain a stem cell phenotype by reducing the duration of mitogen sensitivity associated with the G1 phase [20 –23]. However, addressing the linkage between G1 phase length and differentiation is technically challenging. In mouse, this question has been tackled in neural stem cells, where gain-of-function experiments with cell cycle proteins that are associated with differentiation, such as cdk4/cyclinD1, have demonstrated that G1 lengthening is necessary and sufficient to induce differentiation of neural progenitors [72]. Similarly, knockdown in hESCs of CDK2, a cell cycle protein that helps drive cell cycle progression from G1 to S phase, leads to cell cycle arrest and differentiation [73]. These informative experiments provide insight into the linkage between the cell cycle machinery and differentiation, but do not necessarily describe the cell cycle phase behavior during the fate decisions that are made by cells in response to differentiation cues found during development. Here we induced differentiation in our H2GFOIP hESCs with an activin A-based endoderm differentiation protocol, performed live imaging, and then endpoint stained the cells with GATA4. These data, in conjunction with GATA4 staining at discrete stages during the differentiation time course, show that the magnitude of cell cycle lengthening correlates with the extent of GATA4 acquisition. Importantly, the expression of the FUCCI-G1 reporter increases at around 48 h, the time point at which a robust increase in the percentage of GATA4-positive cells is detectable. Although our results are correlative, they imply that G1 lengthening occurs at approximately the same time as the gain of endoderm differentiation markers. Single-cell tracking of hESCs containing the H2GFOIP reporter and a live fluorescent reporter of early cell lineage fate decisions, such as PAX6, GATA4, or BRACHY, may provide a definitive connection between differentiation and cell cycle changes.
Here we have described significant new insights into the human pluripotent cell cycle and how it changes during the process of differentiation. Our data and tools provide new avenues for investigating and mapping the very early stages of hESC response to differentiation stimuli via changes in the cell cycle, and could impact the identification of efficacious differentiation strategies to generate therapeutically useful cell types.
Footnotes
Acknowledgments
Funding was kindly provided by CIHR, SCN, and MRI GL2 OCRIT grants to JSD. JSD is also supported by a Canada Research Chair in Human Stem Cell Lineage Commitment.
Author Disclosure Statement
No competing interests are declared.
References
Supplementary Material
Please find the following supplemental material available below.
For Open Access articles published under a Creative Commons License, all supplemental material carries the same license as the article it is associated with.
For non-Open Access articles published, all supplemental material carries a non-exclusive license, and permission requests for re-use of supplemental material or any part of supplemental material shall be sent directly to the copyright owner as specified in the copyright notice associated with the article.
