
Abstract
In mice and humans, it has been shown that embryonic and adult fibroblasts can be reprogrammed into pluripotency by introducing 4 transcription factors, Oct3/4, Klf4, Sox2, and c-Myc (OKSM). Here, we report the derivation of induced pluripotent stem cells (iPSCs) from adult canine fibroblasts by retroviral OKSM transduction. The isolated canine iPSCs (ciPSCs) were expanded in 3 different culture media [fibroblast growth factor 2 (FGF2), leukemia inhibitory factor (LIF), or FGF2 plus LIF]. Cells cultured in both FGF2 and LIF expressed pluripotency markers [POU5F1 (OCT4), SOX2, NANOG, and LIN28] and embryonic stem cell (ESC)–specific genes (PODXL, DPPA5, FGF5, REX1, and LAMP1) and showed strong levels of alkaline phosphatase expression. In vitro differentiation by formation of embryoid bodies and by directed differentiation generated cell derivatives of all 3 germ layers as confirmed by mRNA and protein expression. In vivo, the ciPSCs created solid tumors, which failed to reach epithelial structure formation, but expressed markers for all 3 germ layers. Array comparative genomic hybridization and chromosomal fluorescence in situ hybridization analyses revealed that while retroviral transduction per se did not result in significant DNA copy number imbalance, there was evidence for the emergence of low-level aneuploidy during prolonged culture or tumor formation. In summary, we were able to derive ciPSCs from adult fibroblasts by using 4 transcription factors. The isolated iPSCs have similar characteristics to ESCs from other species, but the exact cellular mechanisms behind their unique co-dependency on both FGF2 and LIF are still unknown.
Introduction
P
Materials and Methods
Cell culture
Adult canine skin fibroblasts (cSFs) were isolated from abdominal skin of clinically healthy 3-year-old beagles and maintained in Dulbecco's modified Eagle's medium (DMEM; Cellgro) containing 10% fetal bovine serum (Cellgro) and 0.1% gentamicin (Cellgro). Platinum retroviral packaging cell line (PLAT-GP) and mouse embryonic fibroblasts (MEFs) were maintained in the same medium. mTeSR1 [21] (StemCell) medium was used for inducing pluripotency, and picked colonies were expanded and maintained in iPS medium consisting of DMEM/F12 (Cellgro), 20% Knockout Serum Replacement (Invitrogen), 2 mM
Retroviral production
PLAT-GP packaging cells were seeded at 8E6 cells/T75 flask and cultured overnight. The next day, pMXs retroviral vectors containing mouse Oct3/4, Klf4, Sox2, and c-Myc were transfected into PLAT-GP cells along with pCI-VSV-G envelope vector. The transfection was conducted using Fugen 6 (Roche) as described previously [22]. Transfection efficiency was monitored with pMXs-mRFP1, and viral supernatants were harvested only when transfection efficiency was >70%. Viral supernatants were collected twice, 48 and 72 h posttransfection, and filtered through a 0.45-μm filter. The filtered supernatants were used to infect target cells after supplementation with polybrene (2 μg/mL; Sigma), or aliquoted and stored at −80°C until use.
Feeder cells
MEFs were isolated from day 13–14 C57BL/6 fetuses and cells at passages 1–3 were used as feeder layer. MEFs were trypsinized and gamma irradiated with 5,000 rad, and 8E5 cells per 10-cm dish were seeded onto gelatin-coated dishes one day prior to use.
Generation of ciPSCs
Skin fibroblasts were seeded at 8×10⁵ cells per 10-cm dish one day prior to retroviral infection. Cells were infected overnight with viral supernatant and medium was replaced daily for 5 days. On day 6 postinfection, the infected cells were replated onto gamma-irradiated MEFs (8×10⁵ cells per 10-cm dish). The next day, the medium was replaced with mTeSR1 medium. The medium was then changed every other day until colony picking. The colonies were manually picked using a pulled Pasteur pipette and expanded in 3 different culture media all containing PD0325901 (PD, 0.5 μM) and CHIR99021 (CH, 3 μM), inhibitors of mitogen-activated protein kinase 1 (MAP2K1), and GSK3B, respectively (2i media), and either FGF2 (10 ng/mL) or hLIF (103 U/mL, LIF), or both FGF2 (10 ng/mL) and LIF (103 U/mL). Picked colonies were mechanically dissociated and passaged by every 4 days. Four colonies (S1–S4) were expanded into cell lines and cultured for >20 passages.
Alkaline phosphatase staining, immunocytochemistry, and immunohistochemistry
For alkaline phosphatase (AP) staining, ciPSCs were treated with VECTASTAIN ABC-AP kit (Vector Laboratories) as per manufacturer's instruction. After AP staining, 3 microscopy fields (20× magnification) of each treatment were randomly selected and AP-positive colonies were counted. Paraffin-embedded tumor sections were steam heated for 1 h with Trilogy (Bioworld Laboratories) for deparaffinization, rehydration, and antigen retrieval. Tumor slides, cryosectioned embryoid bodies (EBs), and cultured cells were immunostained as described below. Cells were fixed in 4% paraformaldehyde (PFA) for 15 min and permeabilized, if needed, with 0.25% Triton X-100 in phosphate-buffered saline (PBS) with 0.1% Tween 20 (PBST) for 10 min. Cells were incubated for 1 h at room temperature in 10% bovine serum albumin in PBST and then with primary antibodies OCT4 (Santa Cruz), SOX2 (StemCell), NANOG (Peprotech), stage-specific embryonic antigen (SSEA-1) (Stemgent), alpha-fetoprotein (AFP) (Sigma), TUJ1 (Covance), glial fibrillary acidic protein (GFAP) (Dako), desmin (DES) (Neomarks), and vimentin (VIM) (Santa Cruz) overnight at 4°C. Next day, cells were incubated with the appropriate secondary antibodies, anti-rabbit-immunoglobulin G (IgG)-Cy3 or anti-mouse-IgG-Alexa488 (Invitrogen), for 1 h at room temperature in PBST. Slides were mounted with VECTASHIELD mounting medium with 4′,6-diamidino-2-phenylindole (DAPI) (Vector Laboratories) and visualized with TE2000 fluorescence microscope (Nikon). Antibodies used in this study are listed in Supplementary Table S1 (Supplementary Data are available online at
Fluorescence-activated cell sorting
ciPSC-S2 and S4 were dissociated with Accutase (Innovative Cell Tech) and cells were pelleted and washed twice with ice-cold Dulbecco's phosphate-buffered saline (DPBS). Harvested cells were incubated with DyLight549-conjugated SSEA-1 or isotype control antibody (Stemgent) for 30 min on ice. After incubation, cells were washed twice with ice-cold DPBS followed by fluorescence-activated cell sorting (FACS), and sorted cells were replated onto gamma-irradiated MEFs for further expansion. Antibodies used in this study are listed in Supplementary Table S1.
Reverse transcription–polymerase chain reaction and real-time reverse transcription–polymerase chain reaction analysis
Total RNA was isolated from EBs, ciPSCs, cSFs, day-6 cSFs postinfection, and tumors using RNeasy Mini Kit (Qiagen), and treated with TURBO DNase (New England Biolabs) according to the manufacturer's instruction. cDNA was synthesized by AffinityScript Multiple Temperature cDNA Synthesis Kit (Agilent Technologies) using oligo (dT) primer. Expression of pluripotency and differentiation markers was examined by reverse transcription–polymerase chain reaction (RT-PCR) using Phire Hot Start II DNA polymerase (Finnzymes). Conditions for RT-PCR were as follows: 95°C for 5 min; 30 cycles of 95°C for 5 s, 62°C for 5 s, and 72°C for 5 s; and final extension of 72°C for 1 min. Relative expression of candidate genes was quantified by QuantiTect SYBR Green PCR Kit (Qiagen) on a BioRad Real-Time PCR Detection System (BioRad). Conditions for real-time RT-PCR were as follows: 95°C for 15 min; 40 cycles of 95°C for 15 s, 60°C for 5 s, and 72°C for 30 s; and 72°C for 2 min, followed by melting curve analysis (90 cycles, start at 50°C with 0.5°C increment). The relative expression was calculated by normalization with beta-actin expression using the 2−ΔΔCT method [23]. Primer sets for RT-PCR and real-time PCR are listed in Supplementary Table S2.
Statistical analysis
Relative expression data of transgene real-time PCR was analyzed using one-way analysis of variance followed by Bonferroni and Fisher's LSD posttest. SAS 9.2 software was used for statistical analysis of the data. All data were expressed as mean±standard error of the mean, and significance was set at P<0.05.
EB formation and EB-mediated in vitro differentiation
Colonies were mechanically detached from the feeder layer and plated on ultra-low attachment plates (Corning) in iPS medium without growth factors (FGF2 and hLIF). After 4 days of EB formation, half of the EBs were trypsinized and cultured onto gelatin-coated dishes containing differentiation medium supplemented with activin A (50 ng/mL; Sigma), BMP4 (10 ng/mL; R&D System), or all trans-retinoic acid (RA; 0.5 μM; Sigma). The plated EB-derived cells were then cultured for an additional 14 days and RNA isolation and immunocytochemistry (ICC) was performed. The remaining half of the EBs were cultured in suspension for 21 days and RNA isolation and cryosectioning was performed. The presence of 3 germ layers was confirmed by immunostaining of individual EBs.
Teratoma formation
One million early passage (Table 1), unsorted, or SSEA-1-sorted (FACS-S) iPSCs, parental fibroblasts, gamma-irradiated MEFs, or mouse embryonic stem cells (mESCs) were harvested and subcutaneously injected into SCID/Beige mice (Charles River). Tumors derived from iPSCs were harvested after 22–54 days and mESCs were harvested after 44 days. Each tumor was dissected and fixed in 4% PFA or frozen for RNA isolation. Fixed tissues were paraffin embedded and hematoxylin and eosin (H&E) stained as described previously. Slides were further analyzed by visualization with light microscope (AZ100; Nikon) or immunohistochemistry (IHC). No tumor was found from fibroblast or gamma-irradiated MEF transplantation.
H&E, hematoxylin and eosin; PCR, polymerase chain reaction; IHC, immunohistochemistry; MEFs, mouse embryonic fibroblasts; mESCs, mouse embryonic stem cells; ci
Array-comparative genomic hybridization analysis
The genome-wide DNA copy number status of the 4 derivative cell lines (S1–S4) at 2 different passages (P7 and P17) and tumors (T2–T4, derived from S2, S3, and S4, respectively) was evaluated against that of the parental fibroblast cell line using array-CGH analysis. Briefly, 500 ng of total genomic DNA from each of ciPSC S1–S4 and tumors T2–T4 was labeled separately with Cyanine-3-dUTP (test samples), and DNA from parental fibroblasts was similarly labeled with Cyanine-5-dUTP (reference sample) using a Genomic DNA Enzymatic Labeling Kit (Agilent Technologies). Samples were hybridized in 4 independent, pairwise (test vs. reference) assays onto a custom dog oligonucleotide CGH microarray (Agilent Technologies design ID 025522) according to the manufacturer's recommendations. The array comprises ∼172,000 repeat-masked ∼60-mer oligonucleotides distributed at ∼13 kb intervals throughout the domestic dog genome sequence assembly [24]. Arrays were scanned at 3 μm resolution using an Agilent G2565CA scanner and image data were processed using Feature Extraction version 10.10 and Genomic Workbench version 6.5 (Agilent Technologies). Data were filtered to exclude probes exhibiting nonuniform hybridization or signal saturation and were normalized using the centralization algorithm with a threshold of 6. The genomic DNA copy number status of each derivative cell line was compared to that of the common reference cell line using the ADM2 algorithm using a threshold of 6 with a fuzzy zero correction. Genomic copy number aberrations were defined as a minimum of 3 consecutive probes with log2 tumor: reference values>0.2 (gain) or <−0.2 (loss), resulting in an effective resolution of ∼26 kb (2 intervals of ∼13 kb). For each assay, DNA for CGH analysis was isolated from the same culture flask from which chromosome preparations were generated for FISH analysis, to maximize continuity.
Metaphase spread preparation and FISH
ciPSC-derived EBs were plated on gelatin (Sigma)–coated 10-cm-diameter tissue culture dishes in MEF medium for 5 days, and metaphase spreads were prepared as previously described [25]. Briefly, cells were treated with microtubule destabilizer colcemid (10 μL/mL) for 2 h and washed with PBS. The cells were trypsinized, incubated with hypotonic solution (potassium chloride, 75 mM) for 10 min, and resuspended with Carnoy's fixative [26] followed by repetitive centrifugation and decanting steps. Chromosome spreads were prepared by dropping 10 μL of cell suspension onto ice-cold slides. Slides were air-dried for 10 min and kept at −20°C until analyzed. FISH analysis was performed using differentially labeled dog chromosome paint probes generated from cytogenetically validated, genome-anchored pools of dog bacterial artificial chromosome clones distributed at ∼1 Mb resolution along the length of the corresponding chromosomes [27]. Chromosomes were counterstained with DAPI. Images were captured using a fluorescence microscope (Axioplan II; Zeiss) equipped with appropriate filters (Chroma) and a cooled CCD camera (KAF1401E; Sensys), both driven by SmartCapture software (Digital Scientific). The copy number status of each chromosome was recorded in a minimum of 30 cells from each specimen, and evidence for structural reorganization was evaluated. In instances where 2 “painted” chromosomes were fused into a single-derivative structure where both appeared to represent full-length copies, the copy number status of that chromosome was recorded as n=2.
Results
Generation of ciPSCs
VSV-G pseudotyped retroviruses containing 4 murine transcription factors (Oct3/4, Sox2, Klf4, and c-Myc) were used to develop 4 independent ciPSC lines. Retroviruses containing 4 transcription factors were transduced into adult dog SFs. The emerging colonies were firstly observed D7–D9 postinfection; ES-like colonies were picked at D21 postinfection and replated onto gamma-irradiated MEFs (Fig. 1A–C). Picked colonies were expanded in 2i media with LIF, FGF2, or both LIF plus FGF2. Although colonies in the 3 different media had similar growth rates and morphology, only the colonies cultured in LIF plus FGF2 showed strong AP activity (Fig. 1). The ratio of AP-positive colonies in LIF plus FGF2 medium was always higher than the sum of AP ratios for FGF2 or LIF alone, suggesting a synergistic effect of growth factors on maintaining pluripotency.
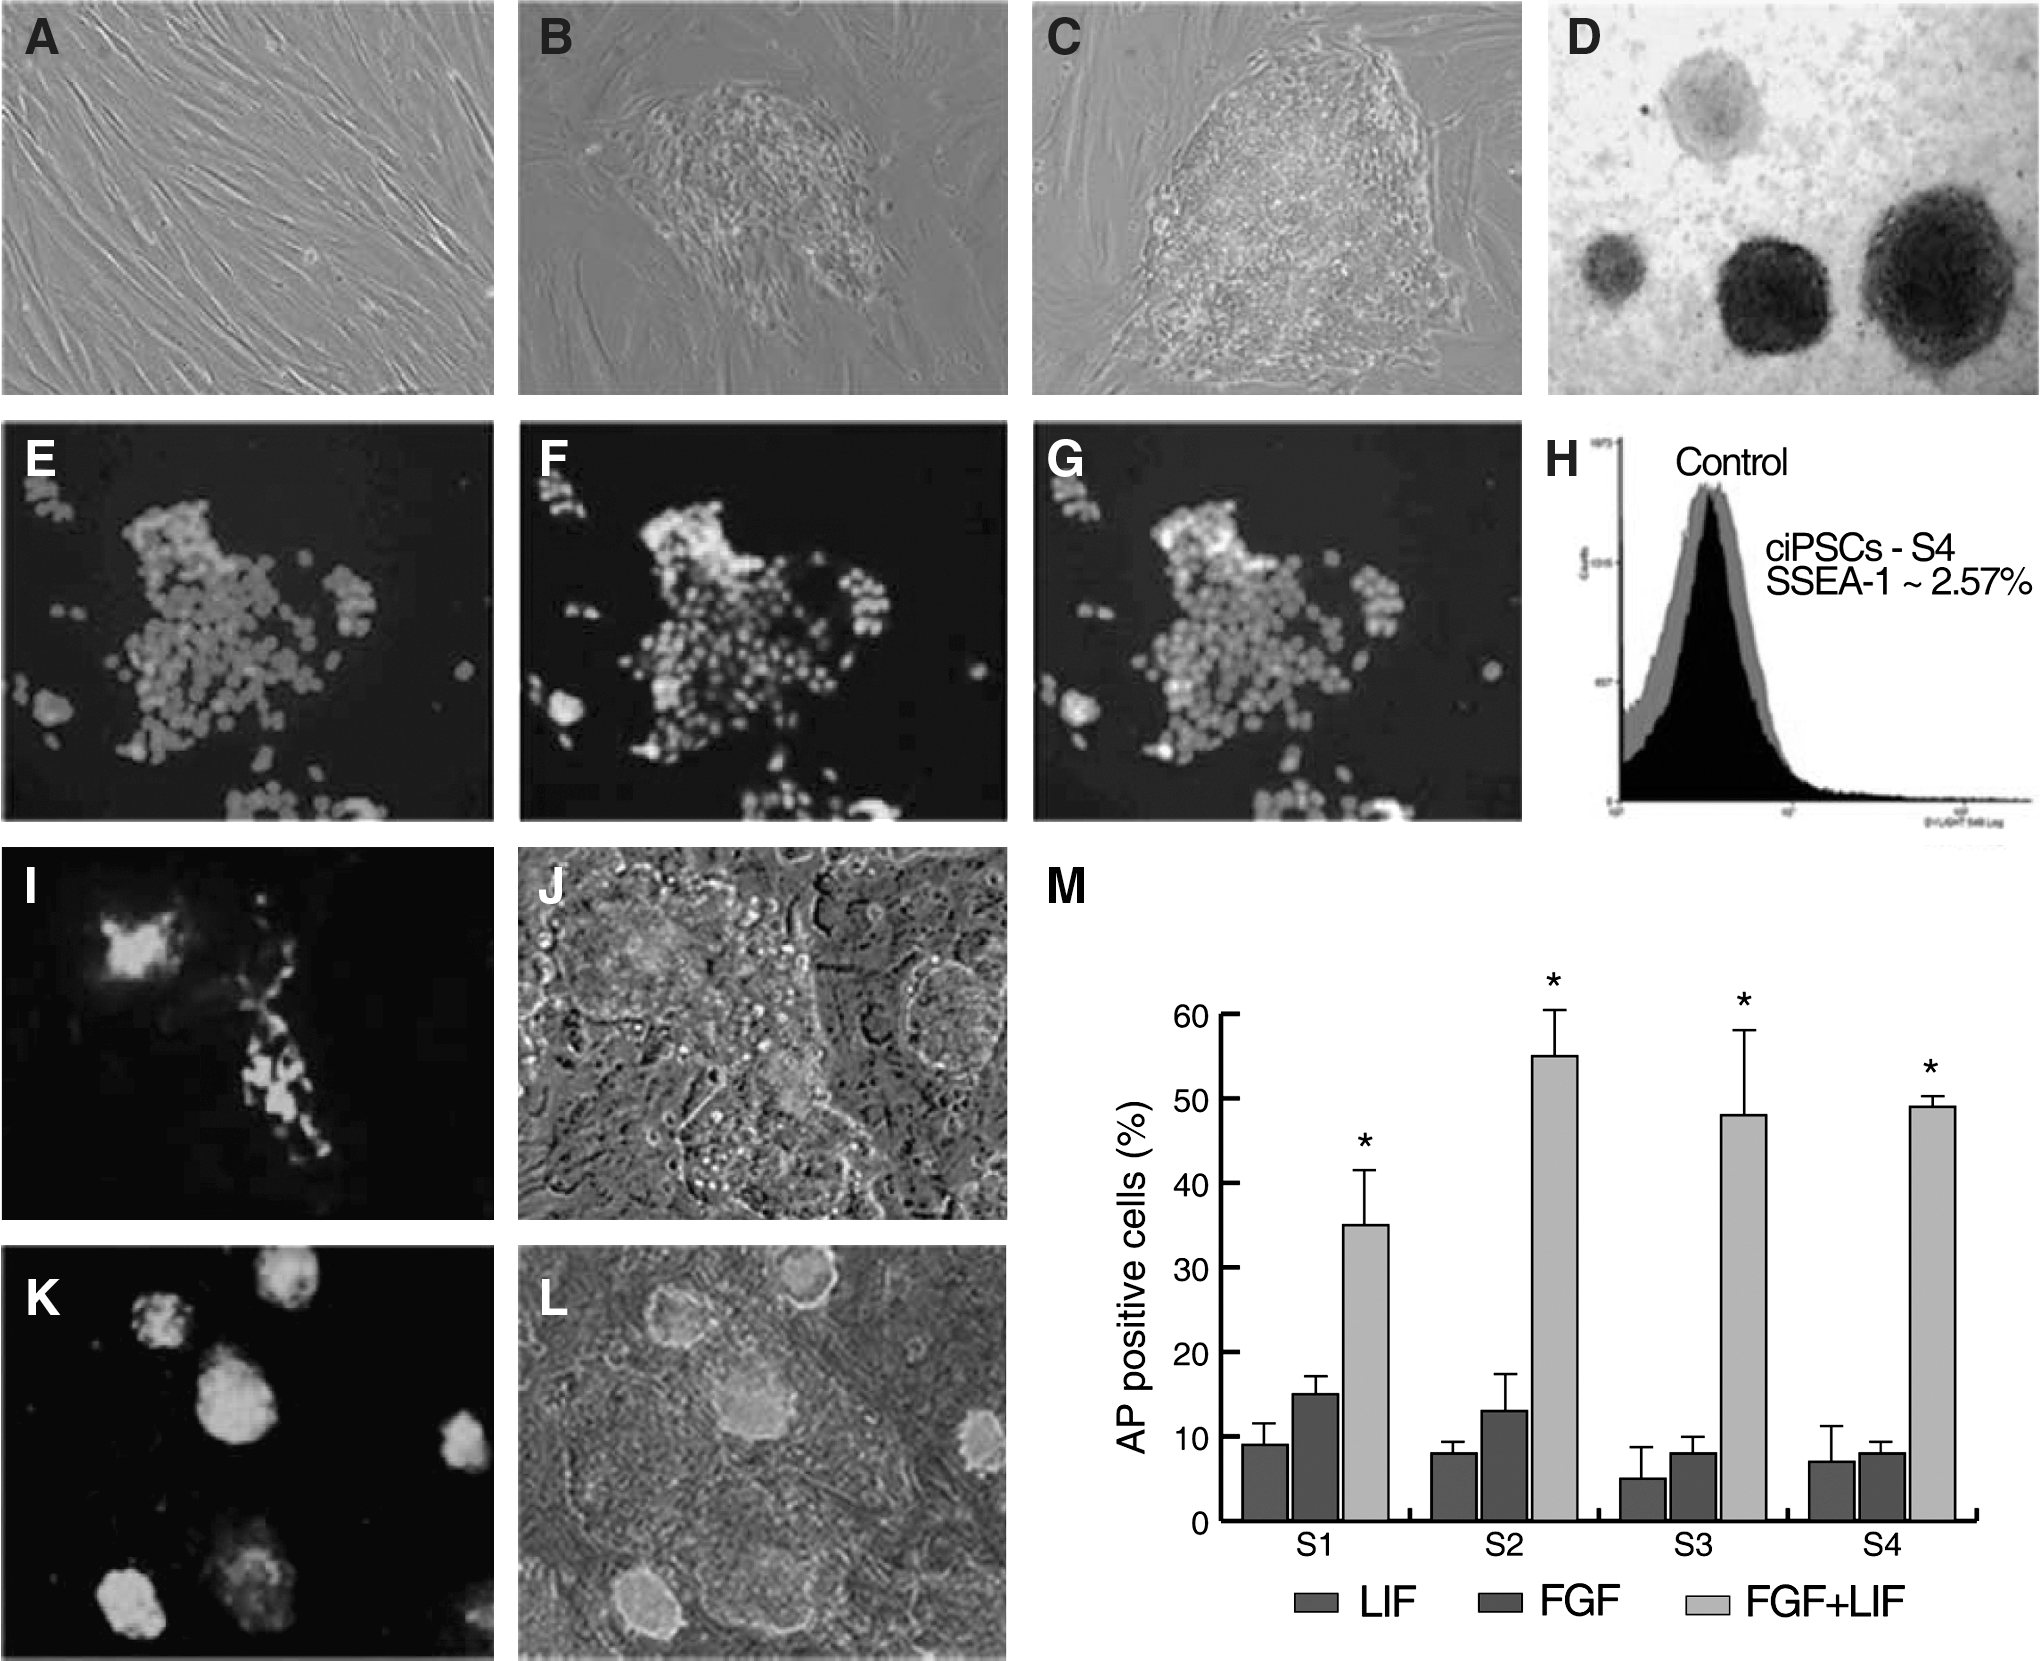
Morphological changes and alkaline phosphatase (AP) staining of canine induced pluripotent stem cells (ciPSCs) during reprogramming and immunofluorescence analysis of pluripotency markers.
Expression of pluripotency genes in ciPSCs
To characterize the 4 isolated ciPSCs, we confirmed pluripotency marker expression using RT-PCR and ICC. All 4 ciPSCs were positive for the endogenous pluripotency markers OCT4, SOX2, NANOG, and LIN28, consistent with ESCs from other species. Further analysis showed that all 4 lines also expressed PODXL, FGF5, REX1, and LAMP1, whereas only S2 and S4 lines were positive for DPPA5. However, the exogenous murine transcription factors were not fully silenced in any of the 4 lines (Fig. 2A). Their relative mRNA expression was further analyzed using real-time RT-PCR, and levels were compared with 6-day post-OKSM transfection parental fibroblasts (D6-fib). All cell lines had downregulated expression of the exogenous markers when compared with the D6 posttransfection fibroblasts; however, there was marked cell line variability (Fig. 2B). Reprogramming was also supported by reactivation of TERT in all 4 iPS lines (Fig. 2C).
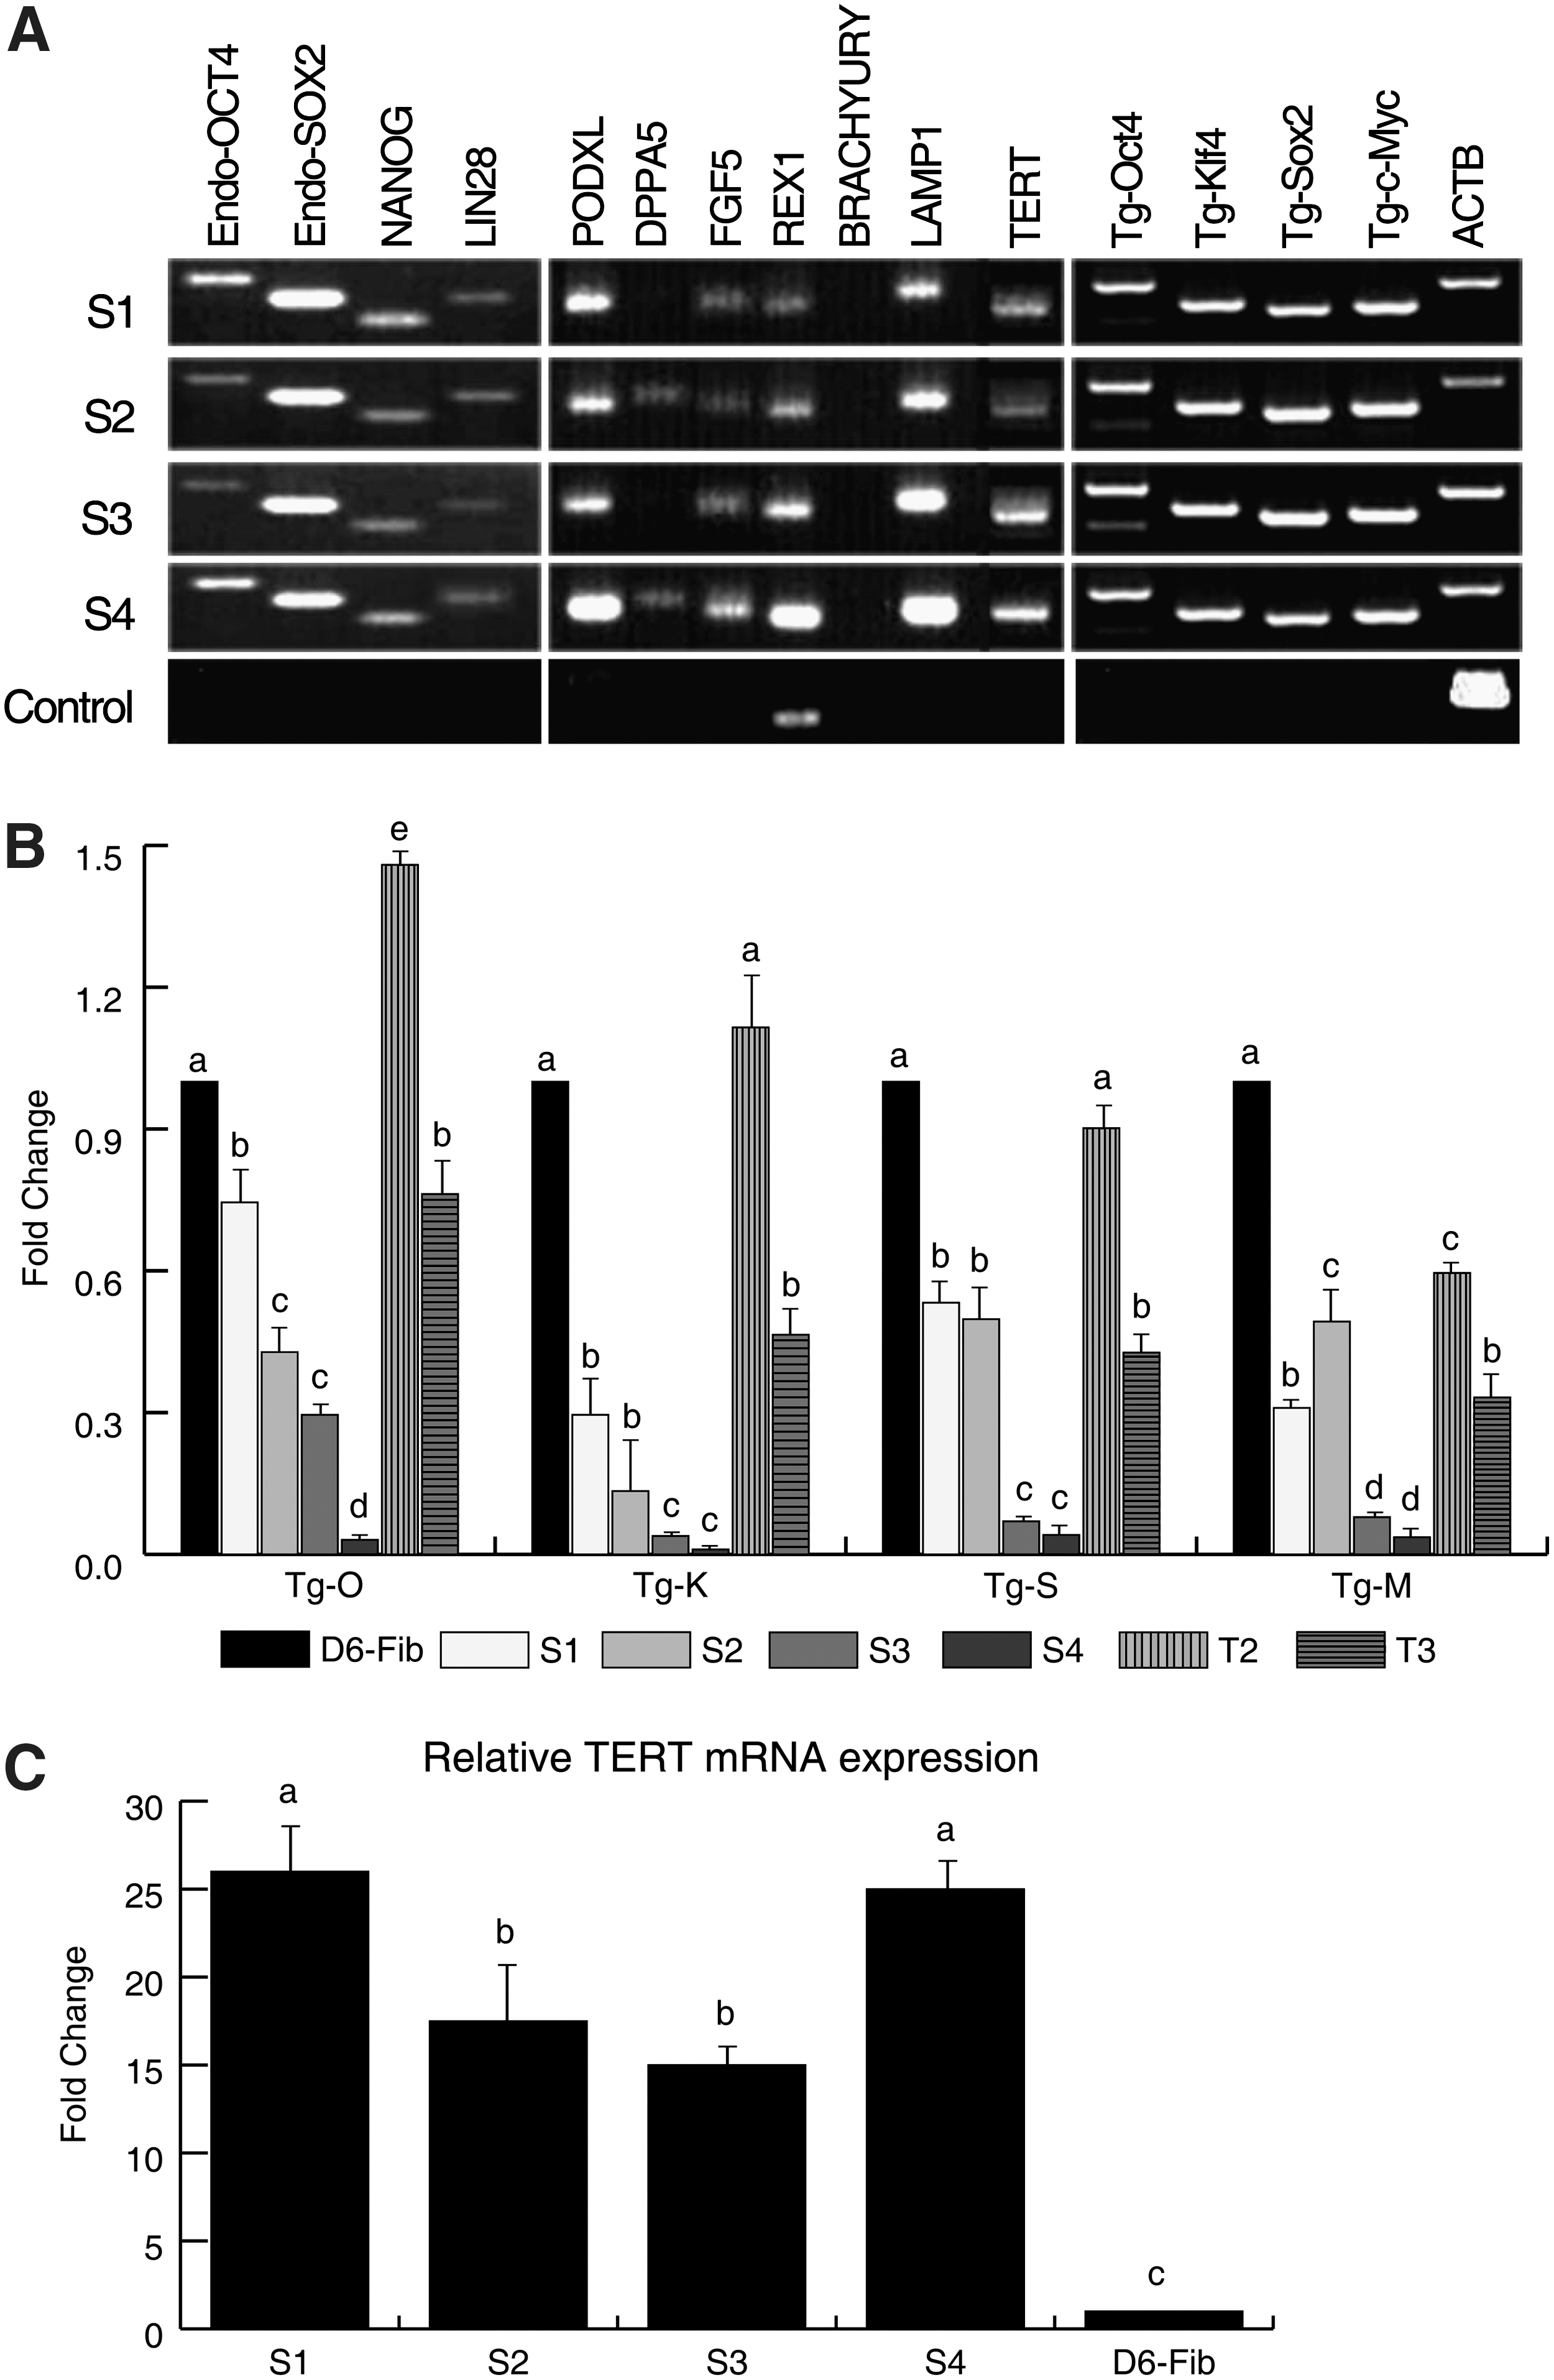
Expression of pluripotency markers and exogenous transcriptions factors in ciPSCs.
ICC analysis of passage 12 colonies from line S4 showed that cells were NANOG and SSEA-1 positive. SSEA-1, however, was expressed heterogeneously throughout the colonies (Fig. 1); in addition, all of the colonies examined were negative for SSEA-4 (data not shown). FACS analysis of S4 revealed that ∼2.6% of cells were positive for SSEA-1 (Fig. 1).
In vitro differentiation and RT-PCR analysis
Spontaneous differentiation by withdrawal of growth factors led to formation of EBs (Fig. 3A). The presence of 3 germ layers was confirmed by immunostaining of individual EBs. The EBs were positive for AFP (endodermal marker; Fig. 3B), TUJ1 and the glial marker GFAP (ectodermal markers; Fig. 3C), and VIM and DES (mesodermal markers; Fig. 3D). Day-21 EBs were positive by RT-PCR for CXCR4 and SOX17 (endoderm), TUBB and NCAM (ectoderm), and MSX1 and BMP2 (mesoderm). The parental fibroblasts showed weak expression of the mesodermal marker BMP2 but they were negative for all other markers (Fig. 3E). NANOG expression declined sharply after EB formation, suggesting loss of pluripotency during germ layer specification.
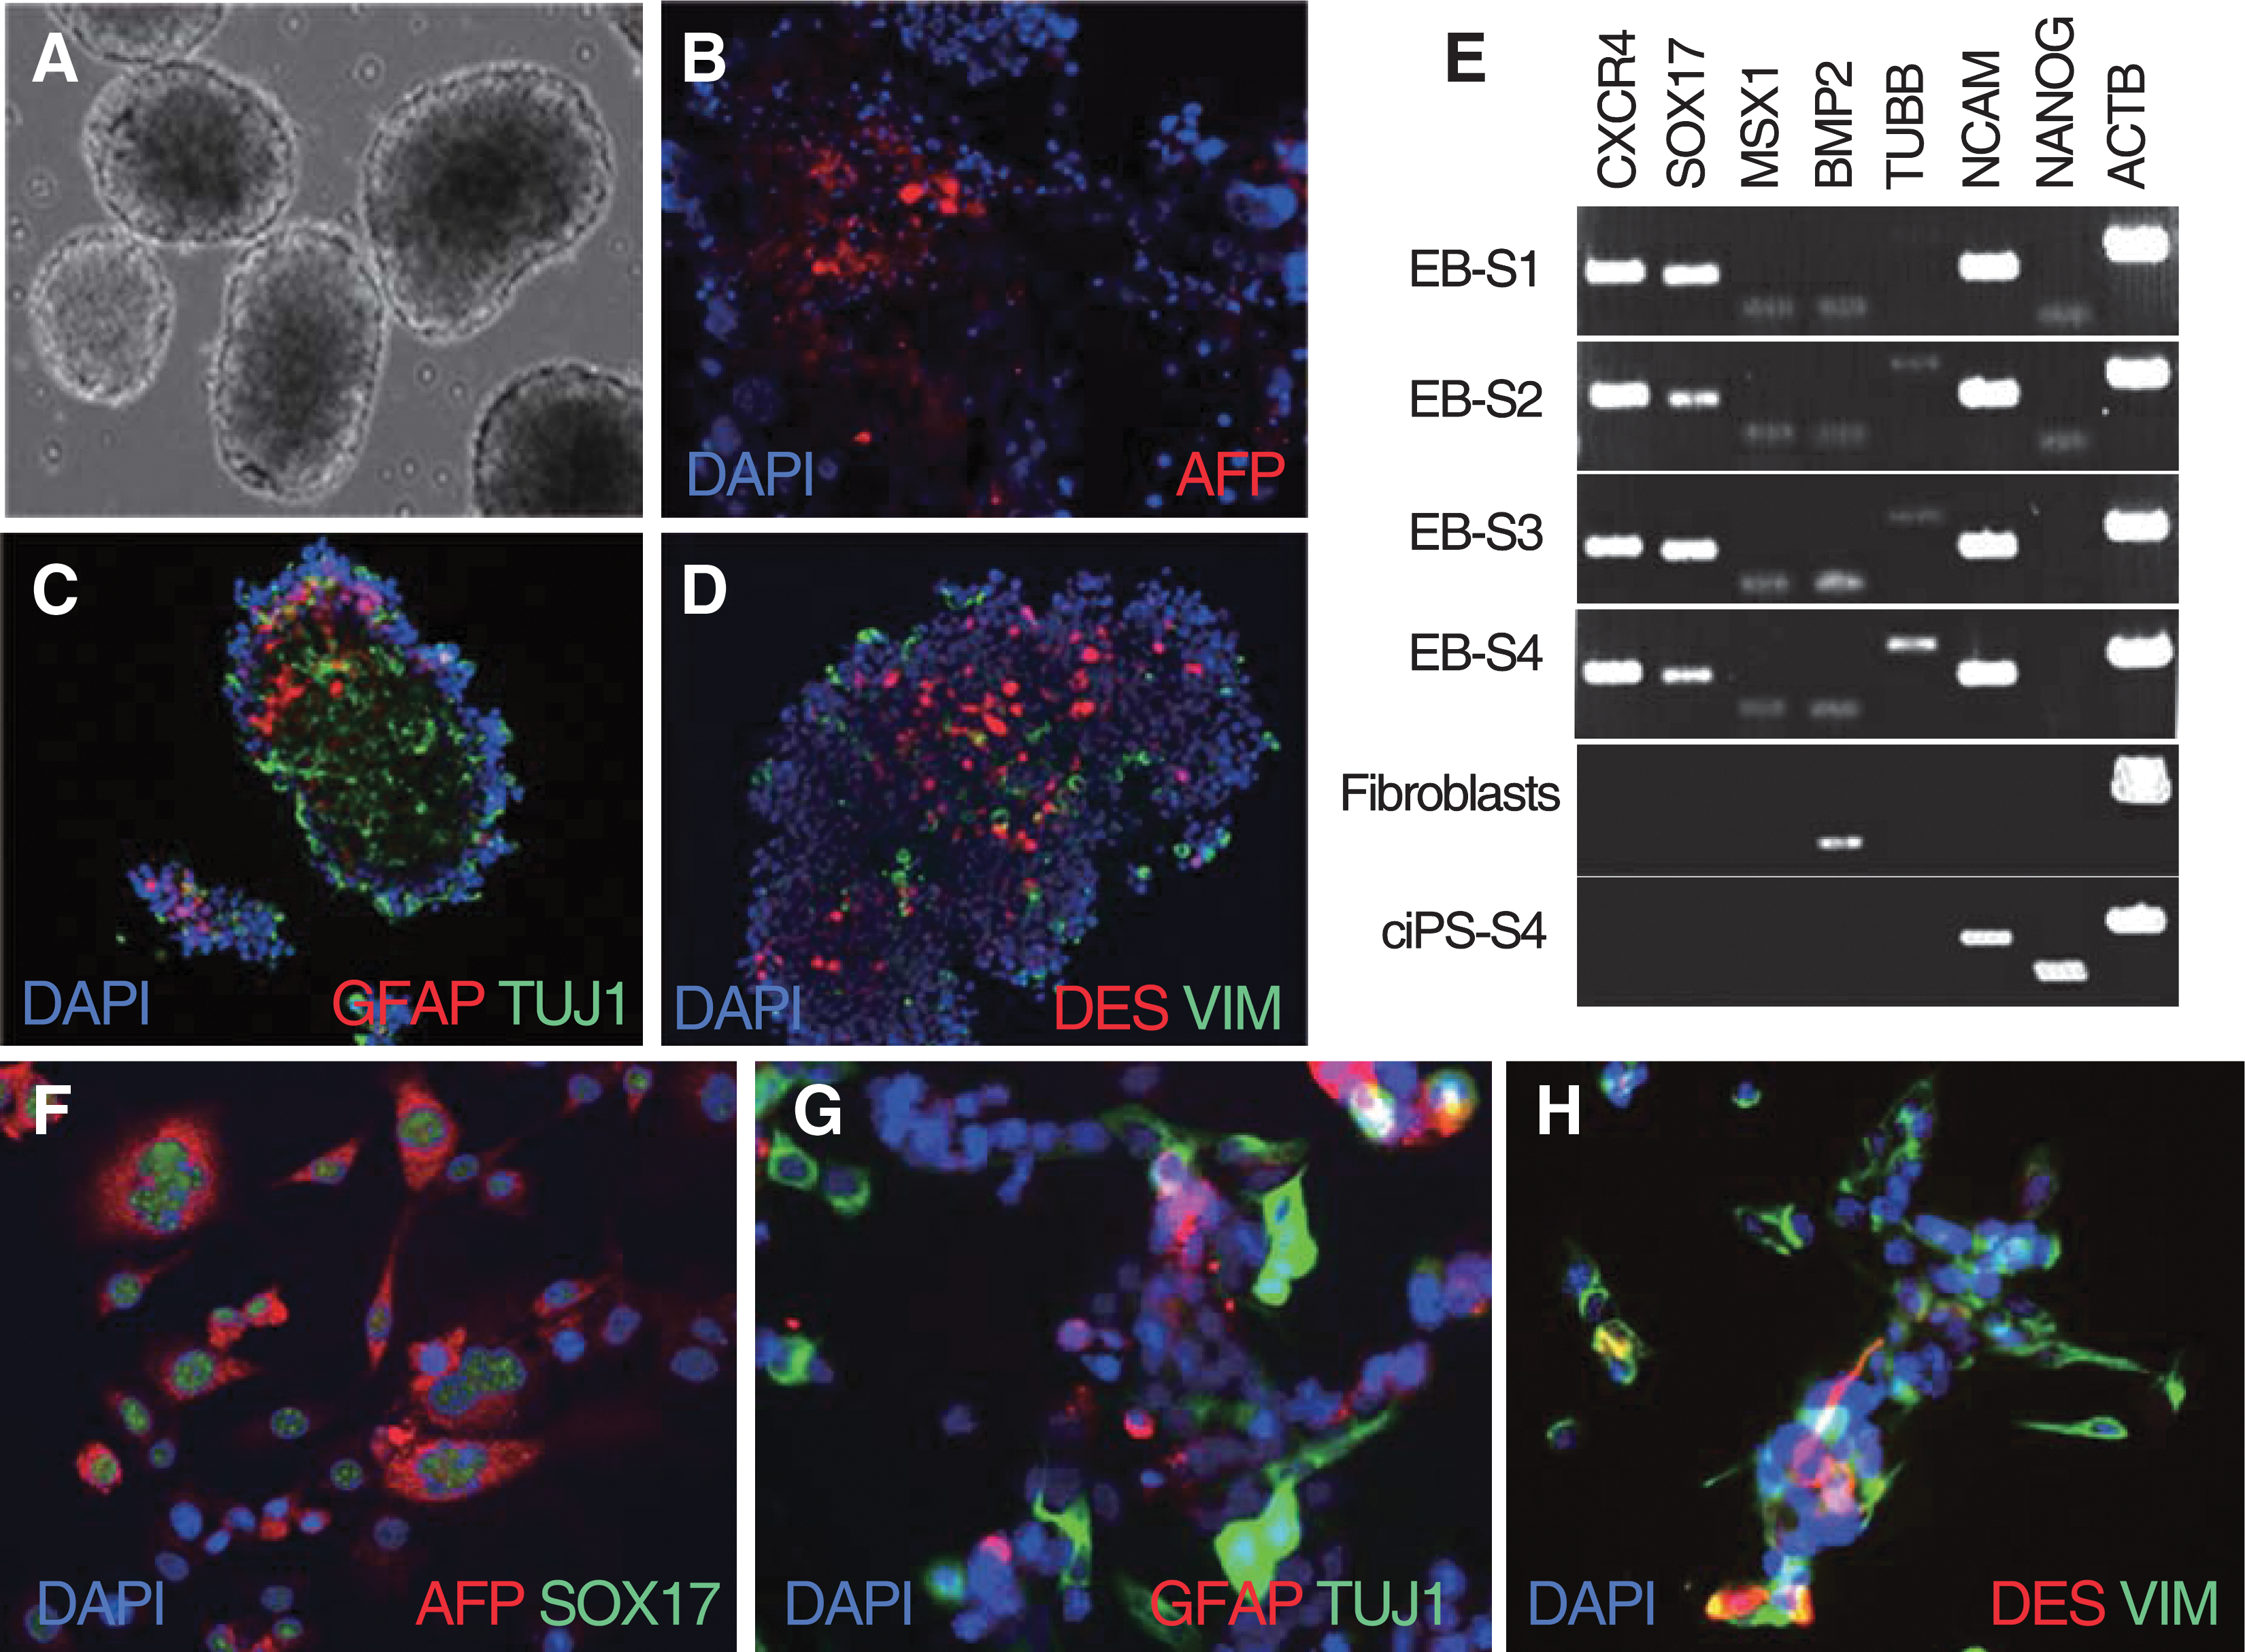
In vitro differentiation into 3 germ layers of ciPSCs.
For directed differentiation, the EB-derived cells plated with activin A were positive for the endodermal markers AFP and SOX17 (Fig. 3F); cells induced with RA were positive for GFAP and TUJ1, demonstrating differentiation of ciPSCs to ectodermal cell derivatives (Fig. 3G); and cells induced with BMP4 were positive for the mesodermal markers VIM and DES (Fig. 3H).
Teratoma formation
One million early passage ciPSCs, gamma-irradiated MEFs, parental fibroblasts, or mESCs were injected subcutaneously into immunodeficient mice. Injected cells were either unsorted or sorted for SSEA-4. Transplantation of ciPSCs resulted in the development of solid tumors (n=9/10; ∼2 cm diameter) after 22–54 days (Fig. 4A and Table 1). H&E staining showed that tumors had failed to reach complex epithelial structure formation, possibly due to their rapid growth (Fig. 4B). RT-PCR analysis showed expression of CXCR4 and SOX17 (endoderm), TUBB and NCAM (ectoderm), and MSX1 and BMP2 (mesoderm) from tumors derived from iPSCs of 3 different origins, unsorted cell line S4, SSEA-1-sorted cell line S2, and SSEA-1-sorted cell line S4 (Fig. 4C). In contrast, tumors derived from cell line S1 cultured in FGF2 showed low levels of endodermal marker expression and lack of TUBB, NCAM (ectoderm), and MSX1 (mesoderm) expression, whereas tumors derived from cell line S1 cultured with LIF and cell line S2 cultured in LIF plus FGF did not express TUBB. Interestingly, tumors derived from cell lines S2 and S3 (T2 and T3, respectively) demonstrated elevated level of expression of exogenous transcription factors compared with undifferentiated iPSCs (Fig. 2B). Tumors expressing all markers tested (S4, FACS-S2, and FACS-S4) were further analyzed at the protein level. IHC results demonstrated the presence of AFP (endoderm, Fig. 4D), DES and VIM (mesoderm, Fig. 4F), and TUJ1 and GFAP (ectoderm, Fig. 4E), supporting the presence of derivatives of all 3 germ layers. mESCs (n=2), gamma-irradiated MEFs (n=1), and parental fibroblasts (n=1) were used as positive and negative controls, respectively. Mice injected with mESCs developed complex tumors after 44 days while MEF or fibroblast injection did not result in tumor development (Table 1).
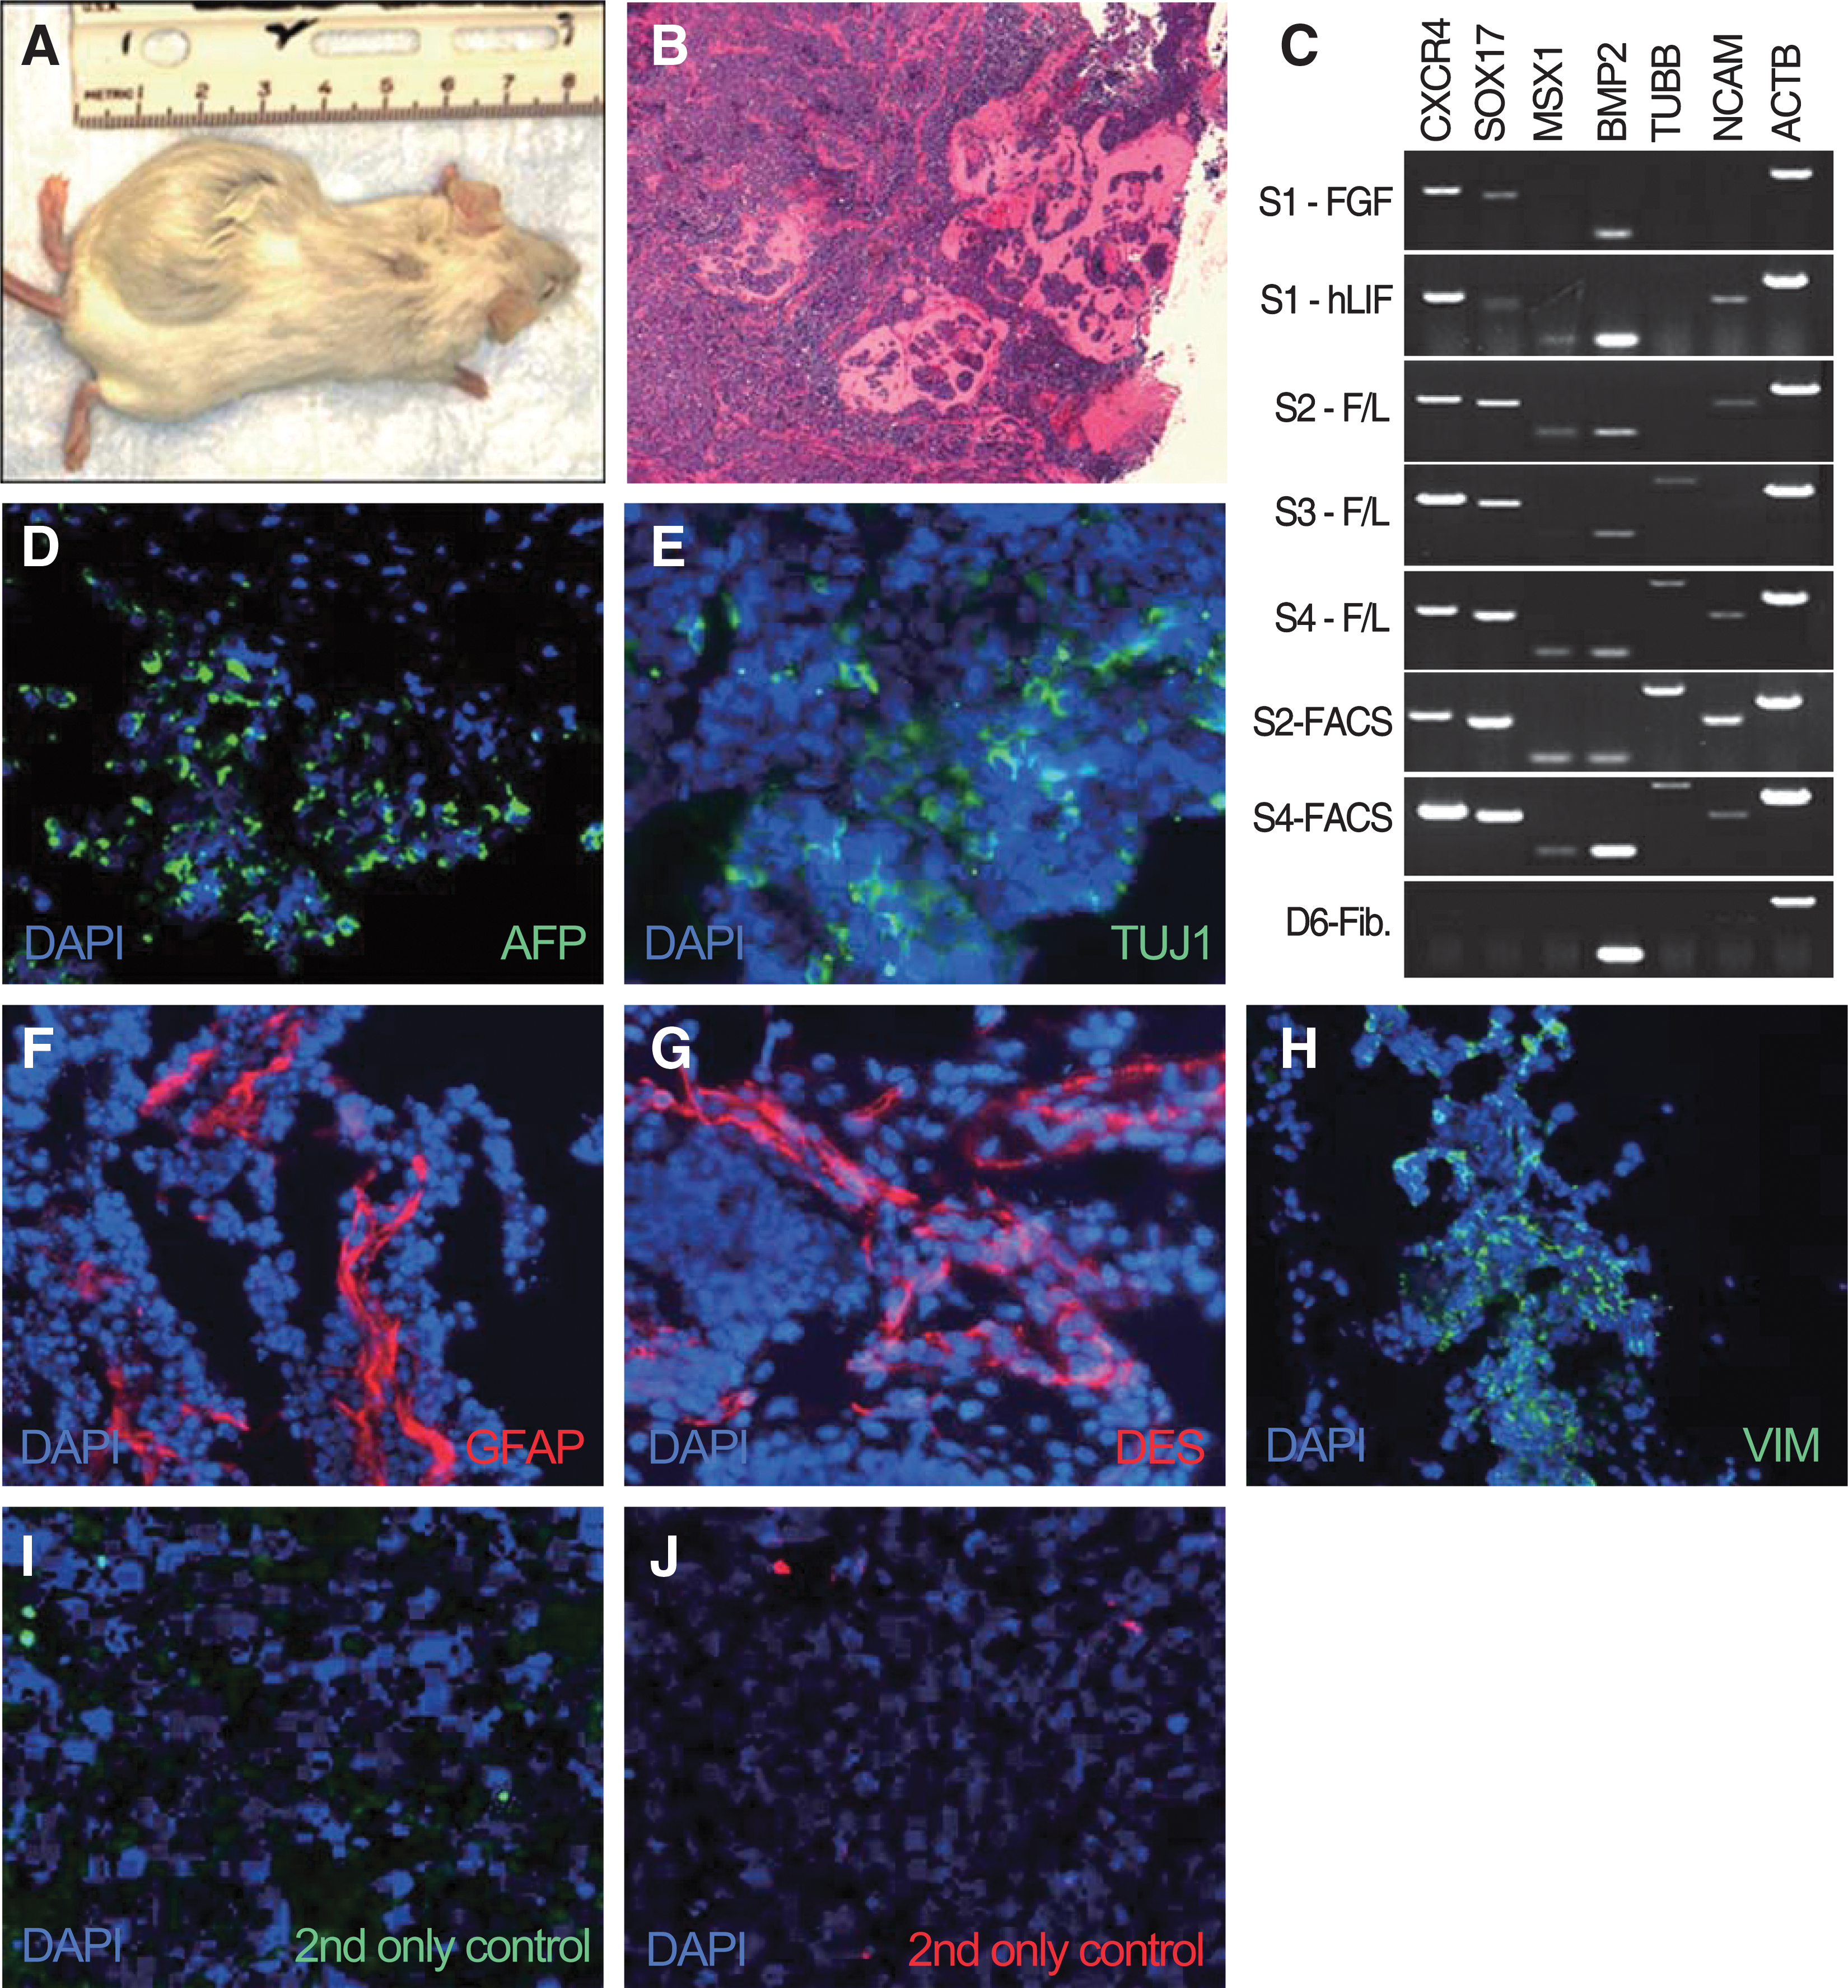
In vivo differentiation of early passage ciPSCs.
ciPSCs array-CGH analysis
The genomic DNA copy number status of the 4 ciPSC lines was evaluated using CGH (array-CGH) analysis to determine whether reprogramming (induction) and/or extended culture (maintenance) induced detectable aneuploidy. Genomic DNA isolated from each of the 4 derivative ciPSC lines was evaluated independently at passage 7 and again at passage 17 by array-CGH analysis, using the parental fibroblast cell line DNA as the common reference. Genomic DNA from parental fibroblasts was firstly aligned against a reference canine DNA sample known to have normal karyotype, and did not exhibit any DNA copy number imbalances (data not shown). Evaluation of the 4 ciPSC lines at passage 7 (blue profile in Fig. 5A) showed that inducing pluripotency by ectopic expression of 4 transcription factors did not result in detectable genomic imbalance according to standard criteria for defining significant non-random DNA copy number gain or loss in array-CGH (mean log2 test DNA: reference DNA>0.2 or <−0.2, respectively). No significant genomic imbalances were evident at passage 17 (red profile in Fig. 5A); however, direct comparison of data from both time points revealed the emergence of varying combinations of low amplitude gains along the length of dog chromosome (CFA) 4, 8, 13, and 16 during the maintenance phase of culture for all 4 cell lines (representative CFAs are shown in Fig. 5A as zoomed-in views).
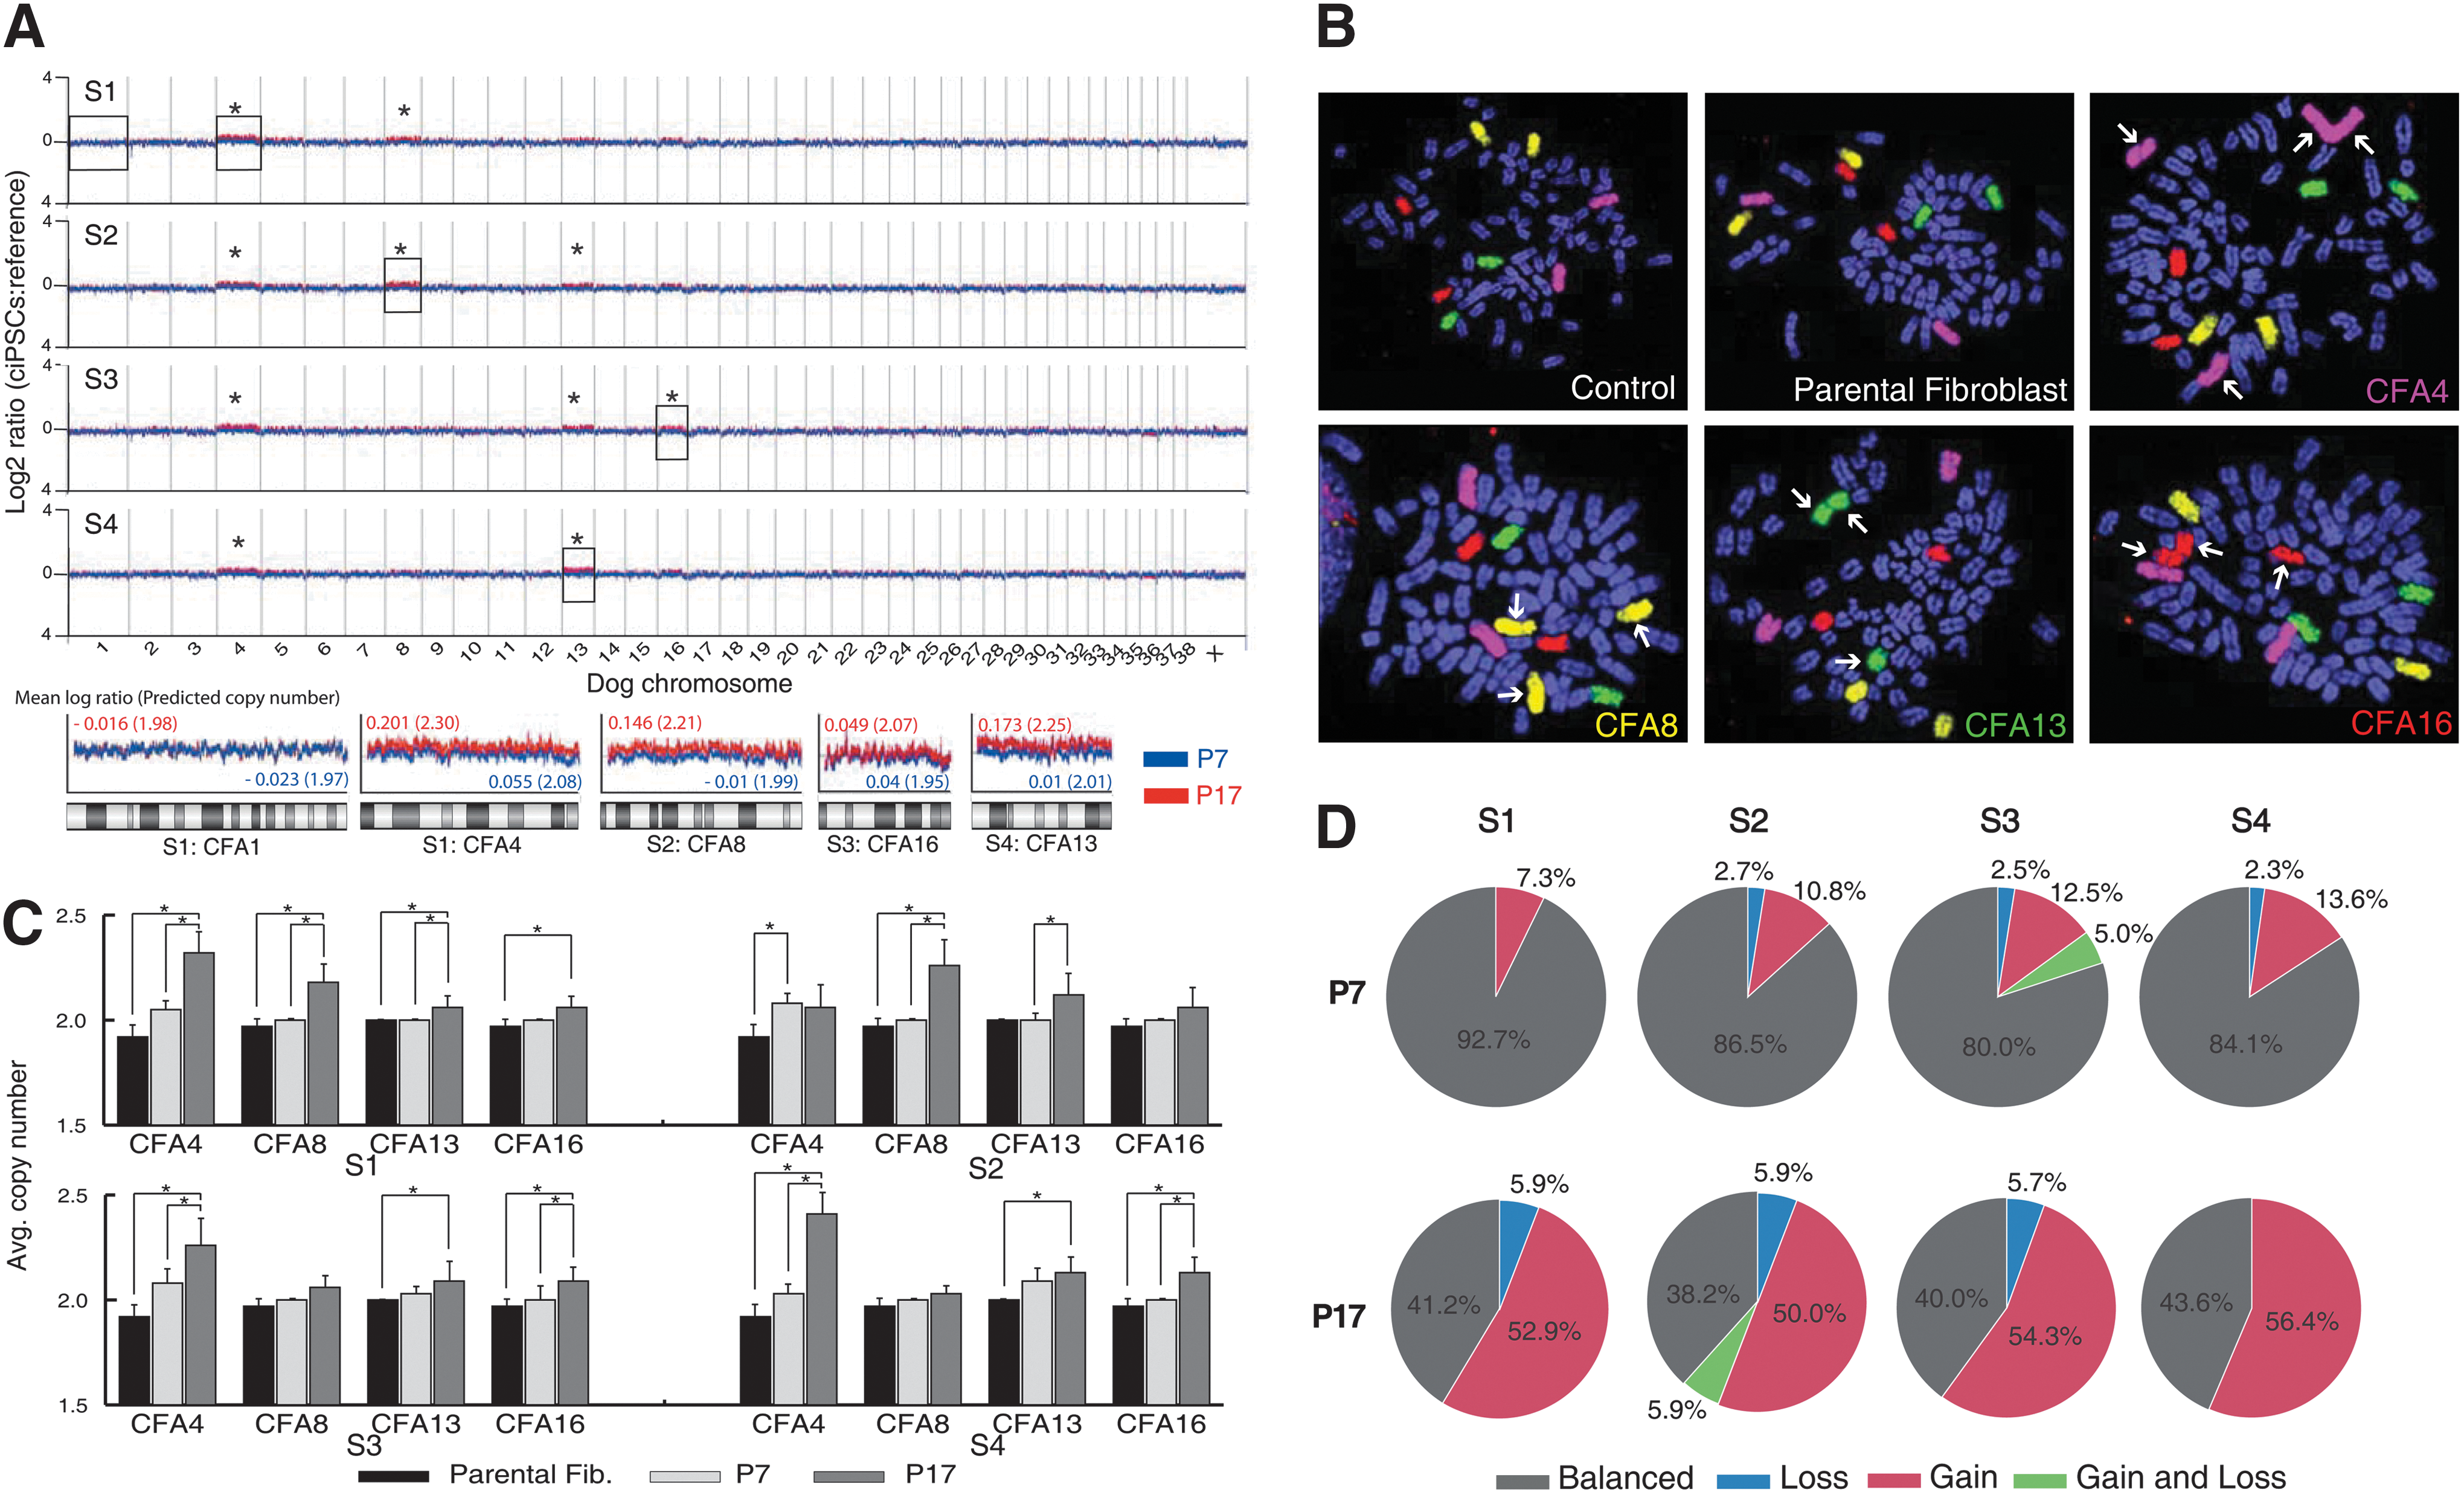
Cytogenetic analysis of ciPSC lines.
Chromosomal fluorescence in situ hybridization analysis
The effect of retrovirally induced reprogramming on genome stability was evaluated further by fluorescence in situ hybridization (FISH) analysis using differentially labeled chromosome paint probes representing CFA4, 8, 13, and 16 (Fig. 5B). Application of these probes to metaphase chromosomes from short-term peripheral blood lymphocyte cultures from clinically healthy donors and from the parental fibroblasts (P3) demonstrated a balanced copy number (n=2) for all 4 chromosomes (37/37, Avg n=2.00 and 29/34, Avg n=1.96, for healthy donors and parental fibroblasts, respectively), with no evidence for structural abnormalities. However, evaluation of ciPSC lines at passages 7 and 17 revealed a wide variety of chromosome copy number gains, and also revealed structural rearrangements, the majority of which involved fusion of homologous chromosomes. The mean copy number of CFA4, 8, 13, and 16 at passages 7 and 17 was determined for each cell line (range n=1–3), and these values are compared with the parental fibroblast cell line (Fig. 5C, D). The findings support the emergence of low-amplitude gains of CFA4, 8, 13, and 16 during the maintenance phase of culture that were indicated by prior array-CGH analysis. The specific pattern of copy number and structural organization of the 4 chromosomes evaluated by FISH analysis showed extensive cell–cell variation within each cell line, particularly, at passage 17, suggestive of multiple evolving subpopulations (Fig. 5).
Teratoma array-CGH analysis
The genomic DNA copy number status of the 3 tumor samples (T2–T4) derived from ciPSC lines S2, S3, and S4 was evaluated using CGH (array-CGH) analysis to determine whether the genomic aberrations gained in vitro after prolonged culture could be also observed in vivo after cell transplantation. Genomic DNA isolated from each of the 3 teratomas derived from ciPSCs (passage 3–4) was evaluated by array-CGH analysis, using the parental fibroblast cell line DNA as reference. Evaluation of the teratoma genomic DNA showed gains along the length of dog chromosome CFA36 acquired during the tumor development for both T2 and T3 (Fig. 6).
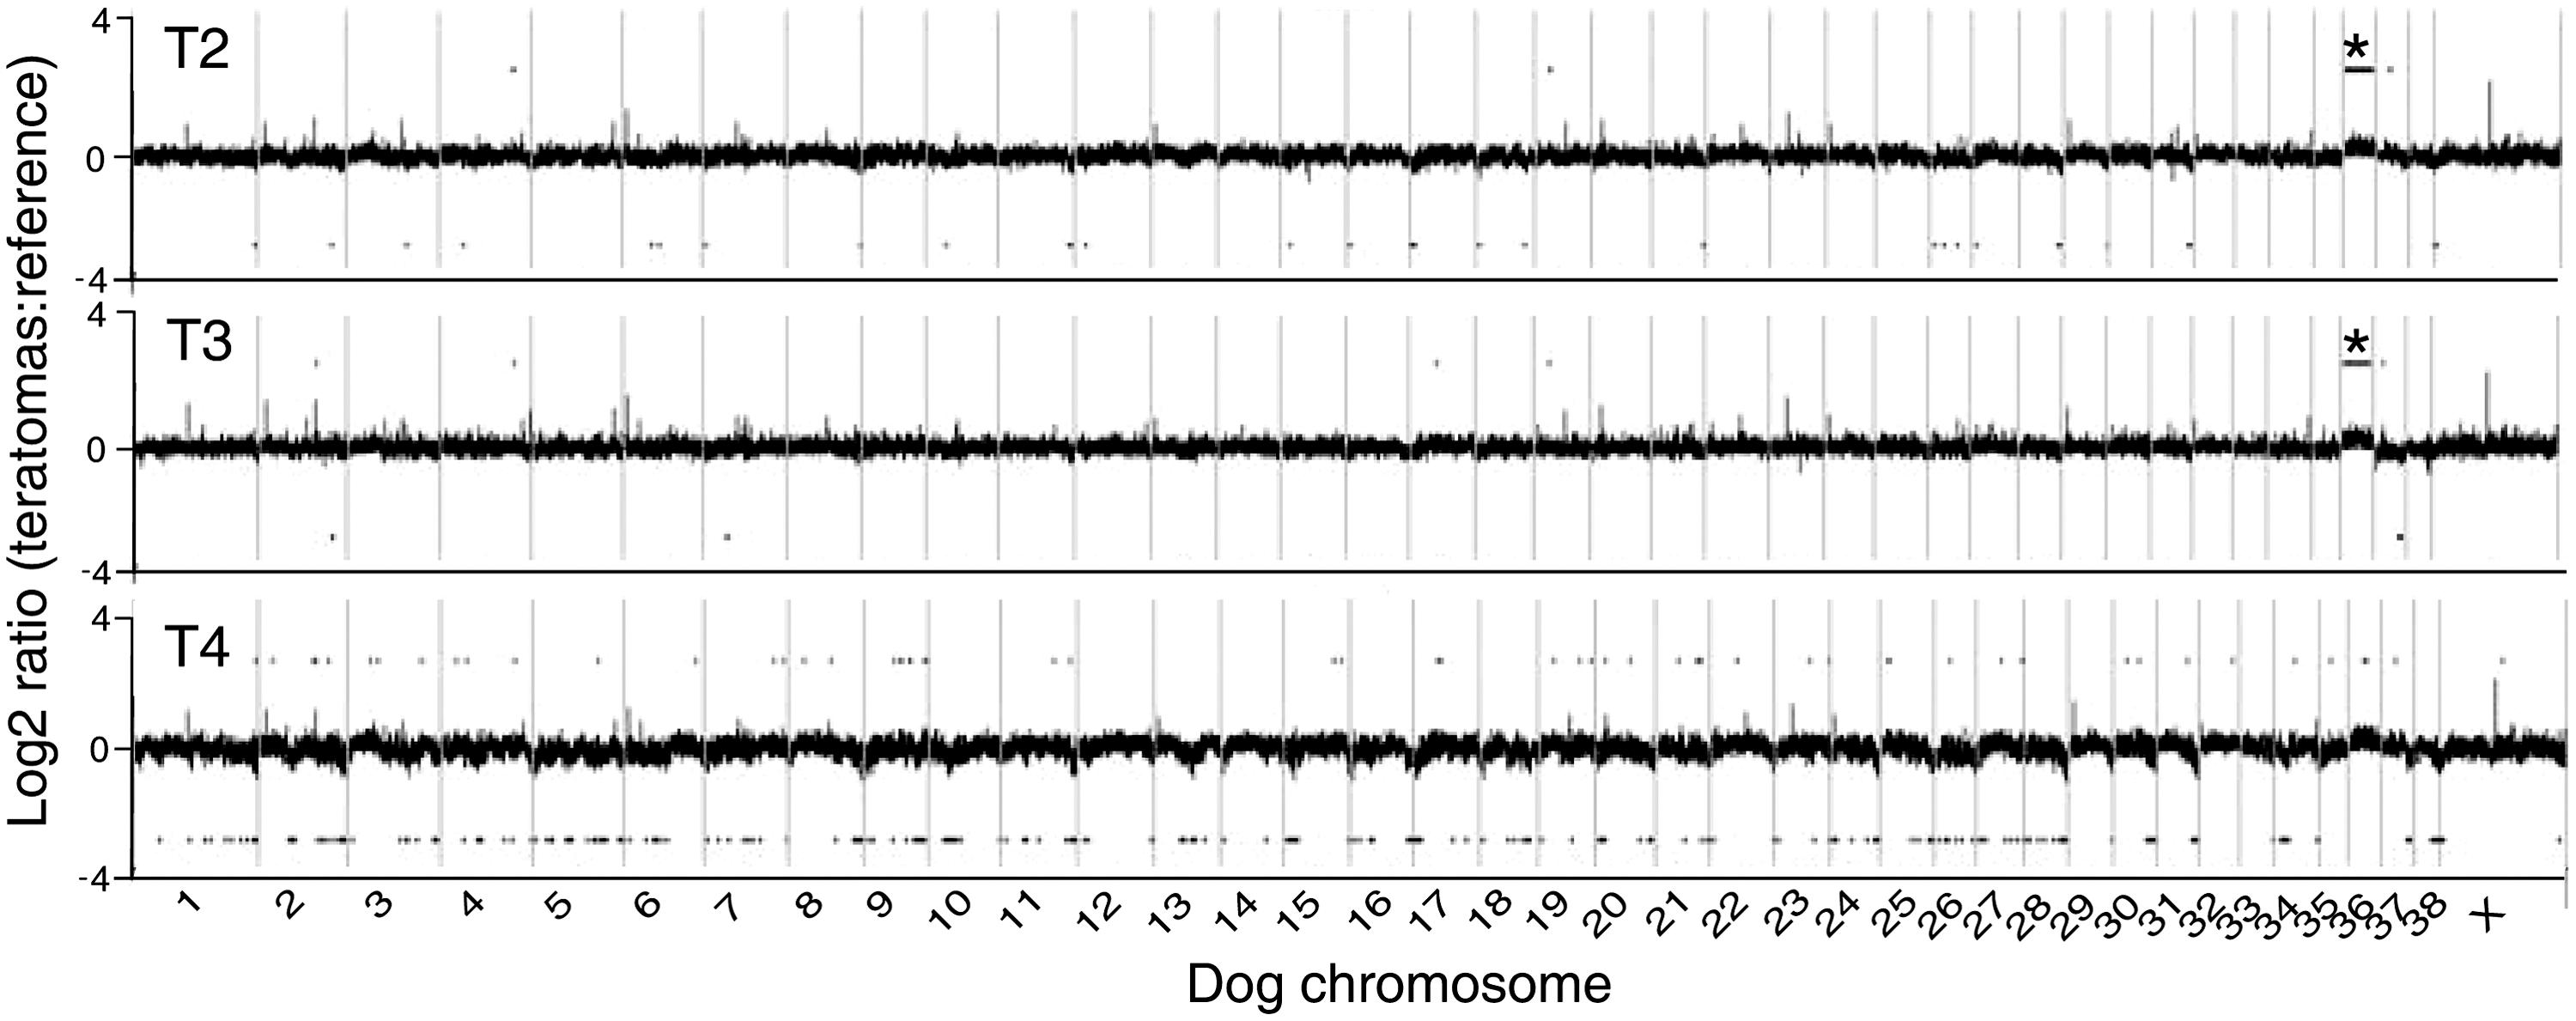
Cytogenetic analysis of teratomas. Array CGH profile of 3 independent tumors compared with the common parental fibroblast reference. Tumors derived from the ciPSC lines S2, S3, and S4 are indicated as T2, T3, and T4, respectively. Gains of CFA 36 in T2 and T3 are marked as “*”.
Discussion
Here, we report that canine adult skin cells can be reprogrammed into a pluripotent state by ectopic expression of 4 transcription factors: Oct4, Klf4, Sox2, and c-Myc (OKSM); an approach that has been successful in other species. Our results confirm that ciPSCs require both FGF2 and LIF along with inhibition of MAP2K1 and GSK3B to maintain pluripotency after initial induction. Mouse and human iPSCs are known to have characteristics similar to ESCs and to be dependent on LIF or FGF2 for maintaining pluripotency [10,11]. Attempts to isolate stable cESC lines using the media used for mouse and human [2 –4,6] were not successful, as isolated cell lines lose pluripotency in long-term culture and fail to form tumors when transplanted into immunodeficient mice. Vaags et al. [5] in 2008 first reported the isolation of cESC lines with the ability to form teratoma but the cells required the presence of both LIF and FGF2. Recent studies have demonstrated that similar to cESCs, ciPSCs also require both LIF and FGF2 [17 –19]. Whitworth et al. [20], however, reported isolation of LIF-dependent ciPSCs but the isolated cell lines developed germ cell tumors when injected into immunodeficient mice. Our findings further support the requirement for both LIF and FGF2, as ciPSCs showed significantly decreased level of AP staining and loss of pluripotency markers if either factor was absent (Figs. 1 and 4). While the exact mechanism for the dual requirement of LIF and FGF2 by both cESCs and iPSCs remains to be elucidated, it is clear that there are significant species-specific differences in culture and maintenance of stem cells that remain to be understood and that could increase our overall understanding of reprogramming and stem cell biology in general.
Our results of in vitro differentiation and incomplete silencing of exogenous factors in ciPSCs parallel a previous report [20]. In comparison to previous reports, however, we quantitated the extent of exogenous transcription factor expression (Fig. 2B) and the extent of silencing was as high as 90% in some of the cell lines. Thus, while there is still a requirement for some exogenous factor expression to maintain pluripotency, there is also a considerable level of reprogramming. Moreover, in spite of expressing the exogenous factors, although at low levels, iPSCs were able to generate derivatives of all 3 germ lines as determined by well-characterized germ cell markers, such as SOX17 and CXCR4 (endoderm) [28], BMP2/MSX1 (mesoderm) [29], and TUBB/NCAM/GFAP (ectoderm) [30,31]. In addition, the heterogeneity of the cell lines could not be reduced by FACS enriching for SSEA-1-expressing cells as those cells were indistinguishable from nonsorted cell lines after 2–3 passages. This suggests an inherent instability and heterogeneity of the cell lines that will make clinical applications more difficult.
In vivo pluripotency was assessed by flank injection of ciPSCs into immunodeficient mice. Previously, others had reported the inability to generate teratomas after flank injection of either cESCs or iPSCs [2 –4,6]. Only a study of cESCs after injection into the testis capsule [5] and a report of ciPSCs with injection into the dorsal flank [19] were capable of teratoma formation whereas Whitworth et al. [20] reported a germ-cell-like tumor formation. In contrast to results of Shimada et al. [17] and Luo et al. [18], but consistent with Lee et al. [19], our cells were capable of developing into tumors at relatively high frequency after subcutaneous transplantation (Table 1). While the tumors did not contain complex epithelial structures, they had derivatives of all 3 germ layers as confirmed by both RT-PCR and IHC (Fig. 5). Also, the tumors exhibited elevated level of transgene expression compared with the undifferentiated iPSCs from which they were derived from (Fig. 2B). This suggests that cells expressing high levels of the exogenous factors have a proliferative advantage during tumor formation. This, in turn, is likely to affect the ability of the injected cells to form complex teratomas. In addition, as the only difference between the cells described here and those incapable of tumor formation [18] is the use of the 2i inhibitors, we can only speculate that inhibition of GSK and/or ERK allows cells to support reprogramming and to remain in a more pluripotential state [32,33]. Although simultaneous addition of FGF2 and PD is counterintuitive due to their opposite effects on the MEK/ERK pathway, our observations clearly demonstrated a beneficial effect on the ciPSCs when both molecules were present. We hypothesize that FGF2 may be affecting ciPSC self-renewal indirectly through MEFs by activating activin through the transforming growth factor-β pathway, as activin is known to synergize with FGF2 and promote proliferation in hESCs. In contrast, PD blocks ciPSC differentiation induced by activation of the MEK/ERK pathway [33]. Luo et al. [18] also demonstrated that the absence of LIF in the presence of FGF triggers apoptosis in ciPSCs. In our experiments, withdrawal of LIF did not induce apoptosis but induced loss of pluripotency as shown by loss of AP expression (Fig. 1). The results suggest that GSK-3-derived apoptotic signaling pathways were inhibited by addition of the small molecule, CHIR-99021, while the absence of LIF promoted differentiation and loss of AP expression.
In addition to in vivo differentiation ability, we were interested in examining the chromosomal stability of the cell lines during reprogramming and prolonged culture and tumor formation. Human ESCs [34 –36] and iPSCs [37 –40] are known to acquire genomic copy number aberrations during extended passages in vitro. Our results parallel these observations. The 4 chromosomes found to exhibit copy number increase in the present study were CFA4, 8, 13, and 16 (Fig. 5). Gain of CFA4 was common to all 4 cell lines despite their independent evolution in culture, while gains of CFA8, 13, and 16 were evident only in certain lines. Interestingly, gain of CFA13, which harbors the MYC oncogene, is among the most common copy number aberrations in a wide range of dog cancers [41 –44]. In a recent study, human iPSC lines showed gains of chromosomes 1, 9, and 12 at high passages (>P40), with chromosome 12 gain detected in both iPSCs and ESCs [37]. Collectively, trisomy of chromosome 12 is the most commonly seen aneuploidy in both human ESCs and iPSCs and the gains are thought to appear upon extended culture during the adaptation period. In mice, analysis of 127 independent iPSC lines indentified a high incidence of chromosome 8 and 11 trisomy [45]. Syntenic analysis of the affected canine chromosomes (Fig. 7) identifies commonly affected regions among all 3 species. Approximately 5.6 Mb region of CFA4 was found to be common in all 3 species whereas only 215 and 43 kb were common in CFA8 and CFA13, respectively.
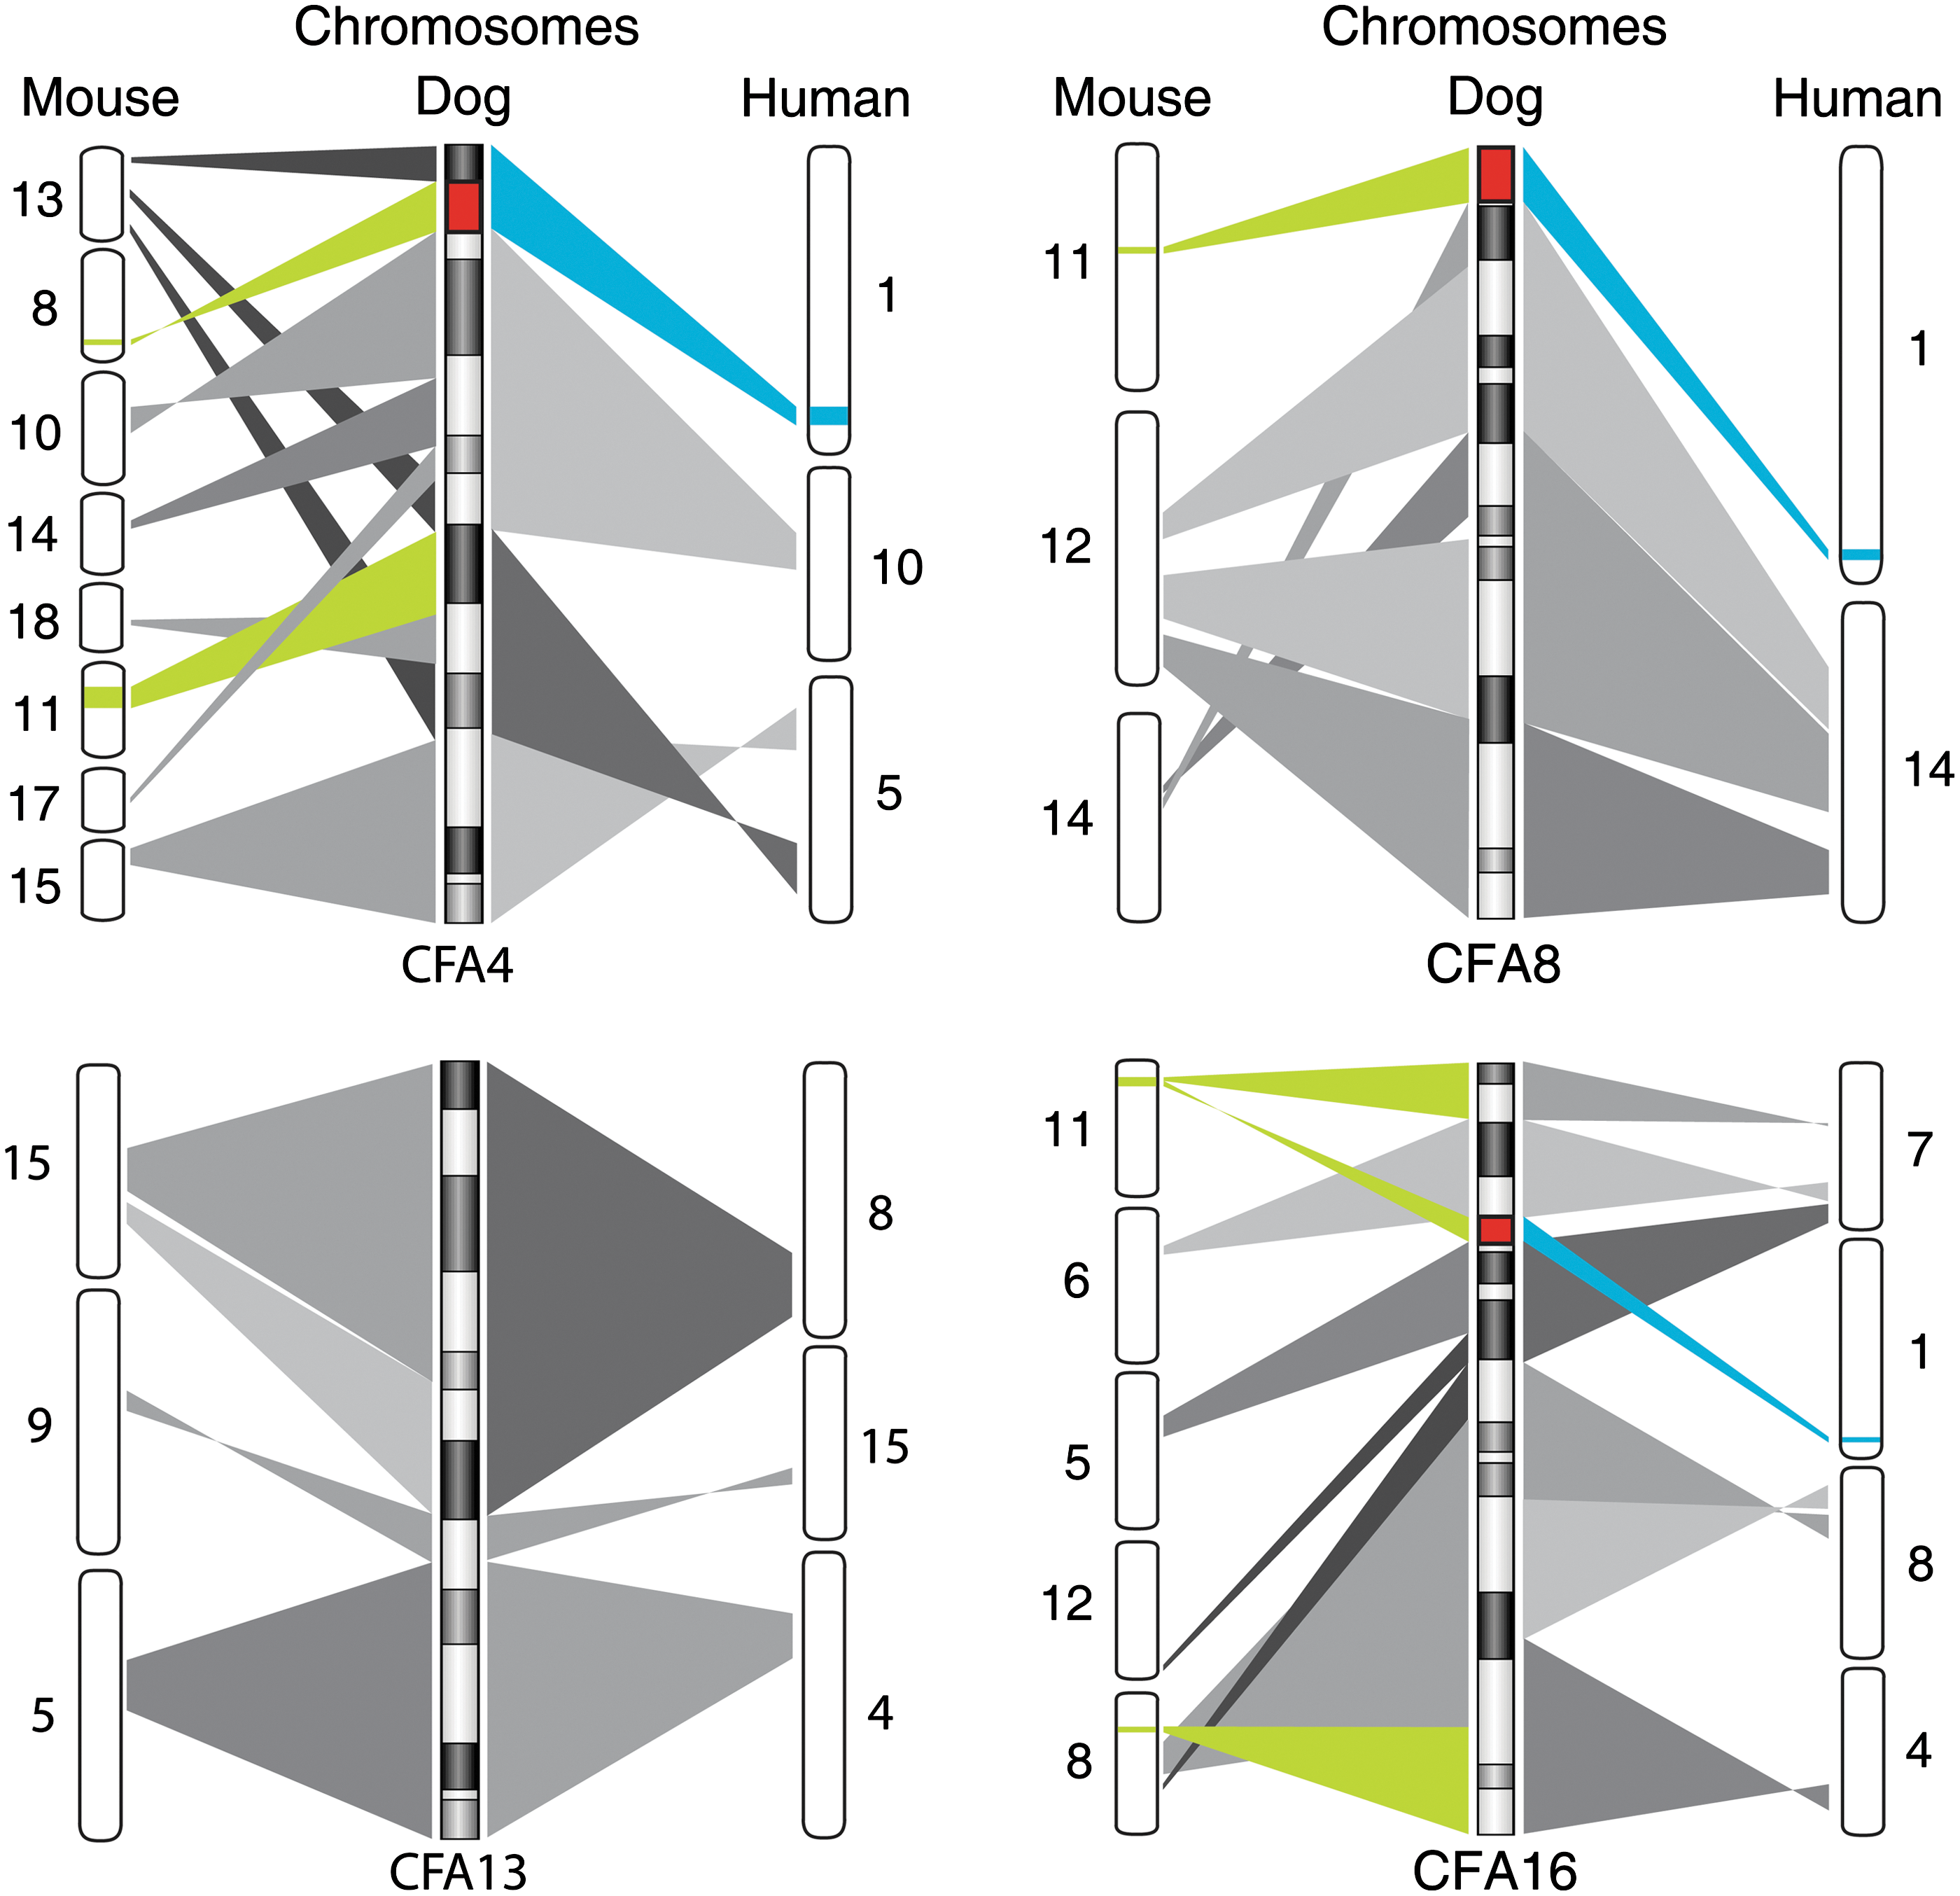
Syntenic analysis of species-specific recurrent aberrations in mouse, human, and dog pluripotent stem cells. Dog chromosomes affected after extended culture periods (CFA 4, 8, 13, and 16) are compared with mouse and human chromosomes. Green and blue regions indicate species-specific aberrations previously reported in mouse (chromosomes 8 and 11, green) [45] and human pluripotent stem cells (chromosomes 1, 9, 12, and 17, blue) [34 –40]. Red indicates the regions where all 3 species share genomic aberrations. Both mouse chromosomes 8 and 11 and human chromosome 1 were syntenic to regions of CFA 4, 8, and 16.
In addition, our cytogenetic analysis on teratoma samples derived from the early passage iPSCs showed a gain of CFA36 but did not show any evidence of gains in CFA4, 8, 13, and 16 (Fig. 6). We reexamined the early and late-cultured cells by FISH to determine whether there were any changes in CFA36 in culture and found no differences when compared with the original cell line or reference sample (data not shown). These results strongly suggest that the microenvironment in which the cells are grown, either in vitro or in vivo, has a significant effect of the type of chromosomal changes that are observed. This is likely due to different chromosomal changes conferring a selective advantage depending on the microenvironment in which those cells are growing so that over time, changes increasing growth rate and/or survival become the predominant population whether it is during in vitro culture or in vivo tumor formation.
As this is the first detailed report of chromosomal instability in ciPSCs, we cannot yet determine whether the observed aneuplodies are unique to these cell lines and method of induction, or, like humans and mice, is a characteristic pattern seen in iPSCs from a particular species. Previously, Luo et al. [18] examined genomic stability in ciPSCs by standard G-banding karyotype analysis (between passages 3 and 5) and reported that 80%–100% of cells had a normal karyotype (2n=78). Likewise, Lee et al. [19] reported that ciPSCs had normal karyotype at passage 30 but no information was provided as to methods used. Standard cytogenetic techniques, such as banding analysis and chromosome enumeration, are limited both in their reliability and resolution. This is particularly so for a karyotype such as that of the domestic dog, which comprises 38 pairs of relatively small, acrocentric/telocentric chromosomes that cannot readily be identified by banding analysis alone [46]. The application of array-CGH analysis in the present study overcomes these limitations. Further, the use of array-CGH analysis was used as a precursor to chromosome-based analysis as it permitted identification of the specific genomic regions to target in subsequent FISH analysis. While standard thresholds for identifying genomic gain and loss in array-CGH did not identify significant copy number imbalances after prolonged culture, there was a clear tendency toward the emergence of aneuploidy when DNA copy number data from each cell line were compared at passages 7 and 17 (Fig. 5A). Subsequent FISH analysis recapitulated the gains of CFA4, 8, 13, and 16 detected by array-CGH, and additionally revealed evidence for structural abnormalities at low frequency in all cell lines, primarily through centric fusions to form aberrant bi-armed derivatives. The low amplitude of copy number aberration detected by array-CGH is likely to be related to the extensive cell–cell variation in the FISH-derived data for each chromosome in each cell line, since array-CGH analysis reports the mean copy number status within the population of cells sampled for DNA isolation and thus is blind to subpopulations present within a given cell line. In combination, our findings indicate that while array-CGH exceeds the sensitivity of conventional chromosome banding analyses, in isolation it may underestimate the true incidence of genomic instability in reprogrammed cell lines. The application of this technique in combination with targeted FISH analysis is therefore a more reliable means to evaluate cell lines prior to application in a clinical setting.
Here, we reported that ciPSCs could be isolated from adult fibroblasts and expanded, and that these cells were capable of differentiation into 3 germ layers in vitro and in vivo. We also demonstrated, by high-resolution monitoring of karyotypic stability in vitro and in vivo, that like in mice and humans, ciPSCs are karyotypically unstable in culture and as such careful monitoring is required prior to clinical applications. Robust ciPSCs will provide powerful tools not only for the development of therapeutic approaches, such as cell transplantation, but also experimental applications for studying human diseases, but methods to ensure karyotypic stability need to be developed.
Footnotes
Acknowledgments
The authors thank Dr. Yongbaek Kim for helpful advice with tumor histology and Katie Burrough, Alex Hanes, and Ashley Pragar for assistance with chromosome analysis. We also thank Dr. T. Kitamura for generously providing PLAT-GP packaging cells and pMXs retroviral vectors. This work was supported by grants from American Kennel Club Canine Health Foundation to J.A.P. and N.J.O. (CHF 01272); North Carolina State University Functional Genomics doctoral fellowship to S.K.
Poster presented at: 1. Society for the Study of Reproduction Annual Meeting, Milwaukee, Wisconsin, August 2010. Generation of putative induced pluripotent stem cells (iPS) from adult canine fibroblast by 3 factor reprogramming (Klf4, Oct4, and Sox2). 2. Society for the Study of Reproduction Annual Meeting, Portland, Oregon, August 2011. Generation of induced pluripotent stem cells (iPSCs) from adult canine fibroblasts. 3. International Congress on Animal Reproduction (ICAR), Vancouver, British Columbia, Canada, July 2012. Generation and characterization of induced pluripotent stem cells from adult canine fibroblasts.
Author Disclosure Statement
The authors indicate no potential conflicts of interest.
References
Supplementary Material
Please find the following supplemental material available below.
For Open Access articles published under a Creative Commons License, all supplemental material carries the same license as the article it is associated with.
For non-Open Access articles published, all supplemental material carries a non-exclusive license, and permission requests for re-use of supplemental material or any part of supplemental material shall be sent directly to the copyright owner as specified in the copyright notice associated with the article.