
Abstract
While chondrogenesis of mesenchymal stem cells (MSCs) in vitro has been extensively studied, their participation in cartilage tissue repair remains unresolved. This study was designed to elucidate if MSCs affect the phenotype of articular chondrocytes (ACs). A combination of noncontact coculture modes was developed. Human or rabbit MSCs and rabbit ACs (rACs) were encapsulated in alginate hydrogel beads [three-dimensional (3D)] or cultured in a monolayer [two-dimensional (2D)] and subsequently cocultured in the Transwell® system. After coculture, cell morphology, growth, deposition of the cartilaginous extracellular matrix (ECM), and gene expression of rACs were investigated. It was found that upon coculture without a cell–cell contact, both 2D and 3D cultured MSCs dramatically induced the morphological transformation of 2D cultured rACs from round to a spindle-like shape, and however inhibited the generation of cellular aggregates of 3D cultured rACs. Most strikingly, a coculture resulted in a significantly less deposition of the cartilaginous ECM, including glycosaminoglycans and collagen type II by both 2D and 3D cultured rACs. Importantly, similar observations were achieved for rACs cultured in an MSC-conditioned medium, confirming the definite paracrine interactions between MSCs and rACs. Based on the analysis of gene expression, this phenotypic change of rACs was not identical as the dedifferentiation. To the best of our knowledge, this is a first study demonstrating that MSCs could downregulate chondrocytic differentiation of ACs and warrants considerations in cartilage tissue repair.
Introduction
In contrast to chondrocytes, mesenchymal stem cells (MSCs) can differentiate toward the osteogenic, chondrogenic, and adipogenic lineages and have the ability to proliferate in vitro while retaining their multilineage differentiation [4]. Importantly, MSCs have been successfully identified in various tissues, including bone marrow and adipose tissue, and thus represent a highly potential cell candidate for cartilage tissue regeneration [4,5]. However, there are several issues concerning the current protocols of inducing the in vitro chondrogenesis of MSCs through supplementing transforming growth factor-β (TGF-β) [4,6]. First, the capability of MSC-derived chondrocytes to synthesize the cartilaginous extracellular matrix (ECM) is inferior compared to native articular chondrocytes (ACs), which leads to unfavorable cartilage tissue repair in vivo [7]. Second, the chondrogenesis of MSCs has been considered reminiscent to the developmental process of endochondral bone [8,9]. Using current chondrogenic induction protocols, hypertrophic differentiation of MSCs has been well documented, which results in calcified tissues instead of hyaline cartilage [8,10 –13].
Recently, coculture has been adopted with the expectation to overcome the disadvantages associated with both MSCs and chondrocytes [14]. In coculture conditions, MSCs and chondrocytes may interact with each other through paracrine factors and/or direct physical contact [15]. Studies have demonstrated that chondrocytes are able to improve the chondrogenesis of MSCs by either promoting their differentiation efficacy or retaining a hyaline chondrocytic phenotype [16 –19]. In studies using mixed-pellet cocultures, MSCs might be able to stimulate both proliferation and matrix deposition of chondrocytes, thus contributing to cartilage tissue formation [20 –22]. However, Giovannini et al. found that the pellet coculture of MSCs and ACs did not induce any additional beneficial effects on the chondrogenesis [23]. These conflicting reports suggest that the interactions between MSCs and chondrocytes are far more complicated than initially thought.
It is well known that MSCs secrete trophic factors that exert chemotactic, mitotic, and differentiation-modulating effects [24]. This effect has been interpreted as a major mechanism of MSCs to participate in tissue repair [25]. However, whether the trophic effects of MSCs can influence ACs remains largely unexplored. Most previous studies were performed in coculture conditions with a cell–cell contact [20 –22,26], making it difficult to separate trophic effects from the cell–cell contact effects [27]. Additionally, apoptosis of MSCs occurs in pellet cocultures under chondrogenic induction conditions, further confounding the interactions [20,22].
In the present study, 4 different noncontact coculture modes using the Transwell® system to separate the 2 types of cells were developed to investigate how MSCs affect the phenotype of chondrocytes. Both MSCs and ACs were either cultured as a monolayer [two-dimensional (2D)] or encapsulated in alginate hydrogel beads [three-dimensional (3D)] (Fig. 1). After coculture treatments, the chondrocytic phenotype of ACs was investigated systemically, in terms of cell morphology, growth, the deposition of the cartilaginous ECM, and gene expression.
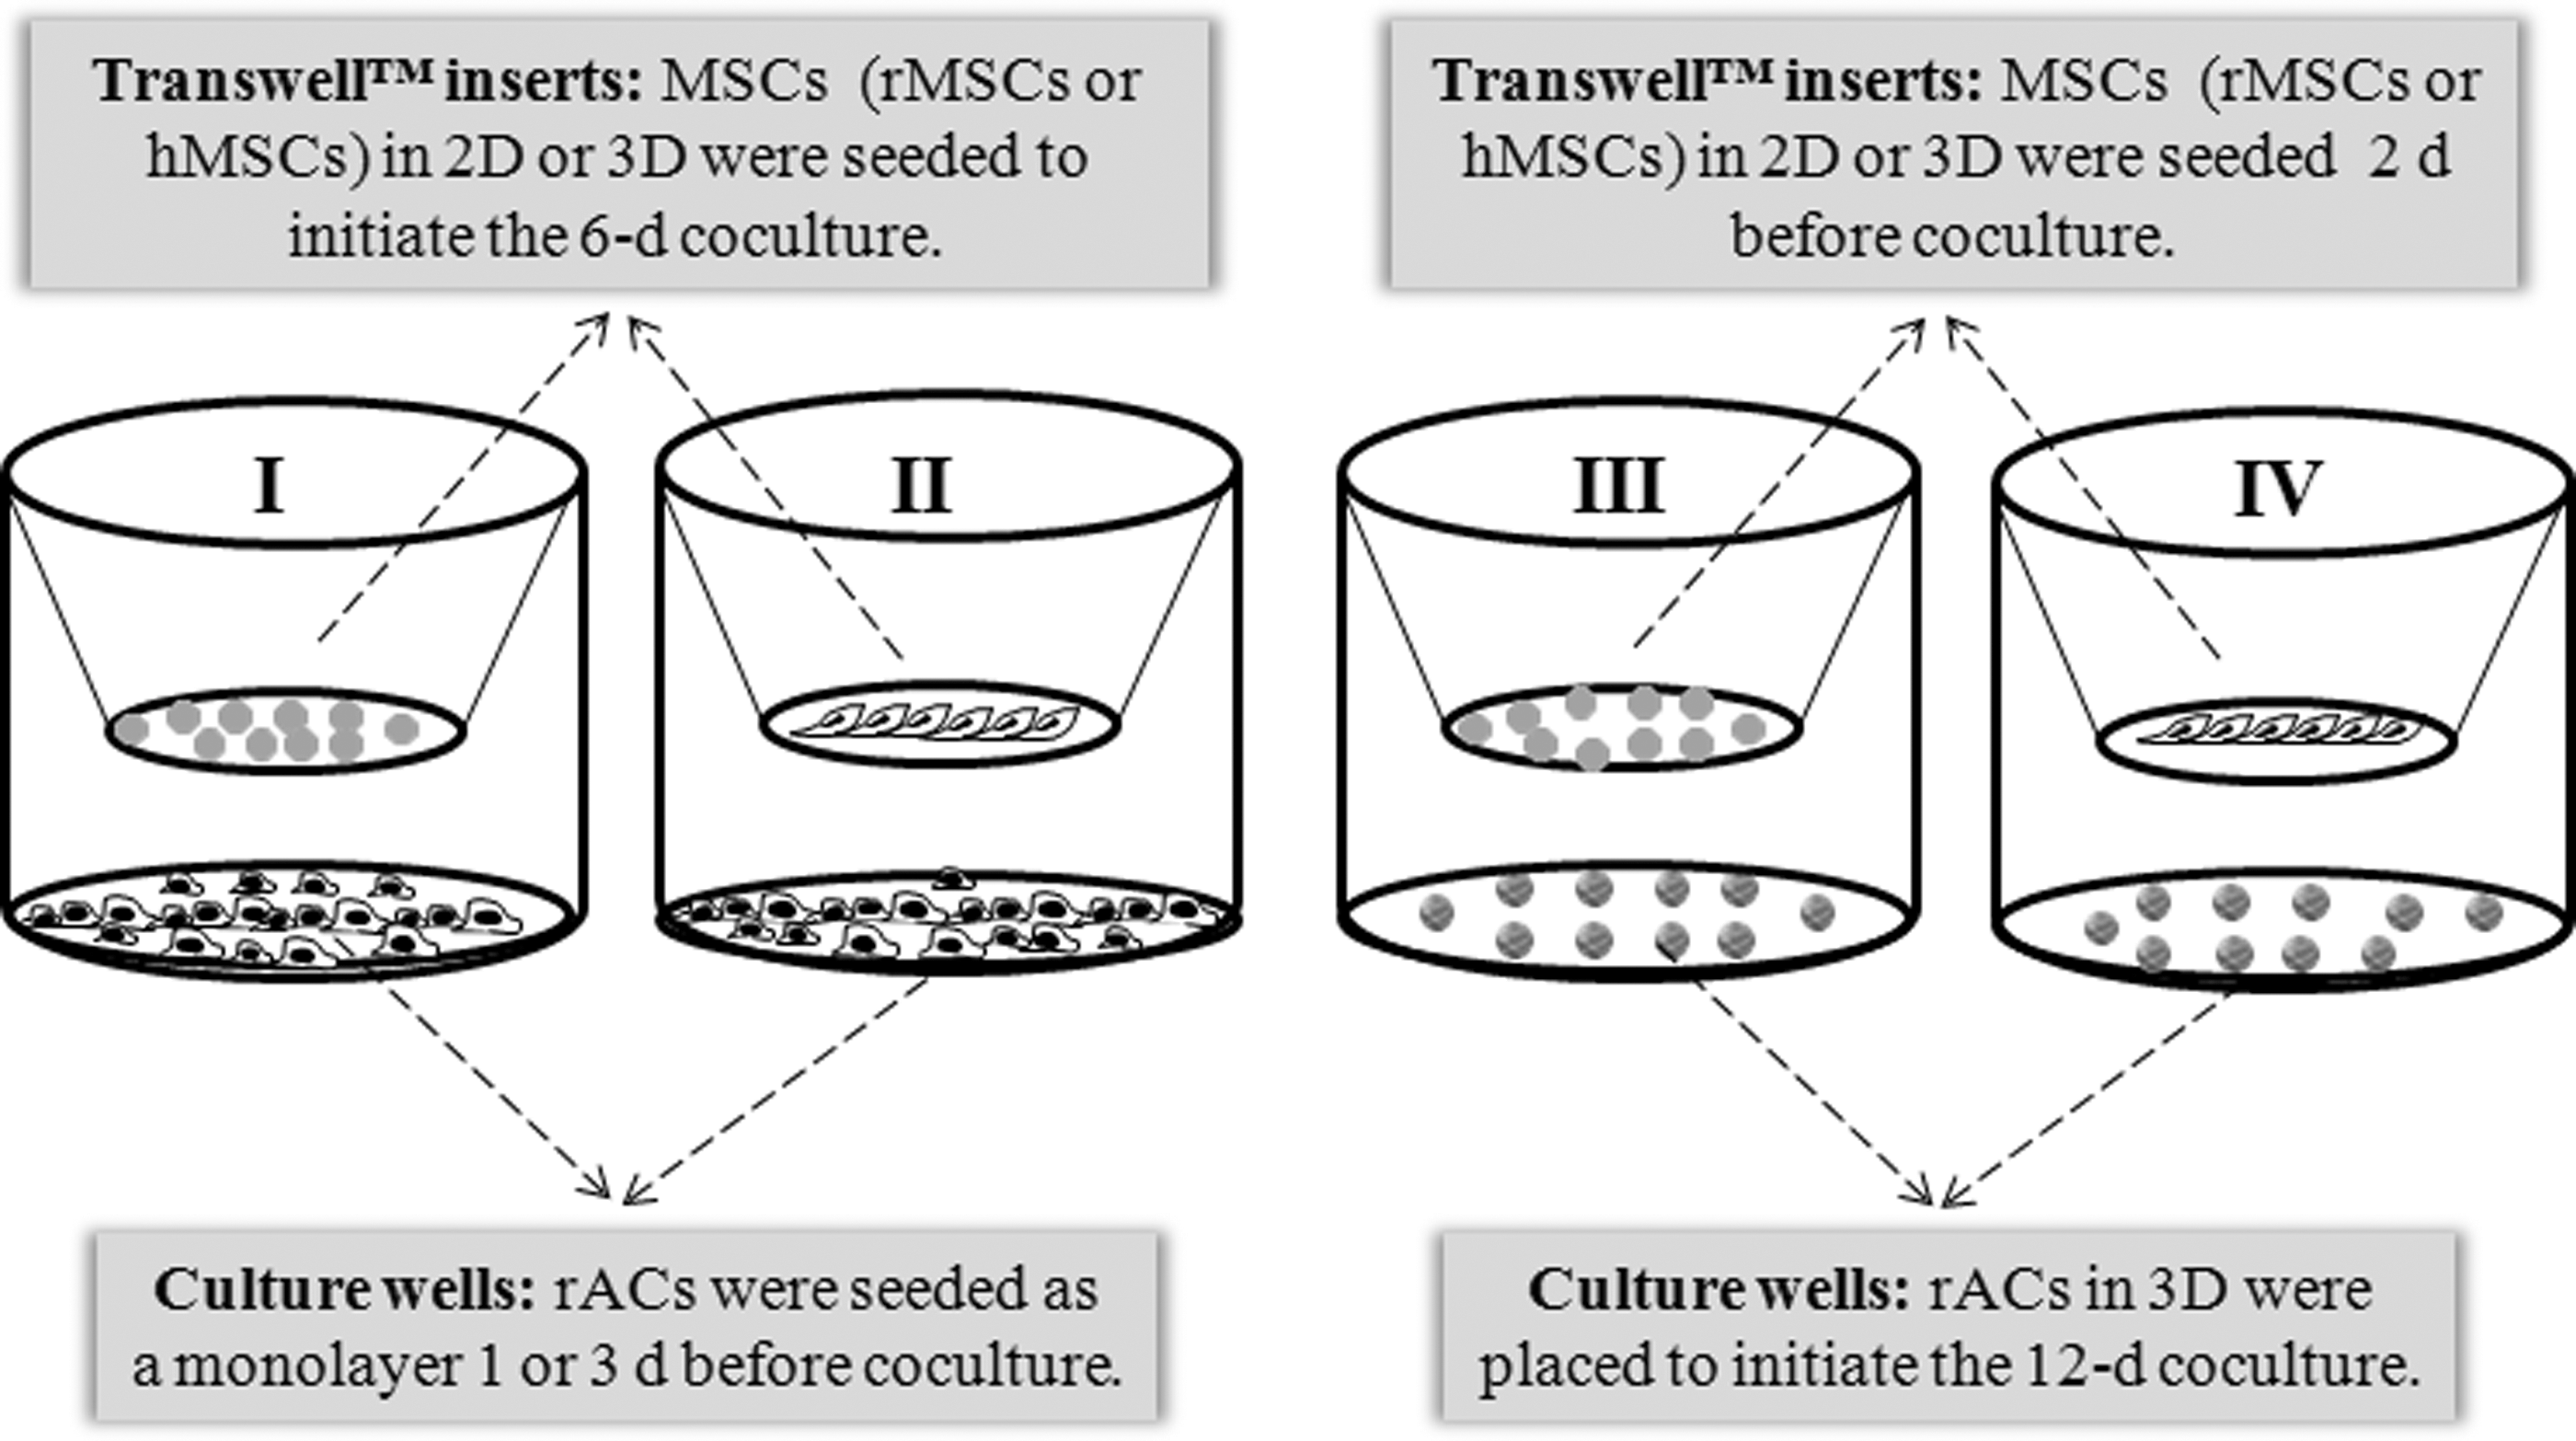
Schematic illustration of the 4 noncontact coculture modes. Rabbit articular chondrocytes (rACs) in monolayer (culture wells) were cocultured with mesenchymal stem cell (MSC)-laden alginate beads (Transwell™ inserts)
Materials and Methods
Isolation and culture of chondrocytes and MSCs
Cells were isolated from 10 New Zealand white rabbits aged 2–3 months. To isolate rabbit ACs (rACs), cartilage tissue slices from knee joints were briefly treated with 0.25% trypsin/ethylenediaminetetraacticacid (EDTA; Gibco) followed by 0.1% collagenase type II (200 U/mg; Invitrogen) in a high-glucose Dulbecco's modified Eagle's medium (DMEM; Gibco) for 5–6 h at 37°C. Enzymatically released rACs (passage 0, P0) were either frozen in liquid nitrogen or plated at a cell density of 1×10⁴ cells/cm2 in a chondrocyte growth medium, which consisted of a high-glucose DMEM, 10% fetal bovine serum (FBS; HyClone), 0.1 mM nonessential amino acids (Invitrogen), 0.4 mM proline (Invitrogen), 0.05 mg/mL vitamin C (Invitrogen), 100 U/mL penicillin (Invitrogen), and 100 U/mL streptomycin (Invitrogen) at 37°C in 5% CO2. In all experiments, passage 1 (P1) rACs were used.
Rabbit MSCs (rMSCs) were harvested from the femoral and tibial bone marrow of New Zealand white rabbits and purified using a density-gradient method [16,28]. Mononuclear cells were seeded at a density of 1×10⁵ cells/cm2 in an α-minimum essential medium (α-MEM; Gibco) containing 10% FBS, 100 U/mL penicillin, and 100 U/mL streptomycin. Cells were subcultured at 5×10³ cells/cm2. In the present study, P3 MSCs were used in all experiments and analyzed using flow cytometry for surface markers of MSCs, showing positive for CD29 and CD44 and negative for CD14, CD45 and CD90 (data not shown), which was found consistent with the literature [29]. In the present study, human MSCs (hMSCs; P3) were also included in some experiments for a comparison. These cells were isolated from the human amniotic membranes and maintained as described previously [30]. It has been recognized that MSCs derived from the amniotic membranes have superior biological properties such as improved proliferative capacity, life span, and differentiation potential compared to MSCs derived from adult sources [31].
Preparation of alginate beads encapsulated with rACs and MSCs
To encapsulate rACs (P1) in alginate hydrogel beads, cells were trypsinized, collected, counted using a hematocytometer, and rinsed with phosphate-buffered saline (PBS). Cells were resuspended in 1.25% (w/v) sodium alginate solution (low viscosity; Sigma) in 0.9% saline at a final cell density of 5×10⁵ cells/mL. The alginate/cell suspension was slowly dropped from a 25-gauged syringe needle into a solution of 102 mM CaCl2 and gelled for 15 min to form alginate hydrogel beads. In a similar fashion, both hMSCs (P3) and rMSCs (P3) were encapsulated in alginate hydrogel beads at a cell density of 1×10⁶ cells/mL.
Design of coculture modes
MSCs (rMSCs or hMSCs) and rACs (not necessarily derived from same donor rabbits as rMSCs) were cocultured in a noncontact setting. Since cells were cultured in either a 2D or 3D manner, there were 4 modes of coculture employed, that is, Mode I, II, III, and IV, as illustrated in Fig. 1. In Mode I and II, rACs (P1) were first seeded at a density of 5×10³ cells/cm2 in monolayer (ie, 2D) in 12-well plates. After 1 or 3 days, Transwell inserts (0.4-μm pore size; Corning) were placed in the culture wells. The Transwell inserts contained either MSC-laden alginate beads (rMSCs or hMSCs, 10 beads/well, Mode I) or monolayer MSCs (rMSCs or hMSCs, Mode II) at 2 different densities (2×10⁴ and 5×10⁵ cells/well). The coculture lasted 6 days in the chondrocyte growth medium, and the medium was changed every 2–3 days. In Mode III and IV, rACs were encapsulated in alginate beads, that is, in a 3D manner. Either MSC-laden alginate beads (rMSCs or hMSCs, 10 beads/well, Mode III) or monolayer MSCs (rMSCs or hMSCs, Mode IV) at 2 different densities (2×10⁴ and 5×10⁵ cells/well) were first seeded into the Transwell inserts and cultured in the chondrocyte growth medium. After 2 days, rAC-laden alginate beads were added underneath the inserts (10 beads/well) to start the coculture. The coculture lasted 12 days in the chondrocyte growth medium with a medium change every 2–3 days. At specified time points, rACs in either 2D or 3D were harvested and evaluated.
Culture of rACs in an MSC-derived conditioned medium
P3 hMSCs and P3 rMSCs were plated in a growth medium of an α-MEM with 10% FBS in 150-cm2 flasks. When cells reached 90% confluence, the medium was discarded, and the cells were rinsed with PBS. Forty milliliters of fresh serum-free α-MEM was then added to the cells and further incubated for 48 h. The culture medium was collected and mixed with a fresh chondrocyte growth medium at a 1:2 volume ratio to prepare the conditioned medium (CM).
P1 rACs were seeded in the chondrocyte growth medium at a cell density of 5×10³ cells/cm2 for 1 day. Then, the medium was replaced with the CM and cultured for 6 days with a medium change every other day. P1 rACs cultured in the chondrocyte growth medium for 7 days were used as control.
Histological analysis and immunofluorescence staining
After coculture, the Transwell inserts were removed. The rAC-laden alginate beads were harvested, rinsed with 0.9% saline, fixed in 4% paraformaldehyde, embedded in an OCT™ (Tissue Tek) tissue-freezing medium, and cryosectioned into 8-μm-thick sections. Monolayer-cultured rACs were fixed with 4% paraformaldehyde. Samples were stained with safranin-O (0.1%; Sigma) and Alcian blue (1%; Sigma). F-actin staining was also performed for monolayer-cultured rACs. After fixation with 4% paraformaldehyde, cells were treated with 0.1% Triton X-100 in PBS to permeabilize the cell membrane. A methanolic stock solution of Rhodamine-conjugated phalloidin (200 U/mL; Invitrogen) was diluted in PBS containing 1% bovine serum albumin (BSA) and applied to the cells. The cell nuclei were counterstained with 4′, 6-diamidino-2-phenylindole (DAPI), and the fluorescent images were acquired with a fluorescence microscope (Eclipse Ti-S; Nikon).
For immunofluorescence staining, samples were treated with 3% H2O2, followed by a blocking buffer (1% BSA and 0.25% Triton X-100 in PBS or 0.9% saline). Samples were then incubated with a mouse anti-rabbit collagen II antibody (Calbiochem) at a dilution of 1:100 and further detected using a fluorescein isothiocyanate-conjugated goat anti-mouse secondary antibody (1:200 dilution; Invitrogen). The nuclei were counterstained with DAPI, and the fluorescent images were obtained with the fluorescence microscope.
Live/dead assay
Harvested cell-laden alginate beads were rinsed with 0.9% saline and then incubated in 1 mL of DMEM containing 2 μM calcein acetoxymethylester (calcein AM) (Sigma) and 2 μM propidium iodide (Sigma) at 37°C for 30 min. Fluorescent images were acquired with a fluorescence microscope. Dead cells were stained red, whereas the viable cells stained green.
Biochemical assays
To determine the number of cells in Mode I and II, rACs in the monolayer were harvested with trypsin digestion and counted with a hemocytometer. In Mode III and IV, the cellular activity in alginate beads was assessed using the 3-(4, 5-dimethylthiazol-2-yl)-2, 5-diphenyltetrazolium bromide (MTT) assay. For each assay, 1 bead was treated with the MTT (0.5 mg/mL; Sigma) solution in the DMEM at 37°C for 4 h in dark. Formazan crystals were extracted with dimethyl sulfoxide. The absorbance was read at 490 nm using a microplate reader (ELx 800; Bio-Tek Instruments). To measure the contents of DNA and glycosaminoglycan (GAG), monolayer-cultured rACs or cell-laden beads (3–4 beads for each assay) were digested with the papain solution [125 μg/mL papain (Sigma), 5 mM
Reverse transcriptase–polymerase chain reaction and quantitative reverse transcriptase–polymerase chain reaction
Thirty cell-laden alginate beads were digested with a sodium citrate solution (55 mM) to release rACs. Total RNA of monolayer cultures or rACs recovered from the alginate beads was extracted using the TRIzol® reagent (Invitrogen) following the manufacture's protocol. One microgram of total RNA was reverse transcribed into cDNA. Premix Taq® Version 2.0 (Takara) was used for reverse transcriptase–polymerase chain reaction (RT-PCR), and the PCR products were analyzed using 2% agarose gel electrophoresis. The Brilliant III Ultra-Fast SYBR® Green QPCR Master Mix (Agilent Technologies) was used for quantitative RT-PCR (qRT-PCR) on an Mx3000P™ real-time PCR system (Stratagene). The expression of collagen II, aggrecan, collagen I, versican, CD14, and CD90 was analyzed. GAPDH was used as housekeeping gene. Specific PCR primers used in RT-PCR and qRT-PCR are listed in Supplementary Tables S1 and S2 (Supplementary Data are available online at
Statistical analysis
All values are reported as mean±standard deviation (n=4). Statistical differences were determined using a 2-tailed, unpaired Student's t-test. Significance was determined at P<0.05.
Results
rACs in coculture Mode I
In coculture Mode I, rACs were maintained as a monolayer in culture wells, and MSC-laden alginate beads were placed in the Transwell inserts. The duration of coculture was 6 days. However, before coculture, rACs were cultured for either 1 or 3 days, resulting in the whole culture period for rACs as 7 or 9 days. In Fig. 2A, compared to monoculture (ie, without coculture treatment), rACs cocultured with rMSC-laden beads changed their morphology from a round to a spindle-like shape, which could be observed under bright field. F-actin staining further confirmed the morphological change. As shown in Fig. 2B, F-actin filaments of monoculture cells were randomly distributed around the cell nuclei, while they were arranged in parallel in coculture with the rMSC-laden beads. In addition, the alignment of F-actin was similar for rACs precultured for both 1 and 3 days in coculture, and rACs cocultured with hMSC-laden beads demonstrated a similar morphological change (Fig. 2B).
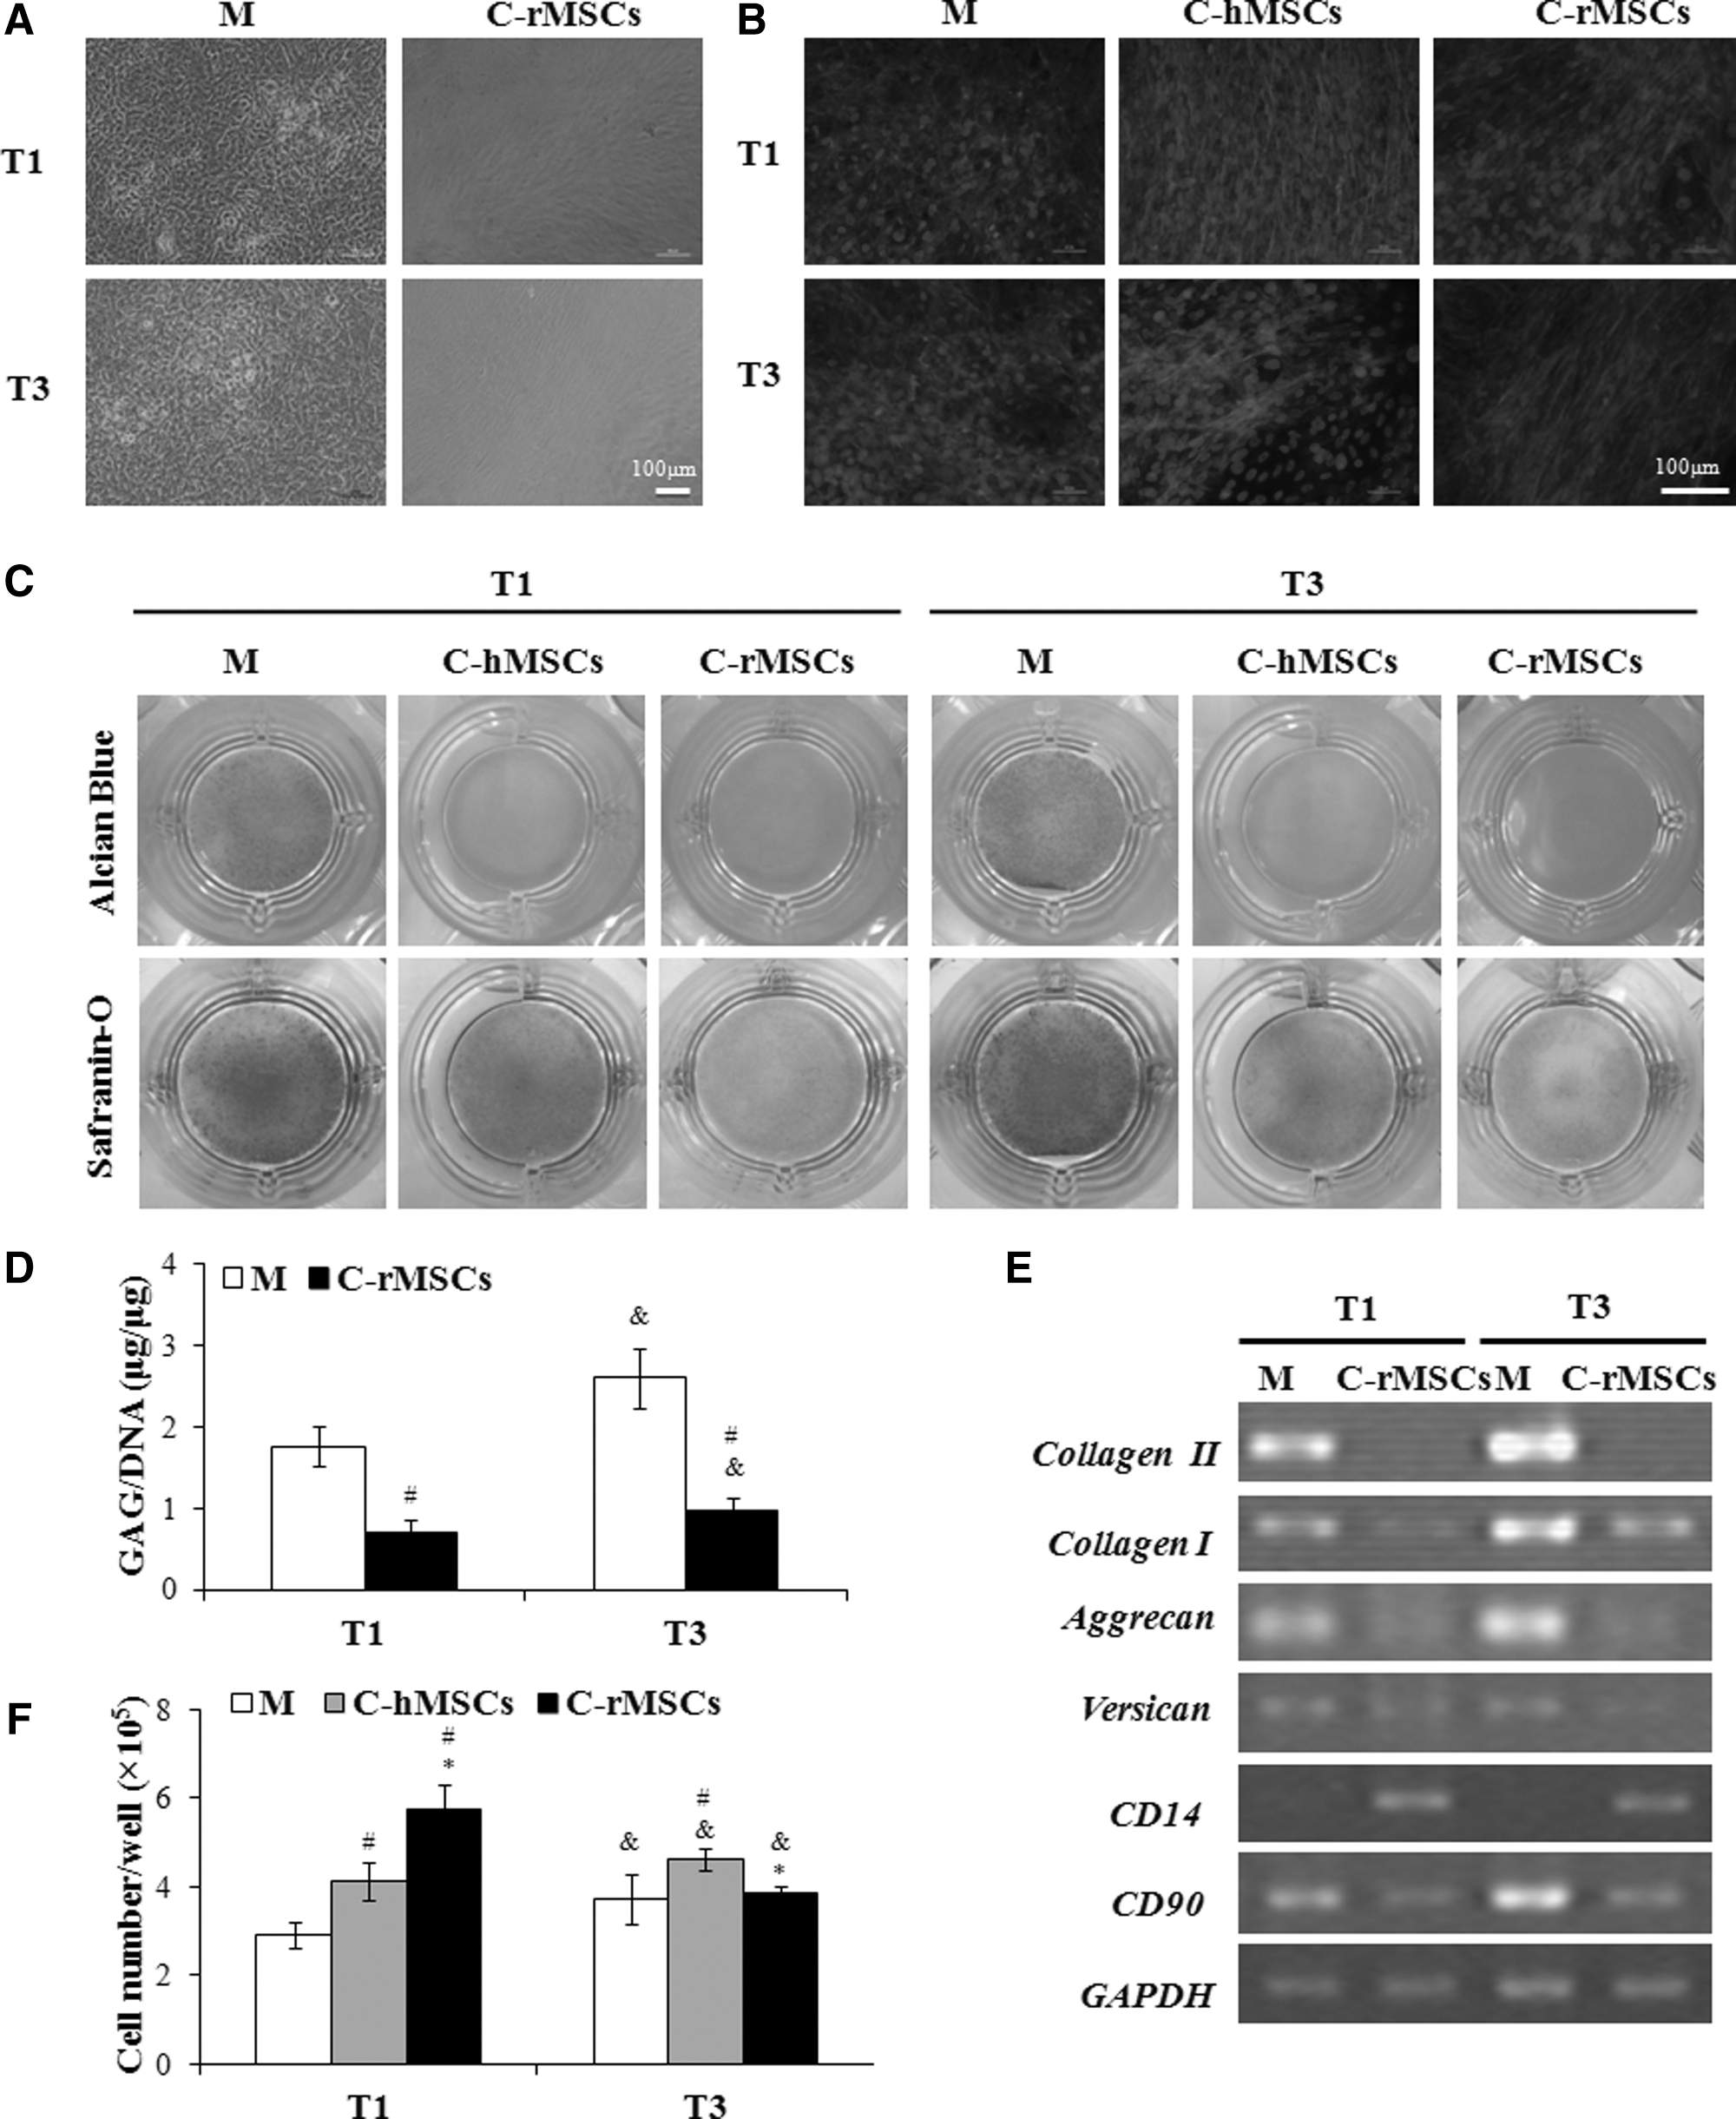
Morphology, glycosaminoglycan (GAG) production, gene expression, and growth of rACs in coculture Mode I. At the end of coculture, rACs were observed under a phase-contrast microscope
The deposition of proteoglycans by rACs was detected using both Alcian blue and Safranin-O staining. In the monoculture, P1 rACs showed strong positive staining, suggesting abundant production of proteoglycans; staining was slightly more intense for cells precultured for 3 days than that of 1-day precultured cells due to a longer culture time (9 vs. 7 days of the total culture time, Fig. 2C). In contrast, when rACs were cocultured with MSC-laden alginate beads (both rMSCs and hMSCs), only faint staining of both dyes regardless of preculture time was observed, suggesting the diminished deposition of proteoglycans (Fig. 2C). Additionally, the Safranin-O staining intensity was slightly stronger for rACs cocultured with hMSC-laden beads than that with the rMSC-laden beads, indicating a less inhibitory effect of hMSCs on rACs. Quantification of GAG content (GAG/DNA) in rACs cocultured with the rMSC-laden alginate beads showed declined GAG production upon coculture (P<0.05, Fig. 2D), confirming the histological staining results. Further, for rACs precultured for both 1 and 3 days, upon coculture with the rMSC-laden alginate beads, gene expression of collagen II, collagen I, aggrecan, versican, and CD90 was dramatically downregulated, and only CD14 was apparently upregulated (Fig. 2E).
At the end of culturing monocultured rACs precultured for 1 day, the cell number was 2.9×10⁵ cells (Fig. 2F). The cell number was significantly increased to 4.1×10⁵ (P<0.05) and 5.8×10⁵ cells/well (P<0.05) when cocultured with hMSC- and rMSC-laden alginate beads, respectively. For cells of 3-day precultured, the cell number was slightly increased from 3.7×10⁵ cells/well in a monoculture to 4.6×10⁵ cells/well in a coculture with the hMSC-laden beads (P<0.05). There was no significant increase when cocultured with the rMSC-laden beads.
rACs in coculture Mode II
In Mode II, rACs were in the monolayer and cocultured with MSCs seeded in the Transwell inserts (2D) at 2 different densities, 2×10⁴ and 5×10⁵ cells/well, respectively. As shown in Fig. 3A, the actin organization changed from random to parallel alignment upon coculture. The phenomenon was less prominent for rACs precultured for 1 day and cocultured with hMSCs at 2×10⁴ cells/well and rMSCs at 5×10⁵ cells/well.
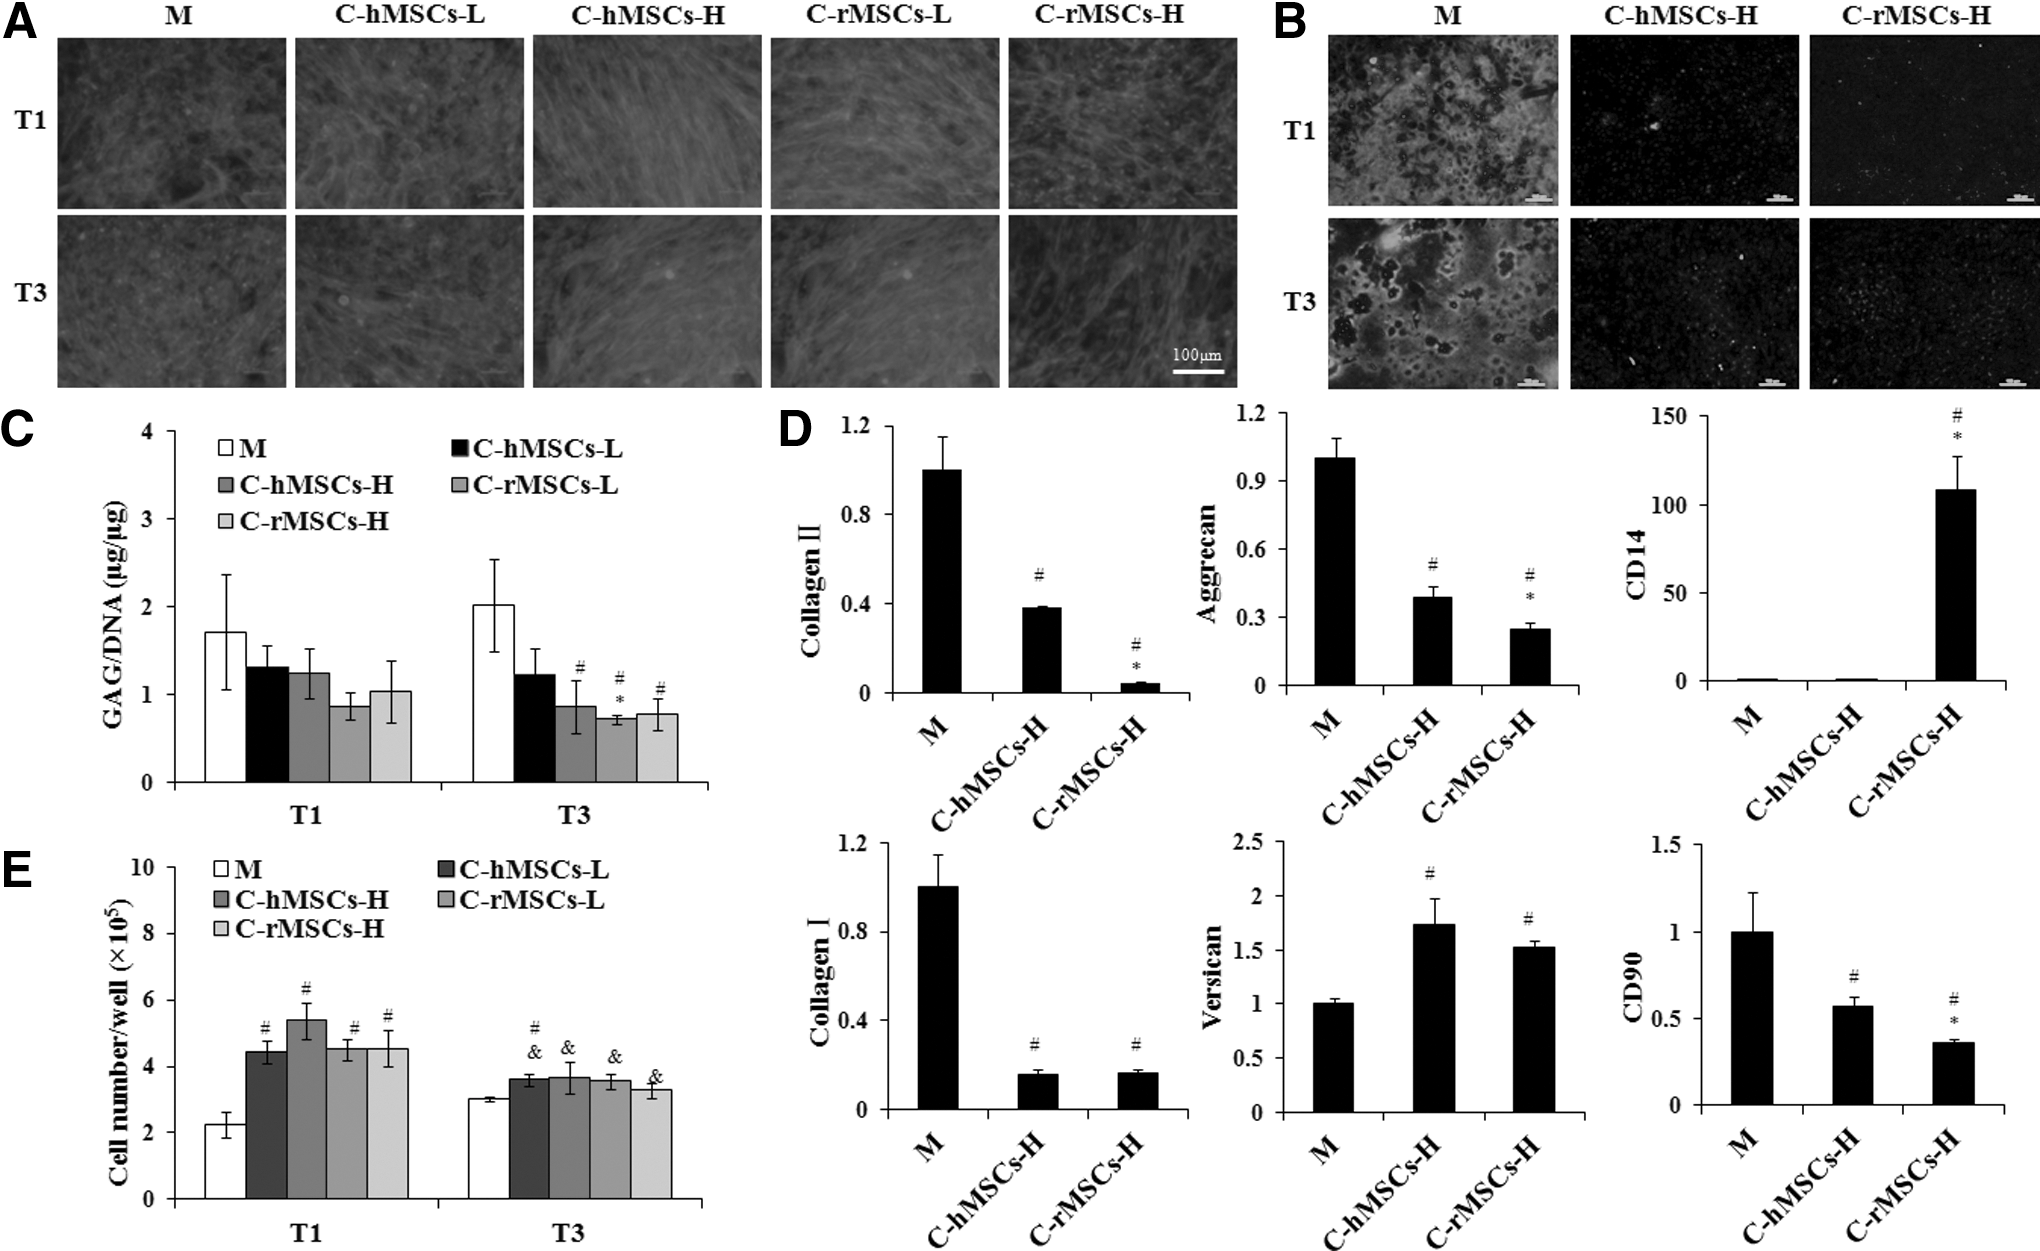
Morphology, growth, GAG production, and gene expression of rACs in coculture Mode II. rACs were subjected to F-actin staining
After 7 or 9 days of culture, monocultured P1 rACs produced a large quantity of collagen type II based on immunofluorescence staining (Fig. 3B). However, faint fluorescence was observed for rACs cocultured with both hMSCs and rMSCs at 5×10⁵ cells/well regardless of the preculture time. In comparison with the monoculture, rACs in the coculture demonstrated decreased staining of both Alcian blue and Safranin-O (Supplementary Fig. S1), however, to different extents with different cell types (hMSCs and rMSCs) and cell densities (2×10⁴ and 5×10⁵ cells/well). At the same cell density, hMSCs showed less inhibition of proteoglycan production compared to rMSCs. The inhibitory effect became stronger for both hMSCs and rMSCs at a higher cell density, indicating a possible dose-dependent effect. Although GAG/DNA was not significantly lower for cocultured rACs than monocultured cells with 1-day preculture, there was a significant decrease in coculture with 3-day preculture, except that coculture with hMSCs at 2×10⁴ cells/well (Fig. 3C).
Gene expression was analyzed for rACs precultured for 3 days and cocultured with MSCs at the high cell density of 5×10⁵ cells/well (Fig. 3D). For collagen I, collagen II, aggrecan, and CD90, significant downregulation was observed in coculture (P<0.05), however, to a lesser extent when cocultured with hMSCs than that with rMSCs (P<0.05). In contrast, rACs in coculture with both hMSCs and rMSCs upregulated versican expression (P<0.05). While the CD14 expression increased by more than 100-fold when rACs were cocultured with rMSCs (P<0.05), no significant difference was detected with hMSCs.
For 1-day preculture, all coculture conditions stimulated cell growth, and the cell number increased by about 2-fold from 2.3×10⁵ cells/well in a monoculture to 4–5×10⁵ cells/well in coculture (P<0.05) (Fig. 3E). However, for a 3-day preculture, there was only a slight increase in the cell number upon coculture with hMSCs at the low cell density (P<0.05).
rACs in coculture Mode III
In Mode III, both rACs and MSCs were cultured in 3D. Most rACs remained viable in the both monoculture and coculture, and the greatest dead staining (red fluorescence) was observed in the coculture with rMSC-laden beads during the 12-day culture period (Fig. 4A). In monoculture, aggregates of rACs gradually formed, while upon coculture, the formation of aggregates decreased, with a greater extent in coculture with the rMSC-laden beads than that with the hMSC-laden beads (Fig. 4A). Alcian blue and Safranin-O staining was weaker in cocultured alginate beads, and coculture with the hMSC-laden beads showed stronger staining than that with the rMSC-laden beads (Fig. 4B). In addition, while in monoculture, strong positive staining of collagen type II was demonstrated, and no green fluorescence was observed at all for rAC-laden alginate beads in coculture (Fig. 4B).
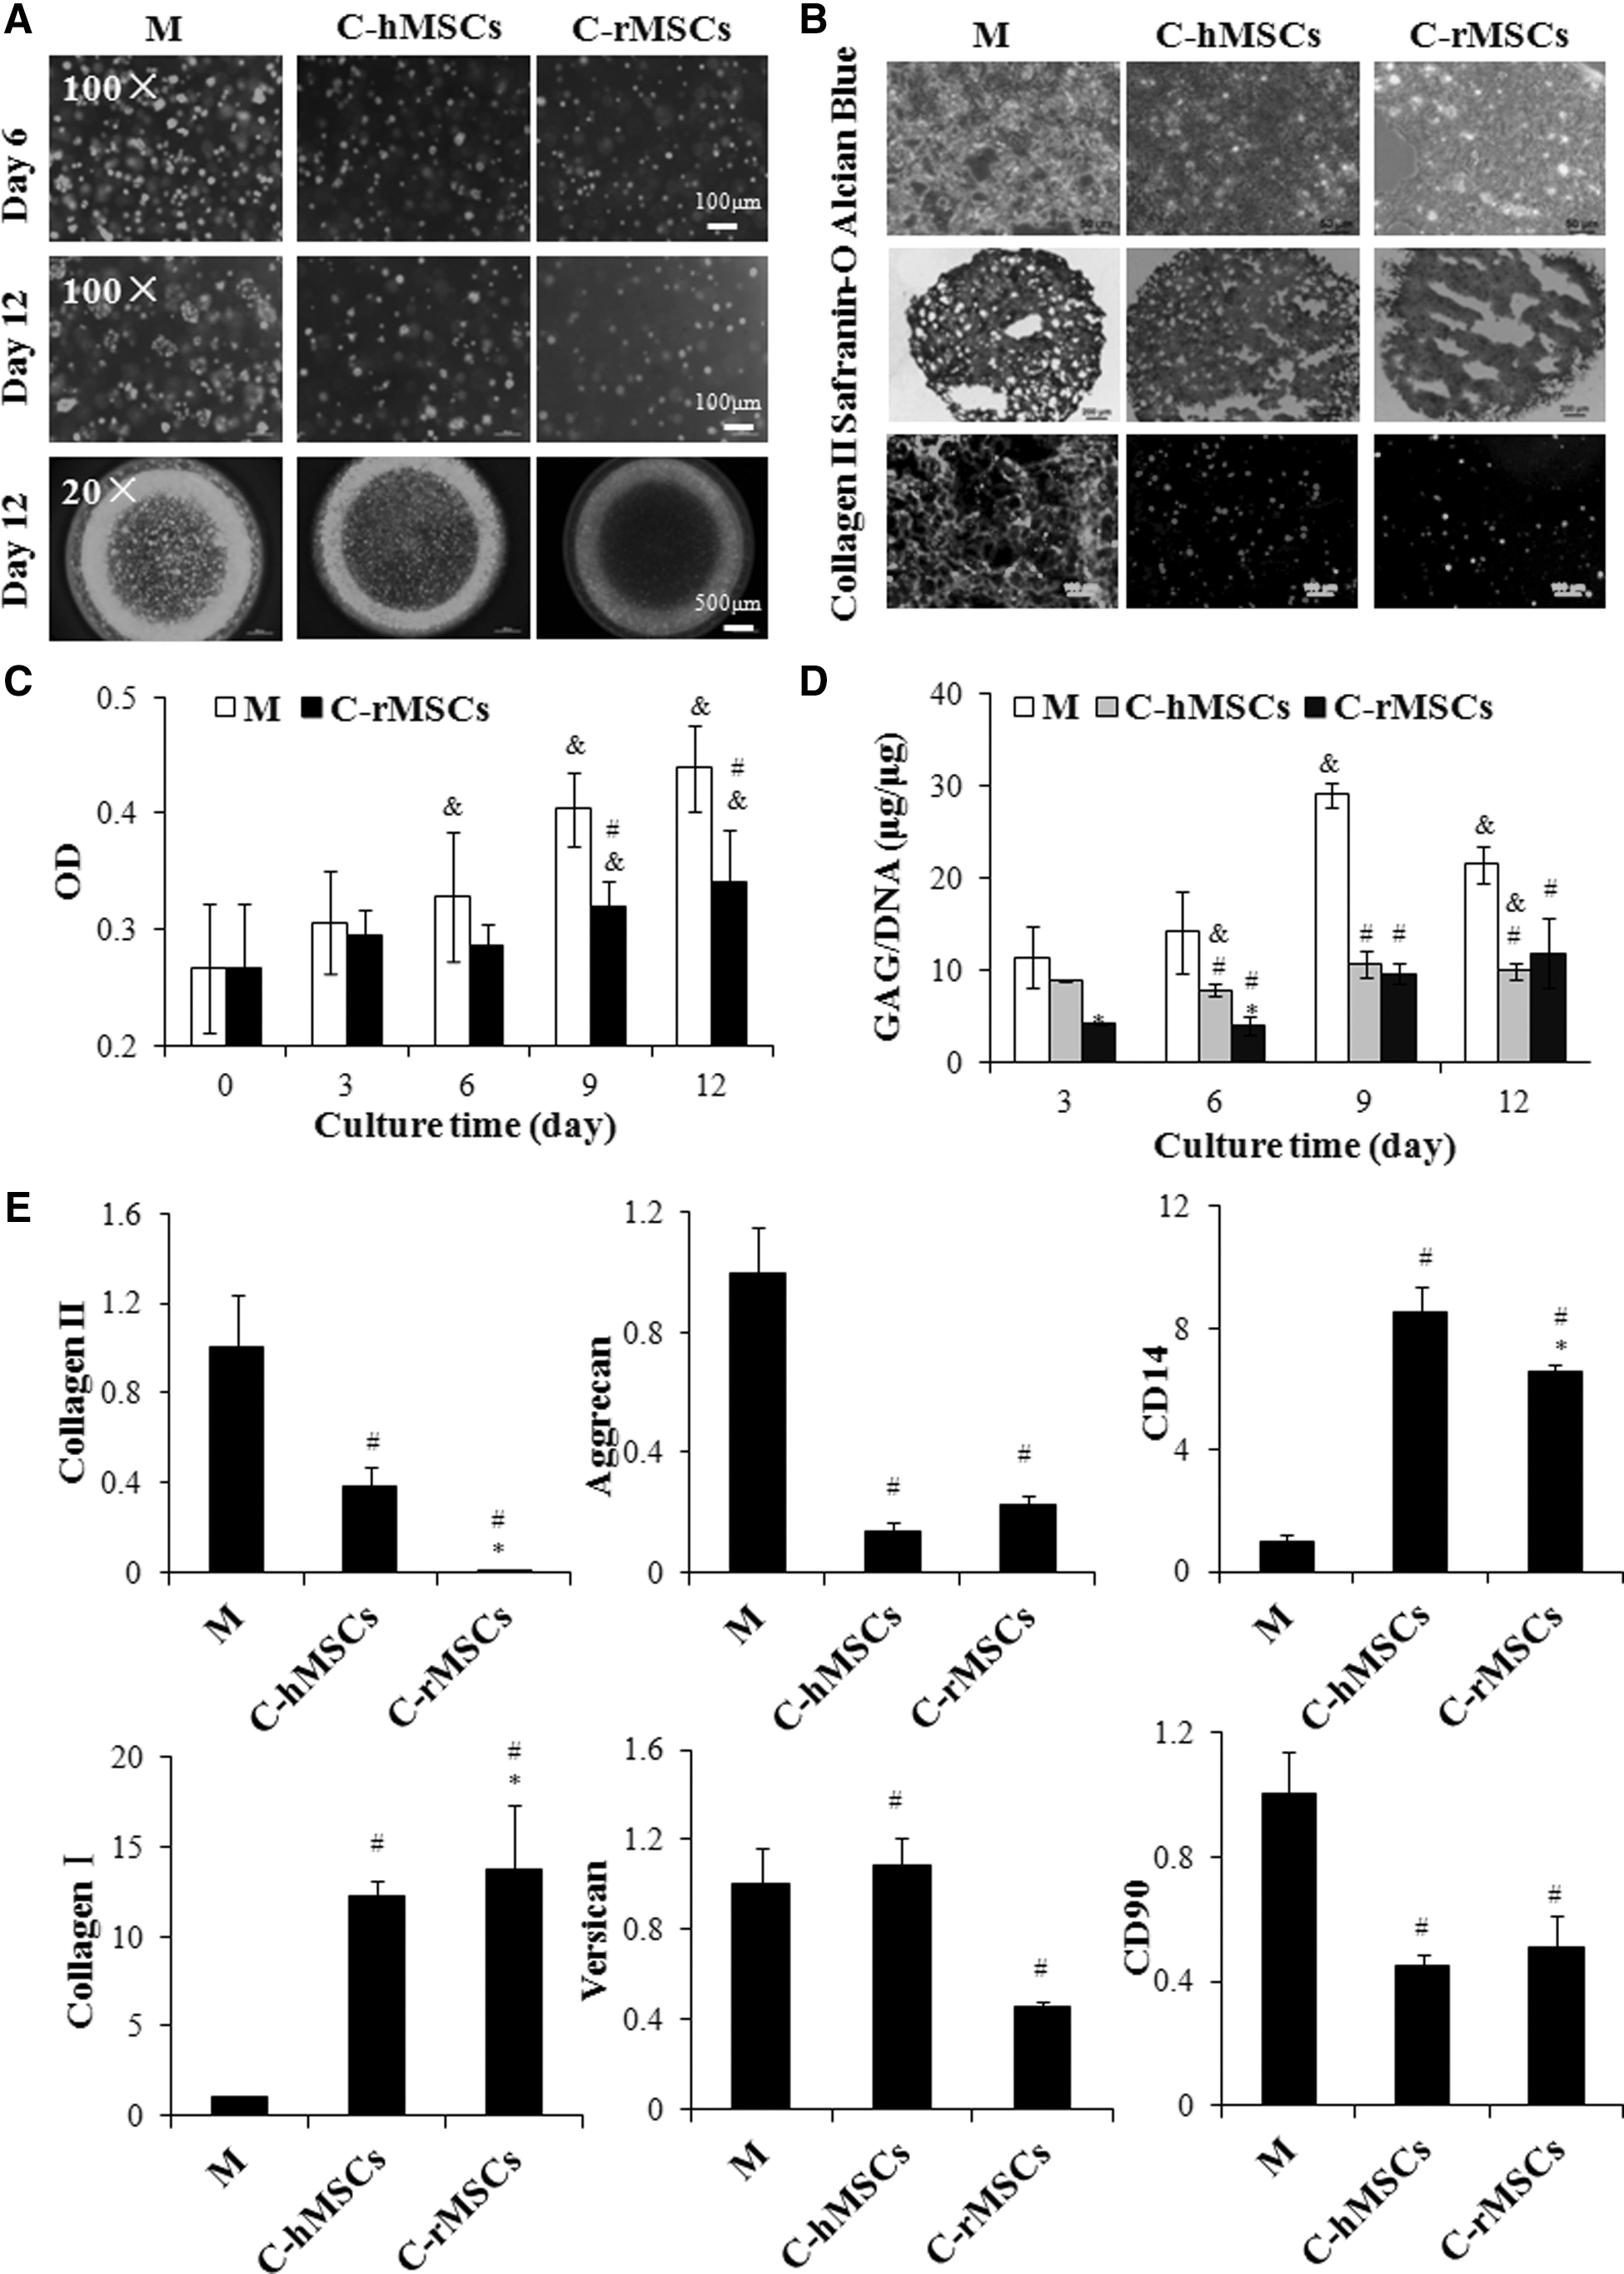
Viability, proliferation, GAG production, and gene expression of rACs in coculture Mode III. rAC-laden alginate beads were stained with live/dead dyes at the indicated time points
Based on the MTT assay, it was found that rACs in the monoculture gradually proliferated within 12 days (Fig. 4C). Although slight proliferation of rACs was noted in coculture with rMSC-laden beads, it was significantly lower than that in monoculture at later time points (P<0.05). Monocultured rACs gradually deposited GAG in alginate beads (Fig. 4D), reaching the highest level of GAG/DNA at 29.0 μg/μg on day 9 and then slightly decreased to 21.4 μg/μg on day 12. However, in coculture with both rMSC- and hMSC-laden beads, GAG deposition by rACs decreased (P<0.05), and GAG/DNA remained at a level of 10.0 μg/μg within 12 days. Gene expression of collagen II, aggrecan, and CD90 was significantly downregulated in coculture with both rMSC- and hMSC-laden beads than that in monoculture (P<0.05) (Fig. 4E). Coculturing with hMSC-laden beads did not significantly change versican expression, while it was downregulated in coculture with rMSC-laden beads (P<0.05). The expression of collagen I and CD14 was increased in both cocultures (P<0.05).
rACs in coculture Mode IV
In Mode IV, MSCs were seeded in a monolayer at 2 different densities, and rACs were maintained in 3D. Live/dead staining revealed that the viable rACs was less in coculture, especially with rMSCs at the high cell density (Supplementary Fig. S2). Additionally, rACs in the monoculture formed aggregates extensively while cellular aggregates were barely noticed in the coculture (Supplementary Fig. S2). In contrast to the slight proliferation of rACs in alginate beads in monoculture within 12 days, coculture significantly inhibited cell proliferation at most time points, resulting in a slight decrease in the cellular activity over time (Fig. 5A). The accumulation of GAG with time was observed in the monoculture and coculture significantly inhibited GAG production at all time points for both hMSCs and rMSCs at both cell densities (P<0.05) (Fig. 5B). Consistently, both Alcian blue staining and Safranin-O staining were weaker in cocultured alginate beads (Supplementary Fig. S3). Collagen II, aggrecan, versican, and CD90 expression was downregulated in coculture (P<0.05), and collagen I and CD14 were upregulated (P<0.05, Fig. 5C).

Proliferation, GAG production, and gene expression of rACs in coculture Mode IV. At indicated time points, the MTT assay was performed to assess cell proliferation
rACs in MSC-derived CM
The MSC-derived CM was applied to culture rACs in a monolayer. In monoculture, P1 rACs were precultured for 1 day in the chondrocyte growth medium, and further maintained in the same medium for 1 day, and cells were found to appear polygonal (Fig. 6A). As positive controls, rACs were also cocultured with MSCs (rMSCs and hMSCs) for only 1 day with 1-day preculture following the same setting as described in Mode II, and it was apparent that a significant number of cells acquired the spindle-like shape. When rACs were precultured for 1 day and then cultured in the CM (both derived from hMSCs and rMSCs) for 1 day, a significant fraction of cells became elongated and spindle-like, as observed in the coculture with MSCs. Additionally, when rACs were cultured in the CM for 6 days after 1-day preculture in the chondrocyte growth medium (7-day culture in total), the actin alignment became apparent compared to those in the chondrocyte growth medium for a period of 7 days, which was consistent with the observations in Mode I and II. The deposition of both proteoglycans and collagen type II was obviously inhibited with the treatment with the CM derived from both rMSCs and hMSCs (Fig. 6A). Further quantification of GAG demonstrated a nonsignificant decrease with the hMSC-derived CM and a significant decrease with the rMSC-derived CM (Fig. 6B).

rACs in an MSC-derived conditioned medium (CM). rACs were subjected to F-actin staining, Safranin-O staining, and immunofluorescence staining for collagen type II
Discussion
This study aimed at unraveling the interactions between the 2 most extensively studied cells in cartilage tissue engineering, MSCs and ACs. Four different coculture modes (Mode I, II, III, and IV) were developed to investigate the effects of MSCs on chondrocytes. MSCs (hMSCs and rMSCs) and rACs in 2D or 3D were cocultured using the Transwell system permitting diffusion of soluble factors between the separated compartments while eliminating the direct cell-cell contact and thus allowed the analysis of paracrine effects. Three-dimensional cultures have been considered advantageous in promoting chondrogenesis [35]. Alginate hydrogels are extensively exploited for 3D cultures [36,37] and are therefore employed in the present study. By applying the noncontact coculture methods, the modulatory effects of MSCs on ACs were successfully demonstrated.
Coculturing of MSCs and chondrocytes is thought to be a promising method to generate hyaline cartilage tissue [14]. However, conflicting results have accumulated regarding whether enhanced chondrogenesis can be achieved with mixed-cell culturing, suggesting the necessity of understanding the exact interactions between MSCs and ACs [16,18,22,23]. On one hand, ACs have been demonstrated to secrete parathyroid hormone-related protein and TGF-β, which are implicated in improving the chondrogenic differentiation of MSCs [16,18]. Nonetheless, how ACs instruct the chondrogenesis of MSCs is still actively sought [19]. On the other hand, whether MSCs can exert an active influence on ACs remains unresolved, although several studies have implicated that MSCs might be able to stimulate proliferation and differentiation of ACs in a contact coculture [20 –22,26].
The cell morphology represents an important characteristic of ACs where a rounded shape is indicative of a chondrocytic phenotype [38]. In this study, monocultured P1 rACs in 2D appeared rounded. The morphology of rACs cocultured with MSCs, both in 2D (Mode I) and 3D (Mode II), exhibited an elongated, spindle-like shape with cell alignment. For rACs precultured for 1 or 3 days, a similar morphological change was observed, confirming that such a change was not affected by cell adhesion. In Mode III and IV, rACs encapsulated in alginate beads maintained a round morphology in both the monoculture and coculture conditions, as reported in previous literature [39]. It was worth pointing out that rACs formed clusters in alginate beads in monoculture, which diminished in coculture with 2D and 3D MSCs (Mode III and IV, respectively). Aggregates of chondrocytes in a 3D hydrogel have been observed by others and are considered pertinent to chondrocytic differentiation [40 –42]. Additionally, cadherin 11-mediated cell–cell junctions are involved in cell condensation, which is a prerequisite for chondrogenesis [41]. In the present study, the compromised aggregate formation in coculture coincided with downregulation of cadherin 11 expression (Supplementary Fig. S4), suggesting a downregulated chondrocytic phenotype of rACs in coculture with MSCs.
The primary function of ACs in cartilage tissue is to synthesize the cartilaginous ECM. Monocultured P1 rACs actively deposited both GAG and collagen type II. rACs in 3D achieved better chondrogenesis based on the quantification of GAG (10–30 μg/μg in 3D versus ∼2 μg/μg of GAG/DNA in 2D, P<0.05), suggesting that alginate encapsulation favors chondrogenesis. Interestingly, in all 4 coculture modes, the production of the cartilaginous ECM was dramatically inhibited. In line with this, collagen II and aggrecan gene expression declined in rACs upon coculture compared to that in monoculture. This was opposed to the finding reported by Wu et al., where MSCs promoted chondrogenesis of chondrocytes, however, in a mixed-pellet coculture with the cell–cell contact [22]. Most importantly, the MSC-derived CM demonstrated similar effects on rACs in both inducing morphological change and inhibiting the production of the cartilaginous ECM as MSCs did. Therefore, MSCs downregulated the chondrocytic phenotype of rACs exclusively via secreted factors.
It is well known that chondrocytes undergo a phenotypic change upon ex vivo expansion, the so-called dedifferentiation, which has been defined in terms of morphology, ECM production, and genetic profile and takes about 4 passages of expansion to gain a permanent phenotypic loss [38,43]. During ex vitro expansion, rACs became apparently dedifferentiated after P3 (Supplementary Fig. S5). However, upon coculture, the phenotypic loss of rACs was seen at P1. The ratios of expression of collagen II/collagen I and aggrecan/versican are well established as the indices of chondrocyte differentiation, with the decrease in collagen II and aggrecan expression and increase in collagen I and versican expression after dedifferentiation [6,44]. Distinct from the dedifferentiation process, wherein collagen I expression was upregulated (Supplementary Fig. S5) [45], gene expression of collagen I was downregulated in 2D cultured rACs upon coculture in Mode I and II, although it was upregulated in 3D cultured rACs upon coculture in Mode III and IV. The difference in collagen I expression of rACs in 2D and 3D upon coculture suggested that culture conditions played important roles in the phenotype of chondrocytes. Except that in Mode II, the expression profile of versican in coculture (Mode I, III, and IV) was also not upregulated as in dedifferentiation (Supplementary Fig. S5) [45]. In addition, Diaz-Romero et al. have had successfully established that the CD14/CD90 expression ratio can also be used as an index for human chondrocyte differentiation, where a decrease in the ratio indicating the dedifferentiation, although the biological functions of both CD14 and CD90 remain unclear [45,46]. Similarly, the dedifferentiation of rACs was also associated with upregulation of CD90, while CD14 expression remained steady (Supplementary Fig. S5). In contrast, in all 4 cocultures except for Mode II with hMSCs, the upregulation of CD14 and the downregulation of CD90 were consistently observed, suggesting the difference between rACs upon coculture and the dedifferentiated rACs. Therefore, coculturing MSCs with rACs may not authentically provoke the dedifferentiation process of rACs. Further, while dedifferentiated rACs gradually became less proliferative (data not shown), coculture in Mode I and II appeared to stimulate their proliferation. Instead, the growth inhibition observed in coculture Mode III and IV may indicate that rACs have transformed into an anchorage-dependent cell type, incapable of thriving in the alginate hydrogel [47].
It is recognized that MSCs are able of secreting a broad range of bioactive factors that enhance cell viability, proliferation, and induce tissue repair/regeneration [24]. In one study, the repair of fibrocartilage meniscus by directly injecting undifferentiated MSCs was postulated to be due to their trophic effects [48]. Thus far, direct evidence supporting that the trophic factors released by MSCs can stimulate a chondrocytic phenotype has not been achieved yet. MSCs have been implicated to encourage chondrogenesis of the nucleus pulposus cells in a cell–cell contact coculture [27]. Additionally, Wu et al. reported that increased GAG production in mixed-cell pellets was partially due to the increased proliferation of chondrocytes stimulated by MSCs [22]. In contrast, Acharya et al. found no paracrine interaction between MSCs and ACs in a noncontact coculture [20]. MSCs in our study did promote the proliferation of 2D cultured rACs in the noncontact mode (Mode I and II). However, in our work, a chondrocyte growth medium was used, in contrast to a chondrogenic induction medium supplemented with TGF-β in the work by Acharya et al. [20], which may explain the differences observed. It should be noted that both hMSCs and rMSCs downregulated the phenotype of rACs in a similar fashion, suggesting a common property of MSCs. However, hMSCs were less efficient at downregulating the chondrocytic phenotype, which was possibly due to a lower trophic secretion capacity compared to rMSCs. Slightly stronger effects were observed with a higher cell density, suggesting a dose dependence of this modulatory effect of MSCs on rACs. As this dose effect was not very pronounced with the 2 cell densities of MSCs applied in this study, it warrants future exploration. Collectively, our studies represent a first report demonstrating that paracrine secretion of MSCs negatively modulates the phenotype of chondrocytes under a nonchondrogenic condition.
In conclusion, when rACs were cocultured with MSCs (both hMSCs and rMSCs), MSCs were able to dramatically downregulate the phenotype of rACs via a paracrine effect. Although the secretome of MSCs was not studied in the present study, among various soluble factors potentially secreted by MSCs [49], interleukin-6 was previously reported to downregulate the biosynthesis of the cartilaginous ECM by chondrocytes [50,51]. The identification of secreted factors by MSCs may further provide some evidence to discover the true identity of cocultured rACs. Additionally, these findings remained to be examined in a cell–cell contact coculture condition, mimicking the in vivo environment during tissue repair. Importantly, implantation of undifferentiated MSCs has been studied for cartilage tissue regeneration. The contribution of MSCs to the repair process remains unidentified, but is possibly through chondrogenic differentiation and secretion of antiapoptotic factors, immunomodulatory molecules, as well as chemoattractants [5]. Based on our findings, MSCs may potentially hinder the cartilage repair process. In fact, periosteal explants, often applied in the ACI technology and potentially contain chondrogenic progenitor cells, have been shown to induce chondrocytes to produce collagen I [52]. Of note, several studies had indicated that the interactions between ACs and MSCs depend on the differentiation states of MSCs [53,54], suggesting that preconditioning MSCs to modulate their biology may be advantageous in the cartilage regeneration applications.
Footnotes
Acknowledgments
This research was supported by the National High Technology Research and Development Program of China (863 Program) (2011AA020119), National Special Fund for State Key Laboratory of Bioreactor Engineering (2060204), National Natural Science Foundation of China (31000424, 31170951), SRF for ROCS (SEM) and Natural Science Foundation of Shanghai (10ZR1407100). The authors would like to thank Dr. Jeannine Coburn of Tufts University for her valuable comments of this manuscript.
Author Disclosure Statement
No competing financial interests exist.
References
Supplementary Material
Please find the following supplemental material available below.
For Open Access articles published under a Creative Commons License, all supplemental material carries the same license as the article it is associated with.
For non-Open Access articles published, all supplemental material carries a non-exclusive license, and permission requests for re-use of supplemental material or any part of supplemental material shall be sent directly to the copyright owner as specified in the copyright notice associated with the article.