
Abstract
Mammalian blastocyst formation is characterized by two lineage segregations resulting in the formation of the trophectoderm, the hypoblast, and the epiblast cell lineages. Cell fate determination during these early lineage segregations is associated with changes in the expression of specific transcription factors. In addition to the transcription factor-based control, it has become clear that also microRNAs (miRNAs) play an important role in the post-transcriptional regulation of pluripotency and differentiation. To elucidate the role of miRNAs in early lineage segregation, we compared the miRNA expression in early bovine blastocysts with the more advanced stage of hatched blastocysts. Reverse transcription–quantitative PCR-based miRNA expression profiling revealed eight upregulated miRNAs (miR-127, miR-130a, miR-155, miR-196a, miR-203, miR-28, miR-29c, and miR-376a) and four downregulated miRNAs (miR-135a, miR-218, miR-335, and miR-449b) in hatched blastocysts. Through an integrative analysis of matching miRNA and mRNA expression data, candidate miRNA-mRNA interaction pairs were prioritized for validation. Using an in vitro luciferase reporter assay, we confirmed a direct interaction between miR-218 and CDH2, miR-218 and NANOG, and miR-449b and NOTCH1. By interfering with the FGF signaling pathway, we found functional evidence that miR-218, mainly expressed in the inner cell mass, regulates the NANOG expression in the bovine blastocyst in response to FGF signaling. The results of this study expand our knowledge about the miRNA signature of the bovine blastocyst and of the interactions between miRNAs and cell fate regulating transcription factors.
Introduction
M
Cell fate determination during these early lineage segregations is associated with changes in transcriptional profiles. The expression of specific transcription factors during embryo development is quite well investigated, and several of them, such as POU5F1 (better known as OCT4), SOX2, CDX2, NANOG, and GATA6, are known as regulators of pluripotency or differentiation [3 –6]. In addition to the transcription factor-based control, it has become clear that also microRNAs (miRNAs) play an important role in the post-transcriptional regulation of pluripotency and differentiation. A global regulatory network is currently emerging based on the dynamic interplay between epigenetic modifications, transcription factors, and miRNAs [7,8].
MiRNAs are endogenous noncoding RNAs of around 22 nucleotides. They are believed to regulate more than one third of all protein coding genes through at least two distinct mechanisms: mRNA degradation and mRNA translational repression [9]. Most miRNAs are highly conserved between invertebrates and vertebrates, suggesting evolutionary conserved functions. Recent studies in mice have revealed that miRNA levels undergo dynamic changes during preimplantation embryo development [10 –13] and that miRNAs play essential roles in gene regulation during early development and the biogenesis of stem cells and cancer cells [14 –16].
The essential roles of miRNAs in the control of pluripotency were established by the findings that embryonic stem cells (ESCs) lacking proteins for miRNA biogenesis exhibit defects in proliferation and differentiation and that defects in miRNA biogenesis and processing result in embryonic lethality [17 –20]. Whereas it has been shown that some individual miRNAs, such as lin-4 and let-7 in Caenorhabditis elegans [21,22] and the miR-290 cluster and the miR-302 family in mouse or human ESCs [23,24], are linked to critical developmental processes, the expression, function, and targets of specific miRNAs during early mammalian development remain largely unexplored.
The knowledge of key factors regulating pluripotency and differentiation during preimplantation embryo development is essential to optimize the in vitro embryo production (IVP) protocols and to evaluate the developmental capacity of the IVP embryo. Moreover, ESCs are derived from the pluripotent epiblast cells of the preimplantation blastocyst [25]. Yet, efforts to culture valid bovine ESCs have been ineffective so far. A better characterization of early lineage segregation in cattle is expected to accelerate stem cell research in cattle.
To elucidate the roles of miRNAs in the blastocyst and in early embryonic lineage segregation, miRNA expression was evaluated in early and hatched bovine blastocysts using the human Megaplex stem-loop reverse transcription–quantitative PCR (RT-qPCR) platform. As the vast majority of miRNAs are 100% conserved between human and cattle, this platform enables accurate and comprehensive miRNA expression profiling of bovine samples. Next, the biological role of the miRNAs differentially expressed between early and hatched blastocysts was studied by examining the correlation in expression of predicted miRNA-mRNA pairs. The potential miRNA-mRNA pairs identified through RNA expression analysis and miRNA target prediction were further confirmed using 3′ untranslated region (3′UTR) luciferase-reporter assays. Finally, we focused on the interaction between miR-218 and NANOG. By interfering with the FGF/MAP kinase signaling pathway, the embryonic NANOG mRNA expression was modulated and the effect on the miR-218 expression was analyzed to investigate the functional relationship between miR-218 and NANOG in the embryo.
Materials and Methods
Bovine IVP
All procedures used were in accordance with the guidance principals for care and use of laboratory animals of the Laboratory Animal Ethical Commission of the Ghent University.
Bovine embryos were produced by routine in vitro methods as described by Vandaele et al. [26]. Briefly, bovine cumulus–oocyte complexes (COCs) were aspirated from ovaries collected at a local slaughterhouse. Immature COCs were recovered from the follicular fluid, washed two times in HEPES-TALP, and matured for 22 h in groups of 60 in 500 μL of modified bicarbonate-buffered TCM199 (Gibco BRL, Life Technologies) supplemented with 20% heat-inactivated fetal calf serum (FCS; Sigma-Aldrich) at 38.5°C in a humidified 5% CO2 incubator.
Frozen–thawed bovine sperm was separated over a Percoll gradient (45% and 90%; Pharmacia, GE Healthcare), washed, and diluted in IVF-TALP consisting of the bicarbonate-buffered Tyrode solution, supplemented with BSA (6 mg/mL) and heparin (25 μg/mL) to a final sperm concentration of 1×10⁶ spermatozoa/mL. The matured COCs were washed in 500 μL IVF-TALP and incubated with sperm. After 20 h of coincubation, the presumed zygotes were vortexed to remove excess sperm and cumulus cells. The zygotes were washed and placed in groups of 30 in 50 μL droplets of synthetic oviduct fluid supplemented with 5% FCS and cultured at 38.5°C in 5% CO2, 5% O2, and 90% N2 up to the desired stage. The cleavage rate was analyzed at 48 h p.i. and the blastocyst rate was evaluated on day 7 and day 8 p.i.
FGF4 growth factor supplementation
To test the functional importance of miR-218, bovine IVP embryos were grown in the presence of 1 μg/mL human recombinant FGF4 (R&D Systems) and 1 μg/mL heparin (H3149; Sigma-Aldrich) as previously described by Kuijk et al. [27]. A control group of embryos grown in the standard culture medium was included for each of the 3 replicated experiments. The cleavage rate was analyzed at 48 h p.i. and the blastocyst rate was evaluated on day 7 and 8 p.i. Blastocysts were selected for RT-qPCR analysis or for immunofluorescent staining as further described.
miRNA expression analysis
Early blastocysts were selected at day 7 p.i and hatched blastocysts were selected at day 8 p.i.
Only embryos with good morphological characteristics were selected, washed 3× in PBS, and stored individually or in pools of 10 embryos in 2 μL of the lysis buffer [10% RNasin Plus RNase inhibitor (Promega), 5% dithiothreitol (Promega), and 0.8% Igepal CA-630 (Sigma-Aldrich) in RNase-free water] at −80°C until RNA extraction.
Whole miRNA profiling by stem-loop RT-qPCR
Total RNA, including the small RNA fraction was isolated from 6 pools of 10 early bovine IVP blastocysts (day 7 p.i.) and 6 pools of 10 hatched bovine IVP blastocysts (day 8 p.i.) using the miRNeasy Mini Kit (Qiagen) according to the manufacturer's instructions. The quality of the RNA was evaluated with the Experion electrophoresis system using the high-sense RNA chips (Bio-Rad). The gel electrophoresis image showed sharp 18S and 28S ribosomal bands indicative of good quality RNA. Unfortunately, the RNA concentrations were too low to calculate the RQI value.
The isolated RNA was reverse transcribed with the miRNA reverse transcription kit (Applied Biosystems, Life Technologies) in combination with a human stem-loop Megaplex miRNA primer pool (Applied Biosystems, Life Technologies) consisting of primers for 366 miRNAs and 18 endogenous controls as previously described [28]. Following the RT reaction, the cDNA was preamplified using the TaqMan PreAmp Master Mix and the PreAmp Primer Mix, both from Applied Biosystems, as previously described [28]. Preamplification of the cDNA was necessary because of the low amount of RNA that can be isolated from preimplantation embryos. The preamplification procedure was previously shown to substantially increase the detection sensitivity with limited quantification bias [28]. The preamplified cDNA was diluted 1,600-fold and used for qPCR amplification of 366 mature miRNAs using miRNA TaqMan assays (Applied Biosystems, Life Technologies). The qPCR mixture contained 4 μL of Universal qPCR mastermix (Applied Biosystems, Life Technologies), 3 μL of a 1/15 dilution of miRNA TaqMan assay (Applied Biosystems, Life Technologies), and 1 μL of diluted preamplified cDNA. All reactions were run on a 7900HT qPCR cycler (Applied Biosystems, Life Technologies) under the following cycling conditions: 10 min at 95°C followed by 40 cycles of 15 s at 95°C and 1 min at 60°C. MiRNAs with a Cq-value<32 were considered expressed and miRNA expression data were normalized using the global mean as described [29]. Next, we have used a previously described method for standardizing gene expression data of substantially variable biological replicates [30]. By performing a standardization procedure based on log transformation, mean centering, and autoscaling, interexperimental variation was maximally reduced. Only miRNAs expressed in at least five out of the six tested samples per group were considered for downstream analysis. MiRNAs with a fold difference >2 and a P value ≤0.05 (the Mann–Whitney test) were considered as differentially expressed between the early and the hatched blastocyst group.
Hierarchical cluster analysis was performed using the Multi Experiment Viewer (MEV 4.6.2) software [31].
Individual miRNA detection by SYBR green-based RT-qPCR
RNA, isolated as described before, was reverse transcribed using the miRCURY locked nucleic acid (LNA) Universal cDNA synthesis kit (Exiqon). Mature miRNA expression was quantified using the SYBR Green master mix (Exiqon) and specific LNA PCR primer sets for miR-218, miR-449b, and miR-155 (Exiqon). U6 snRNA, 5SrRNA, and RNU1A (Exiqon) were chosen as reference small RNAs for normalization, as described in [32].
Target gene prediction, pathway analysis, and expression analysis
Candidate target genes were predicted for the differentially expressed miRNAs using a combination of three miRNA target gene prediction databases (TargetScan, miRanda, and PicTar-4way) on the GOmir website (
For the target gene expression analysis, total RNA was isolated from 8 pools of 10 early IVP bovine blastocysts (day 7 p.i.) and 8 pools of 10 hatched bovine IVP blastocysts (day 8 p.i.) using the RNeasy Micro Kit (Qiagen) according to the manufacturer's protocol. After RNA extraction, an RT minus control PCR was performed with primers for GAPDH [33] to check the RNA for genomic DNA contamination and the RNA quantity/quality assessment was done with the Experion (Bio-Rad). The first-strand cDNA synthesis and linear amplification were done using the WT-Ovation RNA Amplification system (NuGEN) as described in the manufacturer's instructions. After the RT reaction and the linear amplification step, the cDNA was diluted 20 times.
The qPCR reactions consisted of 1 μL 5×Real-Time ready DNA Probes Master (Roche), 0.25 μL LightCycler 480 ResoLight Dye (Roche), 1 μL forward primer (1.25 μM), 1 μL reverse primer (1.25 μM; IDT), and 1.75 μL of diluted cDNA. Primers used for qPCR are listed in Supplementary Table S1 (Supplementary Data are available online at
Only assays with good PCR efficiency (>80%<120%) and standard deviations below 0.5 between sample duplicates were taken into account (Supplementary Table S1). Assays that did not meet these criteria were excluded from the study.
Combined analysis of miRNA and mRNA profiles was carried out by investigating the coexpression of the predicted miRNA-mRNA pairs [34] whereby those target genes with an inverse expression pattern compared to their targeting miRNA were selected for further validation by luciferase reporter assays.
Luciferase reporter assay
Wild-type 3′UTR constructs
The hypothesized interaction between a miRNA and its candidate target was tested using an in vitro luciferase assay as previously described [35,36]. The 3′UTR segments of the target genes were PCR amplified using bovine blastocyst cDNA as a template and the primers listed in Table 1. The primers are flanked by either an XhoI or a NotI restriction site at their 5′ to allow ligation into the multiple cloning region of the psiCHECK-2 Vector (Promega) downstream of the stop codon of an SV40 promoter-driven Renilla luciferase gene.
The primers amplify almost the complete 3′UTR of the genes. The forward primer (F) is at the 5′end linked to the XhoI restriction site and the reverse primer (R) is at the 5′ end linked to the NotI restriction site (highlighted in bold) for ligation into the multicloning site of the psiCHECK-2 Vector.
3′UTR, 3′ untranslated region.
HEK293T cells were seeded in the RPMI medium (Invitrogen, Life Technologies) supplemented with 10% FCS (Invitrogen, Life Technologies) at a density of 10,000 cells/well in an opaque 96-well plate (Nunc–Thermo Scientific). Twenty-four hours after seeding, cells were transfected with a 3′UTR containing psiCHECK-2 Vector construct (345 ng) and the appropriate miRNA precursor (50 nM, pre-miR; Ambion, Life technologies; hsa-pre-miR-218: PM10328; hsa-pre-miR-449b: PM11521; hsa-pre-miR-130a: PM10506; hsa-pre-miR-203: PM10152) using 0.4 μL DharmaFECT Duo (Dharmacon, Thermo Scientific). All transfections were conducted twice in triplicate with the inclusion of a positive (vector only) and negative control (50 nM, Ambion pre-miR negative control AM17111, Ambion Life technologies). Cells were lysed and luminescence was quantified 48 h after transfection using the Dual-Glo Luciferase assay system (Promega) on a FLUOstar OPTIMA microplate reader (BMG LABTECH, Isogen Lifescience). Data were normalized against the activity or the Firefly luciferase gene. The results were reported as the average luciferase activity±SD and statistically evaluated using a pairwise T-test whereby P≤0.001 was considered as statistically significant.
Seed-mutation analysis
For CDH2, NANOG, and NOTCH1, the miRNA-binding sites were mutated using the Quikchange II XL Site-directed mutagenesis kit (Agilent) according to the manufacturer's instructions. Primers for site-directed mutagenesis (Table 2) were designed according to the guidelines described by Mavrakis et al. [37] using the Quickchange Primer Design Program available on the Agilent website (
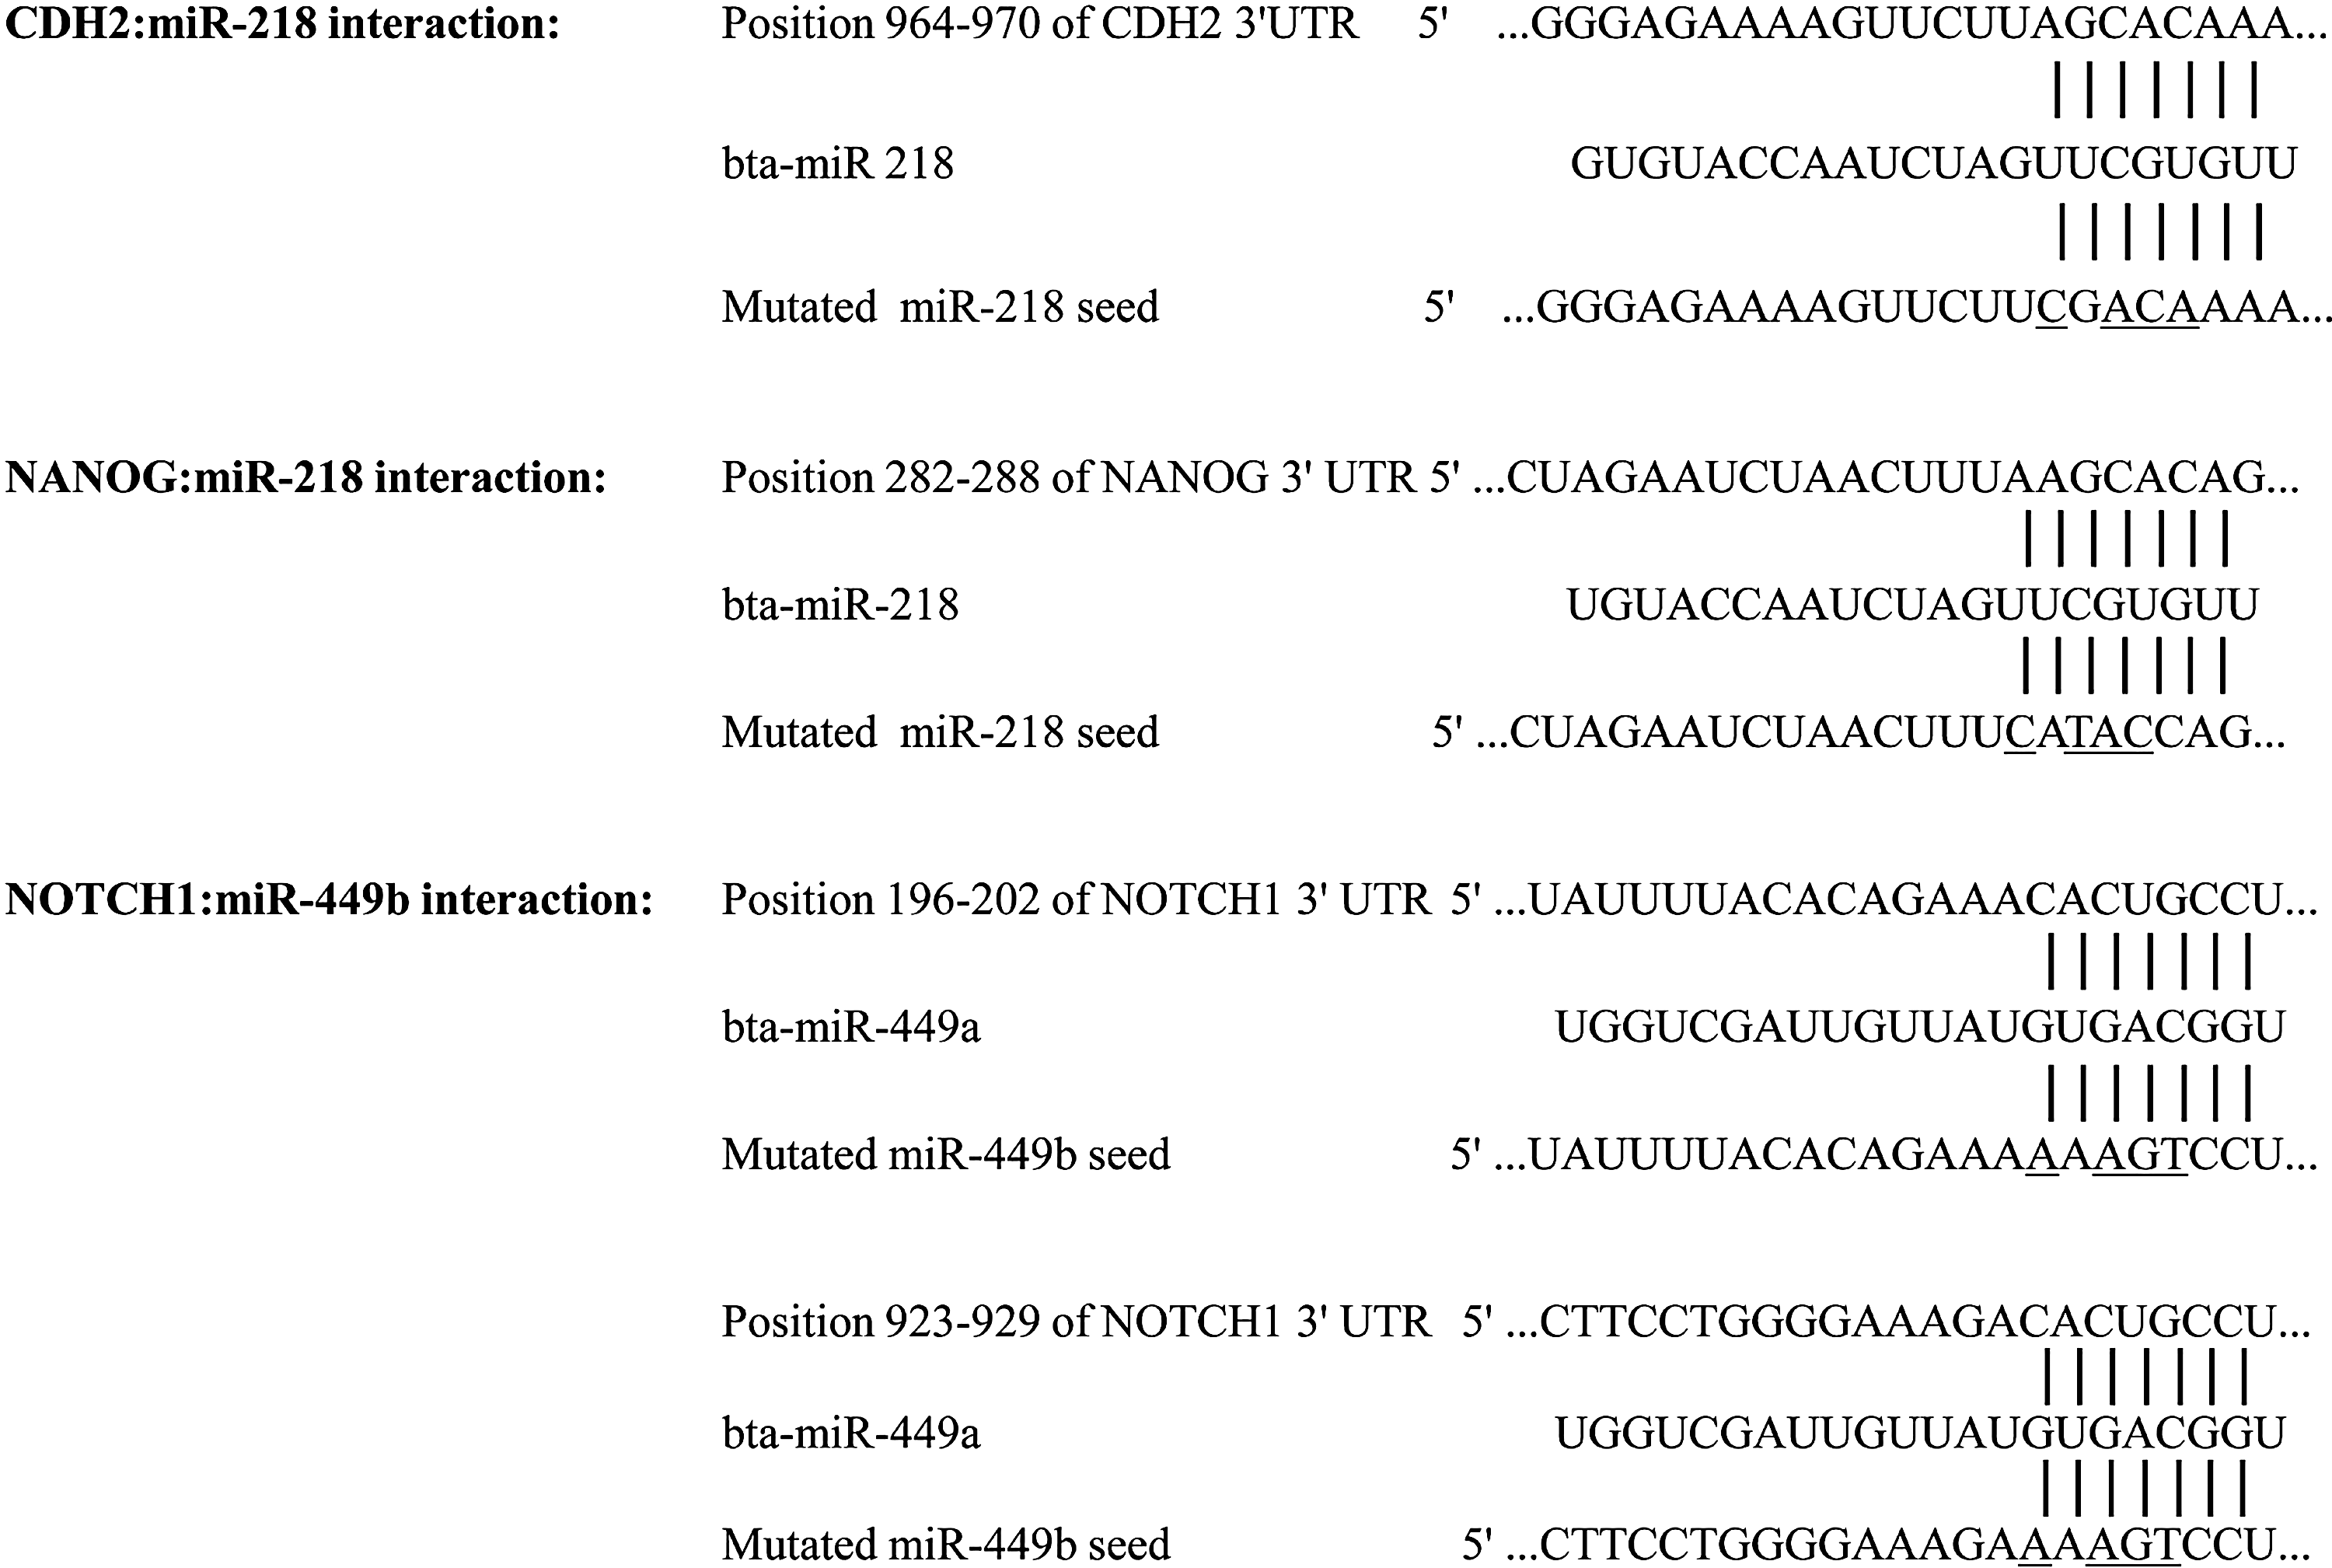
Overview of the miR-218-binding sites in the 3′UTRs of CDH2 and NANOG and of the miR-449b-binding sites in NOTCH1. The underlined nucleotides were mutated in the mutant 3′UTR constructs. 3′UTR, 3′ untranslated region.
The miRNA binding seed is underlined and the mutated nucleotides are highlighted in bold.
miRNA, microRNA.
HEK293T cells were transfected with either the wild-type or the mutated 3′UTR psiCHECK-2 Vector as described above. The results were reported as the average luciferase activity±SD and evaluated using a paired, two-tailed T-test whereby P≤0.001 were considered as statistically significant.
Differential miRNA expression analysis in bovine blastocysts
miRNA detection by whole-mount in situ hybridization
Whole-mount in situ hybridization (WISH) was performed as described in [32] using the 3′ and 5′-digoxigenin (DIG)-labeled LNA-modified oligonucleotide probe (10 pM) for miR-218 (cat. No. 18111-15; Exiqon) or the DIG-labeled LNA-modified miRNA detection control probe (10 pM, scrambled control probe, cat. No. 99004–05). After the WISH procedure, the embryos were mounted in a droplet of glycerol with 1,4-diazabicyclo[2.2.2]octane (25 mg/mL, Dabco, Acros; Thermo Fisher Scientific) on slides with Vaseline bridges and analyzed with an inverted bright field microscope (Olympus IX70).
miRNA expression analysis in ICM and TE cells isolated by immunosurgery and manual dissection
ICM cells were isolated from the surrounding TE cells by use of immunosurgery as described by Yadav et al. [38]. Manual dissection was used to isolate the mural TE cells. The purity of the ICM and TE samples was determined by RT-qPCR for the ICM marker NANOG and the TE marker KRT18 [32,39]. The expression of miR-218, miR-449b, and the target genes NANOG and CDH2 was analyzed in 3 pools of 10 separated ICM and TE samples using SYBR green-based RT-qPCR as described before.
Differential apoptotic staining
An immunofluorescent staining for simultaneous quantification of the ICM/TE ratio and the apoptotic cell ratio was performed on bovine blastocysts as described by Wydooghe et al. [40]. Blastocysts, grown in the presence of FGF4 or under standard conditions, underwent immunofluorescent staining. Negative (by replacing the primary antibodies with blocking serum) and double-negative controls (only Hoechst staining) were performed simultaneously to check for nonspecific binding of the secondary antibody and for auto-fluorescence. The staining was performed on two replicates of minimum 6 blastocysts per group. The embryos were mounted in a droplet of dabco, on slides with Vaseline bridges and analyzed by fluorescent microscopy. The Total Cell Number (TCN), the TE cells, and the Apoptotic Cell Number (ACN) were counted and the results of the staining are reported as average ICM/TE ratio±SD, average ICM/TCN ratio±SD, and average ACN±SD.
Results
Bovine IVP
Embryos for miRNA and mRNA expression analysis were selected from IVP experiments with >25% blastocyst rate at day 7 p.i. The mean fraction of blastocysts over all IVP experiments used in this study was 33.38±5.35. Both the stage of development and the culture time were taken into account for embryo selection.
MiRNA expression analysis in early and hatched blastocyst samples
To identify miRNAs that display differential expression during the blastocyst development, we compared the miRNA expression between early and hatched blastocysts. Interspecies comparison of the miRNAs on the platform showed that 231 of the 366 human miRNAs were already characterized in cattle and 89.2% of them were 100% conserved between the human and cow (Supplemental Table S2).
A total of 77 miRNAs from the 366 miRNAs included in the assay, were expressed in both the early and the hatched blastocyst group (Table 3). Among those 77 miRNAs, there were 7 miRNAs unknown in cow (miR-203, miR-30a-3p, miR-371, miR-422a, miR-485-39, miR-516-3p, and miR-610) and 1 miRNA with a single-nucleotide difference between the human and the bovine miRNA (miR-134; Supplementary Table S2). Twelve miRNAs out of 77 were significantly differently expressed between early and hatched blastocysts. Gene-based cluster analysis of these 12 miRNAs showed two 2 clusters (Fig. 2). Cluster 1 contains four miRNAs that are significantly higher expressed in early blastocysts compared to the hatched blastocysts (hsa-miR-135a, hsa-miR-218, hsa-miR-335, and hsa-miR-449b). Cluster 2 contains eight miRNAs that are significantly higher expressed in the hatched blastocysts compared to the early blastocysts (hsa-miR-127, hsa-miR-130a, hsa-miR-155, hsa-miR-196a, hsa-miR-203, hsa-miR-28, hsa-miR-29c, and hsa-miR-376a; Mann–Whitney test, P≤0.05; Fig. 3).
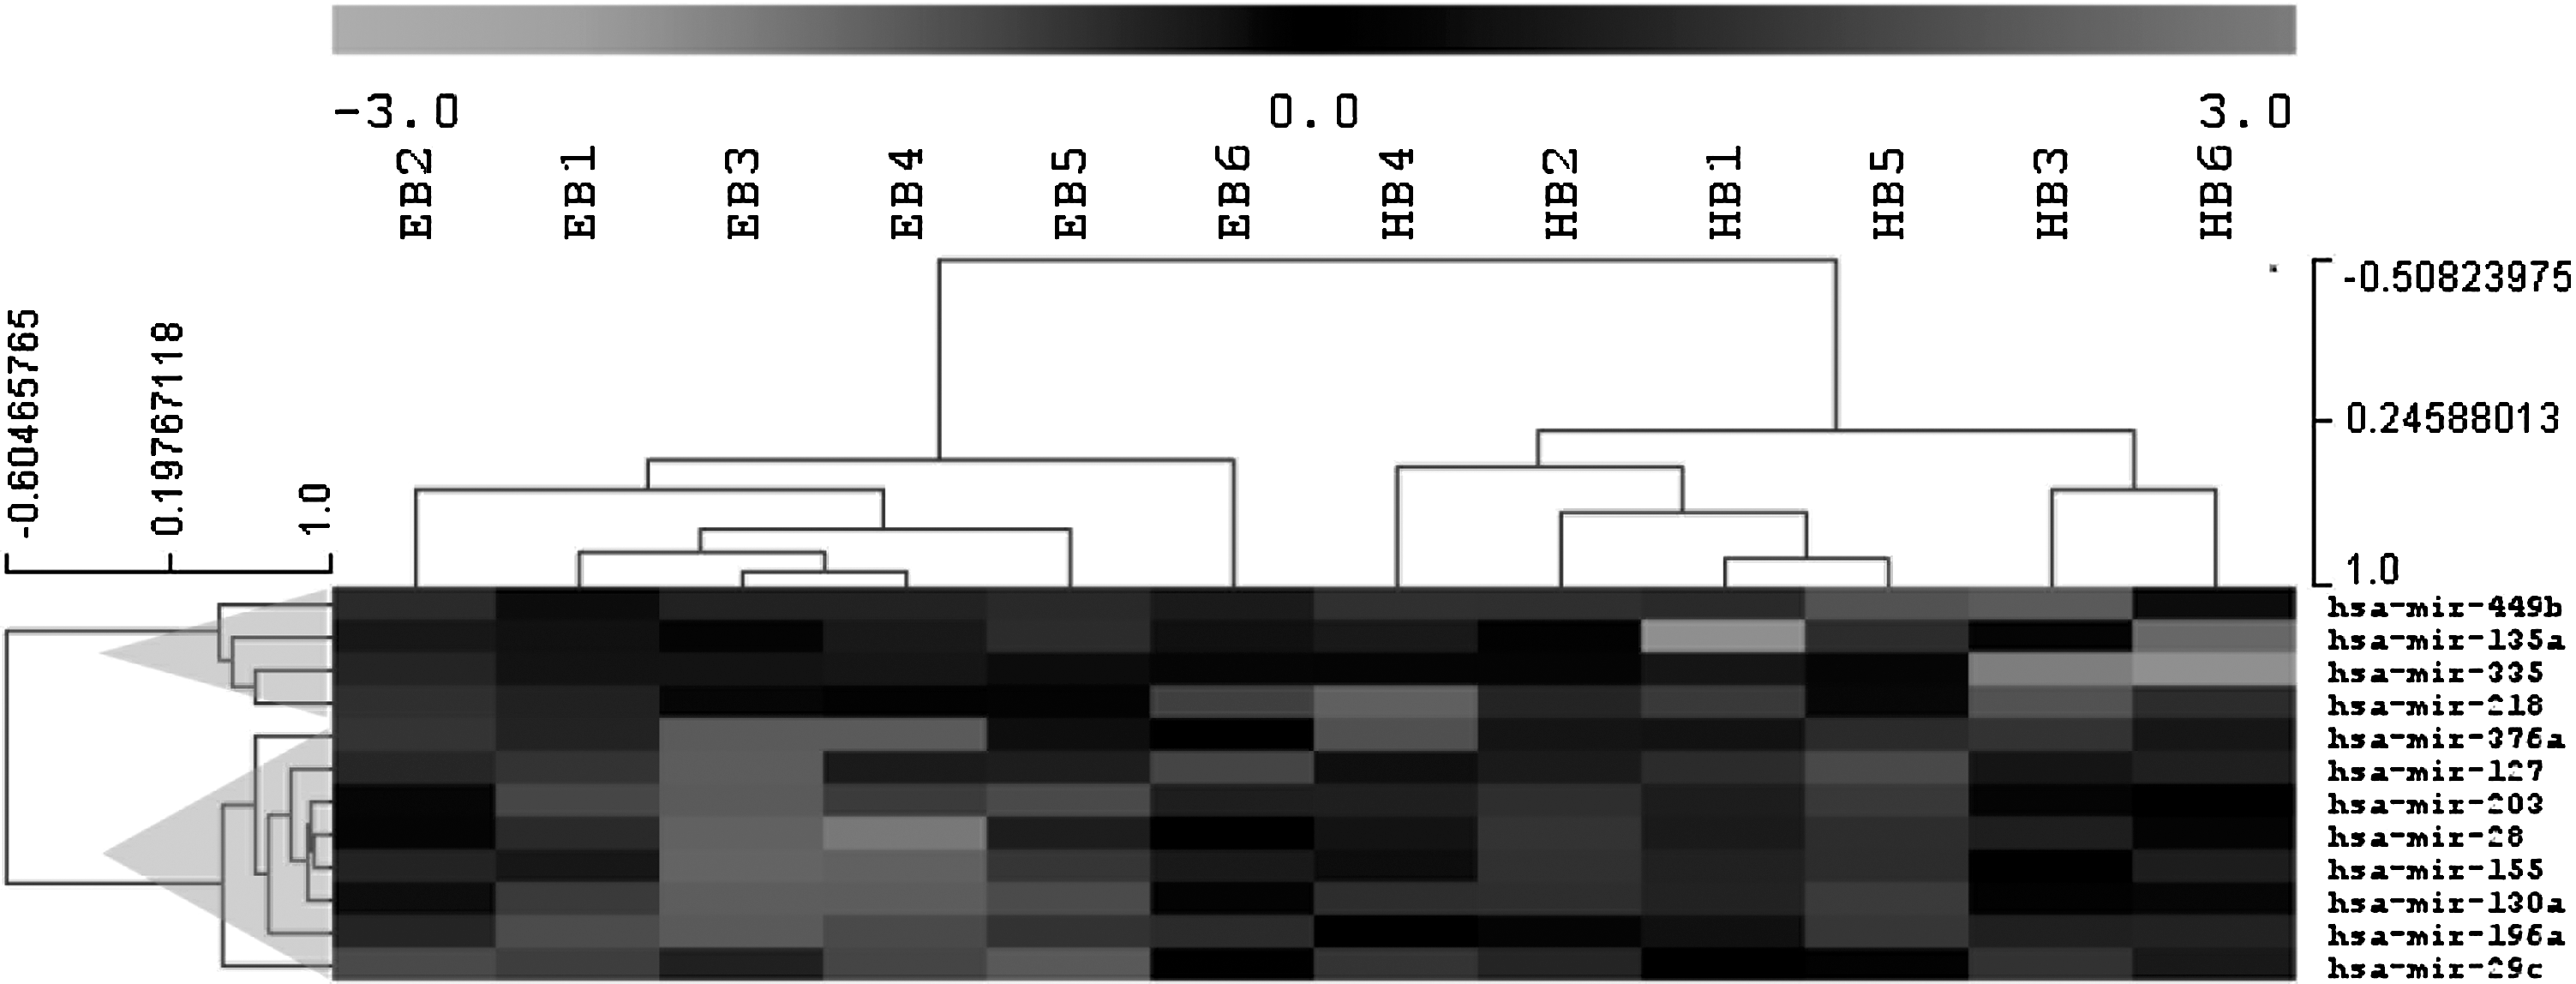
Gene-based cluster analysis of the 12 differentially expressed miRNAs in early blastocysts (EB) versus hatched blastocysts (HB). Cluster 1 contains four miRNAs downregulated in hatched blastocysts and cluster 2 contains eight miRNAs upregulated in hatched blastocysts (P≤0.05). miRNA, microRNA.

Relative expression levels (mean±SD) of the 12 differentially (P≤0.05) expressed miRNAs in EB versus HB.
The 12 differentially expressed miRNAs (P≤0.05) are indicated in bold.
EB, early blastocysts; HB, hatched blastocysts.
Target gene prediction, pathway analysis, and expression analysis
For each miRNA, target genes were predicted using three different programs. The results of the target gene predictions are provided as Supplementary Table S3.
The union of the target gene lists was analyzed using IPA software to search for enriched pathways and gene functions. IPA analysis showed that the combined target gene list was enriched for genes belonging to signal-transduction pathways involved in the embryo development and regulation of stem cell pluripotency, such as the TGF-β signaling pathway, WNT/β-catenin signaling pathway, and the ERK/MAPK signaling pathways (Table 4).
Next, a selection of target genes was made based on the intersections between the target gene prediction programs, the experimentally supported miRNA-mRNA interactions as reported by Tarbase [41] (
Gene expression analysis on eight samples per group demonstrated that 112 of the 187 tested target genes were expressed in bovine blastocysts and 29 of them were differentially expressed between early and hatched blastocysts (the Mann–Whitney test, P≤0.05; Table 5; Supplementary Fig. S1). Nineteen genes were upregulated at the hatched blastocyst stage, and 10 genes were downregulated at the hatched blastocyst stage. The expression differences of the target genes, the P values, and the respective targeting miRNAs are shown in Table 5.
The six miRNA-mRNA pairs selected for verification by luciferase reporter assays are highlighted in bold.
microRNAs indicated in the shaded columns have an anticorrelated expressing profile compared to the corresponding target gene.
Next, a combined analysis of miRNA and mRNA expression profiles in early and hatched blastocysts and a selection of those target genes with an anticorrelated expression pattern compared to a single targeting miRNA resulted in six miRNA-mRNA pairs as marked in Table 5.
MiRNA target gene validation
To investigate whether the predicted targets can be directly targeted by their corresponding miRNA, luciferase reporter constructs were engineered that have either the wild-type 3′UTR (WT) of these genes or mutant 3′UTRs (MUT) with 4 bp mutations in the miRNA target seed (Fig. 1). HEK293T cells were cotransfected with the pre-miRNA or with a scrambled pre-miR negative control with no homology to the target genes to control for nonspecific effects. The scrambled pre-miR negative control did not affect the luciferase activities. The pre-miR-218 significantly reduced the luciferase activities of the WT CDH2 and NANOG reporters with 40% and 43%, respectively, compared to the scrambled negative control (paired, two-tailed t-test, CDH2 P=0.0003 Fig. 4A; NANOG P=1.35E-05 Fig. 4B). Mutant reporters of CDH2 and NANOG were not repressed by pre-miR-218, which confirms that the target site directly mediates the repression (Fig. 4A, B).
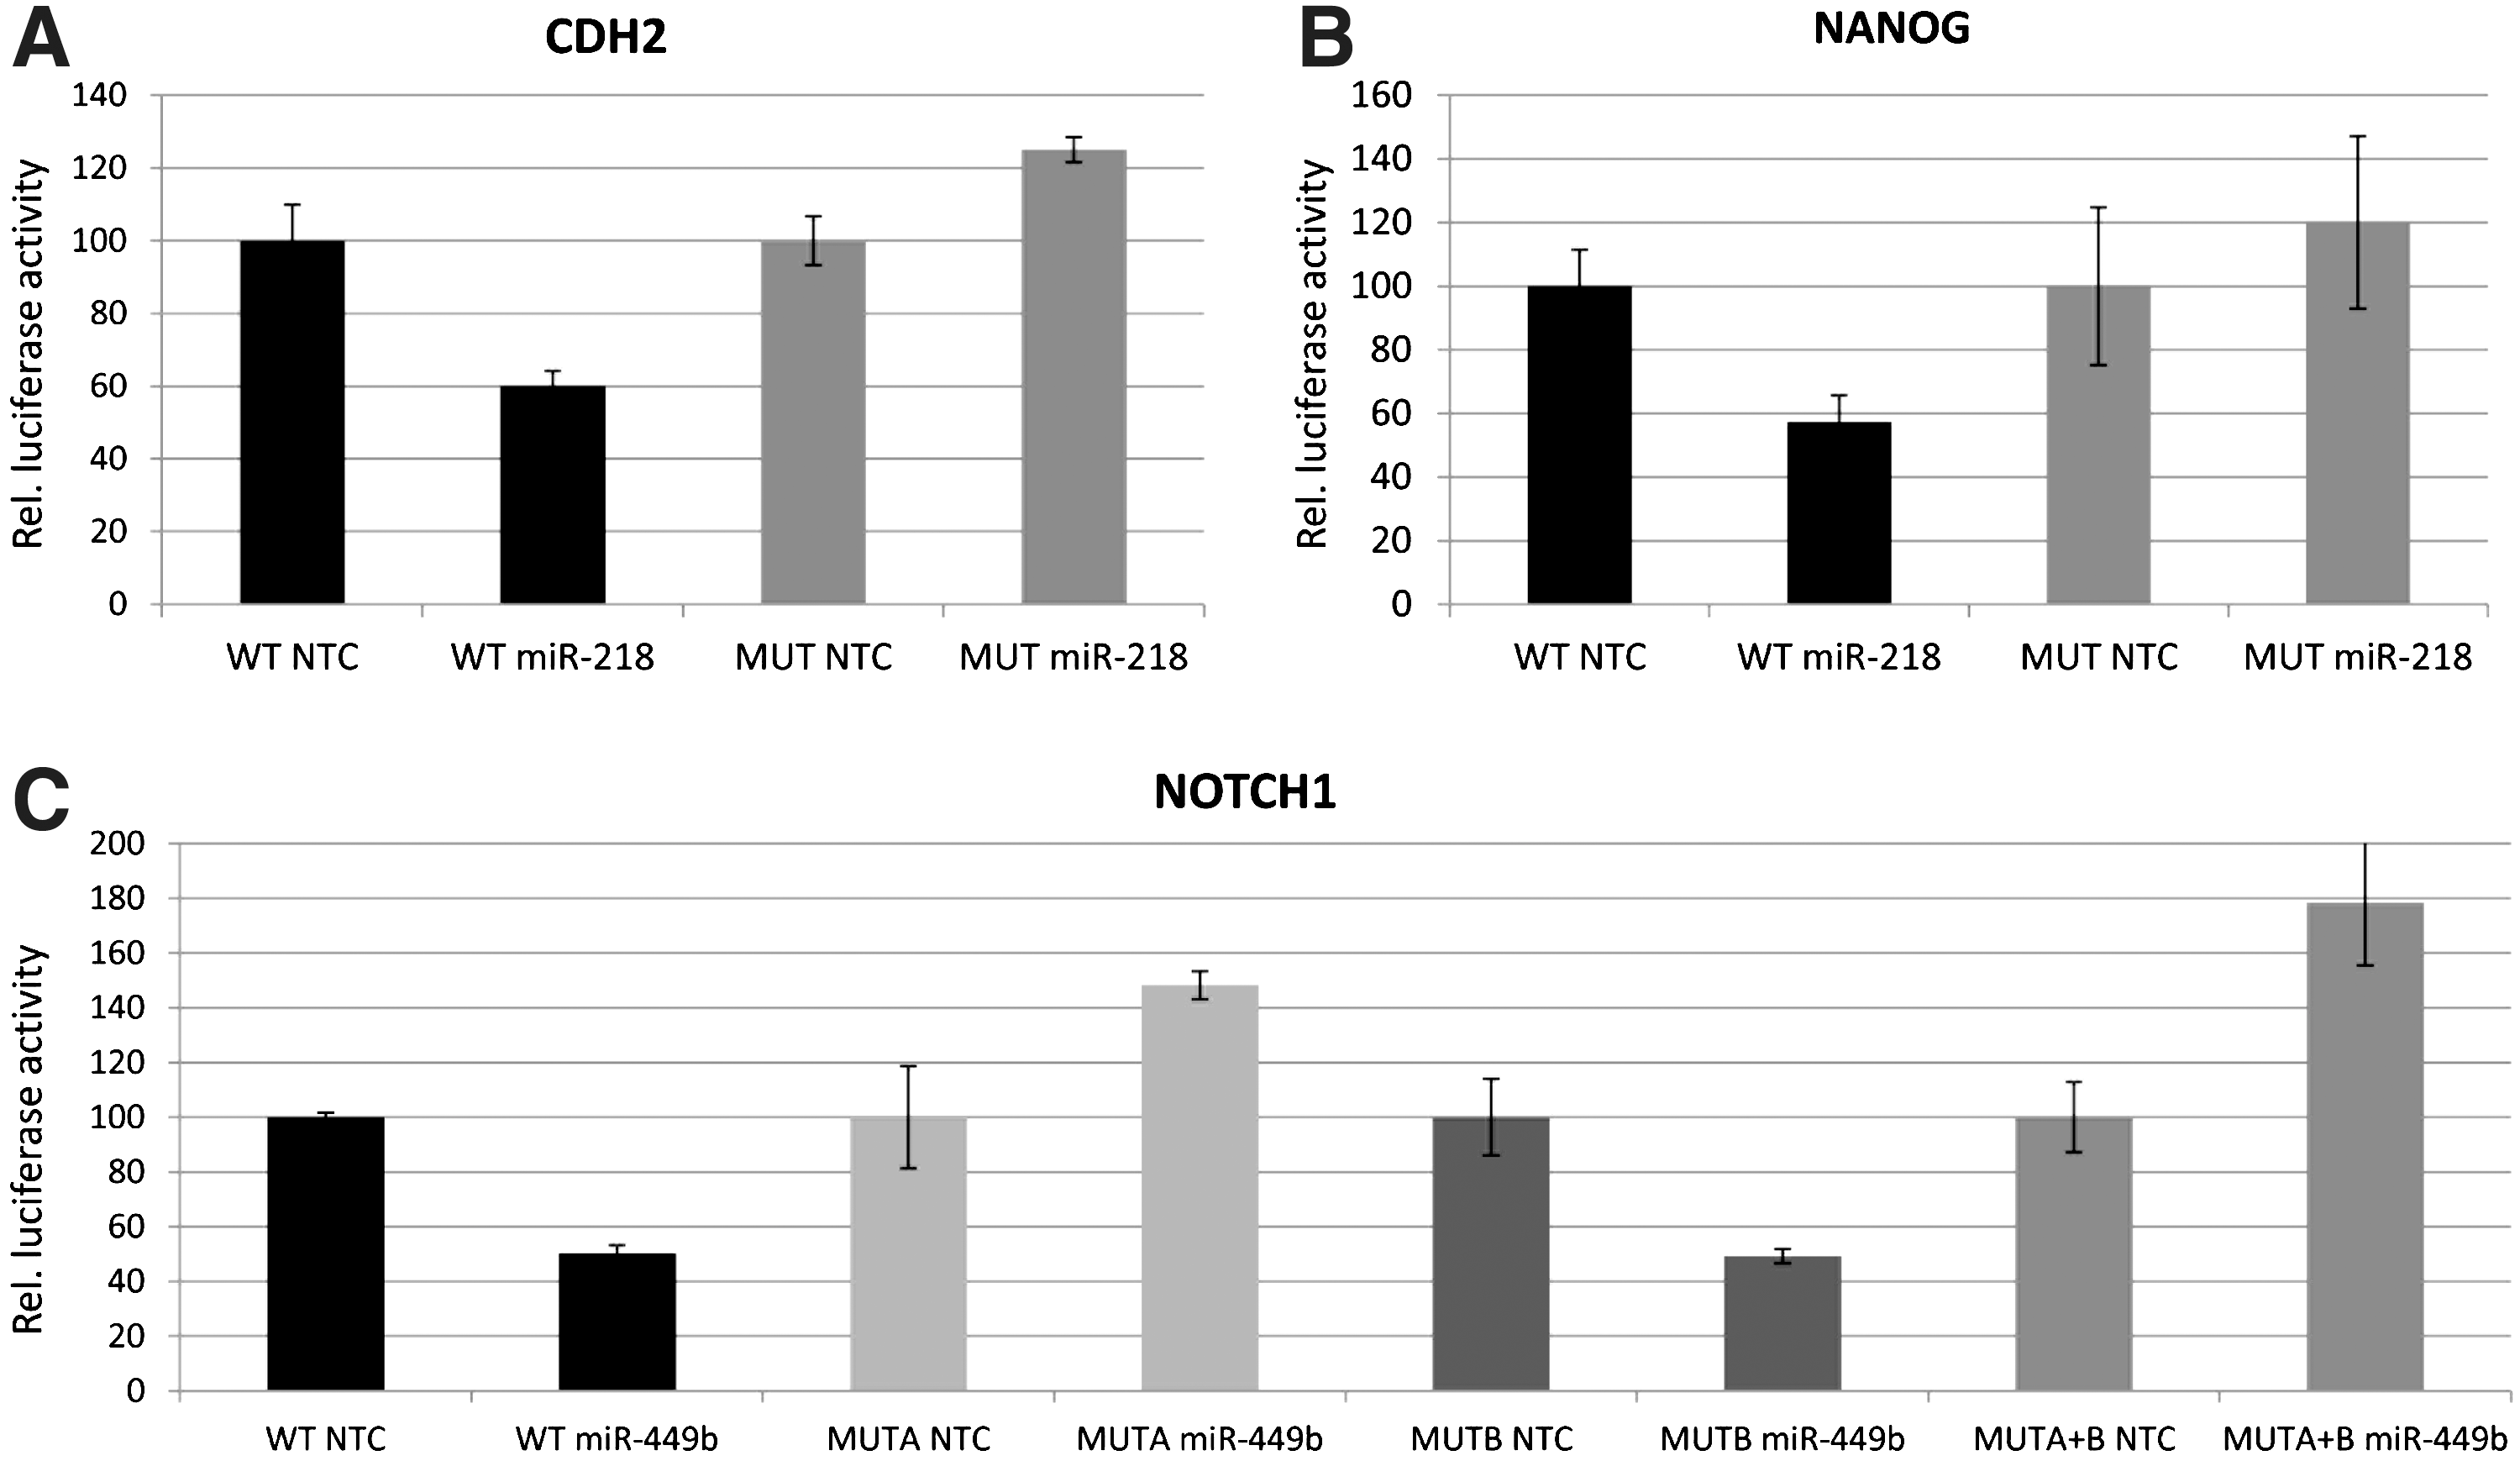
Relative 3′UTR luciferase reporter activities (mean±SD) for the CDH2
The pre-miR-449b significantly reduced the luciferase activity of the WT NOTCH1 reporter with 50% compared to the scrambled negative control (paired, two-tailed t-test, P=0.008; Fig. 4C). Since two theoretical miR-449b-binding sites are located in the NOTCH1 3′UTR, mutants for each individual seed and double mutants were made. The seed at position 196–202 of NOTCH1 3′UTR (called seed A) mediates the binding between miR-449b and NOTCH1, as mutagenesis of this seed (MUTA) blocked the NOTCH1 reporter repression. In contrast, the mutant reporter for seed B (MUTB), located at position 923–929 of NOTCH1 3′UTR was still repressed by pre-miR-449b, indicating that this target site was not responsible for the miRNA-mRNA interaction. The double-mutant reporter (MUTA+B) was not repressed by miR-449b and showed the same effect as single mutant A (Fig. 4C).
The luciferase reporter assays showed no reporter repression for the JMJD1C, DAB2, and LIN28 constructs by their corresponding pre-miRs, indicating that there was no interaction between JMJD1C and miR-449b, between DAB2 and miR-203, and between LIN28 and miR-130a (paired, two-tailed t-test, P>0.05; Supplementary Fig. S2).
Taken together, our results show that three of our six predicted miRNA-mRNA interactions are confirmed, that miR-218 directly targets CDH2 and NANOG, and that miR-449b directly targets NOTCH1.
Differential miRNA and target gene expression analysis ICM and TE cells
miRNA expression analysis using WISH
Bta-miR-218 was expressed in both ICM and TE cells. The strongest signal was seen in the ICM cells and a weaker signal was observed in the TE cells (Fig. 5A). However, we were not able to quantify the expression levels in ICM versus TE cells, nor did we observe differences within the ICM using WISH NBT/BCIP chromogenic detection. No colorimetric signal was detected in the scrambled probe control samples (Fig. 5A′) or no-probe control samples (Fig. 5A′). The experiment was done in duplicate, and the embryos shown in Fig. 5 are representative for all the samples.
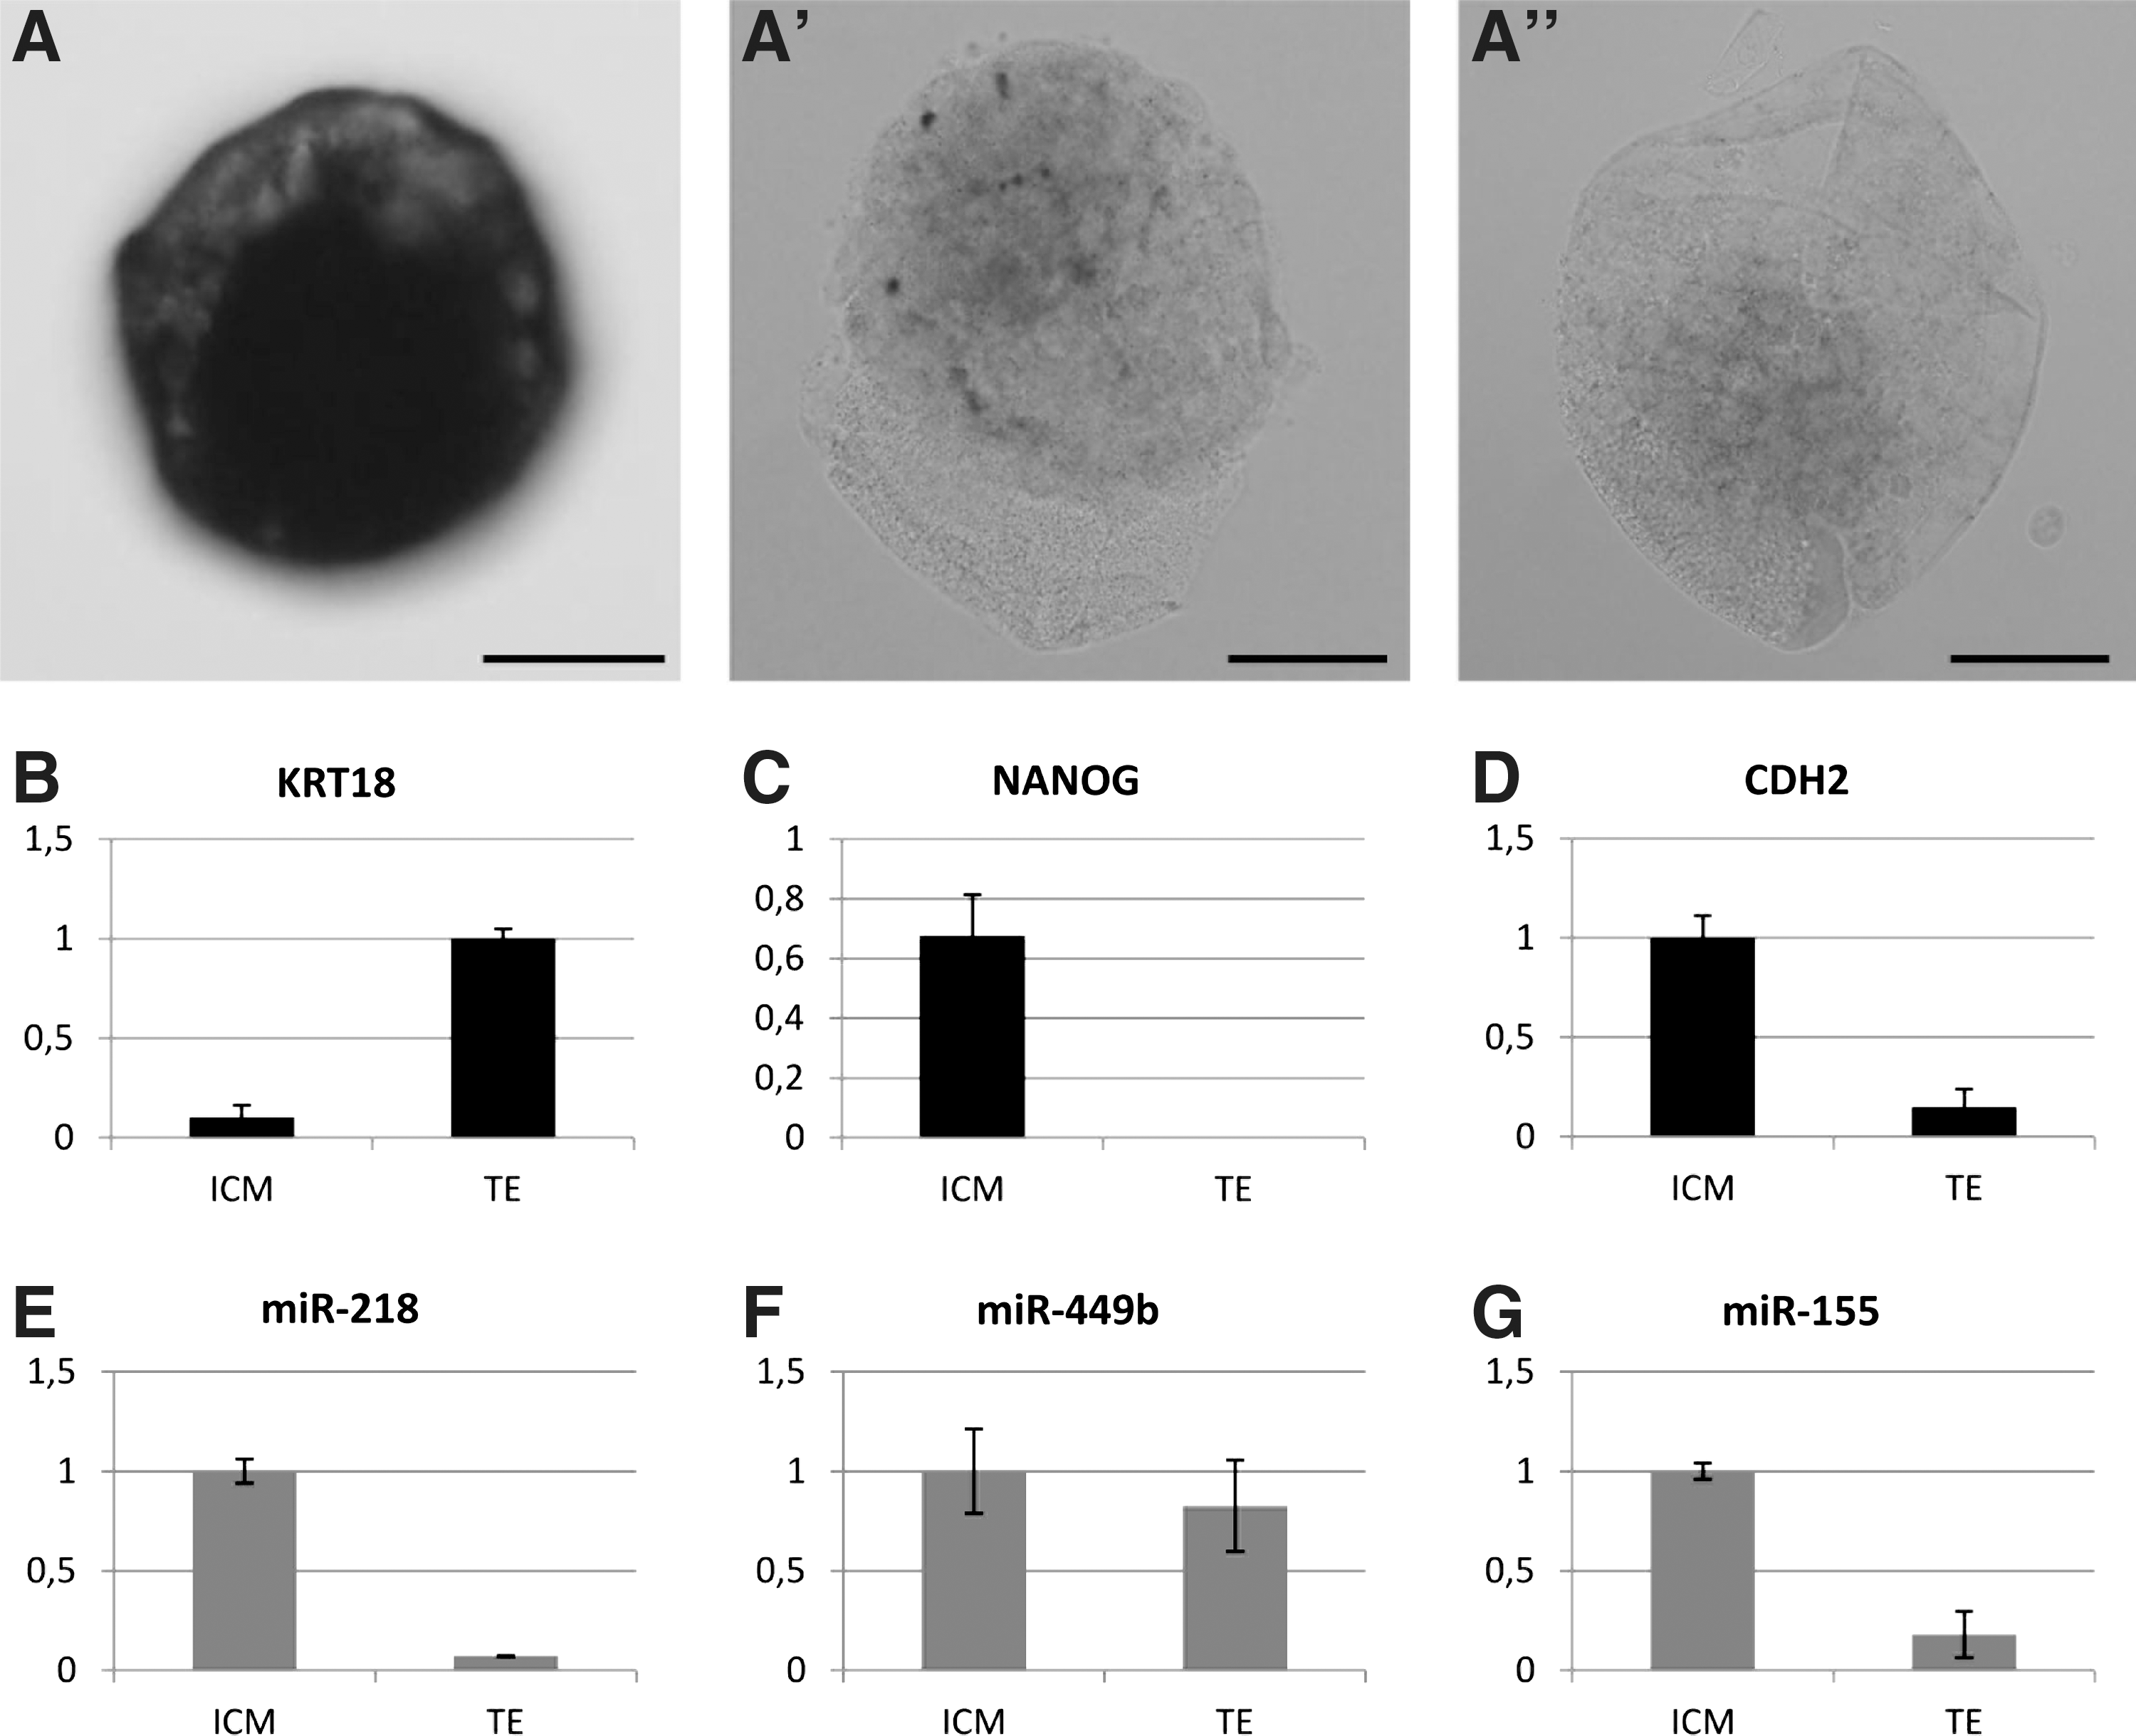
Differential miRNA expression analysis in ICM versus TE cells using whole-mount in situ hybridization
miRNA expression analysis using RT-qPCR
The purity of the samples collected by immunosurgery (ICM) or manual dissection (TE) was confirmed by RT-qPCR using the TE marker KRT18 and the ICM marker NANOG.
The results of the NANOG expression analysis showed that the TE cells were free from contaminating ICM cells, as they were negative for NANOG mRNA expression (Fig. 5C). The ICM cells showed a weak positive signal for KRT18, indicative of little TE contamination in the ICM cells (Fig. 5B).
MiR-218 and miR-155 were predominantly expressed in the ICM cells of the blastocyst (P≤0.05; Fig. 5E, G). The results of miR-155 expression analysis were in agreement with our previous findings [32]. There is no evidence of differential miR-449b in ICM versus TE samples (P>0.05; Fig. 5F). The first target gene of miR-218, NANOG, was exclusively expressed in the ICM cells, and the second target gene, CDH2, was significantly higher expressed in the ICM cells (P<0.05, Fig. 5C, D).
Response of FGF/MAP kinase signaling pathway modulation on the miR-218 expression and target gene expression
We interfered with FGF/MAP kinase signaling in bovine embryos, by adding exogenous FGF4 to the culture media. The addition of FGF4 to the culture media had no effect on the cleavage rate or on the developmental competence of the embryos, reflected by the expected blastocyst rate at day 7 p.i. (Table 6). The effects on the expression of miR-218, miR-449b, NANOG, CDH2, and GATA6 were analyzed by RT-qPCR. FGF4 addition to the culture medium inhibited the NANOG mRNA expression and induced the miR-218 expression significantly compared to the control group (Fig. 6A, D). However, we did not find significant differences in mRNA expression for CDH2, the other target gene of miR-218 (Fig. 6B), or for the hypoblast marker GATA6 (Fig. 6C). The expression of miR-449b was not affected by the modulation of the FGF/MAP kinase pathway (Fig. 6E).
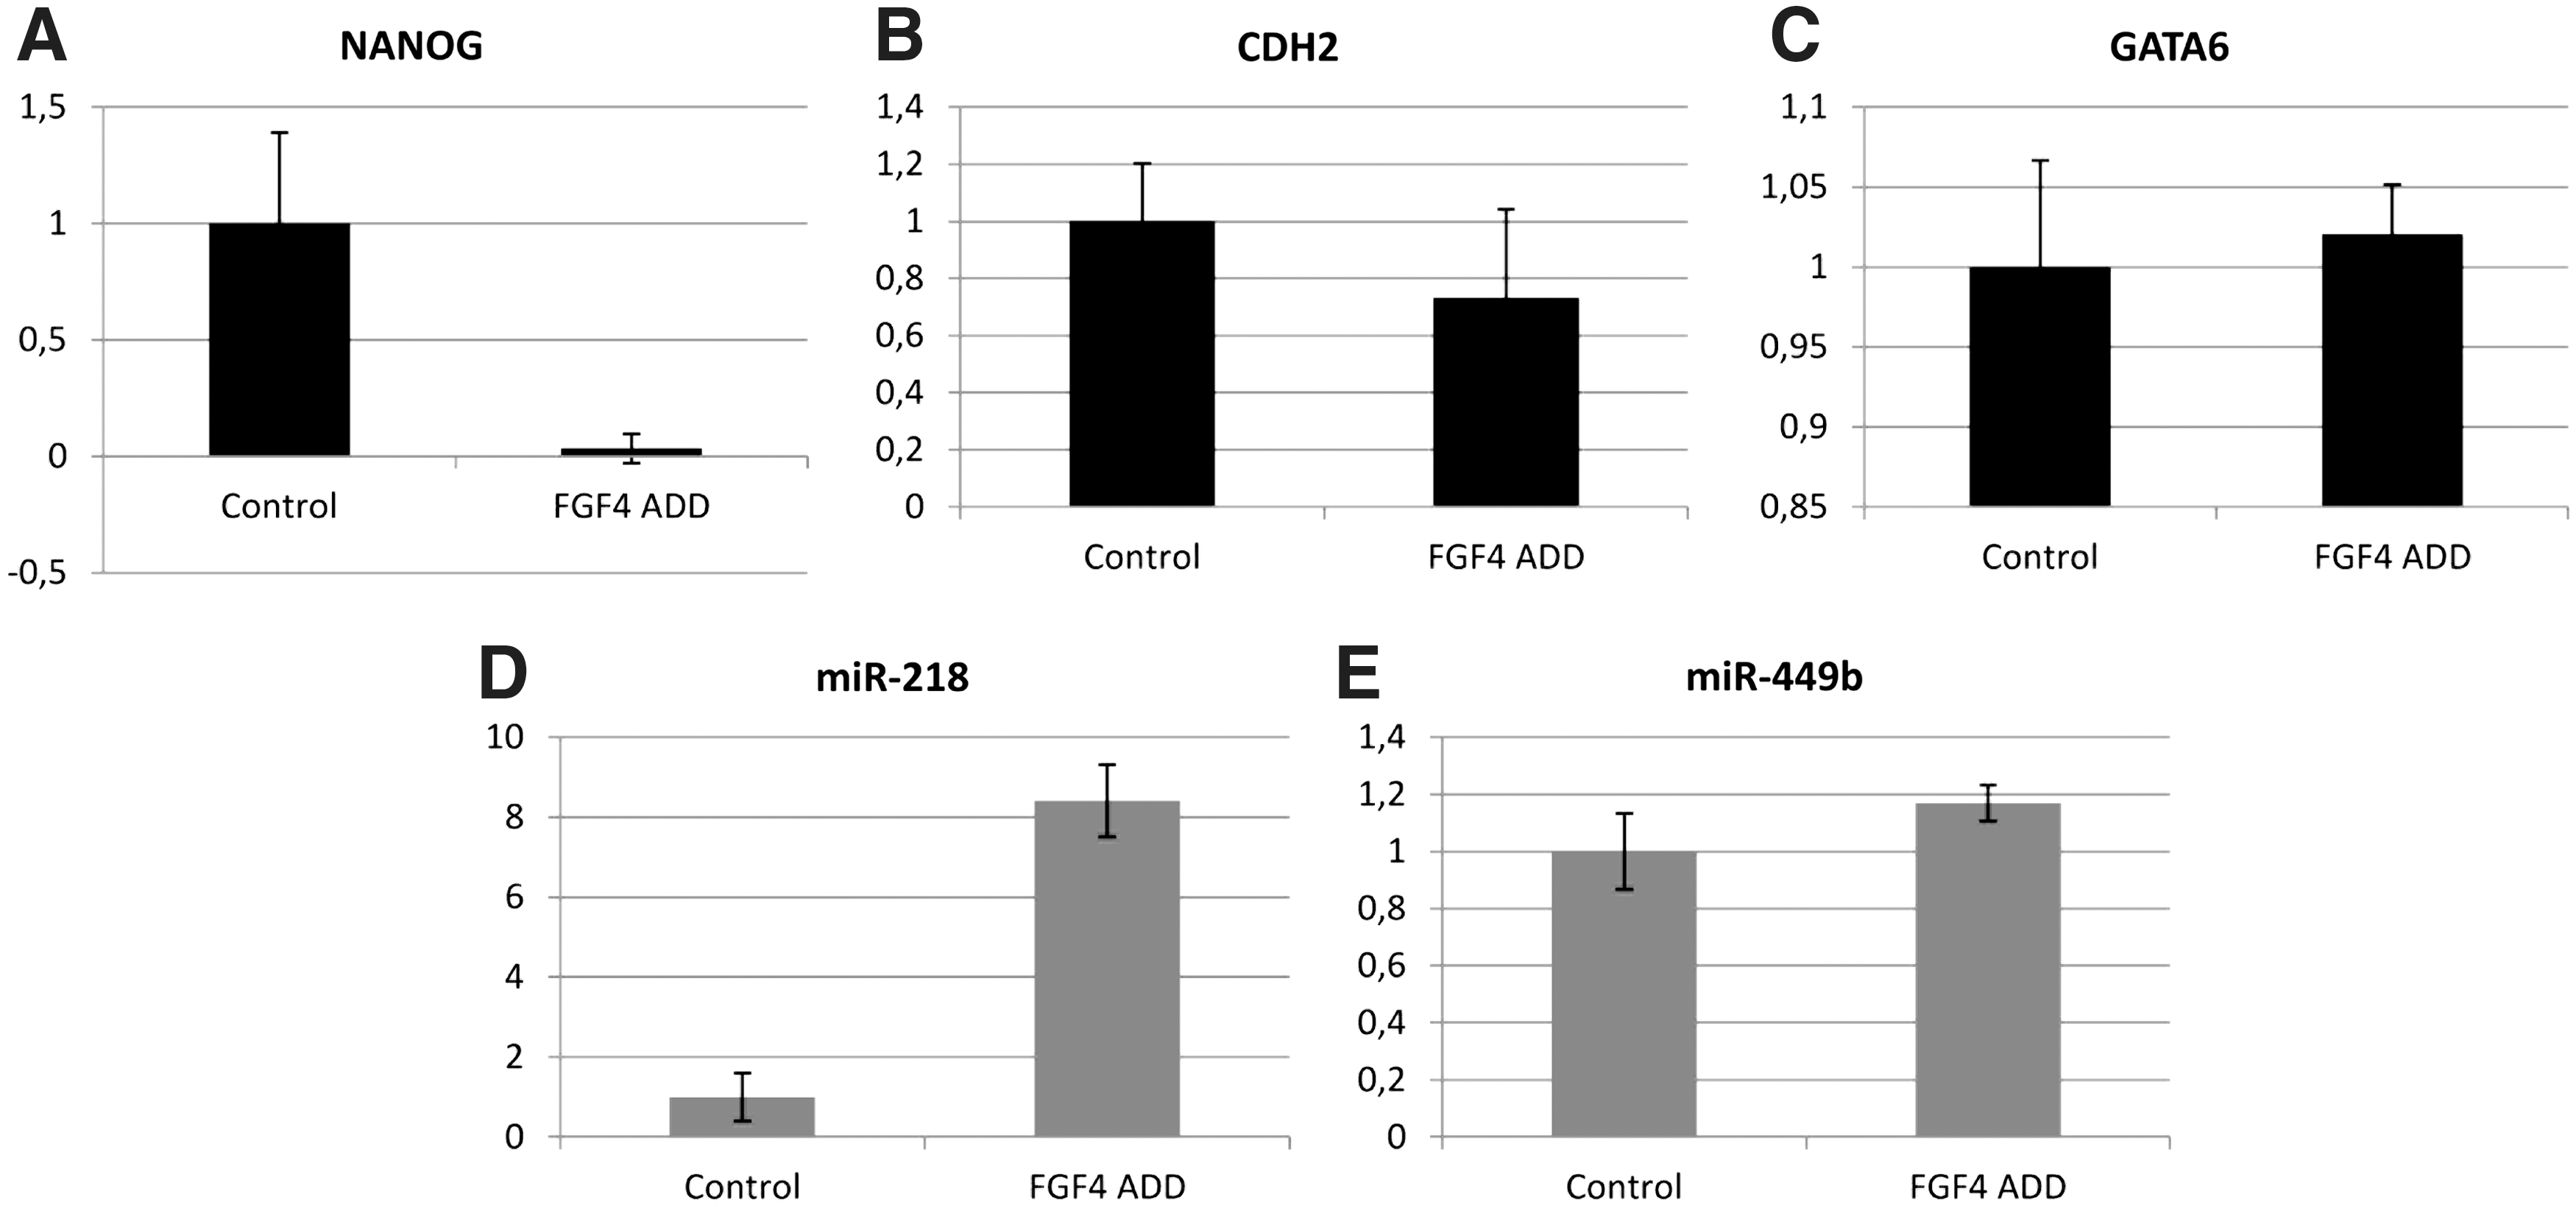
Relative expression levels (mean±SD) of NANOG
The results are presented as average of the three replicates±standard deviation. P values are calculated compared to the control group.
ACN, apoptotic cell number; ICM, inner cell mass; TCN, total cell number; TE, trophectoderm; p.i., post insemination.
Response of modulation of the FGF/MAP kinase signaling pathway on the ICM and TE cell numbers and apoptosis
Concurrent assessment of the ICM/TE ratio and ACN was done by a differential apoptotic staining. The TCN was counted based on the results of the Hoechst staining, the TE cell number was counted based on the CDX2 staining, and apoptotic cells showed a green fluorescent signal coming from the anti-caspase 3 antibody, indirectly labeled with FITC (images not shown). The average ICM/TE ratio±SD, ICM/TCN ratio±SD, and the ACN±SD were calculated for both culture groups (control, FGF4 addition) and are presented in Table 6. No significant differences were found between the culture groups (P>0.05).
Discussion
In this study, we characterized the miRNA expression patterns in early and hatched blastocysts to profile the miRNome of the bovine blastocyst and to unravel the functions of miRNAs in the blastocyst and in the regulation of pluripotency and differentiation. Our choice for the blastocyst as a developmental stage of interest was, next to the fact that ESCs are derived from blastocysts, mainly because in the mouse a gradual increase of the miRNA expression during the preimplantation embryo development has been reported, with a spectacular rise at the blastocyst stage [42]. This may point at an increased functional importance of the miRNAs at this developmental stage.
We could indeed show that 77 miRNAs were expressed in bovine blastocysts, including 12 miRNAs with a differential expression level between early and hatched blastocysts. Those 12 differentially expressed miRNAs may be markers for the developmental state of the blastocyst, since it has been suggested, based on the stem cell model, that the degree of cellular or tissue differentiation can be characterized by a particular miRNA signature [43]. They may serve as temporally regulated switches that tightly modulate developmental transitions [12]. We therefore hypothesize that these temporally expressed miRNAs are involved in the regulation of early lineage segregations.
A first step in the verification of this hypothesis was the identification of target genes that are regulated by those miRNAs. Target gene prediction programs indicated that each miRNA had hundreds of different target genes, with a large variation in the number and nature of genes depending on the prediction program. As it was practically impossible to verify each predicted target gene, we made a selection based on the results of the computational prediction programs, and based on gene function and pathway analyses. Thus, we came to an acceptable number of 187 genes that were tested by RT-qPCR in parallel samples of early and hatched bovine blastocysts. Among the target genes selected for RT-qPCR analysis, we found a remarkable representation of important transcription factors regulating pluripotency and differentiation such as OCT4, SOX2, NANOG, GATA6, KLF4, LIN28A, and LIN28B as well as modulators of epigenetic modifications such as DNMT3A, DNMT3B, and KDM5B. The expression of most of these factors has been well characterized in the mouse embryo, but is not yet analyzed in bovine blastocysts. Besides giving information about possible interactions between miRNAs and mRNA targets, the results of our large-scale RT-qPCR screening also substantially add to the understanding of the molecular regulations controlling early lineage differentiation in the bovine blastocyst.
Of utmost importance for miRNA functional analysis is the clarification of the relationship between the miRNAs and their presumed target genes. In our approach, we selected those mRNA targets with an expression pattern anticorrelating to that of a single corresponding miRNA. The underlying assumption in this approach is the fact that mammalian miRNAs predominantly act by destabilization of the mRNA targets to reduce the protein expression and not by translational repression [44]. Our results revealed several sets of miRNA-target gene pairs that display such an inverse pattern, which may suggest a direct regulatory effect of the miRNA on the target gene expression. For 3 out of the 6 tested miRNA-target gene pairs (miR-218- CDH2, miR-218- NANOG, and miR-449b—NOTCH1), the interaction was indeed confirmed.
The first pair consists of miR128—CDH2: CDH2, also known as N-cadherin or neural cadherin, is one of the cadherins that constitute the core of the adheren junctions together with the catenins. Adheren junctions are the first cell-to-cell contacts formed at compaction and they play a prominent role in development and first cell specification because they link the adhesive function of cadherin–catenin protein complexes to the dynamic forces of the actin cytoskeleton. At the point of gastrulation, when epiblast cells undergo epithelial to mesenchymal transition, E-cadherin (CDH1) is replaced by CDH2, which is required for normal mesodermal cell migration, for neurulation, and for somitogenesis [45,46]. The spectacular rise (about 20-fold) in CDH2 expression between the early and hatched blastocyst stage was surprising as the gastrulation process is initiated later in cattle [2]. However, this process is not well characterized at the molecular level and interspecies differences may exist in the onset of CDH1-CDH2 replacement.
The second pair is miR-218—NANOG: NANOG, an important transcription factor involved in the regulation of blastocyst formation and early lineage segregation. At the early blastocyst stage, in mouse as well as in cattle, the ICM cells have a pepper-and-salt distribution of NANOG and GATA6 [1,3,27]. Later on, the GATA6-positive cells move toward the surface of the ICM to form the hypoblast [1] and the NANOG-positive cells form the epiblast [47]. The mechanisms involved in these movements are currently unknown, but cell adhesion mechanisms are certainly implicated.
To elucidate the function of miR-218 during bovine blastocyst formation, it is imperative to know the exact site of expression in the blastocyst. The RT-qPCR analyses on isolated ICM and TE samples showed that the miR-218 expression in bovine blastocysts is mainly located in the ICM, as also suggested by the WISH results. The expression of miR-218 in the ICM strengthens our belief that miR-218 is a regulator of the epiblast marker NANOG and the cell adhesion component CDH2, not only in an artificial environment, but also in the bovine blastocyst.
To further substantiate the interaction between miR-218 and NANOG, we interfered with the FGF/MAP kinase signaling pathway, as it has been reported that the hypoblast/epiblast lineage segregation in mouse and bovine blastocysts depends on the FGF/MAP kinase signaling pathway [27,48]. Kuijk et al. (2012) reported that it is possible to influence the lineage development in bovine embryos through modulation of the FGF/MAP kinase signaling pathway and that FGF signaling represses the NANOG expression. We interfered with the FGF signaling in bovine embryos by adding exogenous FGF4 to the embryo culture medium and examined the effects on miRNA and target gene expression. If miR-218 regulates the NANOG expression in the bovine blastocyst, it can be expected that FGF4-treated embryos express this miRNA at higher levels than untreated controls. This is indeed what we found: FGF4 addition to the culture medium inhibited NANOG mRNA expression (in agreement with Kuijk et al. 2012) and induced the miR-218 expression significantly compared to the control group (Fig. 6A, D). We did not find significant differences in mRNA expression between the culture groups for CDH2, the other target gene of miR-218 (Fig. 6B), or for the hypoblast marker GATA6 (Fig. 6C). The lack of effect on CDH2 suggests that the regulation of CDH2 is either FGF independent, or that the effects are only at the protein level.
To exclude that the observed changes in NANOG and miR-218 expression were caused by alterations in the ICM cell number or ICM quality, a differential immunofluorescent staining was done on the blastocysts cultured in the presence of FGF4. No differences were observed between the test groups in the ICM/TE ratio, in the ICM/TCN ratio, or in the ACN, confirming that the cause of NANOG expression alteration did not originate in ICM size differences or in lineage-specific changes in apoptosis (Table 6).
In addition to the validated miR-218 targets, we confirmed NOTCH1 as a target gene for miR-449b. NOTCH1 is a member of the Notch transmembrane protein family that shares structural characteristics, including an extracellular domain consisting of multiple epidermal growth factor-like repeats, and an intracellular domain consisting of multiple, different domain types. The Notch signaling pathway is an evolutionarily conserved, but very versatile pathway, operational in many cell types and at various stages during development [49]. In mouse embryos, Notch1 is expressed during all developmental stages from fertilized eggs until the late blastocyst stage [50]. It is also expressed in trophoblast stem cells [51] and mouse models carrying mutations in the Notch signaling pathway display defects in the development of the placenta, suggesting that this pathway is required for placental development.
We are not the first to report on the interaction between miR-449 miRNAs and the Delta/Notch pathway. While our experiments were ongoing, Marcet et al. [52,53] identified NOTCH1 and its ligand Delta-like 1 (DLL1) as miR-449 bona fide targets in the human airway epithelium and Xenopus laevis embryonic epidermis. In both models, miR-449 promoted centriole multiplication and multiciliogenesis by directly repressing the Delta/Notch pathway, demonstrating that Notch signaling must undergo miR-449-mediated inhibition to permit differentiation of ciliated cell progenitors. Mammalian blastocysts do not contain ciliated cells. The only reports regarding cell projections in mammalian blastocysts mention trophectodermal pseudopodia in the blastocoelic cavity connecting the mural TE with the ICM [54]. These pseudopodia have later been characterized as parietal endoderm cells moving from the surface of the ICM facing the blastocoel cavity to line the inner surface of the TE [55]. RhoA/ROCK and vinculin regulate this parietal endoderm outgrowth by distinct pathways. It needs further investigation whether NOTCH1 regulates the formation of these pseudopodia by indirect regulation of the RhoA/ROCK pathway [56], but it is likely not the sole function of miR-449b-based NOTCH1 regulation.
In conclusion, the results of this study broaden our understanding of the importance of miRNAs as regulators of pluripotency and differentiation and expand the network of multiple factors that determine cell fate. Specific miRNAs interact with main transcription factors, thus fine tuning the expression of these transcription factors to regulate the balance between pluripotency and differentiation. We identified miR-218 as an important regulator of NANOG and confirmed miR-449b as a regulator of NOTCH1 in the bovine blastocyst model.
Footnotes
Acknowledgments
This work was supported by the Research Foundation–Flanders (FWO), “[grant numbers 1253810N, G059310N]”.
The authors thank Isabel Lemahieu and Petra Van Damme for their excellent technical assistance in bovine IVP, Sharon Maes for making the luciferase vector constructs, Justine Nuytens for the RT-qPCR analyses and the luciferase assays, and Ruben Van Gansbeke for administrative support.
Part of the work described in this article was presented as a poster presentation on the 3rd Mammalian Embryogenomics Conference (Bonn, Germany) and the 17th International Congress on Animal Reproduction (Vancouver, Canada).
Author Disclosure Statement
The authors declare that they have no competing interests and that no competing financial interests exist.
References
Supplementary Material
Please find the following supplemental material available below.
For Open Access articles published under a Creative Commons License, all supplemental material carries the same license as the article it is associated with.
For non-Open Access articles published, all supplemental material carries a non-exclusive license, and permission requests for re-use of supplemental material or any part of supplemental material shall be sent directly to the copyright owner as specified in the copyright notice associated with the article.