




Abstract
Mesenchymal stromal cells (MSCs) are rare progenitor cells that can be isolated from various tissues. They exhibit multilineage differentiation potential, support regenerative processes, and interact with various immune cells. Therefore, MSCs represent a promising tool for regenerative medicine. However, source-dependent and donor-dependent differences of MSC properties, including implications on their clinical application are still largely unknown. We evaluated MSCs derived from perinatal tissues umbilical cord (UC) and amniotic membrane (AM) in comparison to adult MSCs from bone marrow (BM), which were used as gold standard. We found genetic background-independent differences between MSCs from UC and AM. While AM- and UC-MSCs were closer to each other than to BM-MSCs, they also exhibited differences between each other. AM-MSCs from different donors but not UC-MSCs displayed high interdonor variability. In addition, we show that although all MSCs expressed similar surface markers, MSC populations from UC and AM showed differential profiles of gene expression and paracrine factor secretion to BM-derived MSCs. Notably, pathway analysis of gene expression data revealed intriguing differences between MSCs suggesting that MSCs from UC and AM possess in general a higher potential of immunomodulatory capacity, whereas BM-MSCs showed a higher potential of supporting regenerative processes as exemplified by neuronal differentiation and development. These differences between perinatal and BM-derived MSCs may be relevant for clinical applications.
Introduction
M
Even if MSCs have been isolated from virtually all tissues of the body [7,8], to date the preferred sources remain bone marrow (BM) and adipose tissue (AT) [9,10]. Several alternative adult and perinatal sources have emerged, including umbilical cord (UC) blood [11], UC matrix (aka Wharton's Jelly) [12], amniotic fluid [13], or amniotic membrane (AM) [14]. Many of the perinatal sources, including AM and UC have advantages over adult sources like BM in terms of ease of availability, lack of donor site morbidity, young age of cells, abundance of stem cells in tissues, or high proliferation capacity [15].
However, biological differences of undifferentiated MSCs from different sources for cell therapy applications are not well understood and optimal sources for specific clinical applications still have to be identified [16]. The assumption that all MSCs irrespective of their origin are identical in view of quality and function ignores the fact of their differences in biology and potential therapeutic use which cannot be determined by current ways to define and characterize MSCs in vitro [17]. MSCs are routinely defined in vitro by cell surface antigen expression and differentiation potential also known as minimal MSC criteria proposed by the International Society for Cellular Therapies (ISCT) [18]. However, these minimal criteria are not specific for MSCs and describe shared properties of connective tissue cells [5]. In consequence, in vitro studies comparing MSCs from different sources which mainly elucidated minimal criteria of MSC concluded that MSCs from different sources are similar [19 –21]. It is suggested that a better understanding of functional properties indicating the potential impact on future clinical applications may be achieved by molecular profiling of MSCs [22].
To challenge the hypothesis that MSCs from various sources are biologically different, it was the goal of this study to evaluate biological differences of MSCs derived from perinatal tissues UC and AM in comparison to adult BM-MSCs. Therefore, cells from UC and AM with the same genetic background, that is, both tissues derived from same donor, and BM from independent donors were used. This is the first study directly comparing human MSCs from UC and AM with the same genetic background in comparison to BM. MSCs from different sources were systematically characterized to assess expression of an extended panel of surface markers, colony formation capacity, and profiling of paracrine factor secretion and gene expression in addition to minimal criteria for defining MSCs. The panel of genes for expression analysis was specifically compiled to address biological differences of MSCs and includes genes associated with immunomodulatory, regenerative/reparative, homing, and other cellular properties. Gene expression analysis was used to determine relationship of MSCs from different sources by hierarchical clustering and principal component analysis (PCA). In addition, pathway analysis was applied to determine differentially regulated cellular functions and pathways because these differences may be relevant for clinical applications.
Materials and Methods
Isolation of MSCs from UC, AM, and BM
UCs and AMs were obtained from the Red Cross Blood Transfusion Service of Upper Austria from human term placentas during caesarian section. BM from healthy volunteers was purchased from Lonza. Donors signed a written informed consent approved by ethical committees.
AM-MSCs were isolated according to Marongiu et al. [23] and Kita et al. [24] with modifications. Briefly, the AM was weighted, washed, and cut into pieces. To release AM epithelial cells, the tissue was digested in a solution of 0.05% trypsin/ethylenediaminetetraacedic acid (EDTA) (Life Technologies) containing 25 μg/mL DNAse I (Sigma-Aldrich) for 1 h at 37°C in a shaking water bath. Digested AM was washed four times in cold Hank's balanced salt solution (HBSS; Lonza) and digested in Eagle's minimal essential medium (Lonza), 265 U/mL Collagenase CLS I (Biochrom), and 25 μg/mL DNAse I (Sigma-Aldrich) for 45 min to 1.5 h until completely dissociated. Released AM-MSCs were sedimented at 300 g for 5 min at room temperature, washed in HBSS (Lonza) and plated at a density of 20,000 cells/cm2 in standard culture medium (Lonza), 10% fetal bovine serum (FBS) from a selected lot (Life Technologies), Penicillin (100 U/mL)/Streptomycin (100 μg/mL; Life Technologies), and Glutamax (1×; Life Technologies).
UC-MSCs were isolated according to Seshareddy et al. [12] with modifications. Briefly, UC was weighted and cut into pieces. The cord pieces were digested in 1 mL Dulbecco's phosphate buffered saline (DPBS) without Ca2+and Mg2+ (Lonza), 530 U/mL Collagenase CLS I (Biochrom), 674 U/mL Hyaluronidase (Applichem), and 25 μg/mL DNase I (Sigma-Aldrich) for 6 h at 37°C in a shaking water bath and washed cells were plated at 20,000 cells/cm2 in standard culture medium.
BM-MSCs were isolated according to Pittenger et al. [9] by density gradient centrifugation. The mononuclear cell (MNC)-enriched fraction was seeded at a density of 200,000 cells/cm2 in standard culture medium.
Expansion of MSCs from UC, AM, and BM
One day (for UC and AM) or 2–3 days (for BM) after isolation, medium was exchanged to get rid of cellular debris and non-adherent cells; BM cultures were washed thrice with DPBS before first medium exchange. Subsequently, medium was exchanged every 3 or 4 days. Cells were detached using 0.05% Trypsin/EDTA (Life Technologies) when 70–90% confluence was reached and reseeded at a density of 500–1,000 cells/cm2.
Histological staining
UC and AM were fixed for 24 h in 10% neutralized formalin solution and embedded in paraffin. Four microns thick sections were cut and mounted on Superfrost Plus slices (Gerhard Menzel GmbH). For conventional light microscopy, sections were stained with hematoxylin and eosin by standard method.
Colony forming unit-fibroblast efficiency assay
Colony forming unit-fibroblast (CFU-F) efficiency assay was performed as previously described for BM-MSCs [25] with modifications to adjust the assay to AM and UC. After isolation of cells from AM or UC, viable cells were seeded as follows: For UC, 300, 3,000, or 10,000 cells of each donor; for AM, 300, 1,000, or 3,000 cells of each donor were seeded in six-wells. For BM, 4,000, 40,000, or 400,000 MNCs of each donor were seeded in six-wells. Cultures of different seeding densities were observed microscopically and only cultures with appropriate colony growth (15–75 colonies per six-well) were selected for further evaluation. Cultures were grown for 7–14 days and stopped before colonies began to merge. Cultures were fixed and stained with methylene blue solution (Fluka) for 30 min. Colonies were counted under the microscope by two independent persons. A colony was defined as (pre-)confluent area of at least 50 cells. CFU-F efficiency was calculated as ratio of number of cells forming colonies and total number of cells seeded.
Karyotyping of UC- and AM-MSCs
Cytogenetic analyses were performed using four sets of whole genome painting probes. Set 1: wcp1, wcp2, wcp3, wcp14, wcp15, wcp21 Set2: wcp5, wcp7, wcp8, wcp10, wcp16, wcp18 Set3:wcp4, wcp6, wcp9,wcp11, wcp12, wcp13 Set4:wcpX, wcpY, wcp17, wcp19, wcp20, wcp22.
Each set consisting of the six respective combinational labeled probes, labeled with Biotin/Avidin-Alexa488, dioxigenin/mouse anti dig-Cy3 and Texas red resulting in false colors. Metaphase chromosome preparation has been performed using standard colcemid protocols. 51–62 metaphases were analyzed for each cell preparation.
Flow cytometric analysis
Approximately 100,000 MSCs suspended in 100 μL of DPBS/2% FBS were incubated with 1 μg of the specific antibody or corresponding isotype control (Supplementary Table S1; Supplementary Data are available online at
Tri-lineage differentiation of MSCs
MSCs from UC, AM, and BM were differentiated into adipocytes, osteoblasts, and chondrocytes after three passages as previously described [9] with modifications. Briefly, for adipogenic or osteogenic differentiation, MSCs were seeded into 12-well plates at 20,000 cells/cm2 and maintained in standard culture medium until confluence. Cells were exposed to adipogenic induction medium (Lonza) or osteogenic induction medium (Lonza) for 2 and 2–3 weeks, respectively. Cells were fixed in 4% formaldehyde. To assess adipogenic differentiation, lipid droplets of differentiated cells were stained using Red Oil O (Sigma-Aldrich). To assess osteogenic differentiation, cells were stained with Alizarin Red S (Sigma-Aldrich). Control cells were maintained in standard culture medium over the same time period. For chondrogenic differentiation, 250,000 MSCs were centrifuged for 5 min at 150 g in a 15 mL conical, Polypropylene-based centrifugation tube (BD Biosciences). The resulting pellet was cultivated in complete chondrogenic medium (Lonza) for 3 weeks. Control pellets were cultivated in standard culture medium for 3 weeks. After 3 weeks, pellets were fixed in 4% formaldehyde and embedded in paraffin. Sections were slide-mounted and stained with Alcian Blue (Fluka).
Quantification of secreted factors
Culture supernatants were generated as follows. Cells were seeded in standard culture medium at a density of 50,000 cells/cm2. After 24 h, cells were washed twice with standard culture medium w/o FBS. Cells were either stimulated or not with 20 ng/mL tumor necrosis factor-alpha (TNF-α; Roche Applied Science) and 20 ng/mL interferon-gamma (INF-γ; Roche Applied Science) in standard culture medium w/o FBS. After additional 24 h, supernatants were collected. Debris was sedimented for 10 min at 1,000 g, 4°C. Hepatocyte growth factor (HGF), basic fibroblast growth factor (b-FGF), vascular endothelial growth factor (VEGF), monocyte chemotactic protein-1 (MCP-1), stromal cell-derived factor 1-alpha (SDF-1a), interleukin 1 receptor antagonist (IL-1ra), and macrophage colony-stimulating factor (M-CSF) were quantified using the respective Bio-Plex assay (Bio-Rad) according to manufacturer's protocol. Differences were declared as significant if P-value determined using Wilcoxon-Mann-Whitney-test was ≤0.05.
RNA isolation and real-time reverse transcription-polymerase chain reaction (RT-PCR)
Total RNA was isolated from MSCs with “High Pure RNA Isolation Kit” (Roche Applied Science) according to manufacturer's protocol. Quality of RNA was controlled with Agilent 2100 bioanalyzer. cDNA was transcribed using “Transcription First Strand cDNA Synthesis Kit” (Roche Applied Science) according to manufacturer's protocol. Real-time RT-PCR was performed on LightCycler 480 (Roche Applied Science) with an annealing temperature of 60°C using customized RealTime ready 384 Panel (Roche Applied Science) with configuration according to Supplementary Table S2. Relative mRNA levels were normalized to the expression of eight previously experimentally selected housekeeping genes and calculated with the 2−ΔΔCt method using GenEX 5.4 software (MultiD).
Pathway enrichment analysis
“Ingenuity Pathway Analysis” software (Ingenuity Systems, summer release 2012) was used for pathway analysis. Core analysis was used with focus on functions and canonical signaling pathways. Briefly, for a given function or pathway a statistical significance of enrichment is calculated using Fisher's exact test based on the number of genes represented in the input data set and the total number of genes being assessed in the experiment. Pathway or function was determined as significant if P-value of enrichment was ≤0.05.
Results
MSCs could be isolated from UC and AM with the same success rate and similar yields
Approximately 9–20 g UC or 20–31 g AM from term placenta was used as raw material. UC is composed of blood vessels, perivascular tissue and connective tissue containing endothelial, smooth muscle, myofibroblast-type, stromal, epithelial, and others cells (Fig. 1A left panel, [26]). In contrast to UC, AM tissue consists only of two cell layers, an epithelial cell monolayer and the amniotic mesoderm (Fig. 1A right panel, [27]). Isolation of cells from both sources resulted in a comparable yield of ∼1.4 million single cells per gram tissue (Fig. 1B). MSC cultures from UC and AM could be established with a 100% success rate as also reported for MSCs derived from BM or AT. Lower success rates have been reported for other sources like UC blood [20].

Original raw material, MSC isolation yield and MSC doubling time.
Similar frequency of MSCs in both tissues with high variability in AM
Since CFU-Fs are considered to be the closest approximation to estimate the frequency of MSCs [25], UC and AM proved to be rich sources of MSCs. Typical CFU-F efficiency for BM-MSCs ranges from 0.001% to 0.01% based on mononuclear cells present in BM harvests as found in our (Table 1) and other laboratories [9,28,29]. In cell isolates from five different donors of UC, 0.2–1.8% CFU-Fs developed in cultures (Table 1). In cells isolated from AM, less than 0.03 to more than 33.3% CFU-Fs developed. Thus, CFU-F efficiency of UC or AM was 25 to more than 6,600-fold higher than of BM. Data indicate that donor variability with respect to MSC frequency in UC was less pronounced than in AM.
The closest approximation to estimate the frequency of MSCs derives from the CFU-F efficiency assay. CFU-F efficiency (%) represents the ratio of number of cells forming colonies under clonal conditions and number of cells seeded directly after isolation of cells from UC, AM, or BM. Data show mean values±standard deviations (n=6).
AM-derived cells from donor 1 did not form colonies at the highest cell density of 3,000 cells/cm2, that is, CFU-F efficiency was less than 1/3,000 (<0.03%).
AM-derived cells from donor 3 formed more than 100 colonies at the lowest cell density of 300 cells/cm2, that is, CFU-F efficiency was higher than 100/300 (>33.3%).
CFU-F, colony forming unit-fibroblastic; AM, amniotic membrane; BM, bone marrow; UC, umbilical cord; n.d., not determined; MSCs, mesenchymal stromal cells.
MSCs from UC and AM showed different growth characteristics and morphology
UC-MSCs showed spindle-like shape cell morphology from passage 0 (P0) to P3 which is typical for MSCs (Fig. 2). Although UC tissue composition is more heterogeneous (Fig. 1A), cells with different morphologies were visible only during the first 2–3 days in culture (data not shown). These cells disappeared or were overgrown during P0 (data not shown). In contrast, AM-MSCs showed a star shape-like morphology with very few contaminating epithelial like cells during P0 (Fig. 2). Morphology changed to very large and flattened cells at the end of P0 or beginning of P1. From P2 onwards, the cells showed again morphology of small spindle-like cells. Doubling time of MSCs from five different donors over three passages ranged from 20–52 h for UC-MSCs and 17–210 h for AM-MSCs (Fig. 1C). According to the stable morphology observed, doubling time of UC-MSCs was similar from P0 to P3. Notably, AM-MSCs showed a significantly elevated doubling time in P1 which is associated with cell size enlargement as described above (Fig. 2). In later passages (P4–P11), doubling time was stable and comparable for both sources before cells of all evaluated donors entered a stage of replicative senescence and stopped dividing latest at P11(data not shown).

Morphology of MSCs isolated from UC and AM. Representative phase contrast microscopic pictures from cultivated MSCs in P0, P1, and P3 are shown. Scale bar=300 μm. Squares indicate epithelial-like cells. d, day after isolation; P, passage.
Normal karyotype of MSCs from UC and AM after expansion
Cytogenetic analyses of UC- and AM-MSCs from five donors after P3 were performed using fluorescence in situ hybridization with 24 fluorescently-labeled probes. With this technique non-clonal chromosomal aberrations were detected in MSCs from each two donors of UC and AM (Supplementary Table S3). These aberrations were detected each in one out of 54–62 metaphases and are considered as non-significant background or technical artifacts as commonly accepted [30].
Phenotypic characterization revealed similar surface marker expression for MSCs from UC, AM, and BM
In vitro cultivated MSCs from UC and AM from five different donors as well as BM-MSCs showed the classical MSC phenotype as defined by ISCT [18]. A more comprehensive surface marker analysis with a panel of additional markers also demonstrated a uniform phenotype (Table 2 and Supplementary Fig. S1 A, B).
BM-MSCs were derived from three different donors and analyzed in passages 1–4. Expression levels on BM-MSCs represent an average of data from two to five samples.
ISCT criteria, minimal criteria for MSCs from International Society of Cell Therapy [17]; HLA-DR, human leucocyte antigen; HER1/2, human epidermal growth factor receptors; MCSP, melanoma associated chondroitin sulfate protein; c-Met, hepatocyte growth factor receptor;−, mean fluorescence intensity (MFI) ratio of sample/isotype control <2; +, MFI ratio of sample/isotype control >2<10; ++, MFI ratio of sample/isotype control >10<50; +++, MFI ratio of sample/isotype control >50. Gray, MFI ratio >2; white, MFI ratio <2 or not determined (n.d.).
UC-, AM-, and BM-MSCs showed both similar expression levels of MSC-characteristic surface markers (CD73, CD90 and CD105) and absence of leucocyte, B-cell, hematopoietic cell, or monocyte/macrophage markers (CD45, HLA-DR, CD19, CD34, CD14). Additional surface markers were selected based on recent publications or implicated functional relevance for cell migration, immunologic activity or phenotypic relevance for cell characterization. UC- and AM-MSC stained positive for integrin subunit alpha4/CD49d [27,31], coagulation factor III/CD142 [32], melanoma cell adhesion molecule MCAM/CD146 [33,34], activated leukocyte cell adhesion molecule ALCAM/CD166 [9], Orexin receptor type 2 Ox2/CD200 [35], WNT family protein frizzled 9/CD349 [36], human epidermal growth factor receptors HER1 and HER2 [36], melanoma-associated chondroitin sulfate protein MCSP [37], hepatocyte growth factor receptor c-Met [38,39] and negative for platelet endothelial cell adhesion molecule PECAM/CD31 [40], macrophage stimulating 1 receptor/CD136 [41], angiotensin converting enzyme/CD143 [42] and nerve growth factor receptor NGFR/CD271 [43]. In summary, expression level of all surface markers was comparable between MSCs from UC and AM and donor variance was very low for both sources. Comparing perinatal sources with BM, the expression of surface markers was similar. Only expression of CD49d was lower on BM-MSCs as compared to MSCs from perinatal sources as already shown by others [44].
Interestingly and in accordance with others, UC- and AM-MSCs showed a less pronounced HLA-DR expression than BM-MSCs after stimulation with TNF-α and INF-γ (Supplementary Fig. S1C) [45,46].
MSCs from UC showed tri-lineage differentiation potential, whereas the differentiation of AM-MSCs was ambiguous
After induction, with the respective induction media, UC- and AM-MSCs differentiated on a low level into adipocytes and osteoblasts in contrast to BM-MSCs which showed a relatively higher differentiation potential (Fig. 3). UC-MSCs from all five donors differentiated into all three induced lineages (adipocytes, osteoblasts and chondroblasts). AM-MSCs from donor 1 showed no differentiation potential, donor 2 showed only differentiation into chondroblasts, donor 3 and 4 showed trilineage differentiation and donor 5 showed only osteogenic differentiation potential (data not shown).
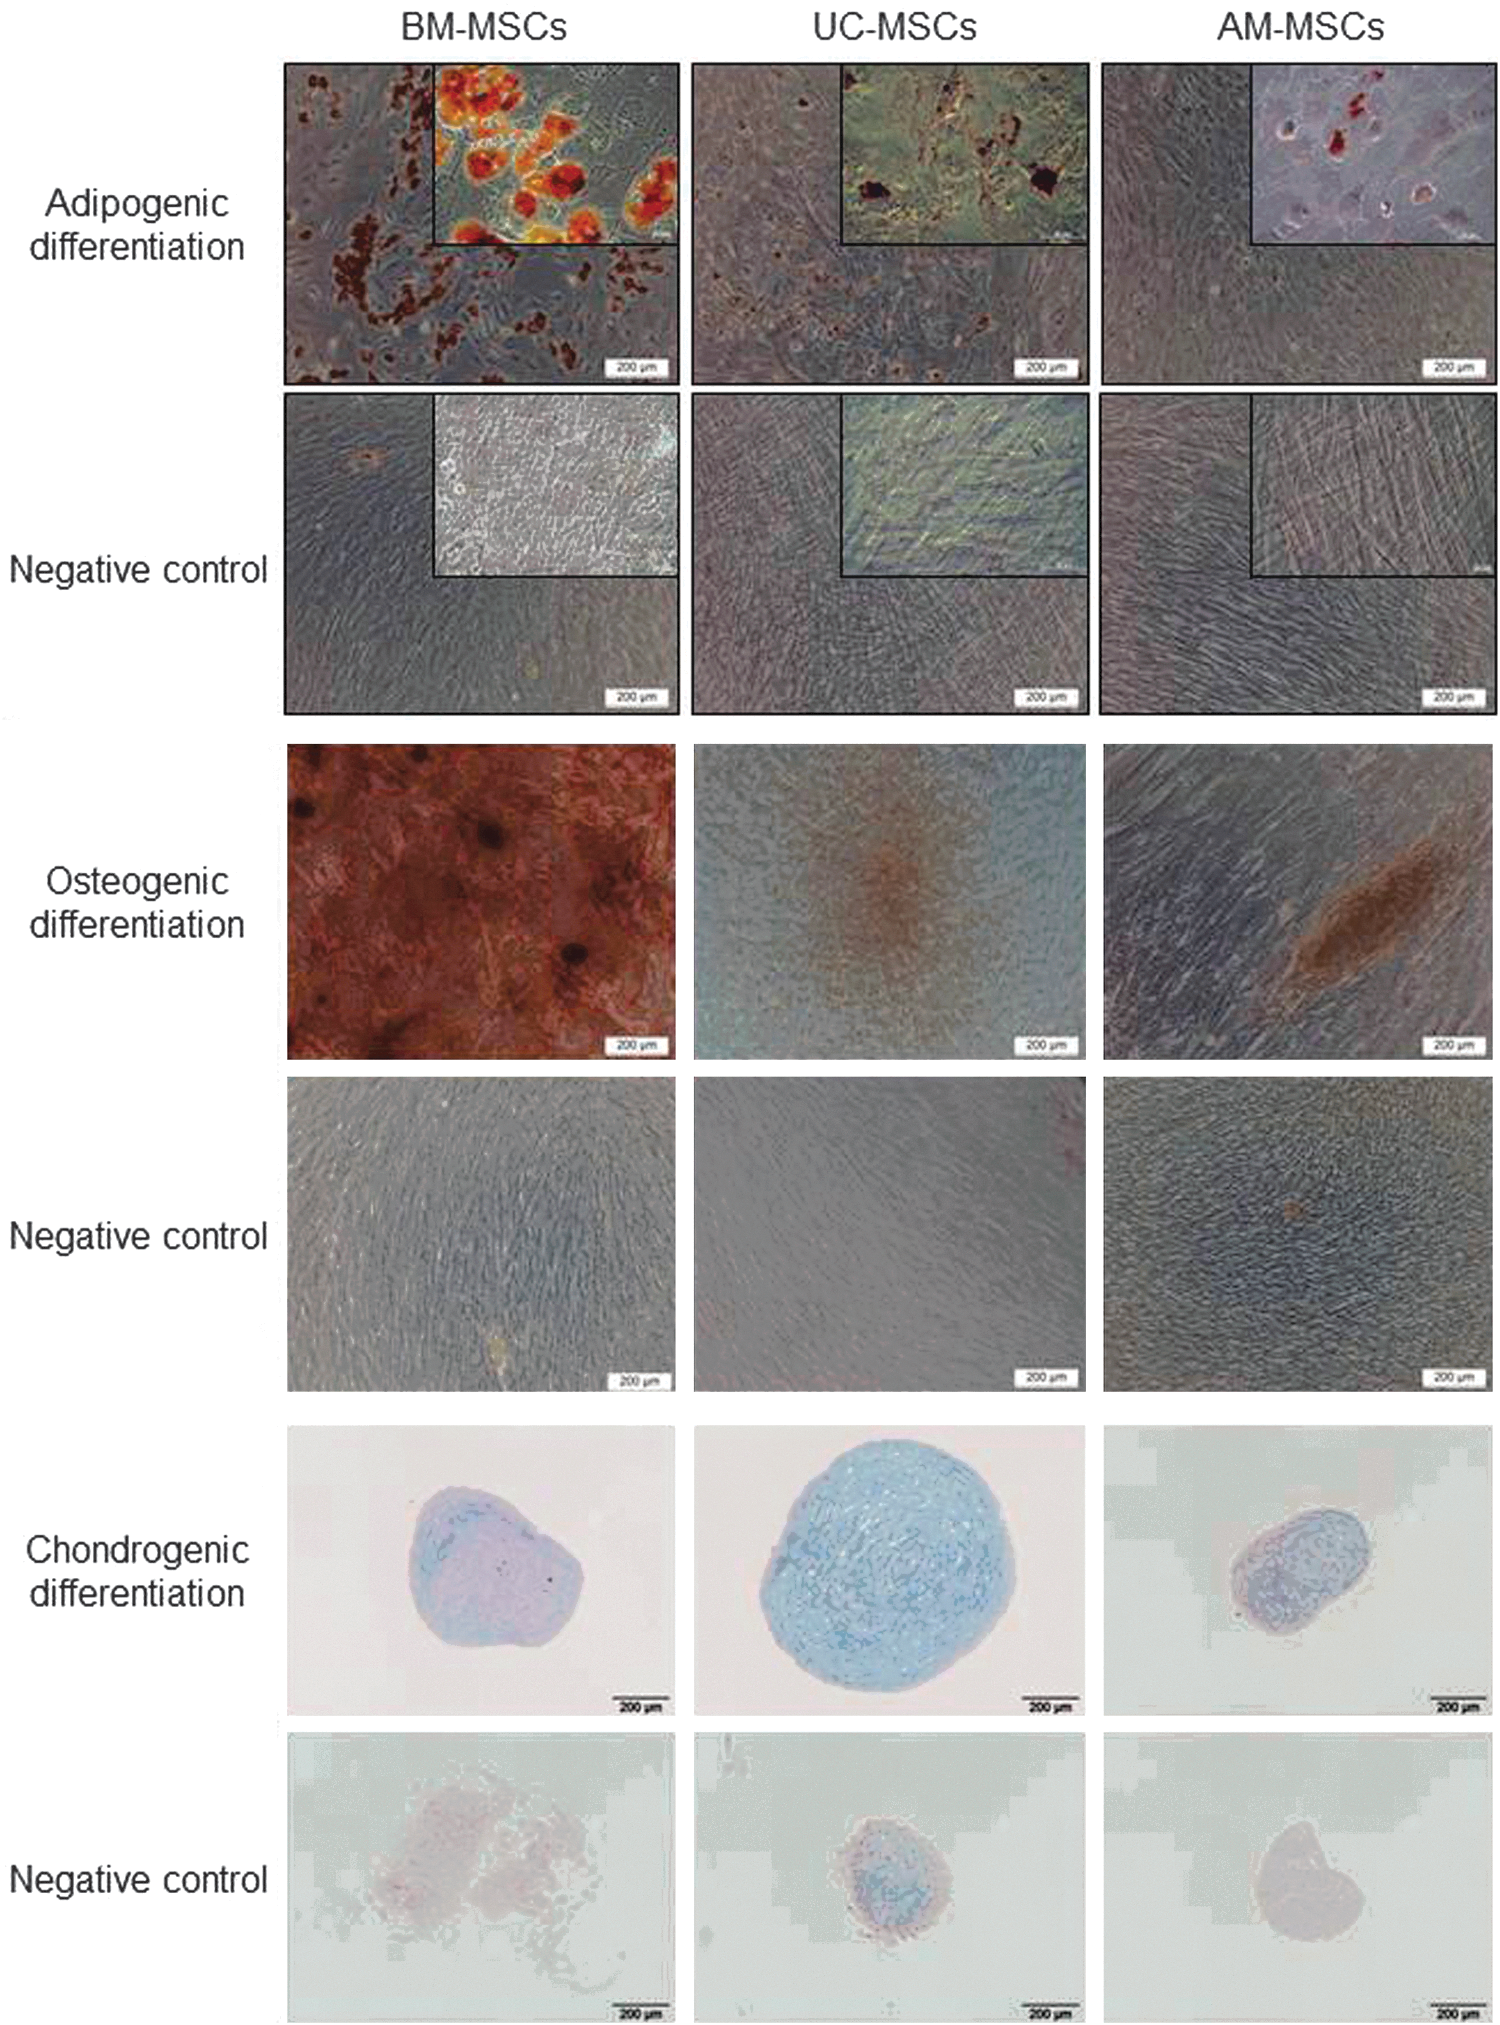
Multiple differentiation potential of UC- and AM-MSCs in comparison with BM-MSCs. Representative phase contrast microscopic pictures or pellet sections of BM-, UC- and AM-MSCs differentiated into adipogenic (UC/AM from donor 4), osteogenic (UC/AM from donor 5) or chondrogenic (UC/AM from donor 4) lineages are shown. Samples were stained with Red Oil O indicating lipid depositions, Alizarin Red S indicating calcium phosphate precipitates or Alcian Blue indicating cartilage proteoglycans. Higher magnifications shown in insets.
MSCs from different sources show distinctive secretion patterns of selected growth factors and cytokines
To assess differences between UC-and AM-MSCs regarding the release of paracrine factors with antiapoptotic, immunomodulatory, antifibrotic, angiogenic, chemoattractive, and hematopoiesis-supportive effects, the following factors were quantified using a bead-based multiplex immunofluorescence system: HGF, b-FGF, VEGF, MCP-1, SDF-1a, IL-1ra, and M-CSF. These factors have been selected as they were shown to be secreted by MSCs and/or to mediate MSC effects in in vitro or in vivo studies [47 –49]. UC-MSCs showed the highest secretion of HGF and lowest secretion of VEGF (Fig. 4). MSCs from all sources showed no pronounced differences regarding levels of b-FGF. M-CSF secretion from stimulated cells was significantly higher from perinatal MSCs and IL-1ra and SDF-1a was significantly lower as compared to BM-MSCs. MCP-1 secretion from nonstimulated MSCs was significantly higher from perinatal MSCs than from BM-MSCs.
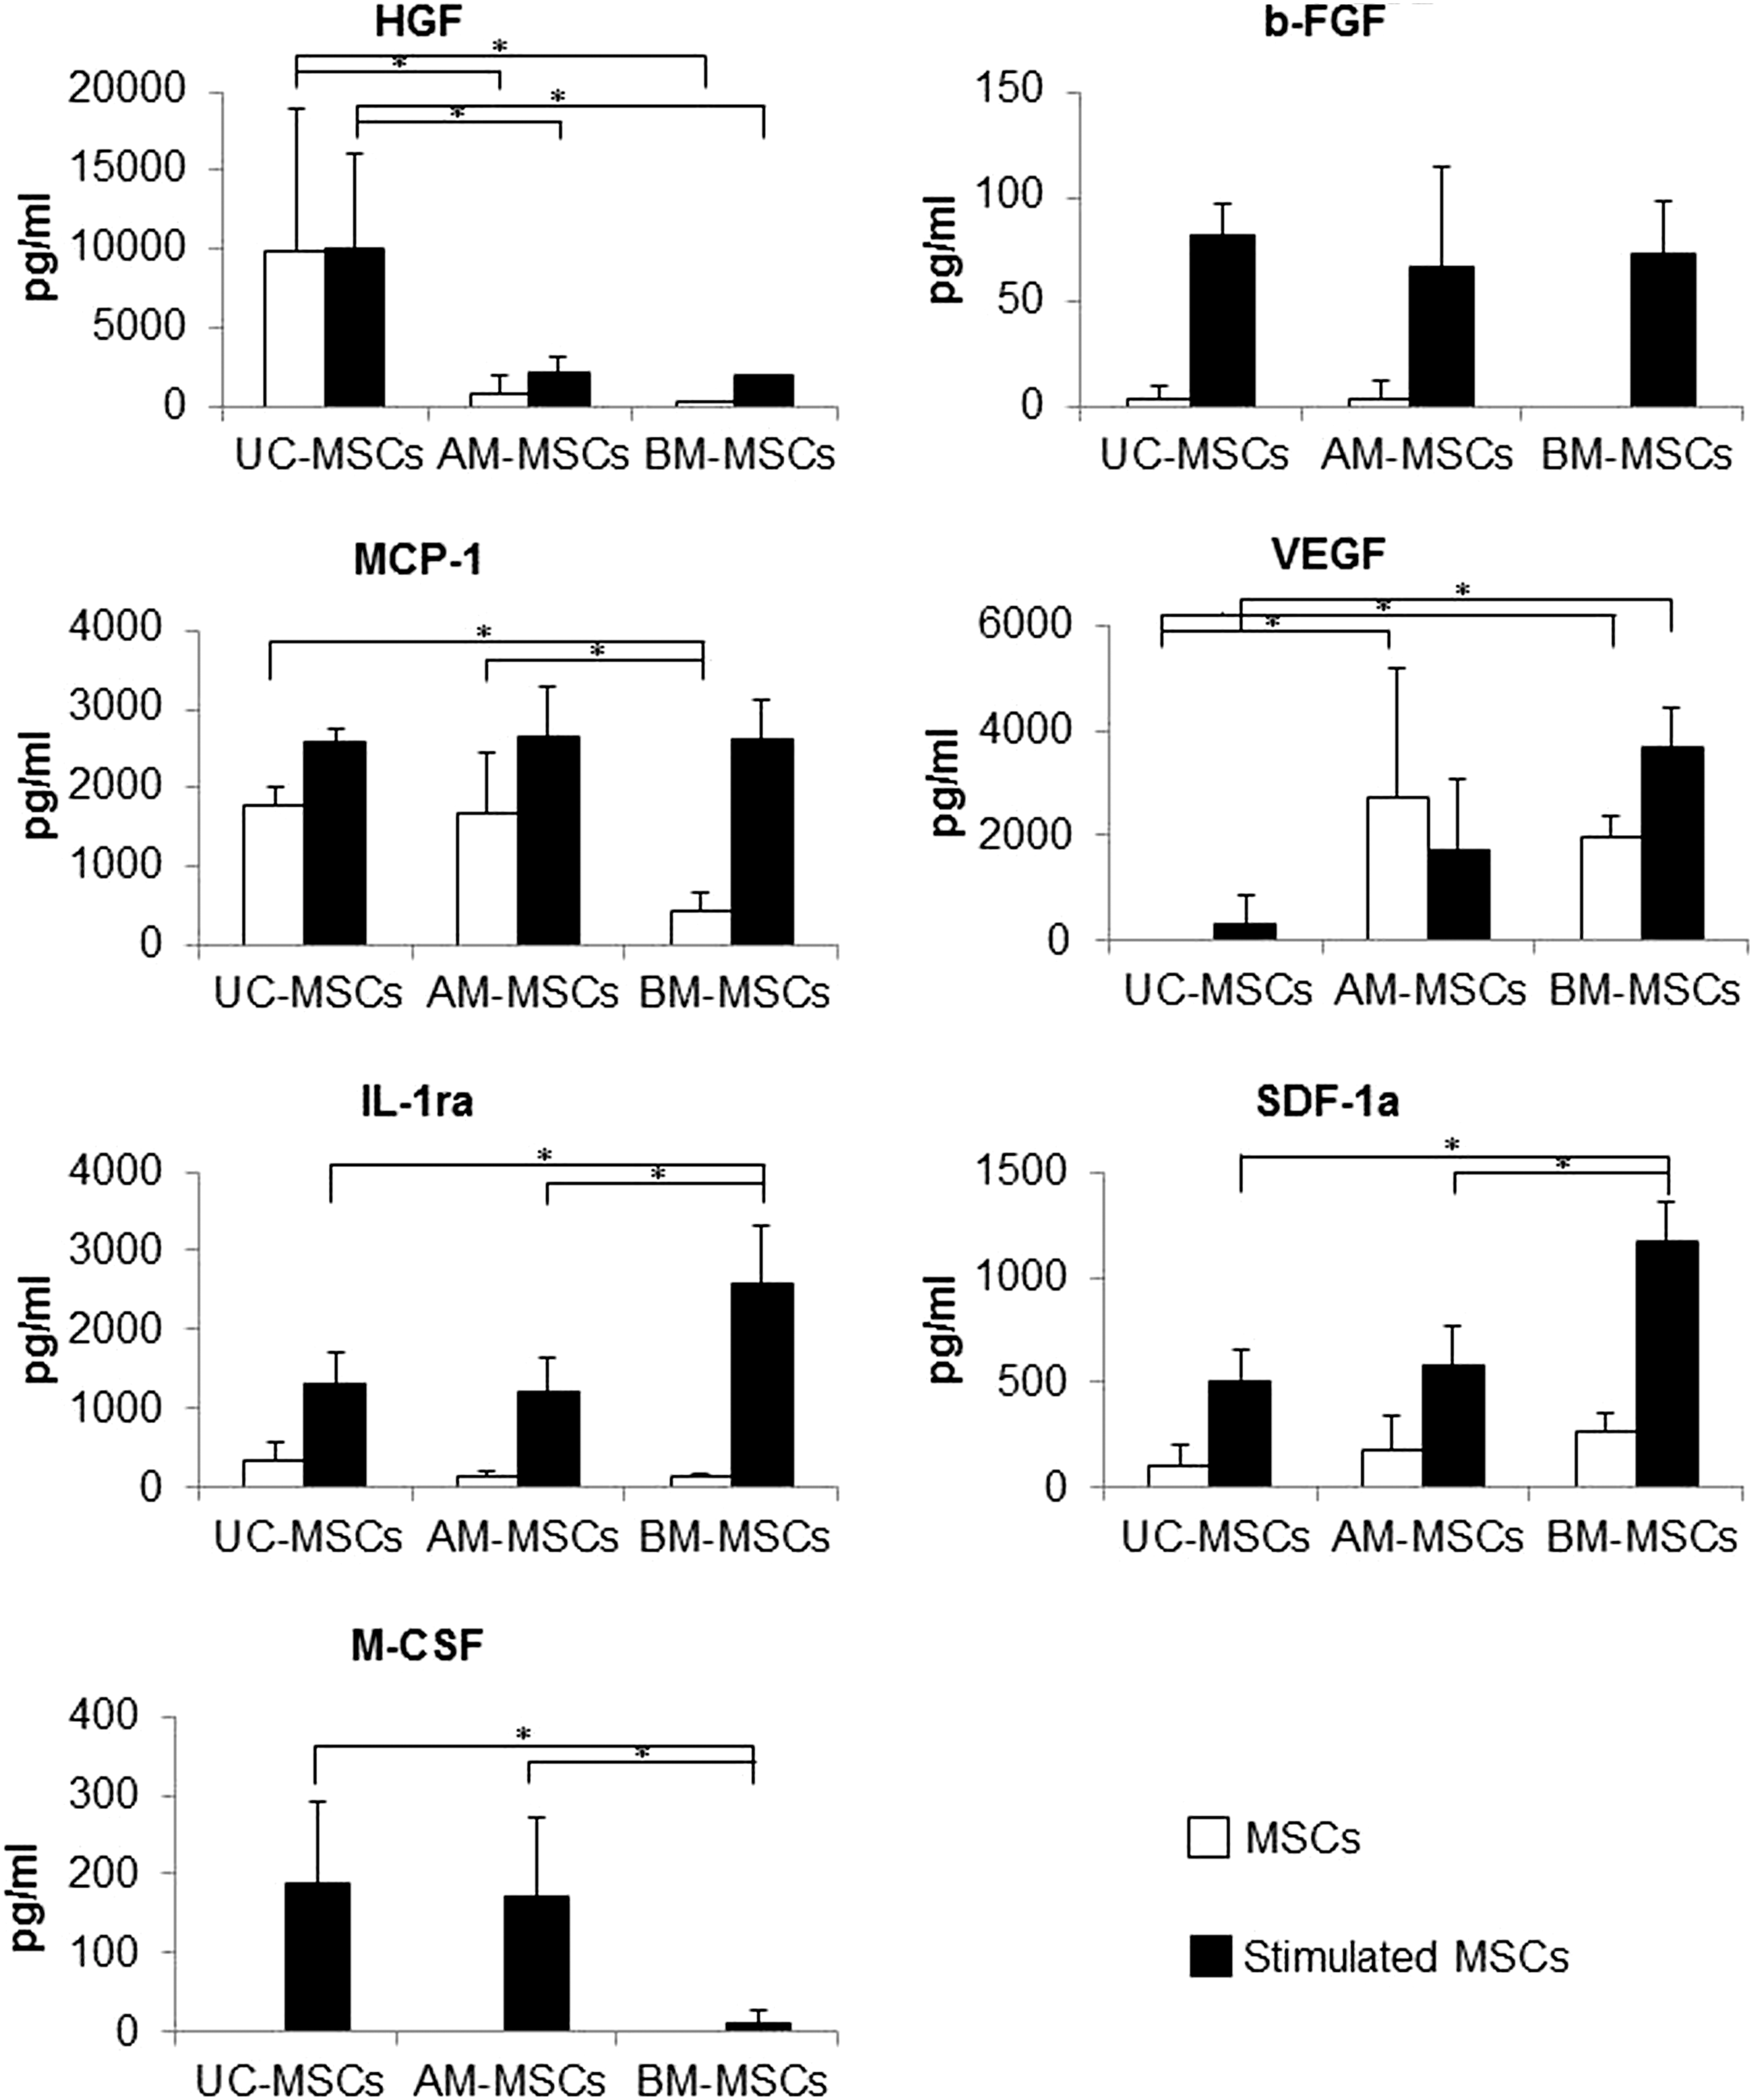
Analysis of secreted growth factors and cytokines. Concentrations of factors secreted by UC-, AM, and BM-MSCs (n=5 donors) with and without stimulation with tumor necrosis factor-alpha and interferon-gamma are shown. Differences regarding the three sources were declared as significant and labeled with a star if P-value determined using Wilcoxon-Mann-Whitney-test were ≤0.05. b-FGF, basic fibroblast growth factor; HGF, hepatocyte growth factor; IL1-ra, interleukin 1 receptor antagonist; MCP-1, monocyte chemotactic protein-1; M-CSF, macrophage colony-stimulating factor; SDF-1, stromal cell-derived factor-1; UC, umbilical cord; VEGF, vascular endothelial growth factor. *p<0.05.
Distinct gene expression pattern in MSCs of different origin
To reveal a more comprehensive insight in functional diversity and the potential therapeutic applicability of MSCs and to differentiate between source and donor variability, cells of all sources were analyzed regarding the expression levels of a set of genes using real-time RT-PCR assays. The selected gene panel is composed of 371 genes associated with immunomodulatory, regenerative/reparative, homing, and other cellular properties.
PCA and unsupervised hierarchical clustering were performed to explore the relationship between MSCs from UC-, AM- and BM-MSCs based on the gene expression data. Both analyses showed separation between BM-MSCs and MSCs of the two perinatal sources suggesting a closer functional relationship of the latter two (Fig. 5A, B). The PCA plot illustrates the similarity and dissimilarity of gene expression profiles regarding the selected gene set between all investigated populations in a plane dimension. Here the distance between the samples visualizes the degree of variability. BM-MSCs clustered far apart from MSCs from perinatal sources. UC-MSC are more distributed but still cluster together, whereas high donor variability of AM-MSCs inhibited clear separation from UC-MSCs but still allowed separation from BM-MSCs.

Gene expression pattern analysis of UC-, AM- and BM-MSC.
Subsequent pathway analysis on differentially expressed genes was performed to determine differences in function and potential therapeutic applicability between the three sources (Fig. 5C). AM-MSCs and UC-MSCs were compared to BM-MSCs and differentially expressed genes were identified (Supplementary Table S4). These genes were correlated with several pathways according to Ingenuity® database. Although more genes were significantly differentially expressed in UC-MSCs than in AM-MSCs as shown in the Venn diagram (UC-MSC=171; AM-MSCs=100; Fig. 5C), deregulated genes in both cell types contributed to the same pathways. Mainly two biological systems were affected. Genes correlated with functions in neuronal differentiation and/or development showed a decreased expression and genes correlated with a loss of neuronal potential were increased in perinatal MSCs. In detail, NGR1 and PPRAG as well as important neurotrophins like NGF, GDNF, and NTF3 were significantly decreased in their expression (Fig. 5D, right panel). In contrast, mRNA levels of genes associated with immune system development and function like IL-8, IL-1B, CXCL2, CXCL3, and TNFAIP6 were significantly increased in AM- and UC-MSCs compared to BM-MSCs (Fig. 5D, left panel). The lower number of significantly differentially expressed genes versus BM in AM than in UC was again due to the higher donor variability in AM-MSCs.
Discussion
In this study, MSCs originating from the perinatal tissues AM and UC from same donors were compared and related to adult MSCs derived from BM of healthy volunteers. Profiles of paracrine factor secretion and expression of selected genes in conjunction with pathway analysis revealed that UC and AM are distinctly different from BM. The relation between UC and AM was close but also ambiguous due to high interdonor variability of AM-MSCs. In summary, this study results in the following major conclusions:
First, we found genetic background-independent differences between MSCs from UC and AM. Data suggests that while AM and UC-MSCs are closer to each other than to BM-MSCs, they also exhibited differences between each other: AM-MSCs from different individuals but not UC-MSCs displayed high interdonor variability. The interdonor variability of AM-MSCs may be explained by the unclear and variable identity of these cells since only two of the five AM-MSC preparations adhered to minimal criteria for the definition of MSCs. The identity of cells from AM not fulfilling MSC criteria remains elusive. Hence, the superior consistency and the more evident identity of UC-MSC preparations from different donors suggest UC-MSCs as a more reliable candidate for regenerative medicine applications.
Second, we show that perinatal MSCs and BM-MSCs are not identical in terms of their biological properties. Although MSCs from all sources were found to express similar surface markers, perinatal MSCs revealed higher potential of immunomodulatory capacity than BM-MSCs based on gene expression profiling. In addition, gene expression analysis suggests that BM-MSCs showed an elevated expression of genes associated to neuronal function. These findings may be relevant for future clinical applications of MSCs from different sources.
MSCs from UC and AM have been isolated using protocols based on enzymatic digestion of tissues [12]. UC-MSCs have been isolated from different compartments of the UC, such as Wharton's Jelly, perivascular region, or the outer amniotic lining [12,26,46], whereas AM-MSCs are routinely isolated from the mesodermal layer of AM [50]. As different tissues require different isolation protocols, this study could not elucidate if observed differences in MSC characteristics from UC and AM are due or in part due to the different isolation protocols used. However, we used state of the art protocols for isolation of UC-MSCs and AM-MSCs.
Gene expression analysis revealed that UC and AM are distinctly different from BM. The relation between UC and AM was close but not clearly determinable due to high interdonor variability of AM-MSCs, which was obvious regarding growth rates, colony formation capacity, differentiation potential, and gene expression. In this respect, it is important to consider that UC and AM were derived from the same donors, that is, MSCs had the same genetic background. This leads to the conclusion that there are differences between UC and AM as source, which are independent of the genetic background. A higher heterogeneity of isolated cell types would theoretically be predicted for UC due to a more complex tissue organization. However, the high level of interdonor variability of AM-MSCs may be traced back to the fact that only two of five AM cell preparations fulfilled minimal MSC criteria, that is, cell preparations contained other cell types to a certain extent. Other cell types than MSCs potentially present in AM cultures include fibroblast-type cells or amniotic epithelial cell (AEC)-derived cells. Cells from AM not fulfilling MSC criteria may simply be fibroblast-type cells which have been reported to be resident in AM [15], express MSC surface markers as defined by ISCT, and possess limited or no multi-lineage differentiation capacity [51], which is in accordance to our findings. Moreover, fibroblasts have immunosuppressive properties comparable to MSCs [52]. Otherwise, those non-MSC cells may derive from a limited number of contaminating AECs which were not removed in the first enzymatic digestion step of the isolation procedure. Pratama et al. have reported phenotypic changes in cultured AECs consistent with an epithelial–mesenchymal transition (EMT) [53]. These mesenchymal-type cells exhibited some properties typical for MSCs. Depending on the progression of the EMT process, cells might or might have not adopted MSC characteristics. Presence of other cell populations in AM has also been reported by Magatti et al. suggesting that cells with characteristics of human monocytes reside within the mesodermal layer of AMs [54]. Thus, further research is required to better understand the cellular composition of AM.
We found that perinatal MSCs revealed higher potential of immunomodulatory capacity than BM-MSCs based on profiling of secretion of paracrine factors and expression of selected genes in conjunction with pathway analysis and, vice versa, BM-MSCs exhibited a higher expression of genes associated with neuronal function. Immunomodulatory effects of MSCs have been first described one decade ago based on the observation that BM-MSCs can suppress T-cell proliferation [55,56]. By now, it is commonly acknowledged that MSCs can interact with cells of both the innate and adaptive immune systems resulting in modulation of effector functions (as reviewed in [6,57]). Although the majority of data on immunomodulatory effects of MSCs is derived from BM-MSCs, some of these effects have also been described for MSCs from perinatal sources. MSCs from different perinatal sources have been shown to suppress T cell proliferation [54,58]. In contrast, interactions of perinatal MSCs with other cell types of the innate and adaptive immune systems are largely unknown with only limited number of reports available [59 –61]. Results from studies comparing inhibitory effects of adult and perinatal MSCs on T cell proliferation are controversial. On the one hand, studies conclude that adult and perinatal MSCs show similar effects on T cell proliferation [62,63]. On the other hand, Chang et al. [45] and Deuse et al. [46] demonstrated that perinatal MSCs have a higher capacity of inhibiting T cell proliferation than adult MSCs. These controversies may be caused by the usage of different isolation and cultivation protocols, different methods to characterize cells and different assays to assess immunomodulatory properties of MSCs.
Besides gene expression data indicating a higher immunomodulatory potential of perinatal MSCs, we detected higher levels of HGF, MCP-1, and M-CSF in supernatants of UC-MSCs and/or AM-MSCs as compared to BM-MSCs. Regarding immunomodulation, these three proteins have been reported to be involved in effects of MSCs on DC differentiation (M-CSF) [64], induction of Tregs (MCP-1) [65], or inhibition of T cell proliferation (HGF) [56]. In contrast, the cytokine IL-1ra was the only factor associated with anti-inflammatory and antifibrotic effects of MSCs [47], which was secreted significantly higher by BM-MSCs compared to perinatal MSCs.
Another finding of this study is the down-regulation of genes associated with neuronal differentiation and/or development and up-regulation of genes correlated with a loss of neuronal potential in perinatal MSCs compared to BM-MSCs. A close relationship of neuronal cells and BM-MSCs has been proposed based on two reasons: (1) undifferentiated BM-MSCs have been shown to express various neuronal markers [66] and (2) neural crest has been discussed to be one of the developmental origins of MSCs in the adult BM [67,68]. The origin of the perinatal MSCs and their local functions in vivo may be the cause of the differential gene or protein expression. Cells from placenta and fetal membranes derive from tissues at the feto-maternal barrier and have been discussed to be involved in feto-maternal immunotolerance [69].
Our study is the first study with a direct comparison of human MSCs from perinatal sources UC and AM with identical genetic background in comparison to BM. The study shows that MSCs from different sources show different biological properties suggesting a higher potential of immunomodulatory capacity of perinatal MSCs as compared to BM-MSCs, whereas BM-MSCs shower higher neuronal capacity. These findings may be relevant for clinical application of different MSC types. Additional comparative and functional in vitro and in vivo studies are required to verify these findings to finally provide a better understanding of biological differences of MSCs from different sources and to identify the most suitable MSCs for treatment of specific diseases.
Footnotes
Acknowledgments
This work was funded by grant no. 0703 68664/19/10/1/11/2/12 from the Bavarian Ministry of Economic Affairs, Infrastructure, Transport and Technology in Germany. A.K.N., C.S. and M.L. were supported by the Roche Postdoc Fellowship Program. We thank L. Diener, N. Hierner, A. Pauschert, C. Zundel, and G. Dietmann (Roche) for their excellent technical assistance, H. Walch (Roche) for support in running qPCR assays, G. Eissner (Ludwig-Maximilian-University of Munich) for his help in UC preparation, T. Friess and E. Abraham (Roche) for their support in running the Bio-Plex assay, O. Steinlein and S. Mueller (Ludwig-Maximilian-University of Munich) for cytogenetic analysis of MSCs, and K. Ploederl and C. Gabriel (Red Cross Blood Transfusion Service of Upper Austria) for reliable supply of UCs and AMs.
Author Disclosure Statement
All authors were employed or contracted by Roche Diagnostics GmbH or F. Hoffmann-La Roche AG during their contributions to this work.
References
Supplementary Material
Please find the following supplemental material available below.
For Open Access articles published under a Creative Commons License, all supplemental material carries the same license as the article it is associated with.
For non-Open Access articles published, all supplemental material carries a non-exclusive license, and permission requests for re-use of supplemental material or any part of supplemental material shall be sent directly to the copyright owner as specified in the copyright notice associated with the article.
