
Abstract
γ-Aminobutyric acid (GABA), the principle inhibitory transmitter in the mature central nervous system, is also involved in activities outside the nervous system. Recent studies have shown that functional GABA receptors are expressed in embryonic stem (ES) cells and these receptors control ES cell proliferation. However, it is not clear whether ES cells have their own GABAergic transmission output machinery that can fulfill GABA release or whether the cells merely process the GABA receptors by receiving and responding to the diffused GABA released elsewhere. To get further insight into this unresolved problem, we detected the repertoire of components for GABA synthesis, storage, reaction, and termination in ES and embryonal carcinoma stem cells by biological assays, and then directly quantified released GABA in the intercellular milieu from these pluripotent stem (PS) cells by an analytical chemical assay based on high-performance liquid chromatography coupled with electrospray ionization tandem mass spectrometry (HPLC-ESI-MS/MS). We found that embryonic PS cells processed a GABAergic circuit machinery and spontaneously released GABA, which suggests the potential that embryonic PS cells could autonomously establish a GABA niche via release of the transmitter.
Introduction
γ -
Aside from the receptors, the key part of the signaling input machinery, GABAergic transmission circuit requires the output components such as GAD and VIAAT and the signal itself—the released GABA. However, knowledge about the GABAergic signaling repertoire in undifferentiated pluripotent stem (PS) cells is scarce thus far. No study has directly addressed the characteristics of the GABA release by these cells. Thus, it is unclear whether the ES cells use their own GABAergic circuitry to regulate themselves by releasing GABA or whether the cells merely process GABA receptors by receiving and responding to the diffused GABA released elsewhere.
To get further insight into this unresolved problem, we detected the repertoire of components for GABA synthesis, storage, reaction, and termination in ES and embryonic carcinoma stem (ECS) cells by biological assays, and then directly quantified released GABA in the intercellular milieu from the PS cells by an analytical chemical assay based on high-performance liquid chromatography coupled with electrospray ionization tandem mass spectrometry (HPLC-ESI-MS/MS). We found that embryonic PS cells processed GABAergic circuit machinery and spontaneously released GABA, which suggests the potential that embryonic PS cells could autonomously establish a GABA niche via release of the transmitter.
Materials and Methods
Materials
Dulbecco's modified Eagle's medium (DMEM), knockout-Dulbecco's modified eagle medium (KO-DMEM), fetal bovine serum (FBS), β-mercaptoethanol,
Cell culture
Mouse ES cell lines, R1 and S6, were obtained from the Institute of Biochemistry and Cell Biology of the Chinese Academy of Sciences (Shanghai, China). Mouse embryonic fibroblasts (MEFs) were obtained from Sidansai Biotechnology Co., Ltd. The mouse P19 ECS cell line was obtained from the Cell Bank of Type Culture Collection of the Chinese Academy of Sciences. Undifferentiated ES cells were grown on irradiated MEFs with the KO-DMEM supplemented with 1,000 units/mL LIF, 0.055 mM β-mercaptoethanol, 2 mM
RNA isolation and reverse transcriptase–polymerase chain reaction
Total RNA from undifferentiated ES cells and ECS cells was isolated with the TRIzol reagent (Invitrogen) according to the manufacturer's instructions. Reverse transcription was carried out using a RevertAid First Strand cDNA Synthesis Kit (Qiagen), and the resultant single-strand cDNA was stored at −20°C for later use in the polymerase chain reactions (PCRs). cDNA was amplified according to the following temperature profile: 94°C for 30 s, 55°C for 45 s, and 72°C for 1 min. At the end of 31 cycles, the reaction was continued for an additional 10 min at 72°C, and PCR products (15 μL) were analyzed electrophoretically on 2% agarose gels poured and run in 1×TAE buffer. The primer sequences used for PCR are shown in Supplementary Table S1 and S2.
Western blotting
Cell lysates were prepared by sonication in the RIPA Buffer solution containing a protease inhibitor cocktail (Roche, IL). Extracts were centrifuged at 12,000 g, and the supernatant was retained. The protein concentrations were determined using the BCA Protein Assay Kit (Pierce Chemical). The lysates, 2.5% β-mercaptoethanol, and 0.0125% bromophenol blue were mixed and boiled for 5 min. Proteins in the lysates were then separated using 12% sodium dodecyl sulfate–polyacrylamide gel electrophoresis and transferred onto a PVDF membrane (Millipore). Subsequently, the membrane was blocked with 5% (w/v) nonfat milk in Tris-buffered saline/0.05% (v/v) Tween (TBST) for 2 h and incubated overnight at 4°C with the following dilutions of primary antibodies: 1:1,000 anti-GAD65, 1:1,000 anti-GAD67, and 1:1,000 anti-actin. The membranes were then incubated with corresponding secondary antibodies at room temperature for 1 h, and the immunoblots were visualized and scanned using the Odyssey FC Imaging System (LI-COR Biosciences).
Immunofluorescence staining
Cells were seeded into multiple glass-bottom tissue culture plates (10 mm; Shengyou Biotechnology Co., Ltd.) and cultured for 24 h. The cells were fixed with a 4% formaldehyde solution for 10 min. Following triple rinsing with phosphate-buffered saline (PBS), the cells were blocked with 1% bovine serum albumin (BSA) for 60 min and incubated overnight at 4°C with a primary antibody (anti-Oct4, 1:500; anti-GAD67, 1:100; anti-GAD65, 1:100; anti-VIAAT, 1:100; and anti-GABA-T, 1:100). In some cases, triple immunofluorescence staining was performed to investigate whether GAD67 or GAD65 and VIAAT colocalized within a single undifferentiated ES cell. Next, the cells were rinsed three times with PBS and incubated for 1 h at room temperature with a secondary antibody. Finally, the cells were rinsed three times with PBS and subjected to laser confocal microscopy (Zeiss LSM 710) analysis.
Flow cytometric analysis
ES cells were washed twice and fixed with 500 μl of 4% formaldehyde solution at 4°C for 30 min. After permeabilization in PBS/PVP containing 0.25% Triton X-100 for 30 min and blocked in 1% BSA for 60 min, the cells were incubated 3 h at 4°C with the primary antibody (anti-Sox2, 1:400). Then, the cells were rinsed three times with PBS and incubated with the secondary antibody for 1 h at room temperature. Finally, the cells were rinsed three times with PBS and resuspended in 50 μg RNAase A/mL of PBS containing 2 mg/mL propidium iodide (PI). After incubation at 37°C for 15 min, the cells were kept on ice and analyzed immediately with a flow cytometer (FACSCalibur; BD Biosciences).
Measurement of GABA content by using liquid chromatography–tandem mass spectrometry
Preparation of calibration standards and quality control samples
Calibration standards were prepared at concentrations of 20, 50, 100, 200, 500, and 1,000 ng/mL by diluting a fixed amount of stock solution of GABA in KHB. The solution with known spiked amount of GABA was defined as the quality control (QC), which was set at low, middle, and high concentrations (50, 200, and 800 ng/mL). The QC samples were prepared independently from the calibration samples. All calibration standards and QC samples were stored at −70°C until the liquid chromatography–tandem mass spectrometry (LC-MS/MS) analysis.
Liquid chromatography–tandem mass spectrometry
Liquid chromatography was performed using an Agilent 1200 HPLC system (Agilent Technologies), and separation was carried out at 30°C using a ZIC-HILIC column (2.1×100 mm, 3 μm; Merck Sequant). Isocratic elution was performed. The mobile phase consisted of acetonitrile and water (70:30, v/v, the aqueous phase contained 0.3% formic acid). The flow rate was set at 250 μL/min, and the injection volume was 2 μL. The HPLC system was coupled to an Agilent 6410 triple quadruple mass spectrometer (Agilent Technologies). The eluent from the first 1 min of the run was diverted to the waste to avoid potential contamination and ion suppression in the ion source. An ESI in a positive ionization mode was used. The ESI source parameters were set as follows: the nebulizer gas (N2) flow rate, 9.5 L/min; gas temperature, 350°C; capillary voltage, 4,000 V; and nebulizer pressure, 45 psi. The mode of multiple reaction monitoring (MRM) was used to indentify and quantify GABA (transition: m/z 104.1 [M+H]+→45.1 (Fig. 1A), fragmentor 70 V, and collision energy 25 eV) and IS (transition: m/z 110.2 [M+H]+→93.2 (Fig. 1B), fragmentor 70 V, and collision energy 20 eV). The analytic data were processed using the MassHunter software package (Agilent Technologies), which contained qualitative and quantitative analysis modules.

Collision-induced dissociation mass spectra of GABA
Sample preparation procedure
One hundred microliters of sample was mixed with 100 μL of acetonitrile, containing IS at a concentration of 50 ng/mL. Two microliters of the mixture was analyzed using LC-MS/MS.
Method validation
It is essential to employ well-characterized and validated bioanalytical methods to yield reliable results. The method was validated with respect to selectivity, linearity, accuracy, and precision. For selectivity, blank KHB solutions with or without GABA and IS were analyzed to determine whether there was any interfering compound for GABA and IS in blank KHB. Calibration curves were constructed using 6 calibration standards for GABA in the range of 20–1,000 ng/mL by determining the best-fit of the peak area ratios of analyte to IS (y) vs. nominal concentration (x) and fitted to the equation y=bx+a by using 1/x weighted least-squares regression. The linearity of the relationship between the peak area ratio and the concentration was demonstrated by the correlation coefficient (R) obtained with the weighing factor of 1/x. The concentrations of the real and QC samples were calculated according to the equation of the calibration curve. Intra- and interday accuracy and precision were evaluated by assaying five replicates of each QC sample of low, middle, and high concentrations on 3 separate days. Accuracy and precision were expressed as a relative error (RE) and relative standard deviation (RSD), respectively. For the assay to be considered acceptable, the RE and RSD, which indicate precision and accuracy at each QC concentration level, were required to be within 15%.
Determination of GABA release from ES and ECS cells
ECS cells and ES cells devoid of MEFs were plated in 10-cm-diameter cell culture dishes at a density of 3×10⁶ cells/well. After they attached to the dishes, the cells were washed three times with 10 mL KHB to remove endogenous GABA in the old medium, and then were incubated in 8 mL of fresh KHB. For the time course experiments, the supernatants (120 μL), comprising GABA released by the cells, were removed for analysis at time points of 2, 3, 5, 10, 15, 30, 60, and 120 min after the addition of the fresh KHB. An equal volume of fresh KHB was added back into the corresponding culture dishes after each sampling. Three or two independent tests were conducted in duplicate for ES and ECS cells. All samples were stored at −70°C until analysis.
Results
Expression of GABA receptor subunits in ES and ECS cells
Ionotropic GABAA receptors are assembled from subunits, including α1-6, β1-3, γ1-3, δ, ɛ, θ, π, and ρ1-3 [1], whereas metabotropic GABAB receptors comprise GABAB1 and GABAB2 subtypes [12]. RT-PCR analysis showed that ES cells expressed the transcripts of α1, α2, α3, α4, α5, β1, β2, γ1, θ, π, and ρ1 GABAA receptor subunits and GABAB2 subtype, whereas GABAB1 was not detected (Fig. 2A). ECS cells were identified to express α1, α2, α3, α4, α5, β2, β3, ɛ, π, and ρ1 subunits (Fig. 2B). These results suggest the existence of GABAergic transmission input components in embryonic PS cells, which is in concert with the recent findings about the presence of functional GABA receptors in ES cells [10,11].
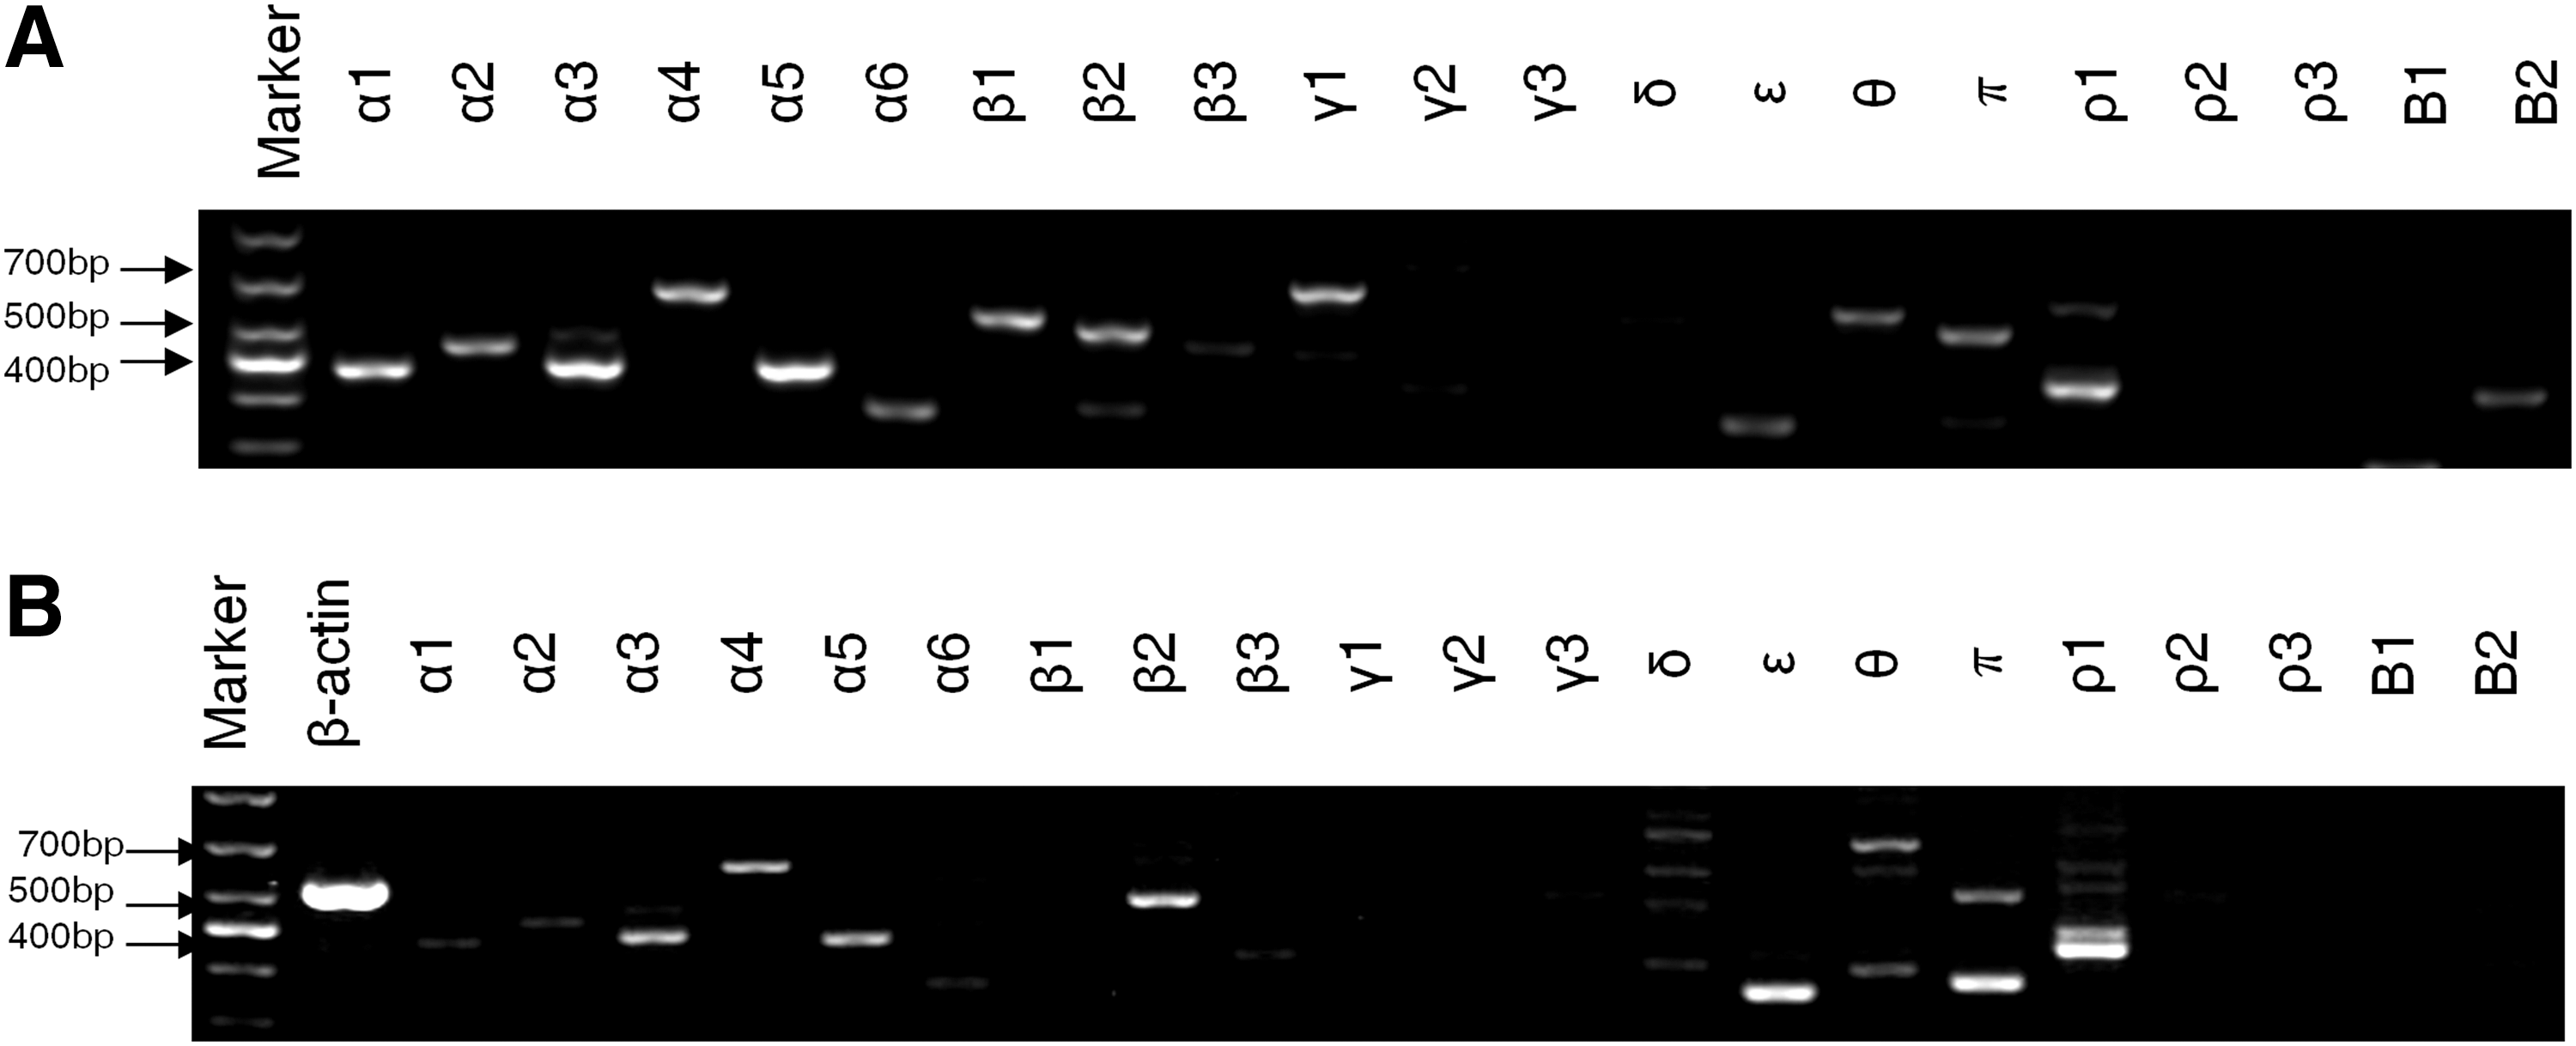
Expression of GABAergic transmission input components. RT-PCR analysis of GABAA receptor subunits (α1-6, β1-3, γ1-3, δ, ɛ, θ, π, and ρ1-3) and GABAB receptor subtypes (B1 and B2) of ESC
Expression of GABAergic transmission output and reuptake/termination components in ES and ECS cells
We then explored if embryonic PS cells expressed GABAergic transmission output and reuptake/termination components. In R1 ES cells, the transcripts of GABA synthesis enzymes GAD67 and GAD65, the vesicular transporter VIAAT, plasmalemmal transporters GAT1, GAT3, and BGT1, and the degradation enzyme GABA-T were detected (Fig. 3A). A similar expression was also found in S6 ES cells (Supplementary Fig. S2). In ECS cells, GAD67, GAD65, VIAAT, GAT1, and GABA-T were identified (Fig. 3B). Expression of the GABA synthesis enzymes was confirmed by western blot assay. Both ES and ECS cells were identified to express GAD67 and GAD65, with the degree of expression comparable to that in the cerebral cortex (Fig. 3C). Immunocytofluorescence staining reconfirmed the expression of these components, showing the cytoplasmic distribution of GAD67, GAD65, and GABA-T, and the punctate location of VIAAT in ES (Fig. 3D) and ECS (Supplementary Fig. S3) cells. Triple immunofluorescence staining analysis using confocal microscopy revealed that GAD67 or GAD65 colocalized with VIAAT, as well as the pluripotent marker Oct4, in the same undifferentiated ES cells (Fig. 4); the colocalization of GAD67 or GAD65 with VIAAT was also detected in ECS cells (Fig. 5). The GABAergic feature was restricted to the PS cells, because we failed to detect any kind of the GADs in MEFs (Fig. 4). These results indicate that GABAergic transmission output and reuptake/termination components are expressed in embryonic PS cells and that the GABA synthesis and vesicular packaging components are assembled together in a particular PS cell. MEFs were detected to express VIAAT, the vesicular transporter shared by inhibitory amino acid transmitters GABA and glycine, hinting at the possibility of glycine packaging in the vesicles of the cells.
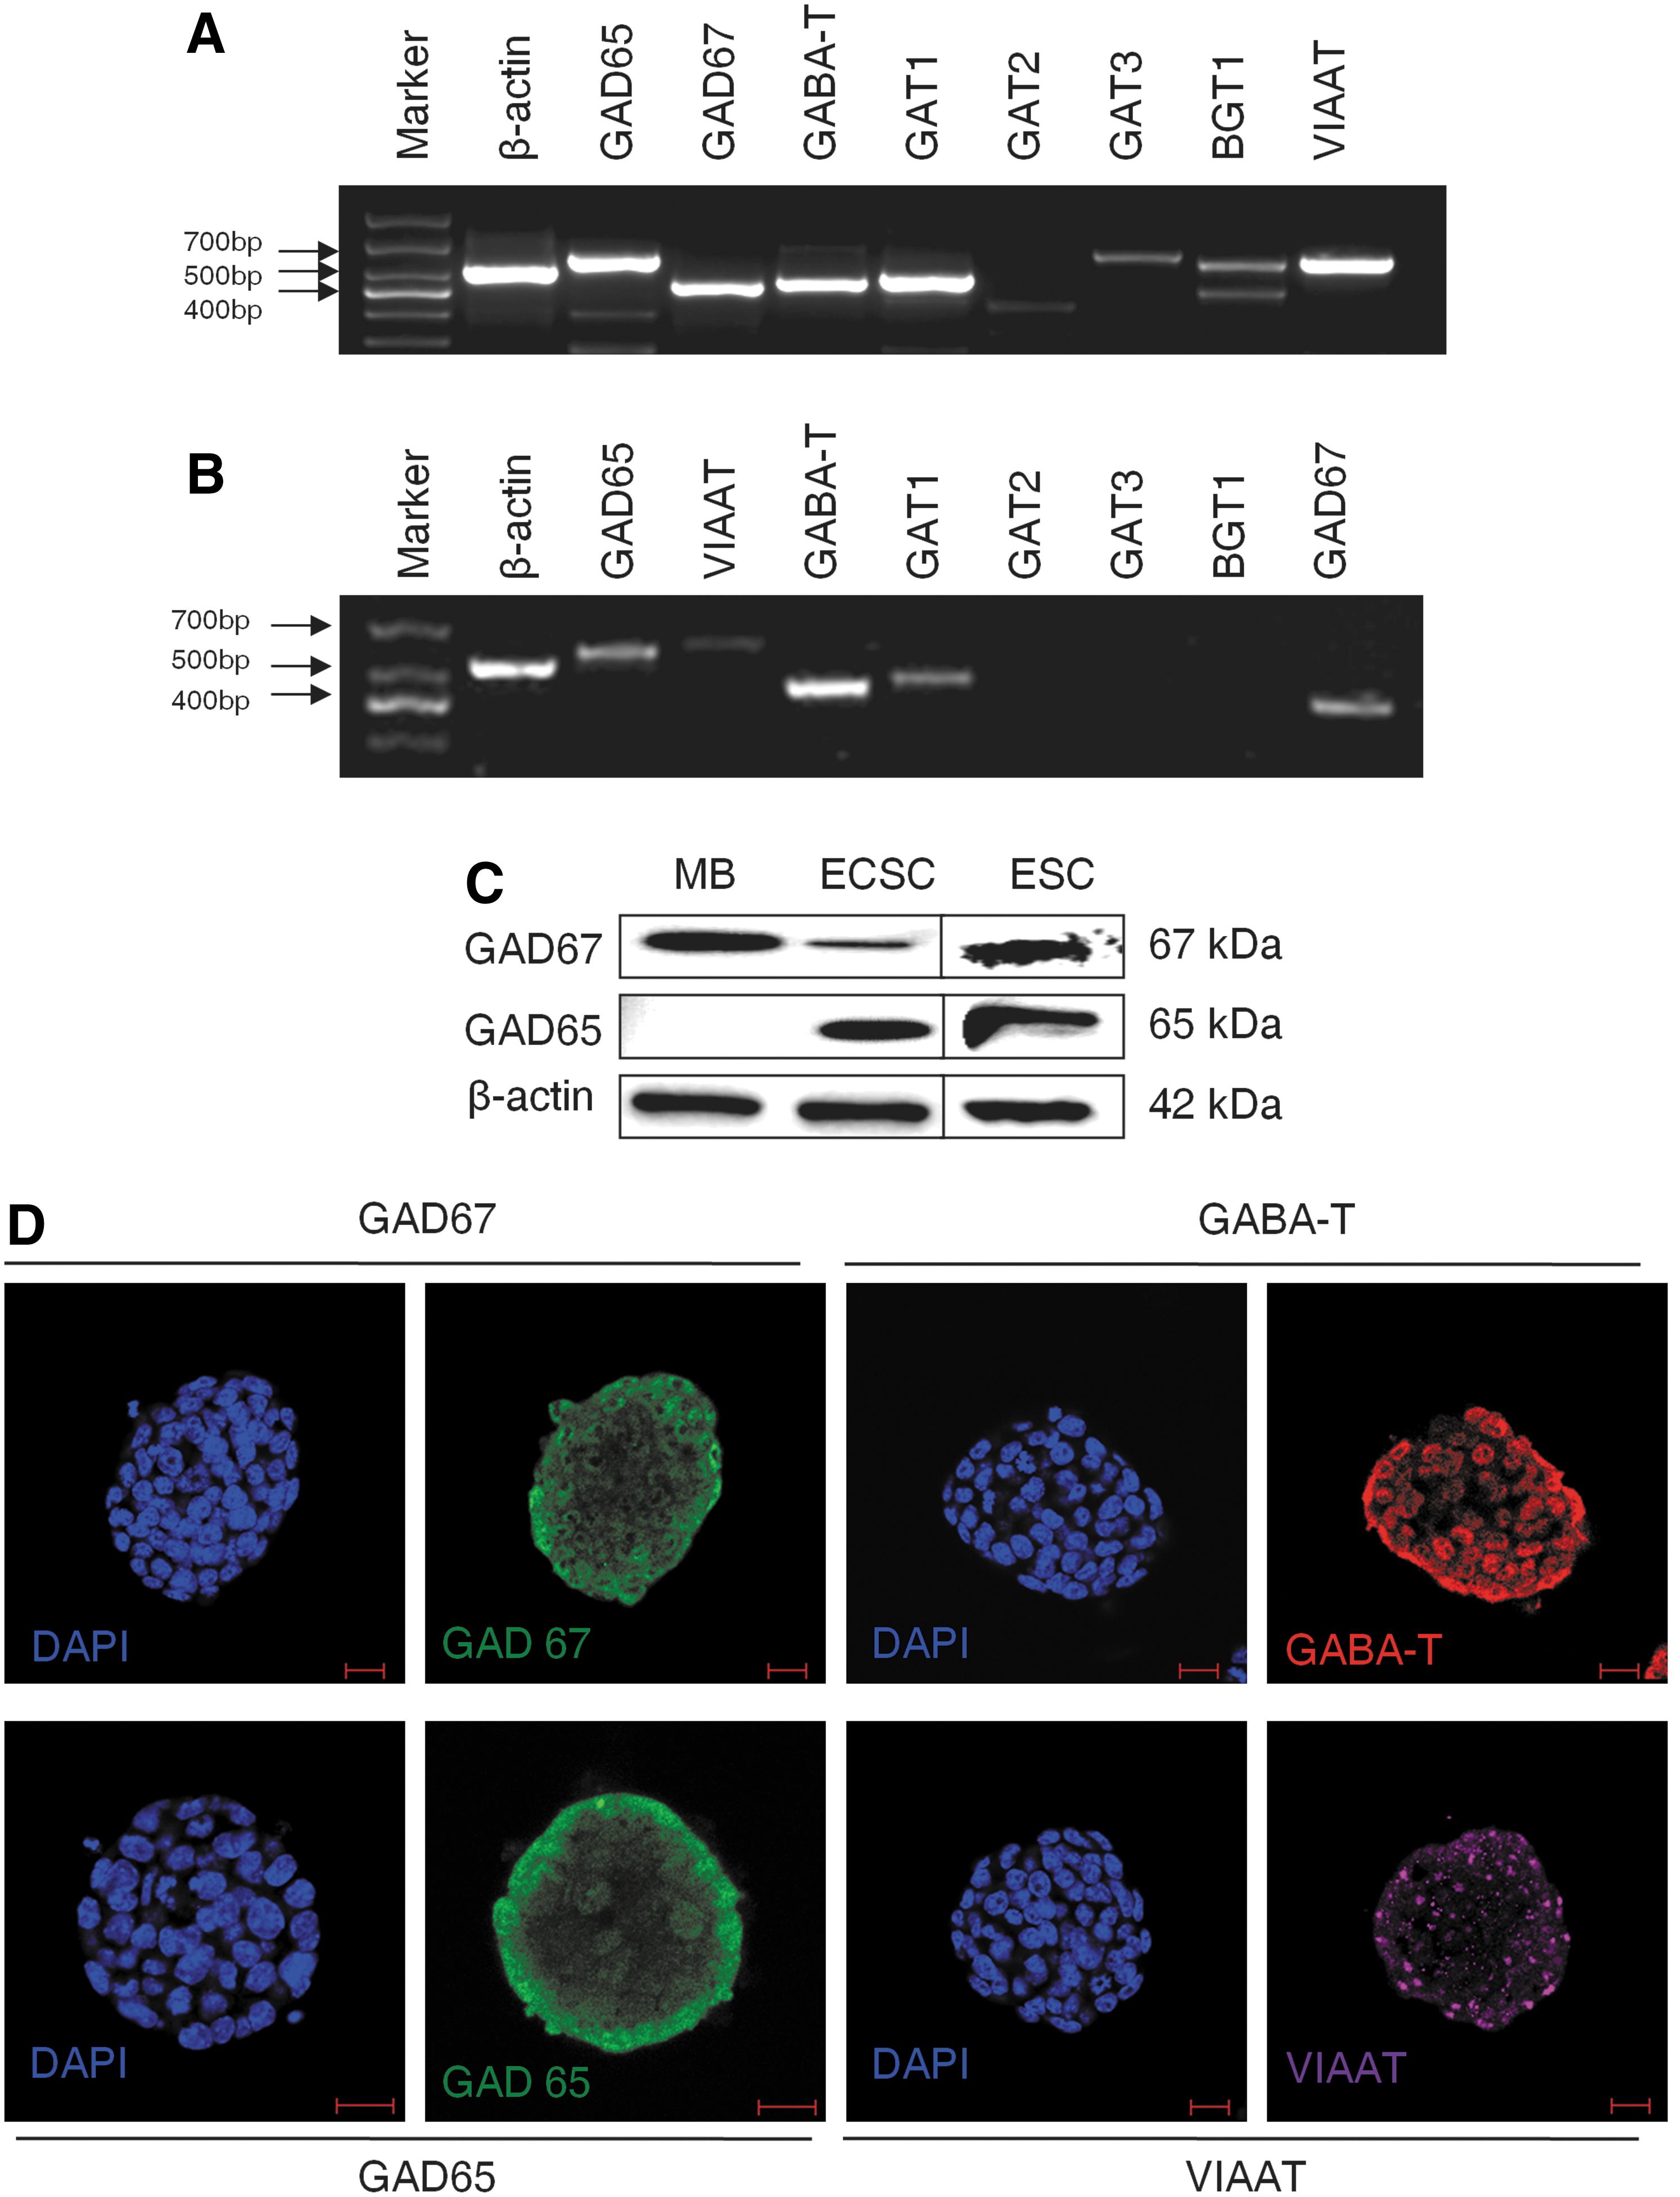
Expression of GABAergic transmission output and reuptake/termination components. RT-PCR analysis of GABA synthesis enzymes GAD65 and GAD67, vesicular transporter VIAAT, cell membrane transporters GAT1, GAT2, GAT3, and BGT1, and degradation enzyme GABA-T of ES
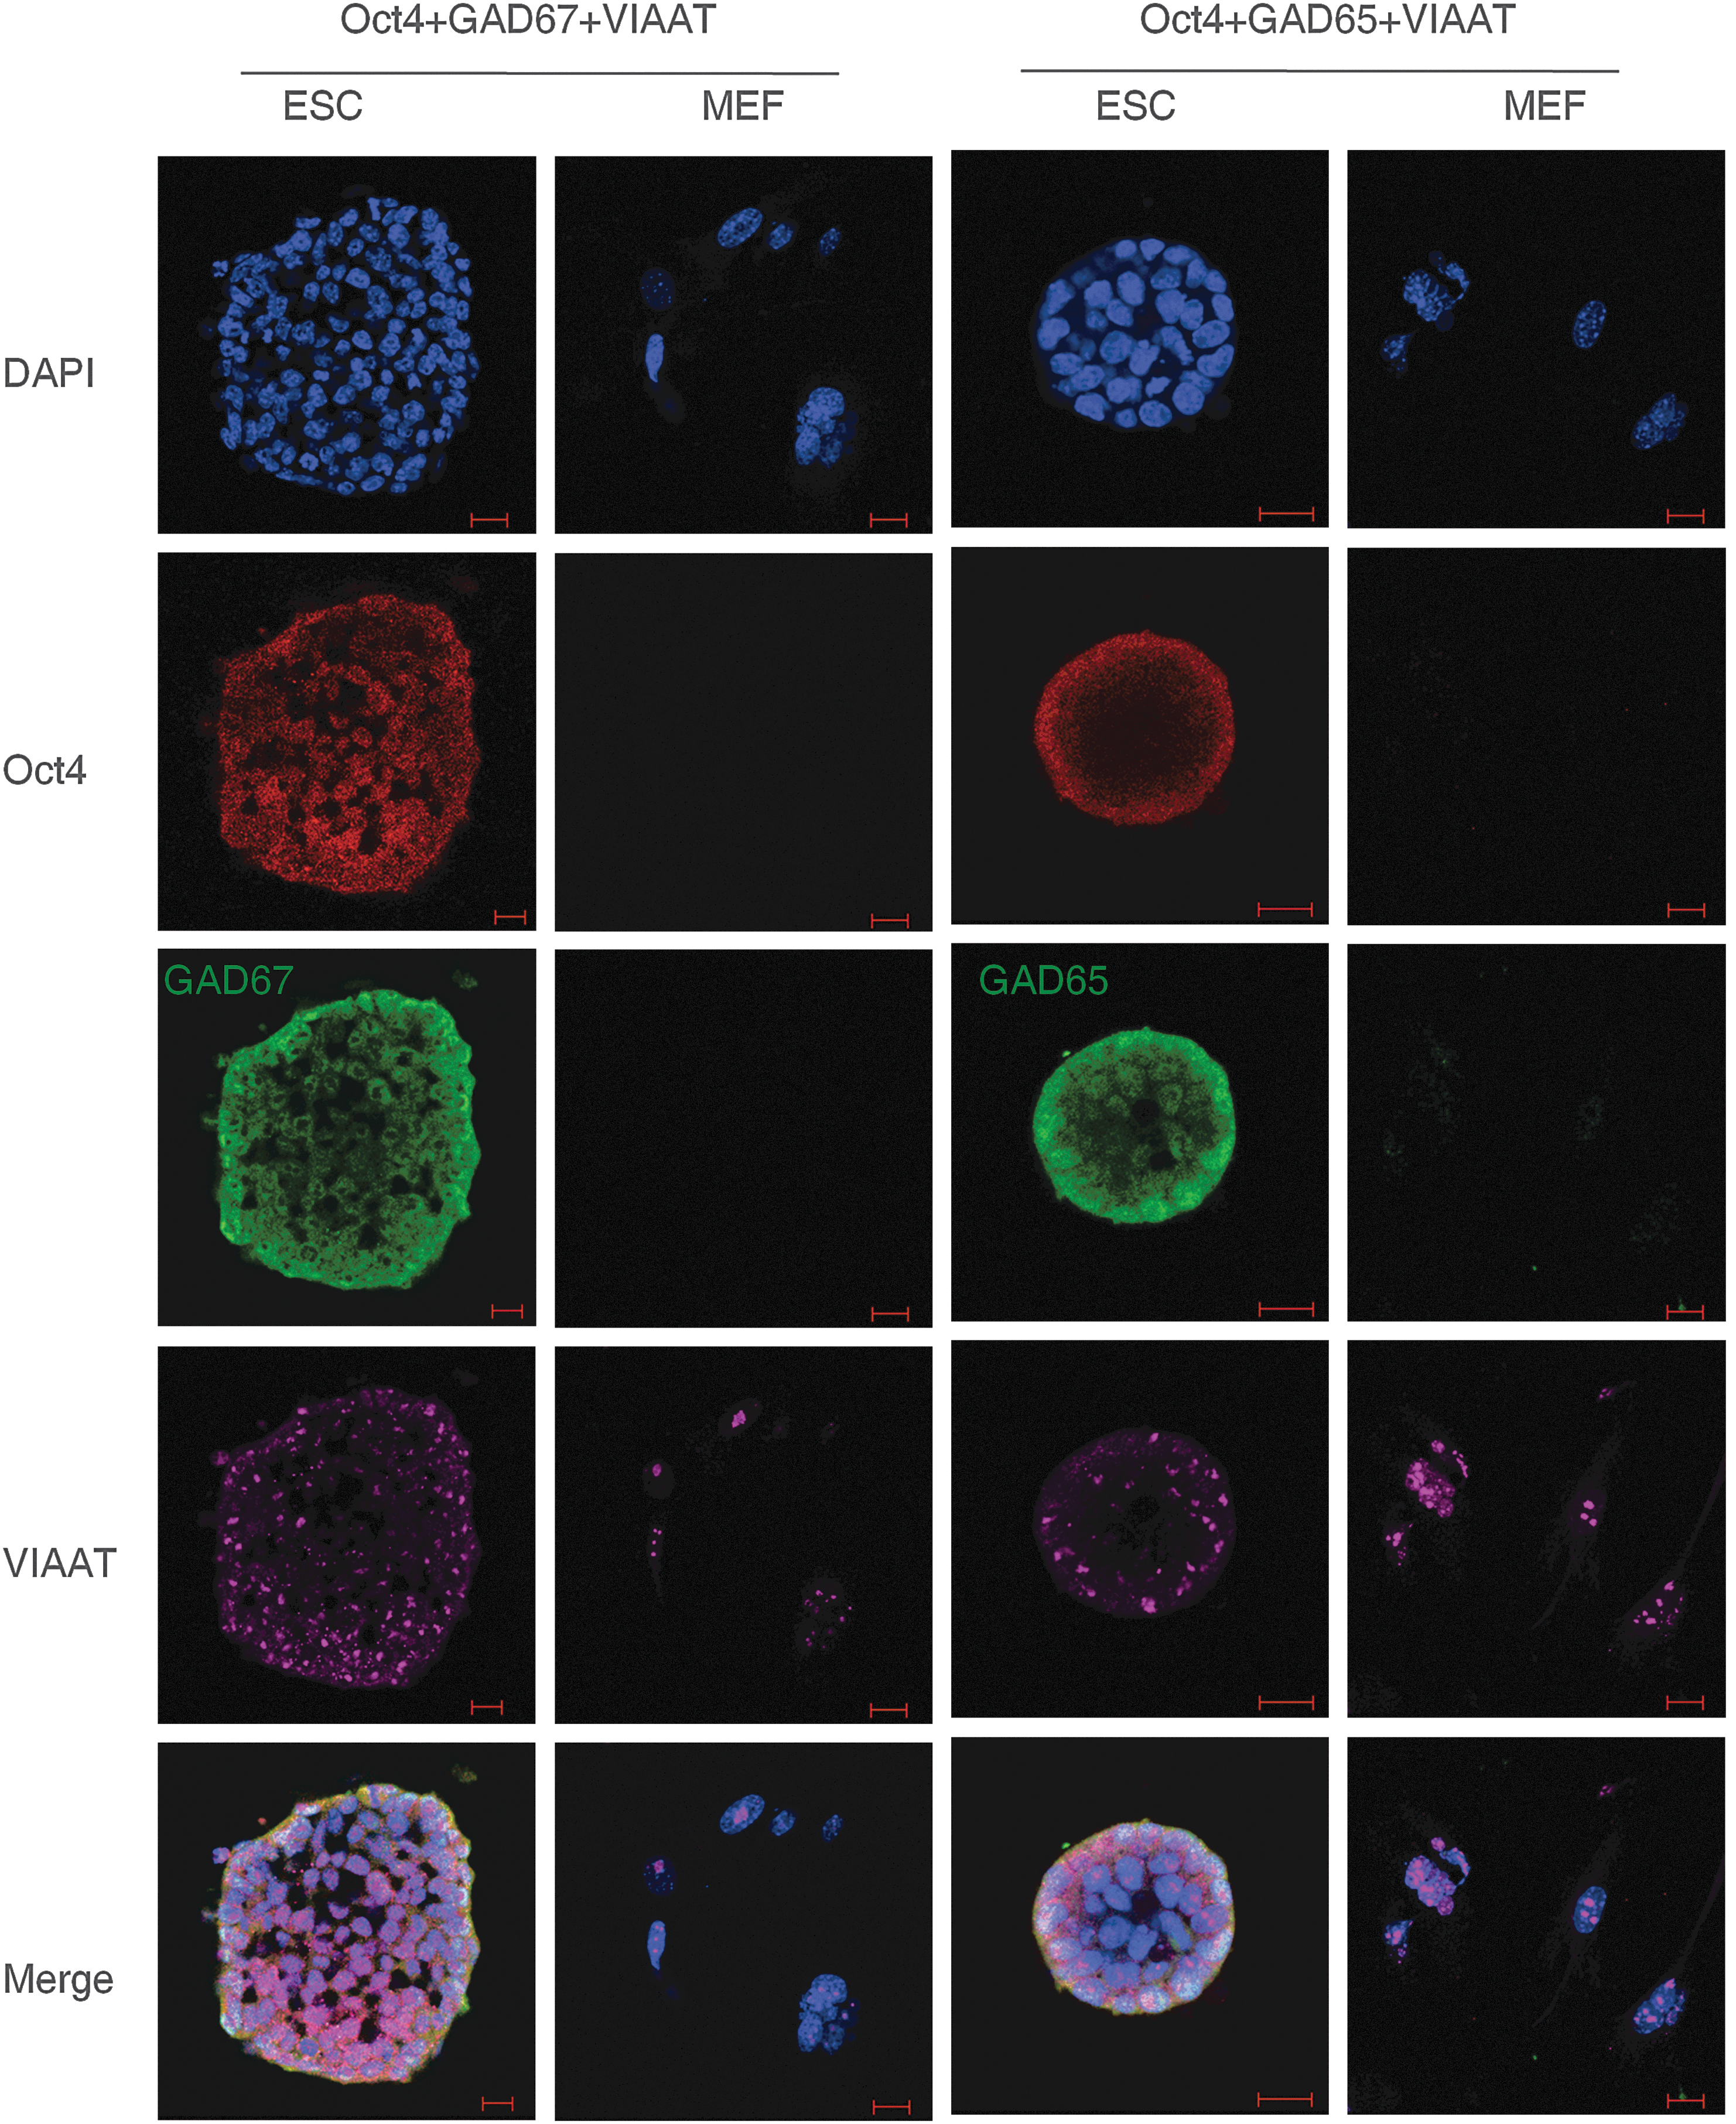
Colocalization of GABAergic transmission output components in ES cells detected by triple immunofluorescence staining confocal imaging assay. DAPI represents the cell nucleus position; Oct4 is a pluripotent marker; GAD67 and GAD65 are the two isoforms of the GABA synthesis enzyme. Scale bar: 20 μm. MEF, mouse embryonic fibroblast.
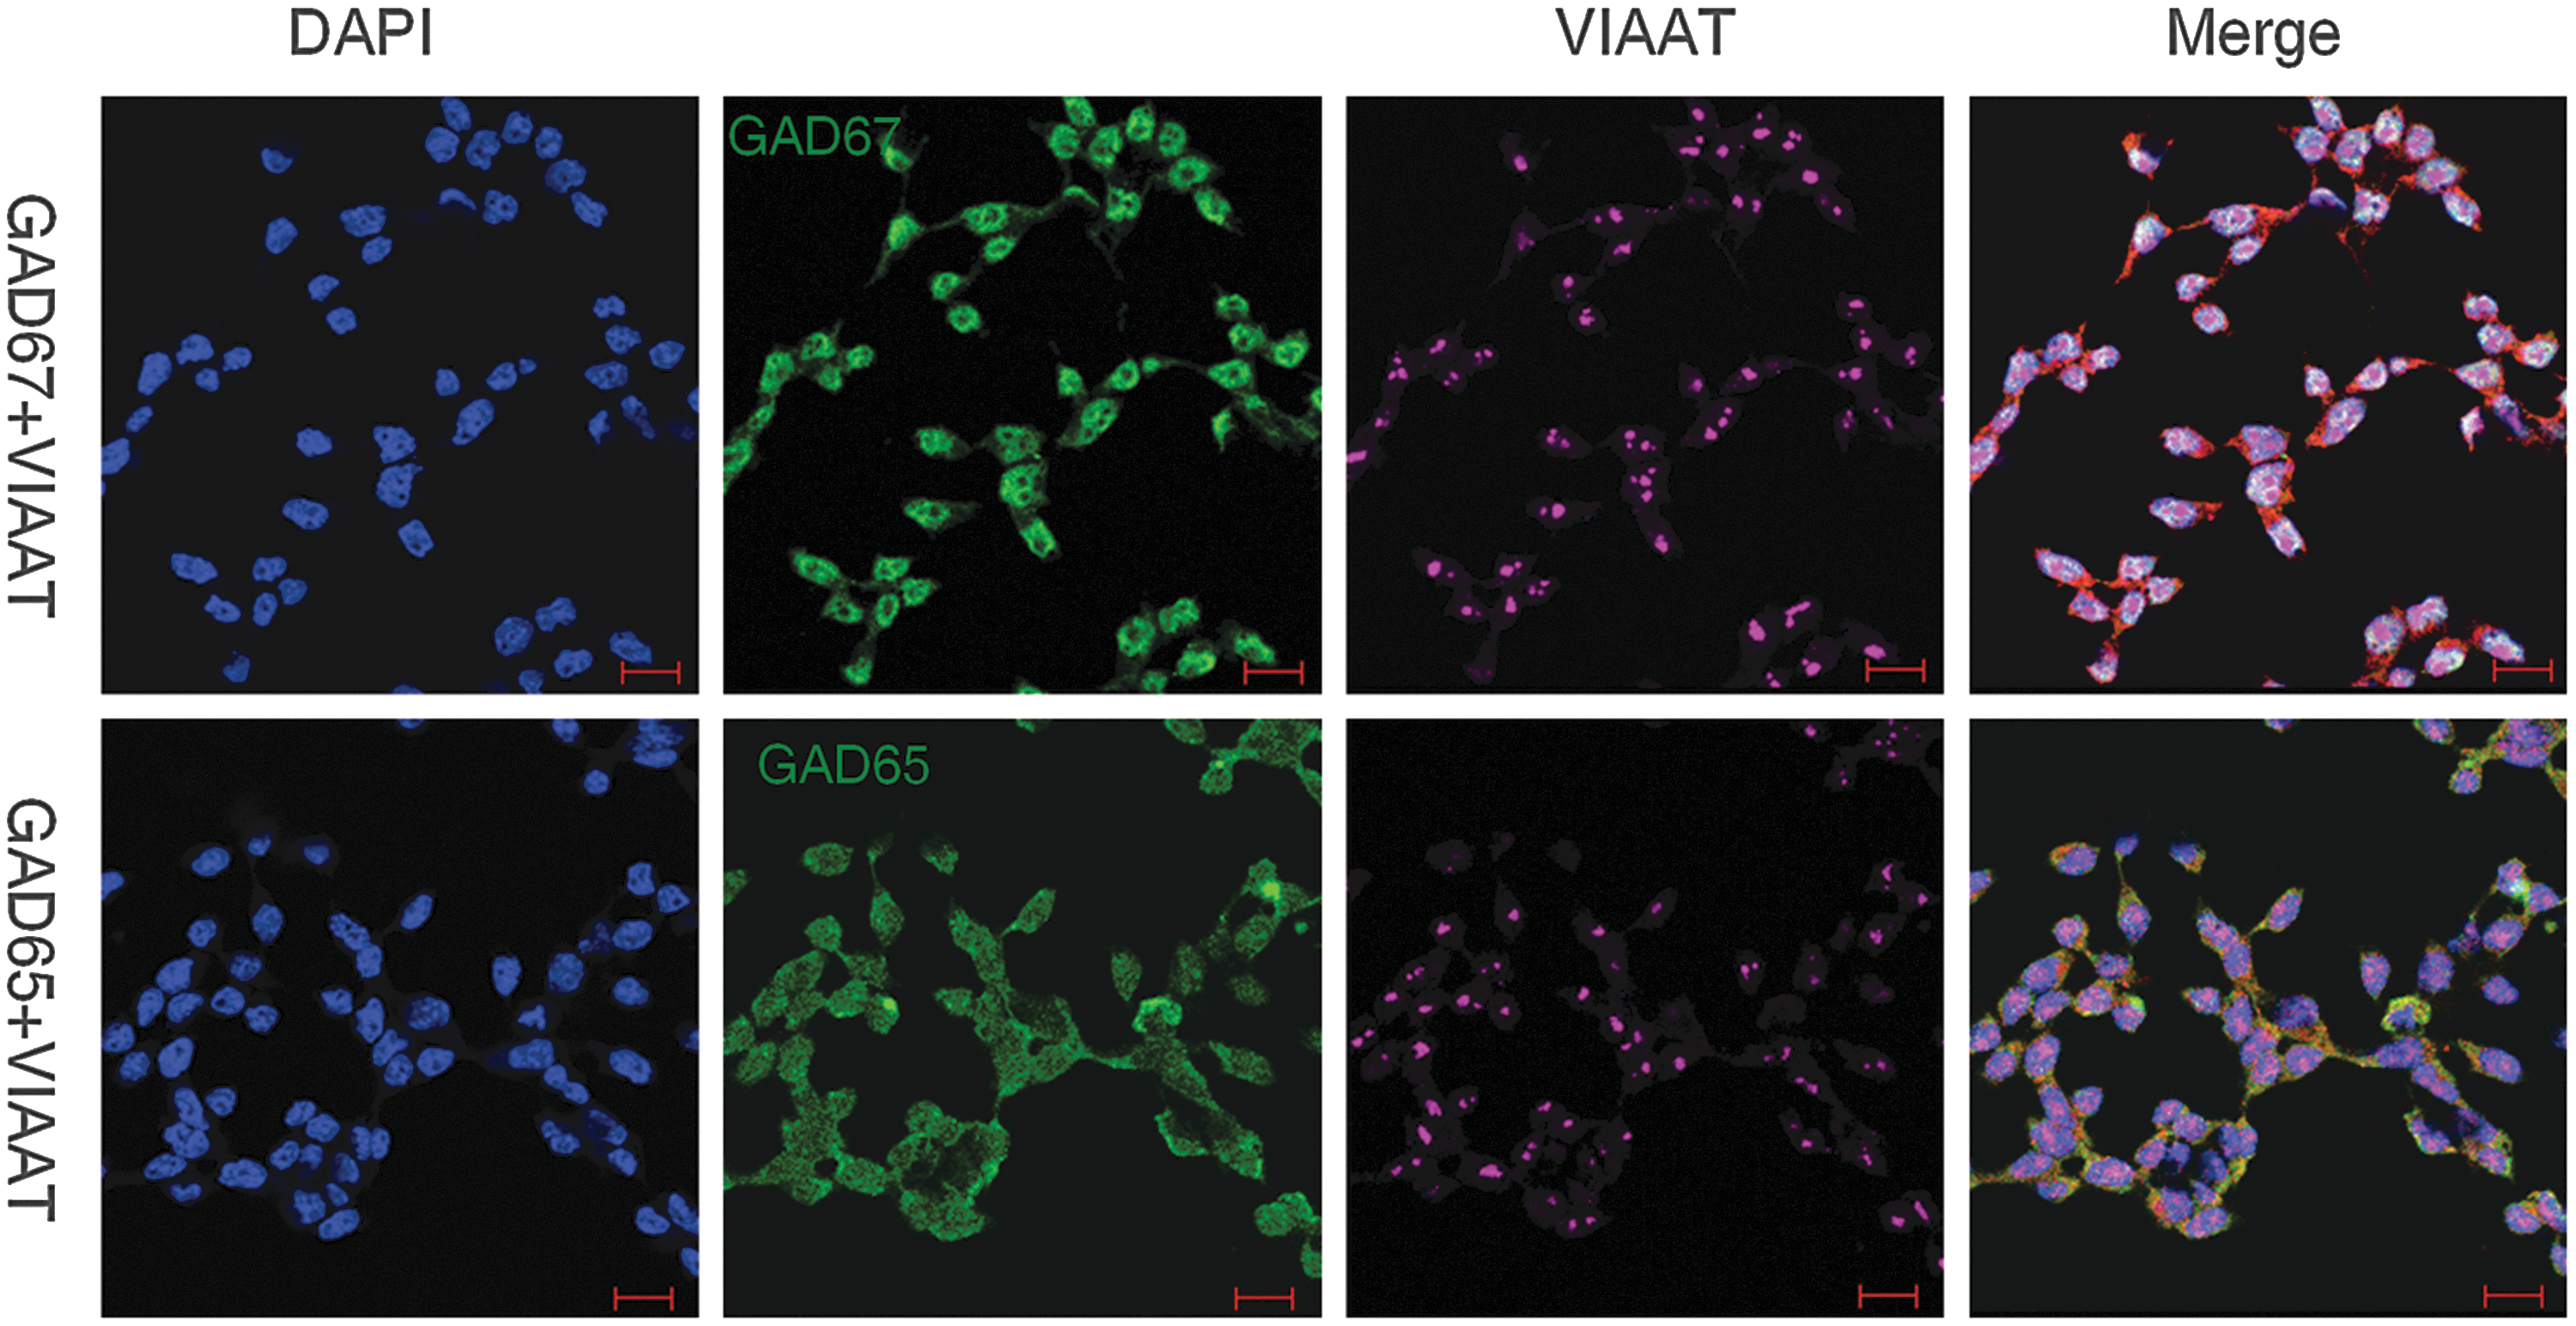
Colocalization of GABAergic transmission output components in ECSCs detected by double immunofluorescence staining confocal imaging assay. DAPI represents the cell nucleus position; GAD67 and GAD65 are the two isoforms of the GABA synthesis enzyme. Scale bar: 20 μm.
Validation of the LC-MS/MS method for quantification of GABA
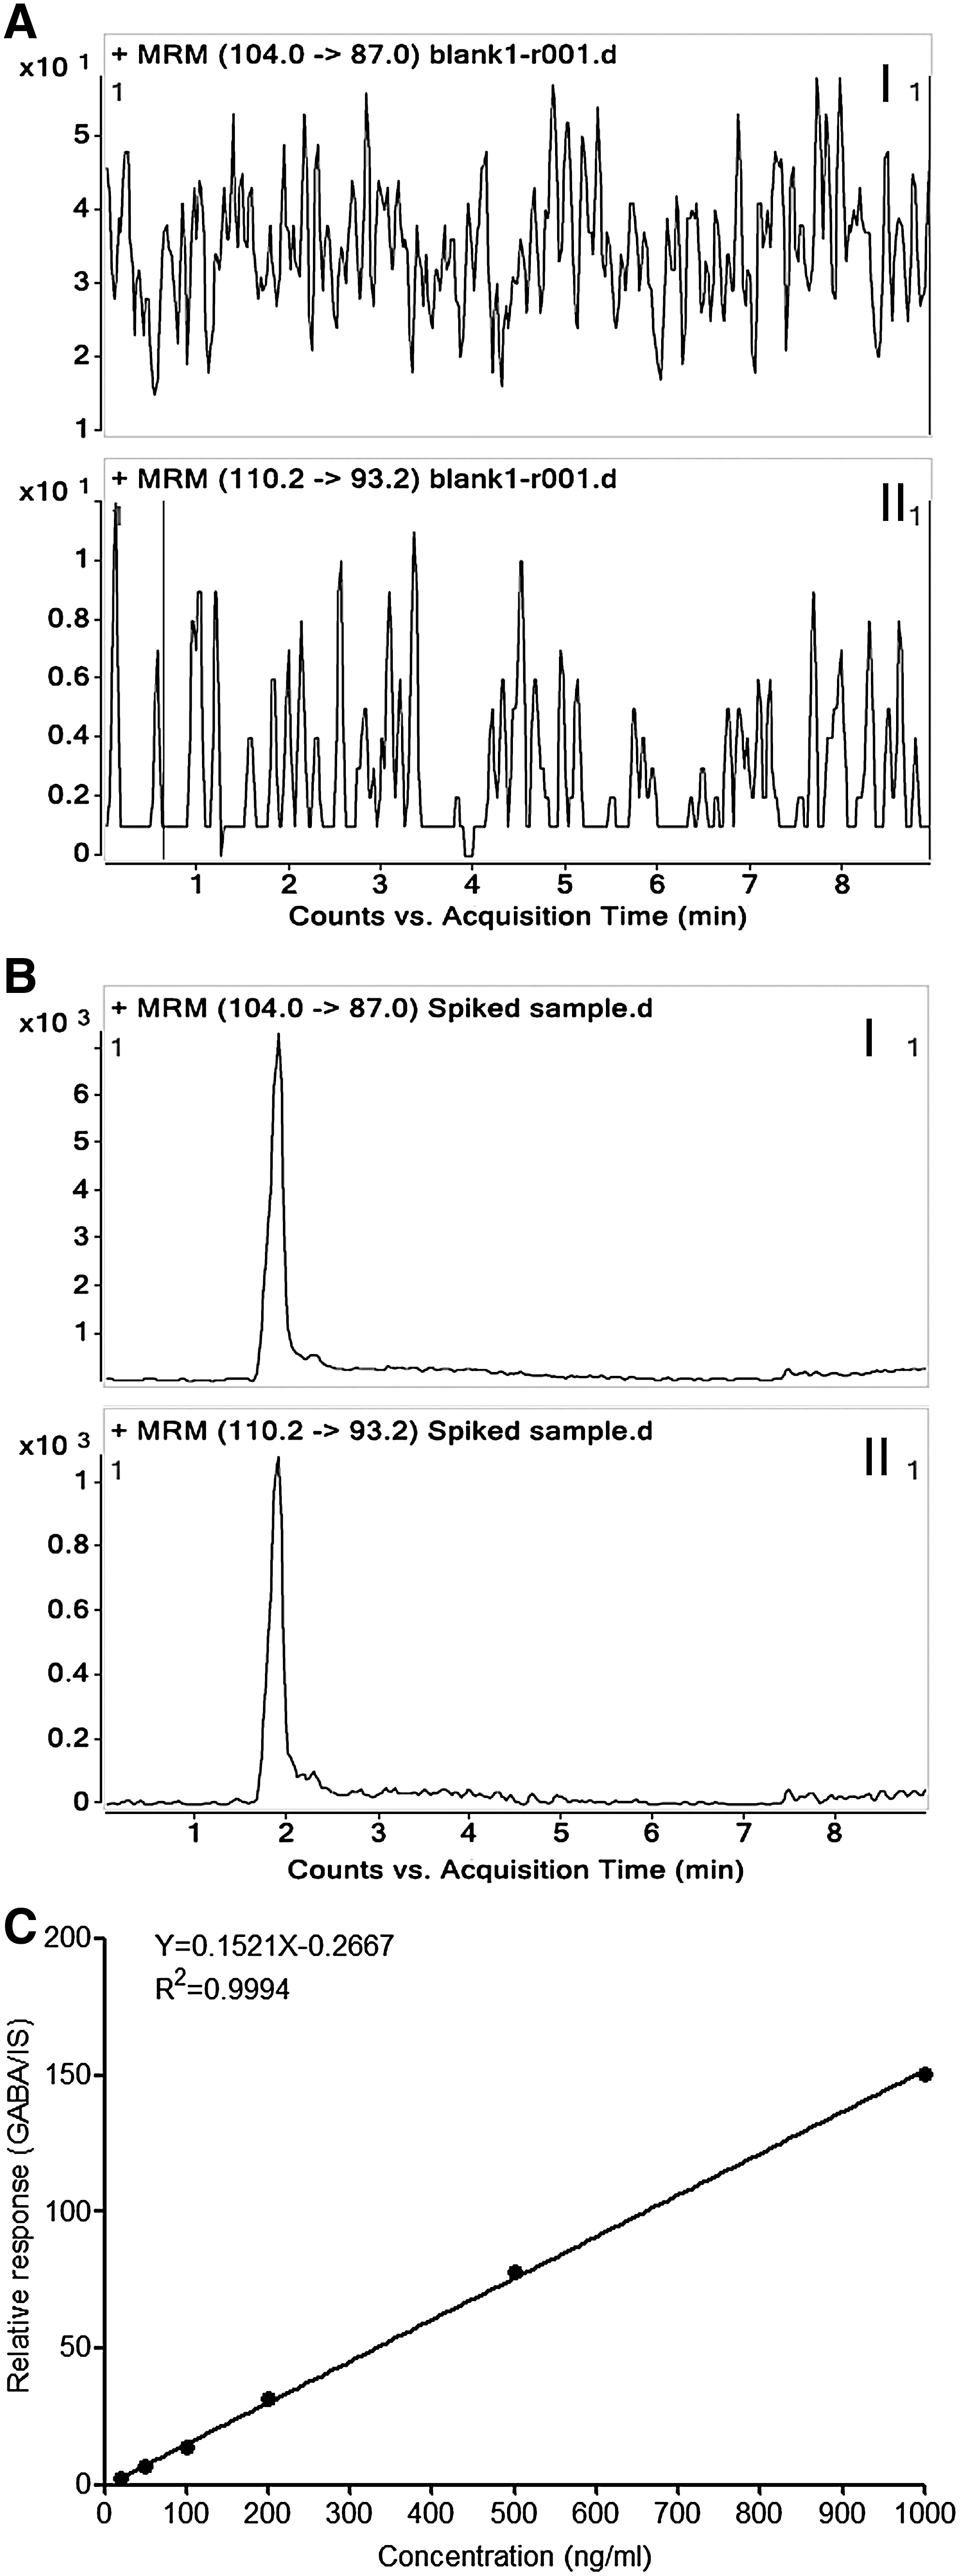
To quantitatively test if the GABAergic transmission output machinery is functional and to determine if the embryonic PS cells really emit the GABA signal, we established an analytic approach based on LC-MS/MS, which allowed the detection of GABA release from ES and ECS cells into the intercellular milieu. To generate reproducible and reliable data, the method was validated with respect to selectivity, linearity, accuracy, and precision. The chromatogram of the blank matrix (KHB) showed no interfering compound for GABA and IS in the matrix (Fig. 6A), whereas the signal-to-noise of the analytes in the GABA and IS spiked sample was more than 20 (Fig. 6B). Thus, the selectivity of the method was well acceptable. The calibration curve exhibited a good linear correlation over the range of 20–1,000 ng/mL (y=0.152148x−0.266722, R 2=0.999) (Fig. 6C). The measurements for accuracy and precision in intra- and interassay are summarized in Table 1. The values for intraday accuracy and precision were less than 7.87% and 11.86%, respectively, whereas the values for interday accuracy and precision were less than 10.06% and 9.65%, respectively. Therefore, the method was evaluated as credible and robust under the experimental conditions. It can be employed for the quantitative determination of GABA in the biological samples.
Results of method validation with regard to selectivity
The calculated concentration of the QC sample refers to the concentration of GABA calculated according to the equation of the calibration curve described in the manuscript. Intra- and interday precision and accuracy were evaluated by assaying five replicates of each spiked QC sample at the low, middle, and high concentrations on 3 separate days. Accuracy and precision were expressed as RE and RSD, respectively. For the assay to be considered acceptable, the RE and RSD at each QC concentration level were required to be within 15%.
QC, quality control; RE, relative error; RSD, relative standard deviation.
Release of GABA by ES and ECS cells
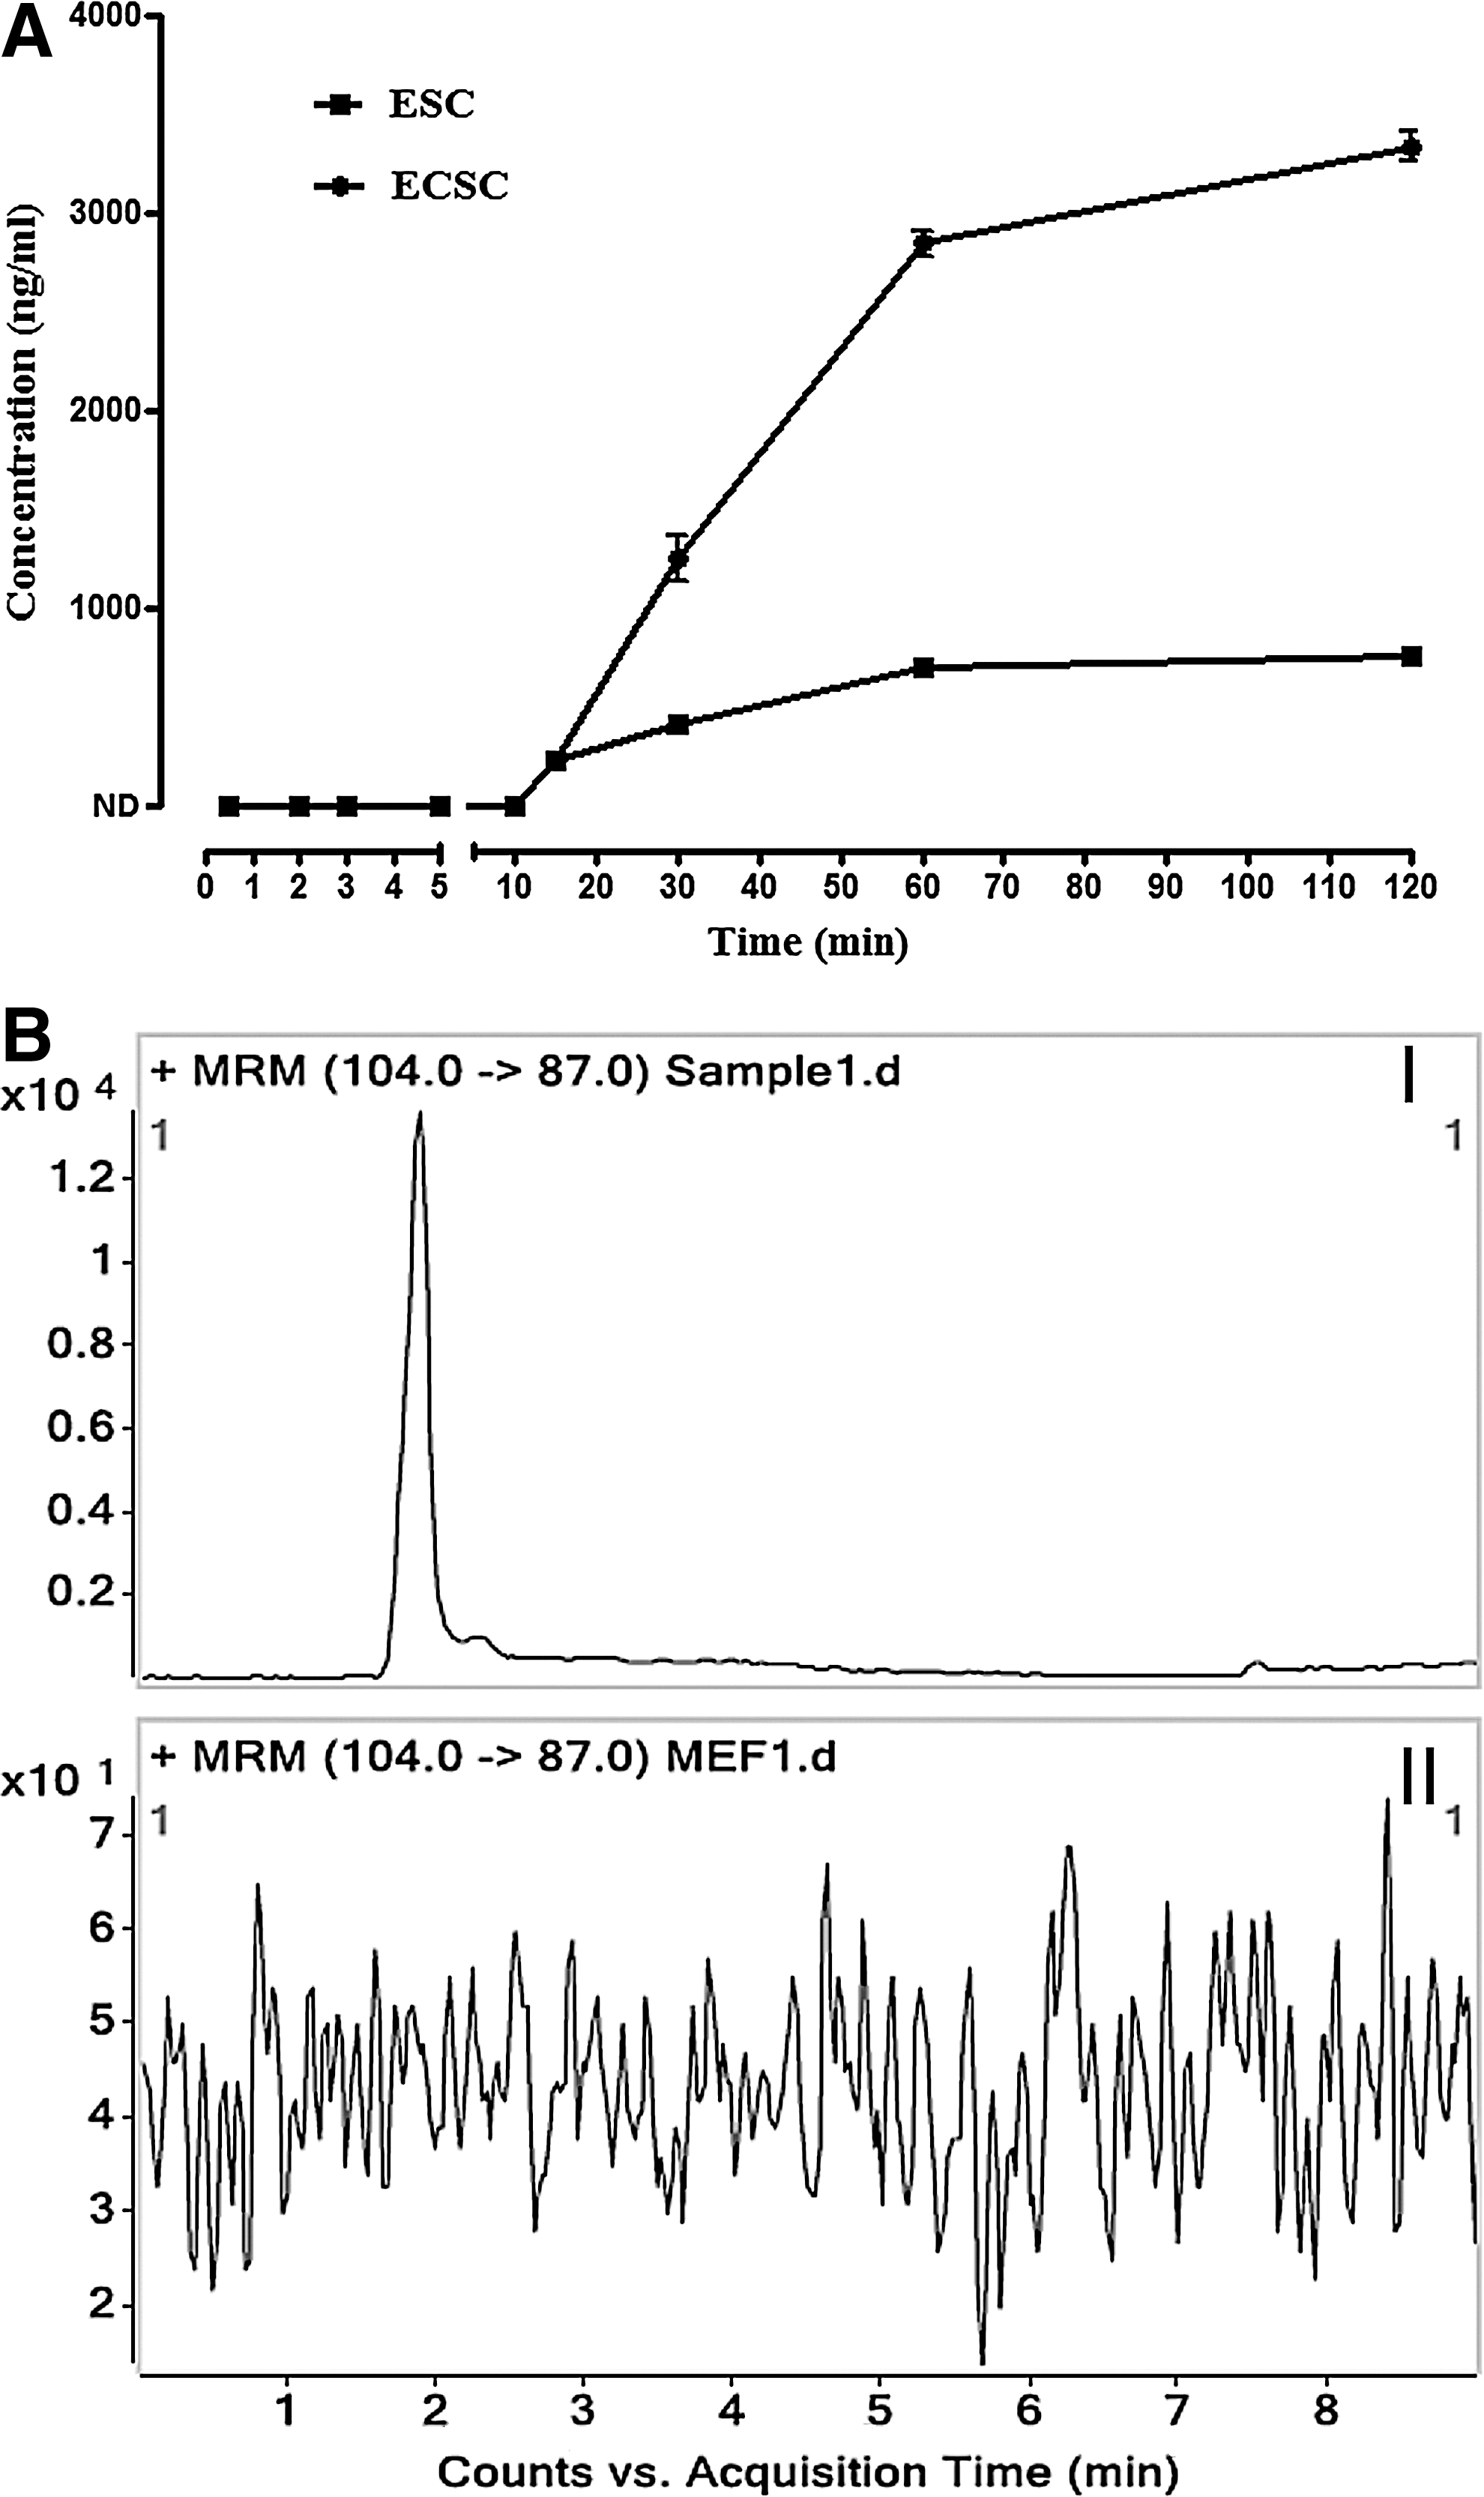
The established and validated LC-MS/MS analytic method was used to quantitatively monitor GABA release from ES cells. The amount of the released GABA gradually increased over the time course, from 228.79±9.39 ng/mL at 15 min to 699.93±39.44 ng/mL at 60 min and 750.69±40.33 ng/mL at 120 min, reaching a plateau in ES cells (Fig. 7). This suggests that ES cells consecutively release GABA into the milieu until achieving equilibration between release and reuptake of the transmitter. To determine if the release of GABA is a feature of pluripotent cells, another kind of embryonic PS cells, the ECS cells, were examined. Like ES cells, ECS cells released GABA, and the concentration in the intercellular space was 231.29±16.41 ng/mL at 15 min, increasing to 2847.45±67.90 ng/mL at 60 min and 3339.07±75.11 ng/mL at 120 min (Fig. 7). In contrast to the embryonic PS cells, no GABA release from MEFs could be detected (Fig. 7BII, represents the MRM chromatogram for GABA in the supernatant of MEFs, compared to that of the ES cells as shown in Fig. 7BI); in addition, the amount of GABA release from NIH/3T3 cells was also below the detection limit of our assay (data not shown). These results indicate that GABA release is specific to embryonic PS cells.
Release of GABA by ES and ECS cells.
Discussion
Stem cells are regulated by extrinsic modulating factors, such as growth factors and cytokines in addition to intrinsic factors, such as transcription factors, epigenetic control, and microRNA regulators [13,14]. Discovering novel extrinsic factors, such as endogenous physiologically active small molecules like GABA, will help to increase the general understanding of stem cell biology in terms of how these cells communicate within their microenvironment and will ultimately allow development of a pharmacological strategy for manipulation of stem cells, which can be used in regenerative medicine. GABA, the classical neurotransmitter, has recently been discovered to serve functions beyond the nervous system. Moreover, GABA receptors have been shown to act in the regulation of very early embryonic development and ES cell fate [10,11]. In this study, we observed that besides the input components, the intact repertoire of GABAergic transmission components is present in ES and ECS cells. Moreover, we proved that the embryonic PS cells release this transmitter into the cellular milieu, which suggests that the PS cells could establish an autoregulatory GABA niche in an autocrine/paracrine manner. Our finding further supports the hypothesis that GABA behaves as an extrinsic factor for PS cells.
Both ES and ECS cells expressed α1, α2, α3, α4, α5, β2, π, and ρ1 GABAA receptor subunits. Despite minor variability in the expression patterns of receptor subunits among different studies [10,11,15], expression of the α1, α3, α4, and α5 subunits, which are orthosteric sites for GABA binding [16], was found in these studies and by our group. Receptors containing subunits α4 and α5 predominantly accumulate in extrasynaptic sites [17,18]. The functional properties of these extrasynaptic GABAA receptors are different from those of the postsynaptic receptors, which permits these receptors to respond to slow autocrine or paracrine release [16]. Thus, they are also expressed in synapse-free progenitors in the brain and are responsible for cell proliferation, differentiation, and migration [16]. Embryonic PS cells also expressed GABAA receptors that contain ρ subunits. This kind of assemblage guarantees a high affinity for GABA and slow desensitization kinetics, facilitating receptor detection of tonic GABA release [19].
GAD catalyzes glutamate into GABA, which is responsible for the rate-limiting process in GABA biosynthesis. Two isoforms, GAD67 and GAD65, have been identified. The former is constitutively active, whereas the latter oscillates between an active holoenzyme and an inactive apoenzyme [16]. In neurons, GAD67 and GAD65 are involved in the synthesis of cytoplasmic and the vesicular pools of GABA, respectively [20]. Both GAD67 and GAD65 were detected in ES and ECS cells, indicating involvement of both pools in keeping GABA poised for release in the PS cells. A similar situation is found in GABAergic interneurons, which express both isoforms of the GAD [21]. GAD has been characterized as an indicator of GABAergic cells, which are present in GABAergic neurons and other non-neuronal GABAergic cells [7,22,23]. Parallel expression of GAD and VIAAT further validates GABAergic identification [24,25]. Our demonstration of colocalization of GAD, VIAAT, and Oct4 in a single cell suggests that the GABA synthesis and package components are assembled together within PS cells. Therefore, embryonic PS cells process the GABAergic transmission output machinery.
Endogenous physiologically active molecules usually act in trace amounts and exist in the complex biofluid matrix. HPLC-MS/MS separates target molecules by HPLC and identifies these molecules by retention time and specific fragmentation pattern of the analytes using MS/MS in the MRM mode, thereby ensuring superior sensitivity and selectivity for the quantitative bioanalysis of small molecules [26,27]. In our study, satisfactory results were obtained with regard to selectivity, linearity, accuracy, and precision. Thus, the successful validation of the quantitative method guaranteed the reliable quantitative determination of GABA in the biological matrix. We found that GABA was continuously released by embryonic PS cells and the release finally reached a plateau. These cells were detected to express cell membrane GABA transporters and GABA-T for reuptake/recycle and degradation of the released GABA. Thus, the plateau that the release of GABA reached suggests an achievement of equilibration between the secretion and the termination of the compound in the extracellular environment. The equilibrium concentrations of released GABA were approximately 7 and 30 μM in ES and ECS cells, respectively. These concentrations are sufficient for activation of receptors and are compatible to that of tonic release of GABA in the CNS [18,28]. The apparent concentration of GABA released by ES cells was lower than that by ECS cells, the malignant counterpart of the ES cells [29,30]. Increased GABAergic signaling has been found in tumor cells and cancer stem cells, and has been attributed to the oncopotent/pluripotent genes c-Myc, KLF4, and Oct1 [31 –33]. Further investigation is required to assess whether malignant stem cells release more GABA and whether the GABA released to the biofluid could be a biomarker for indicating the extent of functional expression of oncopotent/pluripotent genes. On the other hand, the amount of GABA molecules that the ES cells effectively contact and respond to would not necessarily be less compared with the ECS cells, because ES cells grow compactly in clones, and the cells in a clone niche live much closer than do the ECS cells, which grow more uniformly as a monolayer.
Thus, the embryonic PS cells process a repertoire of GABAergic transmission machinery for input, output, and reuptake/termination of the signal: GADs for synthesizing GABA, VIAAT for loading the GABA into secretory vesicles, released GABA for acting as the signal, GABA receptors for receiving and responding to the released GABA, and GATs and GABA-T for terminating the signal. Thus, each of the PS cells could regulate itself and other neighboring cells in an autocrine/paracrine manner. As extrinsic factors, autocrine and paracrine cues affect stem cell fate, including self-renewal, growth, and differentiation. These factors precisely regulate the SC fate by establishing niches and feedback loops [34 –36]. In this way, the PS cells would establish an autoregulatory GABA niche through an autocrine/paracrine release of the transmitter. Some researchers deduced that it was the endogenously produced autocrine/paracrine GABA that activates GABAA receptors and regulates ES cell proliferation and the early embryo size via the intracellular calcium or PIKK-H2AX pathways [10,11]. This kind of GABA niche has been found in the CNS, and the neural stem cells in the niche are highly regulated by this transmitter [37 –39]. The finding that ES cells possess autocrine GABAergic transmission systems is intriguing and will help improve the general understanding of stem cell biology. First, it improves the postulation that small-molecule transmitters could be the extrinsic factors for modulation of PS cells. Second, through an autocrine/paracrine mechanism, PS cells establish a GABA niche and may be regulated and fine-tuned in this niche by feedback modulation via autoreceptors and signal termination elements. Third, the GABAergic transmission circuit offers several intervention sites for stem cell-based therapeutic exploitation, which could be utilized for drug discovery and toxicity evaluation. Fourth, the widespread use of neuroactive drugs in clinical settings, such as hypnotics and antiepileptics, which act on the GABAergic system, have the potential to affect early developmental cells and embryos.
Footnotes
Acknowledgments
This work was supported by the Natural Science Foundation of China (no.30701018, 81173084), the National Comprehensive Technology Platforms for Innovative Drug R&D of China (no.2012ZX09303-003), the Shanghai Municipal Science and Technology Commission (no.12ZR1415700), the Scientific Research Foundation of State Education Ministry for the Returned Overseas Chinese Scholars, and the Shanghai Municipal Leading Academic Discipline Project (no.S30201). We thank Dr. Xiao C. for helpful comments in experiments and writing.
Author Disclosure Statement
The authors indicate no potential conflicts that are relevant to the manuscript.
References
Supplementary Material
Please find the following supplemental material available below.
For Open Access articles published under a Creative Commons License, all supplemental material carries the same license as the article it is associated with.
For non-Open Access articles published, all supplemental material carries a non-exclusive license, and permission requests for re-use of supplemental material or any part of supplemental material shall be sent directly to the copyright owner as specified in the copyright notice associated with the article.