




Abstract
During mammalian development, placental growth needs to be tightly controlled by apoptosis. However, despite the potentially significant problems, the strategies used to balance growth and apoptosis have remained elusive. Here we report that activation of the Notch1 signal pathway inhibits transduction of transforming growth factor (TGF)-β signaling, which leads to cell cycle arrest and apoptosis in rabbit trophoblast stem cells (TSCs). The subcellular location of notch intracellular domain 1 (NICD1) appears to determine whether TGF-β signaling will be inhibited or not. Moreover, changes in NICD1 subcellular location are regulated by intracellular calcium distribution. Collectively, these results establish a potential mechanism whereby TSCs can balance growth and apoptosis, and thus guarantee the development of the fetus.
Introduction
T
Transforming growth factor (TGF)-β is a member of the TGF superfamily of secreted proteins, which comprises three subtypes: TGF-βs, activins/inhibins, and bone morphogenetic proteins. The TGF-β signal pathway is activated by binding of TGF-β to the type II receptor-serine/threonine kinase (TbRII), which forms a heterodimer with the type I receptor (TbRI, also a serine/threonine kinase). This results in transphosphorylation of TbRI, which in turn phosphorylates the receptor-regulated Smads (R-Smad), Smad2 and Smad3. These then bind to the common Smad, Smad4 (Co-Smad), and they then translocate into the nucleus to regulate target gene expression. TGF-β plays a critical role in many cellular and physiological processes, including cell proliferation, apoptosis, and epithelial-mesenchymal transition [5,6]. For example, TGF-β maintains the self-renewal of trophoblast stem cells (TSCs) in mice [7], and promotes the proliferation of rabbit TSCs [8].
Notch proteins are highly conserved from flies to mammals. Their roles in regulating the determination of cell fate, cell proliferation, and stem cell differentiation have been well studied. There are four Notch receptors in mammals (Notch1–4) and five ligands (Jagged1, 2, Delta-like 1, 3, and 4). Upon ligand binding to the Notch receptors, the receptors are proteolytically cleaved, leading to the release of notch intracellular domain (NICD), which then translocates into the nucleus and binds to CSL protein, converting it into a transcriptional activator, which promotes target gene expression [9 –13]. In the human placenta, the expression patterns of Notch1, Notch4, and Jag1 indicate a potential role for Notch signaling in placenta angiogenesis [14]. Further the Notch signal pathway also takes part in the processes of angiogenesis and arteriogenesis in mouse placenta formation [15,16].
Although some studies have investigated the crosstalk between TGF-β and the Notch signal pathway [17 –23], no reports have yet considered the relationship between Notch1 and TGF-β signaling in TSCs. In the present study, we examined the relationship between the Notch1 signal pathway and TGF-β signaling, and their effects on cell cycle arrest and apoptosis in rabbit TSCs. The TSCs used were derived from rabbit embryonic stem cells, as in our previous study [8]. We also investigated the importance of subcellular location of NICD1 and its regulation by intracellular calcium distribution.
Materials and Methods
Cell culture
Rabbit TSCs were cultured in Dulbecco's modified Eagle's medium (high glucose, without sodium pyruvate; Invitrogen, Carlsbad, CA) supplemented with 2 mM glutamine, 0.1 mM mercaptoethanol, 1× non-essential amino acids (Invitrogen), 1× penicillin-streptomycin, and 15% defined fetal bovine serum (Hyclone, Logan, UT). Cells were used at passage 10–20. All chemicals were from Sigma Chemicals (St. Louis, MO), unless otherwise stated.
Reagents, treatments, and transfection
For thapsigargin (TG) treatment, cells were plated at a density of 2.6×10³ cells/cm2 (low density) in 100-mm (for western blot) or six-well plates [for semiquantitative reverse transcription–polymerase chain reaction (RT-PCR)] and cultured overnight and then 100 nM TG or vehicle control (dimethyl sulfoxide) was added. After 24 h, cells were harvested for experiments. Rabbit TSCs were plated at a density of 2.6×10³ cells/cm2 in 100-mm culture dishes and cultured overnight. The cells were then transfected with 15 μg NICD1-Flag (provided by Dr. Raphael Kopan, Washington University) or Flag empty plasmid (provided by Dr. Bingyu Mao, Kunming Institute of Zoology, Chinese Academy of Sciences). After 48 h, the cells were harvested for analysis.
Cell cycle and apoptosis detection
Cell cycle analysis and the fluorometric CaspACE assay were used to detect apoptosis in rabbit TSCs. For cell cycle analysis, cells were harvested and fixed in precooled 70% ethanol at 4°C for 2 h before incubation with 50 μg/mL propidium iodide plus 100 μg/mL RNase A in phosphate-buffered saline (PBS) for 30 min at 37°C. The DNA content was analyzed using an FACS vantage SE (BD Biosciences, San Jose, CA). Cells with <2N DNA content (subdiploid) were considered as apoptotic, and cells with >2N DNA content were considered to be cycling (non-G0/G1). For fluorometric CaspACE assay, active caspases were detected using the CaspACE FITC-VAD-FMK In Situ Marker (Promega, Madison, WI) to detect caspase-dependent apoptosis, according to the manufacturer's instructions. Briefly, cells were digested and suspended in 1 mL culture medium, followed by the addition of 1 μL of FITC-VAD-FMK (5 μM). After incubation for 20 min at 20°C, the cells were centrifuged, washed in 1 mL of PBS, and fixed in 1 mL of 0.5% formaldehyde for 30 min at 20°C. The cells were centrifuged again and suspended in 0.5 mL PBS prior to flow cytometry. Flow cytometry analysis was performed using an FACS vantage SE (BD). Fluorescence was measured at 530 nm (excitation of 488 nm).
Semiquantitative RT-PCR
Total RNA was extracted from rabbit TSCs using Trizol (Invitrogen). RNAs were subjected to treatment with DNase I (Fermentas, Vilnius, Lithuania) to remove possible genomic DNA contamination. Reverse transcription was carried out with ∼2 μg of total RNA using a RevertAid H Minus First strand cDNA synthesis kit (Fermentas). One microliter of RT products was added to 1× Reaction Ready HotStart PCR Master Mix (Takara) in 25-μL final volume and amplified under the following conditions: 1 cycle at 95°C for 3 min; 25–35 cycles at 95°C for 30 s, 56°C–60°C for 30 s, and 72°C for 30 s; and a full extension cycle at 72°C for 5 min. The specific primer sets used were as follows: glyceraldehyde 3-phosphate dehydrogenase (5′-TGAAGGTCGGAGTCAACGGA-3′) and (5′-TGGTGCAGGAGGCATTGCTG-3′); Notch1 (5′-GGACCCCAGACCTGCTTGTTTGT-3′) and (5′-CCCCAAGGTGTTGAAACAGGTGC-3′); and Hes-1 (5′-GCTCCCGACGGCCAGTTTGC-3′) and (5′-TTCCGCCACGGCCTCCACAT-3′). The PCR products were separated on 2% agarose gels and visualized after staining with ethidium bromide. For semiquantitative RT-PCR, the intensity of the PCR band was semiquantified using Quantity One quantitation software (Bio-Rad, Hercules, CA). The relationship between the inverse of band intensity and the number of PCR cycles was linear.
Immunofluorescence and confocal microscopy
Cells were fixed with 4% paraformaldehyde for 10–15 min at 25°C and then rinsed three times in PBS, followed by permeabilization with 0.2% Triton X-100 for 10–15 min. Cells were then blocked in 5% goat serum for 30 min at 25°C and incubated with primary and secondary antibodies (Supplementary Table S1; Supplementary Data are available online at
Cell proliferation assay
Rabbit TSCs were plated at a density of 2.6×10³ cells/cm2 and transfected with 15 μg NICD1-Flag or Flag empty plasmid for 48 h. Relative cell proliferation rates were measured using a Cell Counting Kit-8 (CCK-8; Dojindo Laboratories, Kumamoto, Japan) according to manufacturer's instructions. Briefly, CCK-8 solution in culture medium at a 1/10 volume ratio was added into each well and the cells were incubated for 4 h. The absorbance at 450 nm was measured using a multiwell plate reader (Awareness Technology, Inc., Palm City, FL). The cell proliferation rate of control cells was set as 1 and the relative rate of transfected cell proliferation was determined by comparison with control cells.
Luciferase assay
Rabbit TSCs were plated at a density of 2.6×10³ cells/cm2 or 2.6×10⁵ cells/cm2 and transfected with PTK-Rellina (Promega) and SBE4-lux plasmids (provided by Dr. Bert Vogelstein, The Howard Hughes Medical Institute & Sidney Kimmel Comprehensive Cancer Center) [24] using TransFast (Promega). The ratio of PTK-Rellina to SBE4-lux was 1:9; the total transfected plasmid was 0.5 μg. For NICD1 overexpression, rabbit TSCs were transfected with 0.5 μg of 3× Flag-NICD1 plasmid or empty Flag plasmid. At 24 h after transfection, the cells were lysed and luciferase activity was determined using a Dual-Luciferase Reporter Assay System (Promega), according to the manufacturer's manual.
Immunoblotting
Cells were washed and lysed in RIPA lysis buffer (Santa Cruz Biotechnology, Inc., Santa Cruz, CA) for 1 h on ice, as described previously [8]. Debris was removed by centrifuging at 12,000 g for 15 min at 4°C. Equal amounts (25 μg) of samples were analyzed by sodium dodecyl sulfate–polyacrylamide gel electrophoresis. Immunoblots were performed using primary antibodies (Supplementary Table S1) and horseradish peroxidase-conjugated secondary antibodies (Supplementary Table S1). Images were obtained by enhanced chemiluminescence (Pierce, Rockford, IL), followed by exposure to Kodak autoradiography Biomax film (Kodak, Rochester, NY). All experiments were repeated three times.
Co-immunoprecipitation of NICD1 with Smad2
Rabbit TSCs were plated at a density of 2.6×10³ cells/cm2 in 100-mm culture dishes, cultured overnight, and then transfected with 15 μg of NICD1-Flag or Flag empty plasmid. At 48 h later, the cells were washed and lysed in RIPA lysis buffer (Santa Cruz Biotechnology, Inc.) for 1 h on ice. Debris was removed by centrifuging at 12,000 g for 15 min at 4°C. Total protein (1 mg) was incubated with 30 μL of anti-Flag antibody conjugated to agarose beads (Santa Cruz Biotechnology, Inc.) overnight at 4°C. The agarose was washed four times with 0.5 mL lysis buffer. Western blots were performed with specific primary antibodies (Supplementary Table S1) and horseradish peroxidase-conjugated secondary antibodies.
Microarray analysis
RNA was extracted from three biological repeats of TSCs that overexpress NICD1 and controls that contain empty vector using TRIZOL Reagent (Invitrogen, Life Technologies, Carlsbad, CA). RNA integrity was confirmed using an Agilent Bioanalyzer 2100 (Agilent Technologies, Santa Clara, CA). An Agilent Whole Rabbit Genome Chip (Agilent Technologies) was used for gene expression analysis. All samples were normalized using the R/Bioconductor limma package. Differentially expressed genes (DEGs) were defined by comparison between NICD1-overexpressing and control cells. The initial DEGs for each data set were selected based on the following threshold: absolute fold change (|FC|) ≥1.5; the P value was based on two-tailed Student's t-test results ≤0.05.
Detection of intracellular calcium concentration
Cells were incubated for 30 min in TSCs culture medium containing 8 μM Fluo-3/AM (Roche, Basel, Switzerland), a fluorescent calcium indicator. The cells were subsequently washed three times with prewarmed ES medium to remove the dye. For TG treatment, cells were treated with TG for 30 min and then incubated with 8 μM Fluo-3/AM. The resultant fluorescent images were analyzed under an LSM 510 META confocal microscope (Carl Zeiss) using an excitation wavelength of 488 nm.
Statistical analysis
The results were presented as mean±standard error of the mean. Statistical analyses were performed using SPSS version 11.0 software. The percentages of cell cycle distributions and apoptosis were transformed by arcsine of the square root prior to ANOVA analysis, followed by Tukey's test. P≤0.05 indicated a significant difference. For single-mean comparisons, Levene's test for equality of variances followed by a t-test for independent samples was used to assess significance.
Results
Notch signaling was activated in rabbit TSCs undergoing apoptosis
Rabbit TSCs were healthy when cultured at low (2.6×10³ cells/cm2) cell density. At high density (2.6×10⁵ cells/cm2), however, cells appeared unhealthy and displayed symptoms of apoptosis, including blebbing and nuclear fragmentation. The occurrence of apoptosis was validated by fluorometric CaspACE assay. The activation levels of caspases in cells grown at low and high cell densities were examined by staining with 5 μM FITC-VAD-FMK, which binds to activated caspase, especially caspase-3, and serves as in situ marker for apoptosis. Obviously, there was a significantly higher proportion of activated caspases in cells cultured at high cell density (Fig. 1A). Cells cultured at low and high densities therefore provided a simple model for studying the molecular basis of TSC apoptosis.
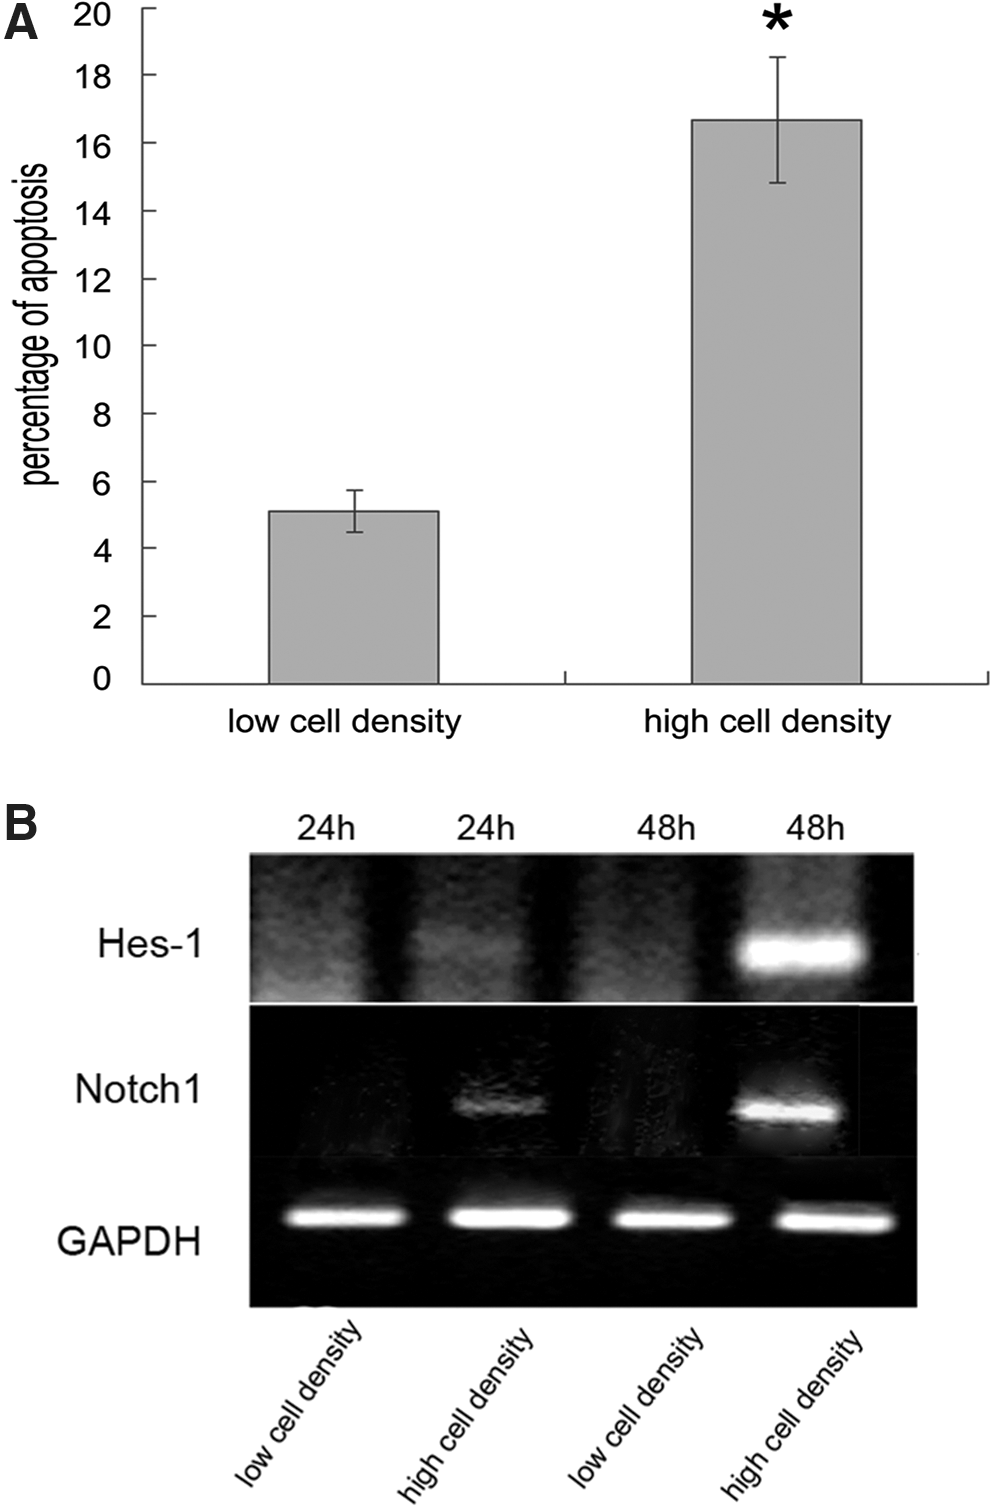
Notch signaling was activated in rabbit trophoblast stem cells (TSCs) undergoing apoptosis.
To determine why cells at high density underwent apoptosis, we investigated the activation status of the Notch signaling pathway, which could be induced by intensive cell–cell contact [9]. Hes-1 is a Notch-signaling target, and its expression has been widely used as a reliable indicator of Notch signaling activation [25]. We therefore examined Hes-1 expression in cells cultured at low and high densities. Semiquantitative RT-PCR showed weak induction of Hes-1 expression in high-density, but not in low-density, cells at 24 h of culture. After 48 h, Hes-1 expression was increased in cells at high density, whereas no visible band was detected at low density. Expression of the receptor Notch1 displayed a similar pattern (Fig. 1B). These data demonstrated that Notch signaling activity was significantly higher in cells cultured at high density. Activation of Notch was accompanied by proteolytic cleavage of receptors and the release of NICD. We therefore examined NICD1 protein levels in cells grown at low and high densities. Unexpectedly, there was no significant difference in NICD1 protein expression levels between cells cultured under these different conditions (data not shown). Compared with the same phenomenon in a p53-function study, p53-mediated transactivation of target genes was blunted when p53 was localized in the nucleolus, whereas p53 promoted target gene expression when it was freely soluble in the nucleus [26]. We therefore determined the subcellular distribution of NICD1 at different cell densities and observed that NICD1 colocalized with the nucleolar protein fibrillarin at low cell density, but was freely soluble in the nucleus and cytoplasm at high cell density, as confirmed by costaining with NICD1 and the nuclear membrane marker lamin B1 (Fig. 2A, B). This result implies that nuclear localization of NICD1 might be associated with activation of Notch signaling.

Subcellular distributions of notch intracellular domain 1 (NICD1) at different cell densities.
Notch activation led to apoptosis of rabbit TSCs
Given that rabbit TSCs undergoing apoptosis demonstrated active Notch signaling, we proposed that Notch signaling might be able to induce apoptosis in TSCs. To test this hypothesis, we ectopically expressed the active form of Notch1 (NICD1 tagged with Flag) in TSCs cultured at low density, and evaluated its influence on cell proliferation, as well as apoptosis. Overexpression of NICD1 for 48 h led to inhibition of proliferation compared with control TSCs transfected with an equivalent amount of empty vector (Fig. 3A). Meanwhile, a significantly higher proportion of cells underwent apoptosis (Fig. 3B). These results suggest that activation of Notch caused cell cycle arrest and apoptosis.
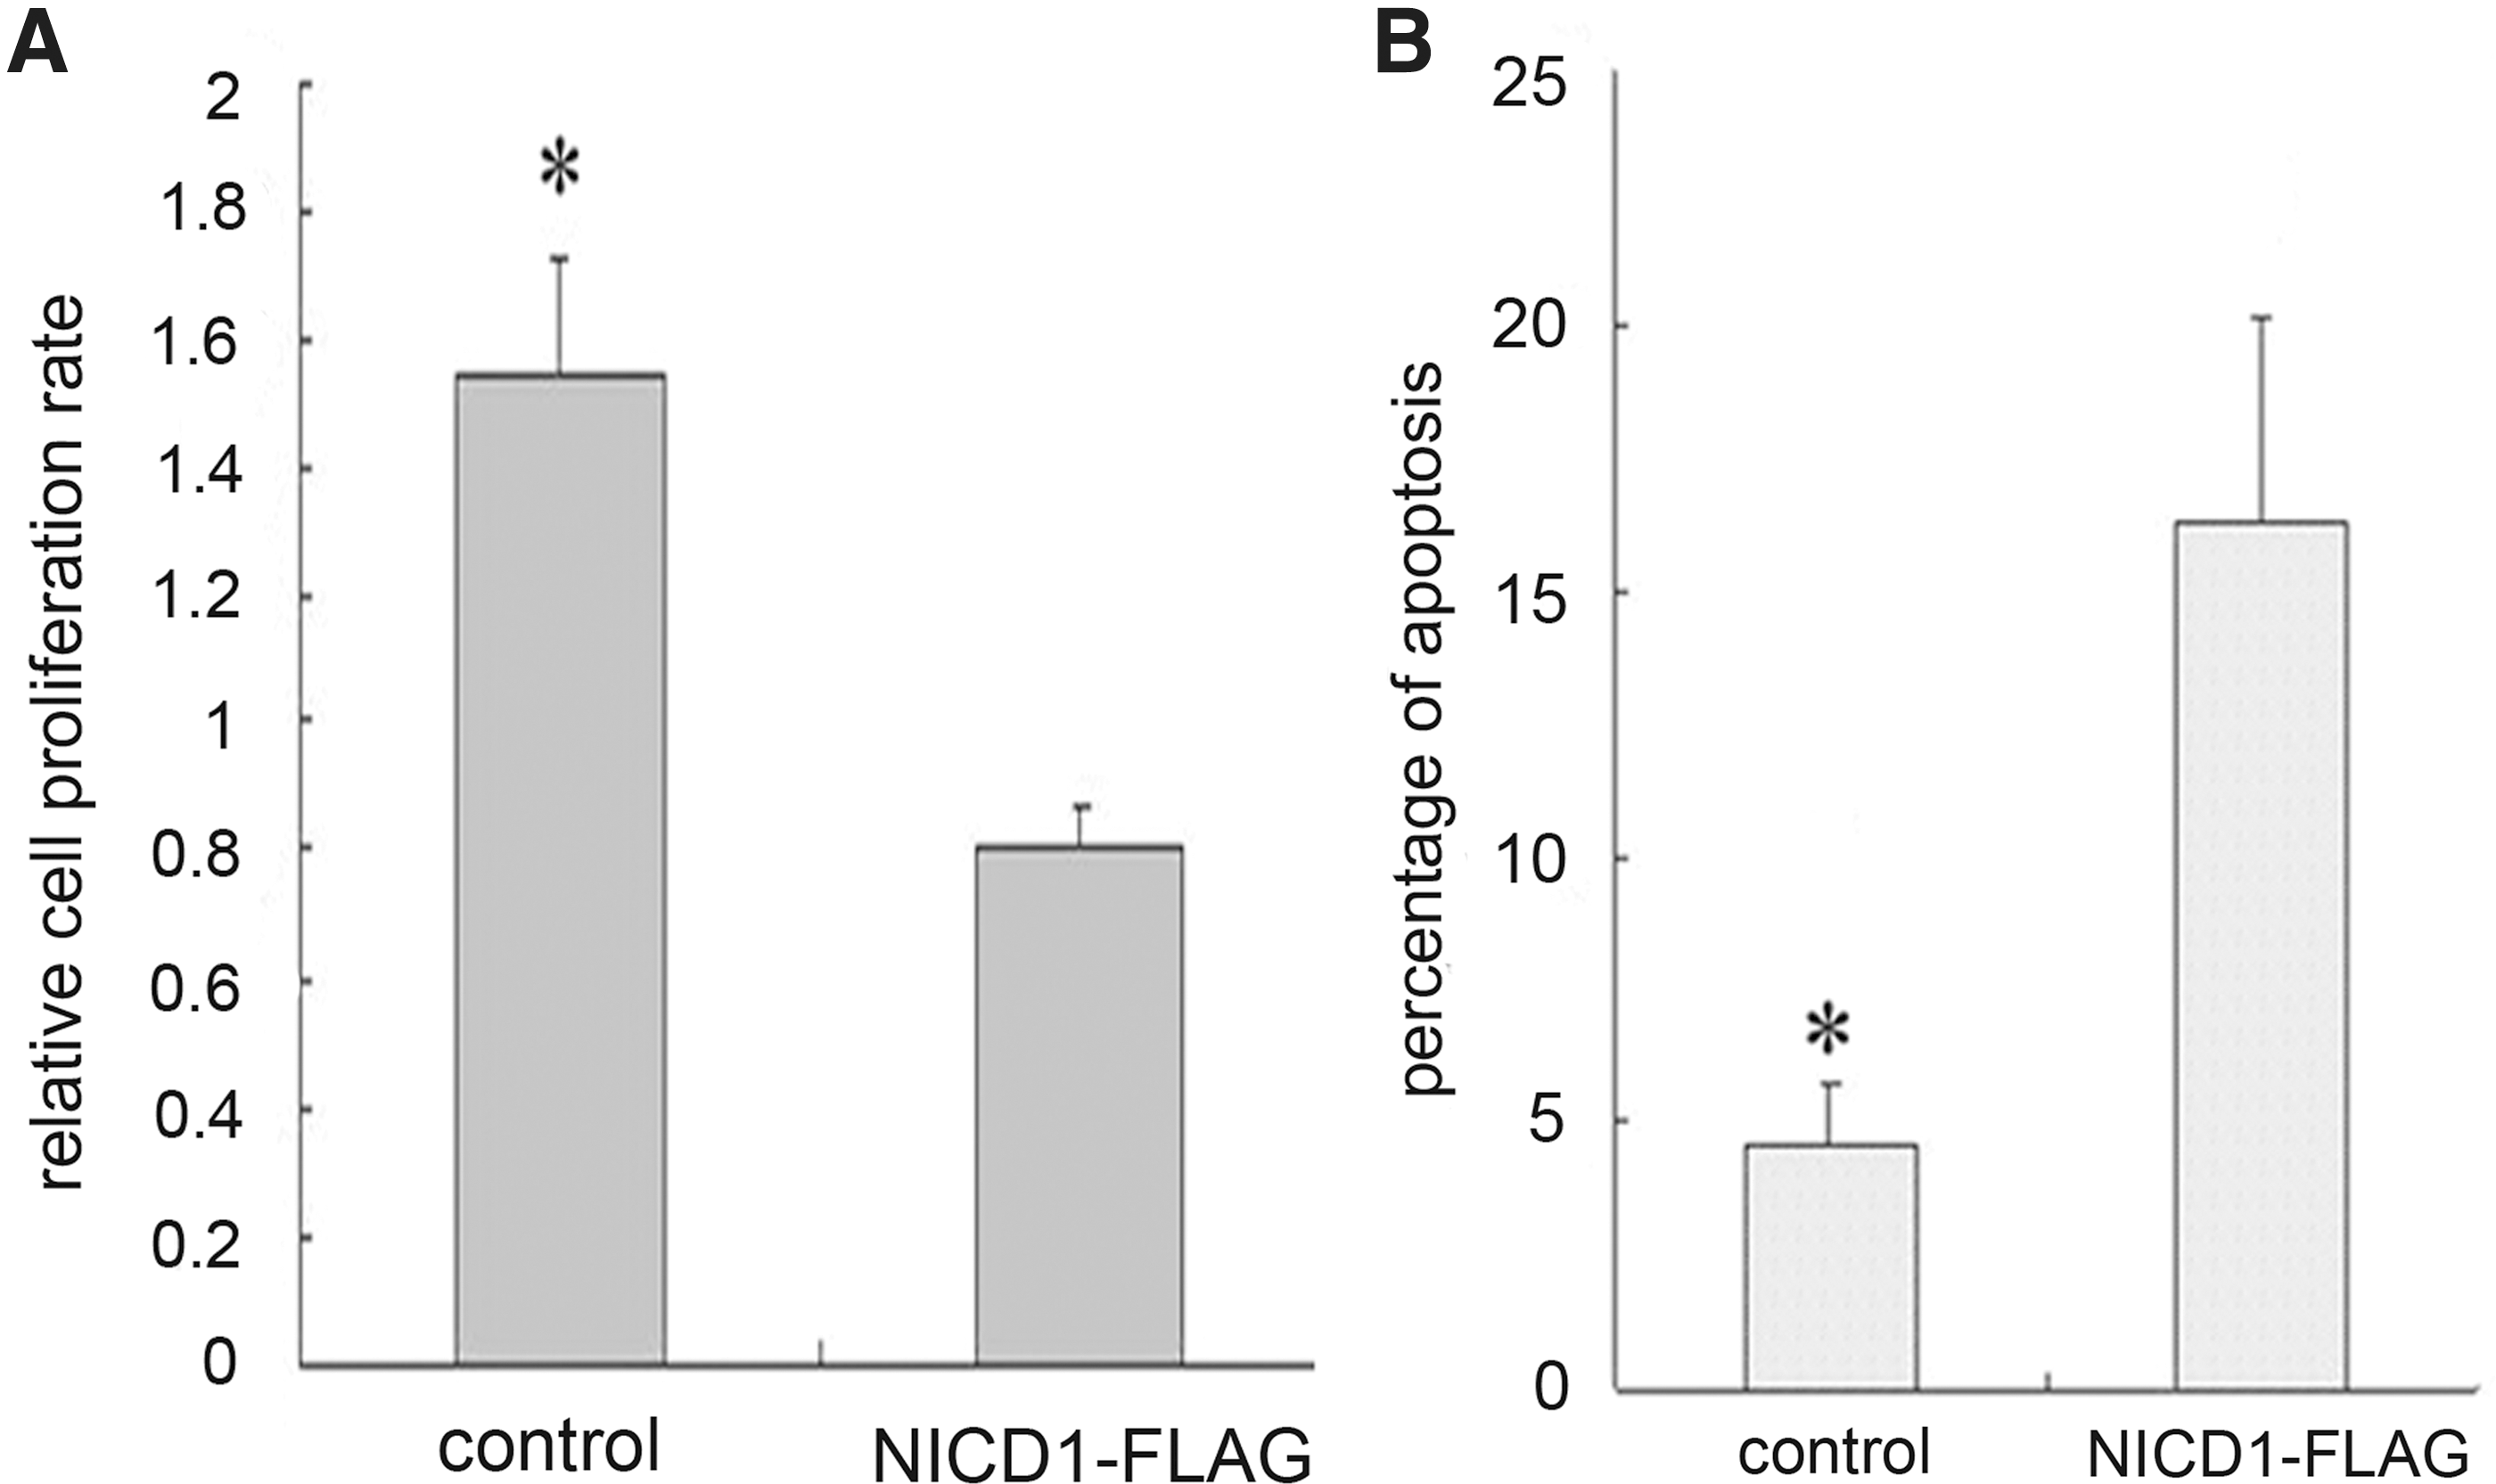
Notch activation led to apoptosis of rabbit TSCs.
Notch activation suppressed TGF-β signaling in TSCs
Our previous study showed that TGF-β was indispensable for self-renewal of rabbit TSCs [8]. Given that activation of Notch led to the loss of TSC self-renewal, we assumed that Notch signaling could suppress TGF-β activity. To this end, we transfected cells with SBE4-luc plasmid that contains four Smad3/Smad4-binding consensus sequences [24] to monitor the activation of TGF-β signaling. Ectopic activation of Notch by overexpression of NICD1, as described earlier, in TSCs at low density significantly reduced luciferase activity, indicating suppression of TGF-β signaling. TSCs cultured at high density consistently showed lower TGF-β activity than those cultured at low cell density (Fig. 4A). To further confirm the suppressive effect of Notch signaling on the TGF-β pathway, we assessed the phosphorylation of serines 465 and 467 on Smad2, which provides another indicator of TGF-β signaling activation [27]. As shown in Fig. 4B, Smad2 phosphorylation was sharply attenuated in TSCs at high density, while Notch activity was increased. Further, ectopic activation of Notch in TSCs cultured at low density inhibited Smad2 phosphorylation (Fig. 4C). Taken together, these results suggest that increasing Notch signaling suppressed the TGF-β pathway.
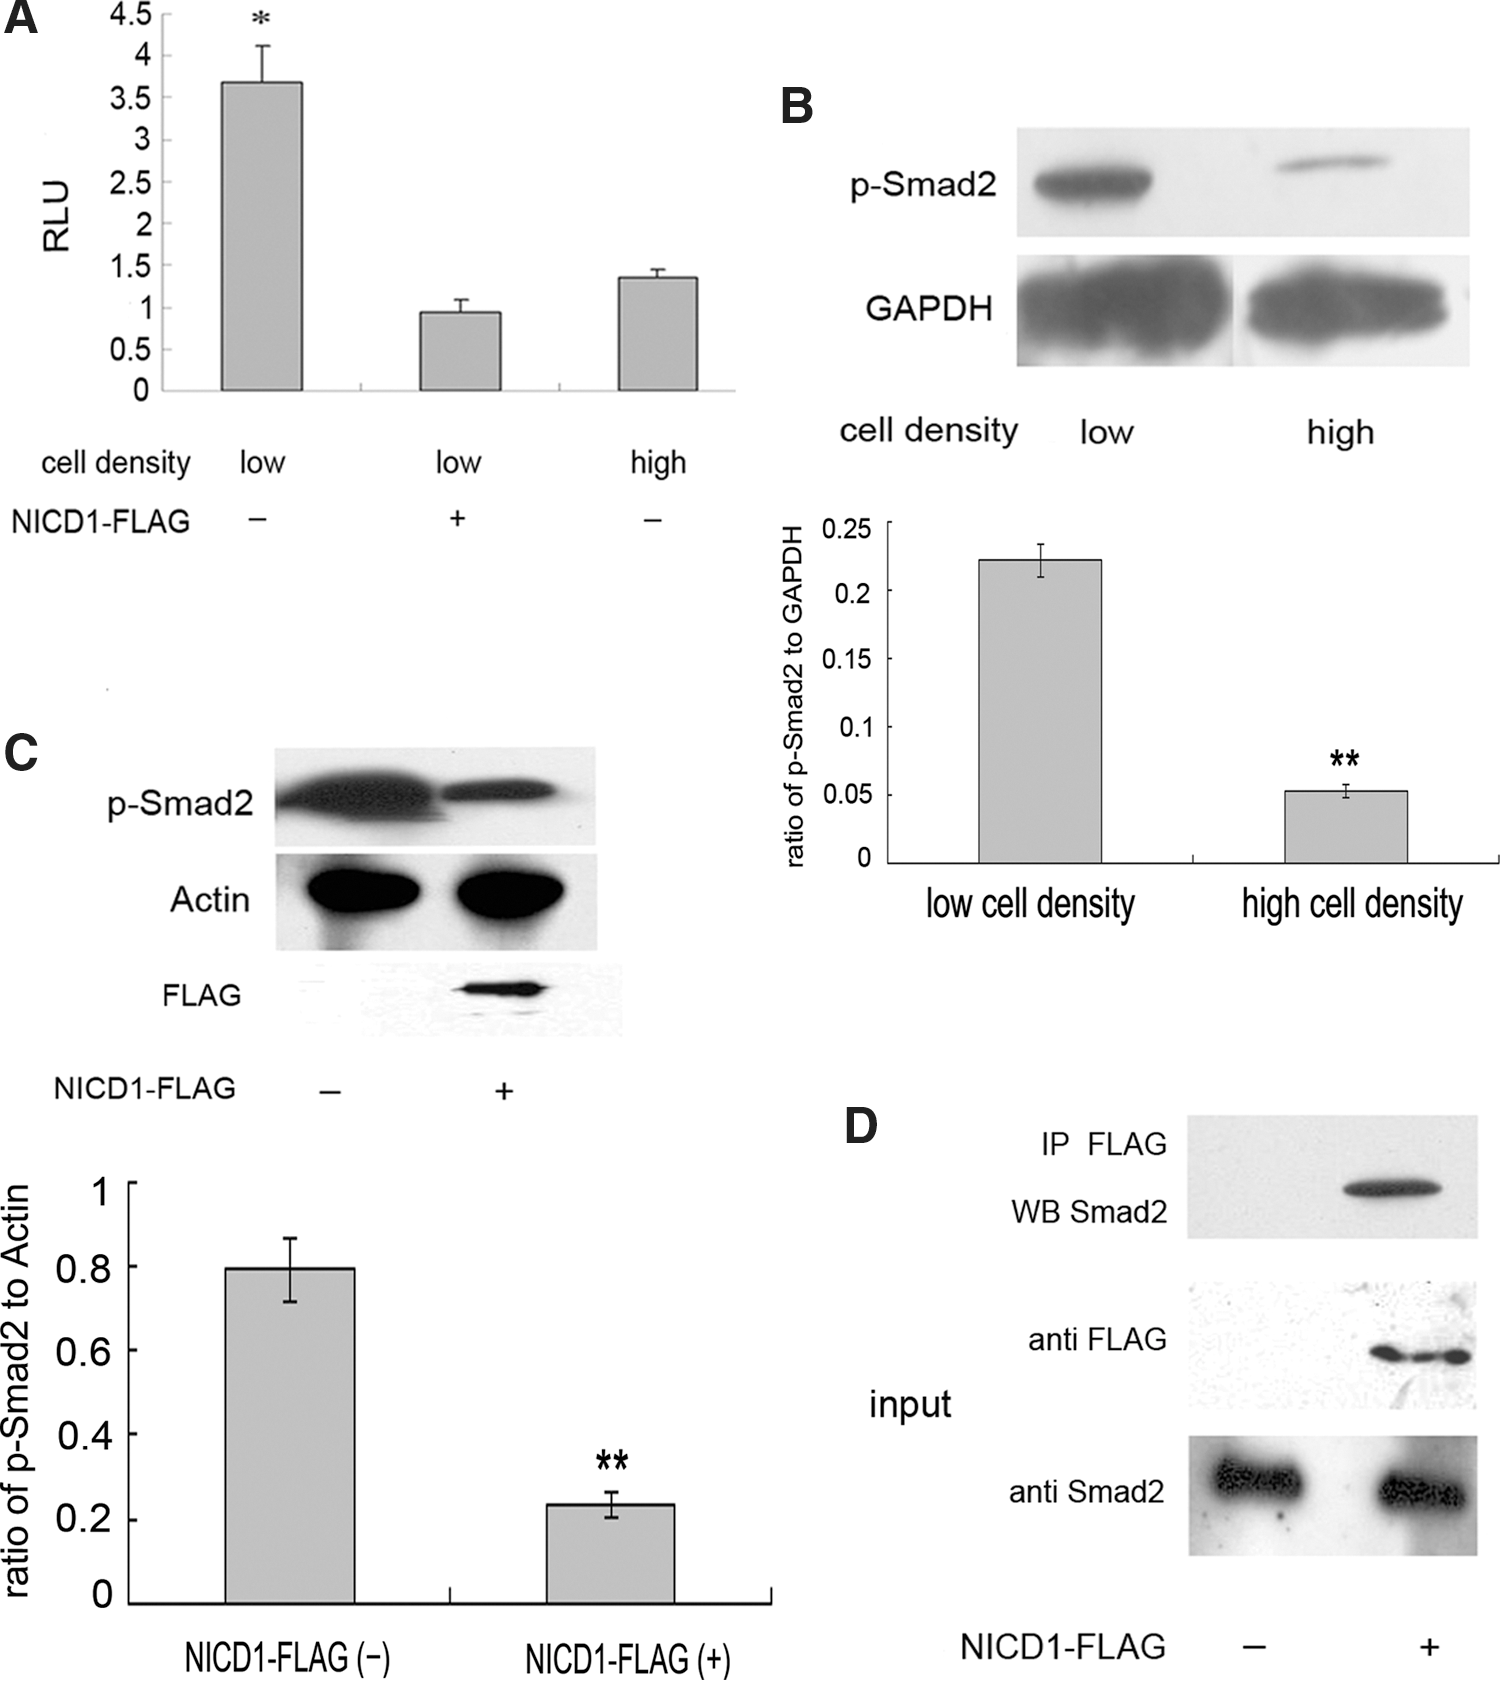
Notch activation suppressed transforming growth factor (TGF)-β signaling in rabbit TSCs.
Previous studies reported the binding of Smad3, a component of TGF-β signaling, to the active form of Notch receptors. This interaction competitively inhibited the phosphorylation of Smad3, leading to inhibition of TGF-β signaling [17]. We performed co-immunoprecipitation experiments to determine whether NICD1 binding to Smad2 could account for the decrease in Smad2 phosphorylation. As shown in Fig. 4D, NICD1 bound to Smad2 in TSCs even at low cell density. This interaction could explain the inhibitory effect of NICD1 on Smad2 phosphorylation and the fact that nucleolar location of NICD1 led to sequestering of NICD1, thereby blunting the interaction between NICD1 and Smad2.
To explore the downstream targets affected by activation of Notch signaling, we compared gene expression profiles between TSCs that overexpress NICD1 and controls that contain empty vector. Microarray analysis yielded a list of DEGs (Supplementary Table S2). Interestingly, NICD1 overexpression increased the mRNA levels of Notch signal family members, such as Hes-1 and jagged-1. These DEGs were grouped into pathways involved in cell proliferation regulation, blood vessel development, and negative regulation of cellular biosynthetic process (Supplementary Table S2).
Intracellular distribution of calcium-regulated Notch signaling activation
Previous studies reported that NICD1 exists in various conformations depending on the intracellular calcium concentration. Depletion of intracellular calcium activated the Notch signaling pathway [28,29]. To determine whether this occurred in rabbit TSCs, we compared the calcium distribution patterns in TSCs cultured at low and high densities, and with low and high Notch activities, respectively. Fluo-3/AM, a specific calcium fluorescence indicator [30], was used to detect the calcium distribution. At low cell density, most of the calcium was accumulated in the cytoplasm. However, calcium was also detected in the nucleus in cells cultured at high density (Fig. 5A, B). This suggests that translocation of calcium from the cytoplasm into the nucleus was correlated with Notch activation.

Intracellular distribution of calcium regulated Notch signaling activation. Cells at low
To determine whether calcium relocation could indeed invoke Notch activation in rabbit TSCs, we treated the cells with TG to induce nuclear accumulation of calcium [31]. Treatment of TSCs at low density with TG for 30 min led to obvious nuclear accumulation of calcium (Fig. 5C, D). Following continuous treatment for 24 h, we assessed the changes in Notch1 and Hes-1 mRNA expression levels. TG treatment increased the mRNA expression levels of Notch1 and Hes-1, indicating activation of Notch signaling (Fig. 5E). Concordantly, we also observed translocation of NICD1 from the nucleolus before treatment into the nucleus after treatment (Fig. 5F). In accord with the activation of Notch signaling in TSCs treated with TG, we observed an increase in the cell population in G1 phase and a decrease in the cell population in S phase (Fig. 5G). In contrast to the activation of Notch signaling, Smad2 phosphorylation was decreased by TG treatment (Fig. 5H). Overall, these results indicate that calcium accumulation in the nucleus invoked Notch signaling activation, which in turn induced apoptosis and suppressed TGF-β signaling in rabbit TSCs.
Discussion
We report here that activation of Notch1 blunts the transduction of TGF-β signaling, leading to TSC cell cycle arrest or/and apoptosis. Previous studies indicated that activation of Notch1 and Notch4 could inhibit TGF-β signaling, through interactions between NICD1 and NICD4 with Smad3. NICD4 binding had no effect on Smad3 phosphorylation [17,20]. Fu et al. recently reported that NICD4 reduced the expression of Smad1 and Smad2 in human endothelial cells, but promoted the expression of Smad3 at the mRNA level, indicating that NICD4 activated TGF-β signaling through Smad3 [32]. In addition to modulation of the TGF-β signal pathway by Notch, TGF-β can also regulate the Notch signal pathway. TGF-β1 activated the expression of the Notch target genes and ligand—Hes-1, Hey-1, and Jagged1, respectively—in epithelium [17,18]. The results of the present study data indicated that NICD1 inhibited phosphorylation of Smad2 by binding to it, thus blunting activation of the TGF-β signal pathway, and leading to cell cycle arrest and apoptosis in rabbit TSCs. Our previous study showed that the TGF-β signal pathway promoted the proliferation of rabbit TSCs, and interruption of TGF-β signaling by the TGF-β type I receptor inhibitor SB431542 led to decreased mRNA expression levels of Eomes, Gcm1, and Hand1 [8]. These results support the important role of the TGF-β signal pathway in maintaining the differentiation ability of rabbit TSCs. The influence of NICD1 on the differentiation ability of rabbit TSCs through blunting the TGF-β signal pathway is currently being investigated.
However, our results could not exclude the possibility that NICD1 could reduce the expression of Smad2 at the mRNA or/and protein level, which mechanism could play a significant role in this process. Further studies are needed to clarify the potential roles of transcriptional or/and translational inhibition, or ubiquitination of Smad2 in this process.
In this study, we reported that the subcellular location of NICD1 determined its function. This was in accordance with the phenomenon observed in p53-function regulation. p53 was found to accumulate in the nucleolus in human neonatal diploid fibroblasts after treatment with the proteasome inhibitor MG132, and was unable to induce expression of its target gene p21. This suggested that p53 function was attenuated when it was located in the nucleolus. Later studies indicated that accumulation of p53 in the nucleolus after MG132 treatment was adenosine triphosphate dependent, and showed that p53 also accumulated in the nucleolus in some cancer cells [33]. These studies further confirmed the idea that nucleolar accumulation of p53 inhibited its function. Further, the pivotal transcription factor in regulating placenta and heart formation, Hand1, also undergoes similar subcellular translocation. Mouse TSCs maintained self-renewal if Hand1 was located in the nucleolus, but differentiated into giant trophoblasts when Hand-1 was not located in the nucleolus [34]. Based on these and our own findings, we conclude that the nucleolus is not only a location for ribosome biogenesis, as proposed by Boisvert et al. [35], but may also be important in many cellular and physiological processes, including cell proliferation, apoptosis, and stem cell fate determination. When transcription factors are located in the nucleolar environment, they are separated from their target genes and from other nuclear factors. Hooper et al. recently reported that NICD1 was enriched in subnuclear bodies in neuroblastomas, and that this accumulation was NICD1-transactivation-domain dependent [36]. Further studies are needed to determine whether NICD1 nucleolar translocation in TSCs is transactivation-domain dependent.
Our results demonstrated that changes in calcium distribution could modulate the subcellular location of NICD1. Previous studies reported that calcium chelation in the culture medium by EDTA could activate Notch1 [28], and that binding of Notch ligand to its receptor was calcium dependent [37]. Overall, these data suggest the existence of a relationship between calcium concentration and activation of the Notch signal pathway. However, few studies have so far examined the relationship between intracellular calcium concentration and Notch signal pathway activation. We provide the first evidence to indicate that the subcellular location of NICD1 is regulated by the intracellular distribution of calcium, which in turn determines the fate of rabbit TSCs.
In summary, we demonstrated that activation of the Notch1 signal pathway inhibited transduction of TGF-β signaling, leading to cell cycle arrest and apoptosis in rabbit TSCs. Moreover, inhibition of TGF-β signaling was determined by the subcellular location of NICD1, which was in turn regulated by the intracellular calcium distribution. These results shed further light on our understanding of human implantation and placentation, and on the molecular pathophysiology of pregnancy complications such as pre-eclampsia.
Footnotes
Acknowledgments
This work was supported by National Program on Key Basic Research Project of China (973 Program; grant no. 2012CBA01307), National High-tech R&D Program of China (863 Program; grant no. 2012AA020701), and National Natural Science Fund for Young Scholars Grant (grant no. 31101066). The authors thank Dr. Ping Zheng for critical reading of the article and helpful discussions. The authors also thank Dr. Bert Vogelstein, Dr. Raphael Kopan, and Dr. Bingyu Mao for their kind gifts of the SBE4-lux, NICD1-Flag, and Flag expression plasmids.
Author Disclosure Statement
The authors declare no competing financial interests.
References
Supplementary Material
Please find the following supplemental material available below.
For Open Access articles published under a Creative Commons License, all supplemental material carries the same license as the article it is associated with.
For non-Open Access articles published, all supplemental material carries a non-exclusive license, and permission requests for re-use of supplemental material or any part of supplemental material shall be sent directly to the copyright owner as specified in the copyright notice associated with the article.
