
Abstract
Recently, it has been suggested that cellular senescence is associated with stem cell exhaustion, which reduces the regenerative potential of tissues and contributes to aging and age-related diseases. Mesenchymal stem cells (MSCs) attract a large amount of attention in stem cell research and regeneration medicine because they possess multiple advantages and senescent MSCs could be one of the most useful stem cell models in aging studies. It is important to quantitatively evaluate senescence markers to both identify and study the mechanisms involved in MSC senescence. Reverse transcription quantitative real-time polymerase chain reaction (RT-qPCR) is currently the most widely used tool to quantify the mRNA levels of markers. However, no report has demonstrated the optimal reference genes that should be used to normalize RT-qPCR in senescence studies of MSCs. In this study, we compared 16 commonly used reference genes (GAPDH, ACTB, RPL13A, TBP, B2M, GUSB, RPLPO, YWHAZ, RPS18, EEF1A1, ATP5F1, HPRT1, PGK1, TFRC, UBC, and PPIA) in proliferating or replicative-senescent human adipose-derived MSCs (hAD-MSCs) that were isolated from seven healthy donors aged 29–59 years old. Three algorithms (geNorm, NormFinder, and BestKeeper) were used to determine the most optimal reference gene. The results showed that PPIA exhibited the most stable expression during senescence, while the widely used ACTB exhibited the lowest stability. We also confirmed that different reference genes lead to different evaluations of senescence markers. Our work ensures that results obtained from senescence studies of hAD-MSCs will be appropriately evaluated in both basic research and clinical trials.
Introduction
R
In stem cell research and regeneration medicine, as a type of representative adult stem cell, mesenchymal stem cells (MSCs) have attracted a great deal of attention because of their multiple advantages [6,7]. For example, our and other groups have demonstrated that MSCs can be directed to differentiate into adipocytes, osteoblasts, chondrocytes, neurons, astrocytes, endothelial cells, hepatocytes, and pancreatic cells when cultured under the appropriate conditions [8 –14]. MSCs secrete multiple bioactive molecules that play important roles in maintaining tissue homeostasis and immunomodulation [15,16]. In addition, MSCs appear to be “resident” stem cells in many tissues, where they can be stimulated to proliferate and differentiate when tissue repairs are required [8]. Importantly, MSCs can easily be obtained and cultured in vitro, and they can therefore be used in clinical trials without the limitation of ethics [6,12,17].
Because of these advantages, MSCs are increasingly recognized as a useful stem cell model for aging studies. Zhang et al. reported that ESC-WRT−/− cells derived MSCs recapitulated the features of premature cellular aging, which included a global loss of H3K9me3 and changes in heterochromatin architecture [18]. Cieslik et al. reported a causal link between deficiencies in MSC differentiation and elevated circulating insulin levels in aging mice and suggested that this might explain the presence of interstitial fibrosis in aging hearts [19].
To advance the study of MSC senescence, it is important to quantitatively evaluate senescence markers to both identify and study the mechanisms of MSC senescence. Reverse transcription quantitative real-time polymerase chain reaction (RT-qPCR) analysis is currently the most widely used tool for measuring the abundance of gene transcripts. RT-qPCR has many advantages, including sensitivity, speed, and high throughput [20]. As a relatively quantitative method, accurate normalization in this technique is crucial to ensuring reliable evaluations of gene expression [21]. Therefore, reference genes that can be used as normalizers are needed to show no or only minimum variation in the expression levels of genes between different samples and experimental conditions. GAPDH, ACTs (actins), PPIs (cyclophilins), and microglobulin-encoding genes are the most frequently used “traditional” reference genes.
However, the expression levels of many of these genes have been reported to vary considerably between different cells and during different processes [22]. In MSCs, these “traditional” reference genes have also been reported to be unstable, and reference genes viewed as optimal have been shown to vary under different inducing conditions [23]. However, no report has explored which reference genes are optimal for RT-qPCR in senescence studies that use MSCs.
Therefore, in this study, we evaluated the expression levels of 16 commonly used reference genes in proliferating and replicative-senescent MSCs that were derived from human adipose tissues (hAD-MSCs), which were themselves isolated from seven healthy donors aged between 29 and 59 years old. Three algorithms (geNorm, NormFinder, and BestKeeper) were used to determine which the optimal reference gene was.
Materials and Methods
Isolation and expansion of MSCs from adult human adipose tissue
Human adipose tissue was obtained from donors undergoing liposuction according to procedures approved by the Ethics Committee at the Chinese Academy of Medical Sciences and Peking Union Medical College. The isolation and culture procedure was described in our previous study [13,14].
Fluorescence-activated cell sorting analyses
For fluorescence-activated cell sorting (FACS) analysis, the third passage of human adipose-derived MSCs (hAD-MSCs) was used. The cells were detached and washed with PBS containing 0.5% BSA (Sigma) and incubated with primary antibodies for 30 min at 4°C. Working concentrations for primary antibodies against human CD73, CD105, CD90, CD31, CD34, CD44, CD29, and HLA-DR (BD Biosciences) were 10–20 ng/mL, with same-species, same-isotype irrelevant antibody as a negative control. After washing, the cells were incubated with FITC and phycoerythrin (PE)-conjugated secondary antibodies for 30 min at 4°C. Then, washed three times, cells were resuspended in PBS and analyzed by FACSCalibur flow cytometer and the CellQuest Pro software (BD Biosciences).
Senescence-associated β-gal staining
Senescence-associated β-gal (SABG) staining was performed with Senescence β-Galactosidase Staining Kit (Beyotime) according to the manufacturer's instructions. Staining was examined by microscopy.
Western blotting
Briefly, cells were harvested in RIPA lysis buffer (Beyotime). Whole cell protein extracts were qualified by BCA assay (Beyotime), and equal quantities of extracts (20 μg/well total protein) were separated onto NuPAGE 12% polyacrylamide gels (Invitrogen), transferred to nitrocellulose membranes (Bio-Rad), blocked in 5% nonfat milk in Tris-Buffered Saline and Tween 20, and incubated overnight at 4°C with antibodies for P16INK4a (1:500; Abcam), P21CLP1 (1:800; Abcam), and CyclinA2 (1:150; Abcam), respectively. GAPDH (1:1000; Santa Cruz Biotechnology) on the same membrane was used as a loading control. Signals were revealed after incubation with anti-rabbit IgG secondary antibody (1:3000; NeoBiotechnology) or anti-mouse IgG secondary antibody (1:2000; NeoBiotechnology) coupled to peroxidase by using electrochemiluminescence (Amersham Biosciences). All antibodies were diluted with 3% BSA.
In the analysis of references, GAPDH, ACTB (1:3000; Abcam), and PPIA (1:1000; Cell signaling technology) are on the same membrane. The software Image-Pro Plus 6.0 and Gel-Pro Analyzer 4 were used for gray scale analysis.
Immunofluorescence
The cultured cells were washed with PBS three times, 4% PFA fixed (10 min), and 0.5% Triton X-100 (10 min) to penetrate the cells, then blocked by incubating in 1% BSA for 1 h. The cells were then incubated with antibodies for P16INK4a (1:100 dilution in 1% BSA; Abcam) and P21CLP1 (1:100 dilution in 1% BSA; Abcam) overnight at 4°C. The secondary antibody (red) eFluor 660 (eBioscience) was applied at a 1/200 dilution in 1% BSA for 1 h. DAPI was used to stain the cell nuclei (blue) at a concentration of 1.43 μM (1:1000). Then, viewed by OLYMPUS single-laser confocal microscopy to observe P16INK4a and by fluorescence microscopy to observe P21CLP1 expression.
RNA isolation and cDNA synthesis
Total RNA was extracted using TRIzol total RNA isolation reagent (Invitrogen) and digested with DNase I and RNase Inhibitor (TAKARA) according to the manufacturer's instructions. Total RNA concentration was verified using a NanoDrop 2000 spectrophotometer (Thermo Scientific). RNA integrities were assessed using electrophoretic techniques. First-strand cDNAs were synthesized using the Quantiscript RT Kit (TaKaRa Bio) according to the manufacturer's instructions. Final cDNA was diluted 1:10 before use in RT-qPCR.
Primer design
All reference candidates' primers for RT-qPCR analysis were designed using the NCBI Primer Designing Tool (
Primer validation
All primers were examined for their target specificity by endpoint PCR, with hAD-MSCs cDNAs as templates, using the following conditions: the final 25 μL PCR contains 12.5 μL TaqPCR MasterMix (TIANGEN), 1 μL of AD-MSCs cDNA (20 ng), 1 μL of 10 mM of forward and reverse primers, and 10.5 μL of ddH2O. The PCR program consists of initial denaturation at 94°C for 3 min, 33 cycles of 94°C for 30 s, 60°C for 30 s, and 72°C for 50 s, followed by final extension at 72°C for 5 min. Amplification products were checked on 2% agarose gels for a single band of correct size.
The linearity of target amplification for calculation of primer efficiency was evaluated using quintuplicate serial dilutions (1:1, 1:10, 1:100, 1:1000, and 1:10000), thus, cDNA sample (100–0.01 ng/μL) as templates on a Bio-Rad CFX96 Real-Time System instrument (Bio-Rad Laboratories) as described below. The quantification cycle values versus cDNA concentration input were plotted to determine the slope values and correlation coefficients (R 2). The corresponding RT-qPCR primer efficiencies (E) were calculated according to the following equation: E = 10−1/slope.
Quantitative real-time PCR
RT-qPCR was performed in a Bio-Rad CFX96 Real-Time PCR Detection System instrument (Bio-Rad Laboratories) with SYBR Green I real-time PCR kit (TaKaRa Bio). Each reaction was performed in triplicates in a reaction volume of 20 μL in 96-well microtiter plates (Applied Biosystems). All reactions contained 1 μL of cDNA (20 ng), 10 μL of SYBR Green Mix, 1 μL of 10 mM of each primer, and 8 μL of DEPC-treated water. The reaction protocol starts with 3-min template denaturation step at 95°C, 40 cycles of 95°C for 5 s, and 60°C for 30 s, and a melt curve at the end of the cycling protocol with measurement from 55°C to 95°C. Blank controls run for each primer master mix.
Baseline and threshold values of RT-qPCR were automatically determined by the Bio-Rad CFX Manager software, and results were imported to Microsoft Excel. The mean values of triplicates were obtained for further calculations. Raw Cq values were transformed to quantities based on 2−▵▵Cq method. The data obtained have been converted to proper input files according to requirements of the three programs, then analyzed using geNorm (version 3.5), NormFinder (version 0.953), and BestKeeper VBA applets.
Statistical analyses
All statistical analyses were performed with SPSS software version 17.0. The P-values were calculated using a Student t-test, and P-values <0.05 were considered to be statistically significant.
Results
Senescence model of hAD-MSC
The hAD-MSCs were isolated from seven healthy donors, whose ages and genders were 29 (female), 29 (male), 30 (female), 40 (female), 41 (female), 47 (female), and 59 (female). According to these origins, these cells were named A29, A29m, A30, A40, A41, A47, and A59, respectively. Immunophenotype profile showed that they expressed the typical MSC surface antigens and were negative for markers (Supplementary Fig. S1a). The third passage of each hAD-MSC was considered as the proliferating stage and marked with A29P, A29mP, A30P, A40P, A41P, A47P, and A59P, respectively. Cells in the senescent stage were obtained by culturing them through prolonged passages until the doubling time was >1 week. These cells were correspondingly labeled A29S, A29mS, A30S, A40S, A41S, A47S, and A59S.
In the senescent stage, the cells underwent irreversible growth arrest and displayed a combination of senescence-related phenotypes, including the morphological changes of cells and nuclei (Supplementary Fig. S1b), the increased secretion of SABG (Supplementary Fig. S1c), the increased expression levels of the senescence-related proteins p21CLP1 (CDKN1A) and p16INK4a (Supplementary Fig. S1d–f), and meanwhile the reduced expression levels of the proliferation-related protein cyclinA2 (Supplementary Fig. S1d). MSCs derived from different donors became senescent during different passages displaying individual differences. These results show that our cellular senescence model of hAD-MSCs was successfully achieved.
RNA quality control
To ensure that our results are accurate and reliable, all 14 RNA samples were digested using DNAse I to eliminate contamination by genomic DNA. The A260/A280 ratios of the RNA samples were between 1.82 and 2.08, and the mean A260/A230 ratio was 2.04. We also performed agarose gel electrophoresis to determine the integrity of four randomly selected total RNA samples, and the samples demonstrated a 28S/18S rRNA ratio that was ∼2 (Supplementary Fig. S2d). Furthermore, we tested all of the cDNA samples for residual genomic DNA using PCR with a special pair of primers that was located in the neighboring exons 5 and 6 of the HNRNPA2B1 gene. The results showed that all of our obtained RNA samples were free of genomic DNA contamination because no genomic PCR amplicon was obtained (Supplementary Fig. S2a). Thus, all of the RNA samples were suitable for RT-qPCR analysis.
Reference candidate and primer quality control
We chose 16 commonly used references genes (GAPDH, ACTB, RPL13A, TBP, B2M, GUSB, RPLPO, YWHAZ, RPS18, EEF1A1, ATP5F1, HPRT1, PGK1, TFRC, UBC, and PPIA) as “reference candidates.” The details related to these candidates and their primers are provided in Table 1 and Supplementary Table S1.
All of the primers for the candidate genes were chosen according to the general rules of qPCR primer design. First, each pair of primers was confirmed to identify only one specific PCR amplicon with a known expected length (Supplementary Fig. S2c). Second, the primer efficiency E values ranged between 0.91 and 1.09 (Supplementary Table S1), all of the primers showed correlation coefficients of R 2 > 0.99. Third, a melting curve analysis showed a single peak for all of the primer pairs, which further confirmed their specificity (Supplementary Fig. S2b).
Expression levels of reference candidates
We analyzed all of the obtained Cq values for each reference candidate to evaluate their relative expression levels in the 14 hAD-MSCs samples. Figure 1a shows their expression level, ranging from the lowest Cq mean (14.6 for EEF1A1) to the highest Cq mean (26.1 for UBC) and the standard deviations (SDs) of the Cq values for the candidates, which ranged between 0.44 (RPS18) and 1.08 (ACTB). Thus, the mean Cq for every reference candidate was within the detection range of RT-qPCR, and the obtained SD values also indicated that ACTB might be more variable, whereas RPS18, PPIA, and RPLPO might be more stable than the other candidates. However, the SD values were also influenced by RNA concentration, the efficiency of reverse transcription, and other factors. Therefore, we evaluated the expression stability of the reference candidates using three approved algorithm software packages (geNorm, NormFinder, and BestKeeper).

An evaluation of the stability of reference genes.
Evaluation of stability using geNorm
GeNorm is a Microsoft Excel VBA applet that was developed by Vandesompele et al. It uses the transformed data represented by the Cq value to determine the average pairwise variation of a chosen candidate gene in comparison to all other reference candidates and then ranks them based on their average expression stability value (M) from most stable to least stable [21,24]. The lowest M value indicates the most stable gene expression, and a value of 1.5 is recommended as the cutoff when selecting RT-qPCR reference genes. In our analysis, when the results from all 14 hAD-MSC samples were combined, the 16 reference genes were ranked as follows: PPIA/RPLPO > ATP5F1 > RPS18 > YWHAZ > HPRT1 > RPL13A > EEF1A1 > GAPDH > UBC > B2M > PGK1 > TBP > TFRC > GUSB > ACTB (Fig. 1b). Therefore, PPIA and RPLPO showed the highest stability, GAPDH was the ninth best candidate, and ACTB, one of the most widely used references genes, appeared to be the most variable among all of the candidates.
In addition, geNorm also determines the optimum number of reference genes that should be used by calculating the pairwise variation (V n /V n+1) between the two sequential normalization factors NF n and NF n+1. As a general rule, the stepwise inclusion of reference genes is performed until V n /V n+1 drops below a theoretical threshold of 0.15, when adding an extra gene (n + 1) becomes unnecessary for accuracy normalization [24,25]. In our study, the pairwise variations for the total analyses were all below 0.15 (Fig. 1c). There is therefore no need to add a third gene for normalization.
Evaluation of stability using NormFinder
Another commonly used gene expression stability analysis software is NormFinder. In contrast to geNorm, NormFinder evaluates the expression stability of each single candidate independently from the stability of the other genes by taking into account variations across subgroups [25,26]. This approach calculates the inter- and intragroup variation of candidate reference genes and then combines all of the results into a stability value, M. Similarly, the lowest value suggests the highest stability [26]. The results of the NormFinder analysis are shown in Fig. 1d. Consistent with the geNorm conclusions, PPIA (0.008) still ranked at the top position and was followed by EEF1A1, ATP5F1, RPLPO, UBC, YWHAZ, GAPDH, RPS18, RPL13A, HPRT1, TFRC, B2M, TBP, PGK1, GUSB, and ACTB. Hence, GAPDH (0.011) ranked seventh, and ACTB (0.026) was still the least stable reference candidate.
Evaluation of stability using BestKeeper
BestKeeper, like geNorm, is a Microsoft Excel-based stability analysis tool. It uses the raw Ct values of the reference genes to calculate the pairwise correlations between each candidate and the geometric mean of the best-suited pair to determine the optimal normalizer among 10 candidates [27]. Gene expression variation is determined using SD, the percent covariance (CV), and the correlation coefficient (r) for candidate reference genes. The gene with the lowest CV ± SD and the highest r is defined as the most stable reference gene.
To select 10 best reference candidates for final BestKeeper analysis, we have evaluated the candidates in different combinations and compared the resulting data. In our study, six of the reference candidates (ACTB, YWHAZ, EEF1A1, HPRT1, PGK1, and TFRC) exhibiting higher SD and CV values were excluded from further analysis, and the summarized results of the final top 10 reference candidates are listed in Table 2. PPIA and RPLPO were the top ranked genes, with small CV ± SD values of 2.562 ± 0.442 and 2.742 ± 0.431, respectively, and the highest r values 0.958 and 0.961, respectively. They were therefore considered to be the most stable reference genes of the candidates. GAPDH was in the middle, while ACTB showed the highest CV ± SD 4.988 ± 0.841 (data not shown), indicating that ACTB was the least stable reference candidate.
N, number of samples; Geo Mean [CP], the geometric mean of Cq; Ar Mean [CP], the arithmetic mean of Cq; Min [CP] and Max [CP], the extreme values of Cq; std dev [± CP], standard deviation of Cq; CV [%CP], the coefficient variance expressed as percentage on Cq level; Min [x-fold] and Max [x-fold], the extreme values of expression levels represented as absolute x-fold over or under-regulation coefficient; std dev [±x-fold], standard deviation of the absolute regulation coefficients. Primary estimation of expression stability is obtained based on CV and standard deviation, then the correlation analysis was combinated to determine the best HKG. Cq, quantification cycle.
Comprehensive ranking of candidate reference genes
We compared the ranking results of the above three analyses (geNorm, NormFinder, and BestKeeper) to come to a conclusion regarding the best reference genes for normalization of RT-qPCR (Table 3). While some of the candidates were ranked in different positions because of differences in the methods used between the different algorithms, PPIA was consistently ranked at the top, GAPDH was consistently in the middle (around seven to ninth), and ACTB was always the last. We then calculated the geometric means of the ranking numbers that were produced by the three methods to determine the final ranking. Those with the smallest geometric mean were considered to be the most stable, while bigger represented less stability. As shown in Table 3, PPIA was ranked at the top, GAPDH was ranked in the middle (at seventh), and ACTB was definitively ranked last.
Relative variation in GAPDH and ACTB when normalized using PPIA
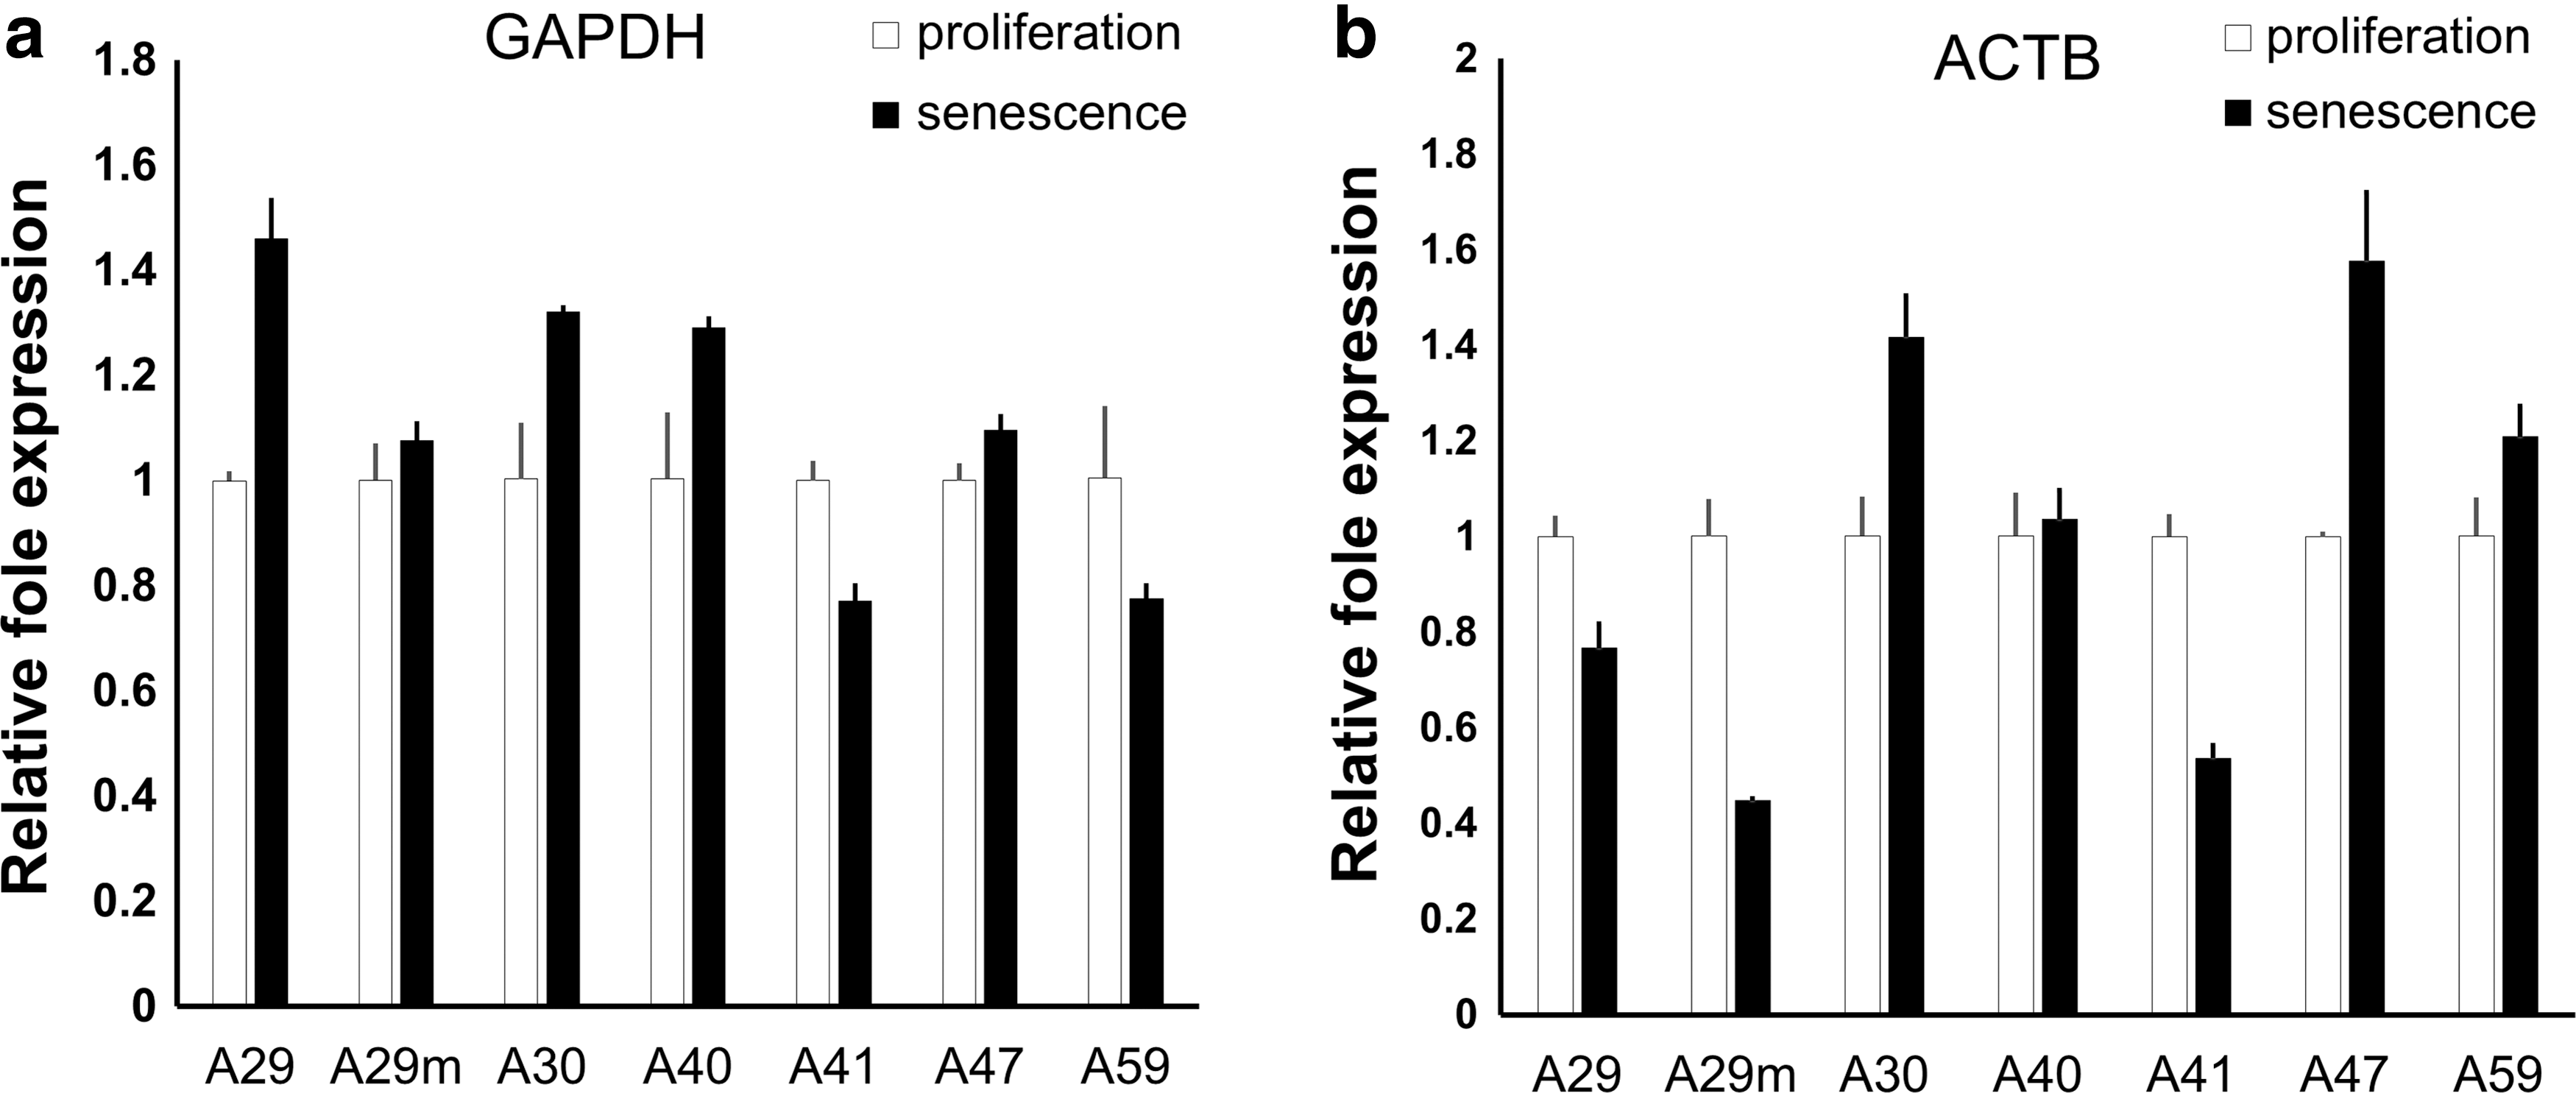
To confirm that PPIA is the most stable reference gene, as indicated by the results of the three algorithms, we attempted to evaluate the relative expression levels of two commonly used reference genes, GAPDH and ACTB, using PPIA to normalize their expression in a RT-qPCR analysis. We then calculated the expression levels of GAPDH and ACTB in all of the senescent hAD-MSCs relative to their values in the corresponding proliferating populations of cells. As a result, the relative expression levels of GAPDH were 1.46, 1.08, 1.32, 1.29, 0.77, 1.10, and 0.78 in A29S, A29mS, A30S, A40S, A41S, A47S, and A59S, respectively (Fig. 2a), and the corresponding expression levels of ACTB were 0.77, 0.45, 1.42, 1.04, 0.54, 1.58, and 1.21, respectively (Fig. 2b). Hence, both GAPDH and ACTB showed variation when normalized using PPIA, and the expression of ACTB was clearly more variable than GAPDH, a finding that was consistent with the analysis of the three algorithms.
Relative variation in GAPDH and ACTB expression. The levels of GAPDH
The protein expression levels of PPIA, GAPDH, and ACTB
So far, we have evaluated reference genes at the mRNA level using RT-qPCR. We sought to determine what happened at the protein level using three of these reference genes. Western blot analysis was used to assess the stability of the PPIA, GAPDH, and ACTB proteins in proliferating and senescent hAD-MSCs, as shown in Fig. 3a. Then, the gray scale analyses were performed to calculate the percentage of each protein's expression level in senescent hAD-MSCs relative to the expression level in the corresponding proliferating cells. Figure 3b shows that the relative level of PPIA expression in A29S, A30S, and A47S was 99.68%, 107.05%, and 112.47%, respectively. The same percentages for GAPDH were 112.82%, 133.71%, and 108.54%, respectively (Fig. 3c). Figure 3d shows that the results for ACTB were 81.64%, 158.81%, and 143.49%, respectively.
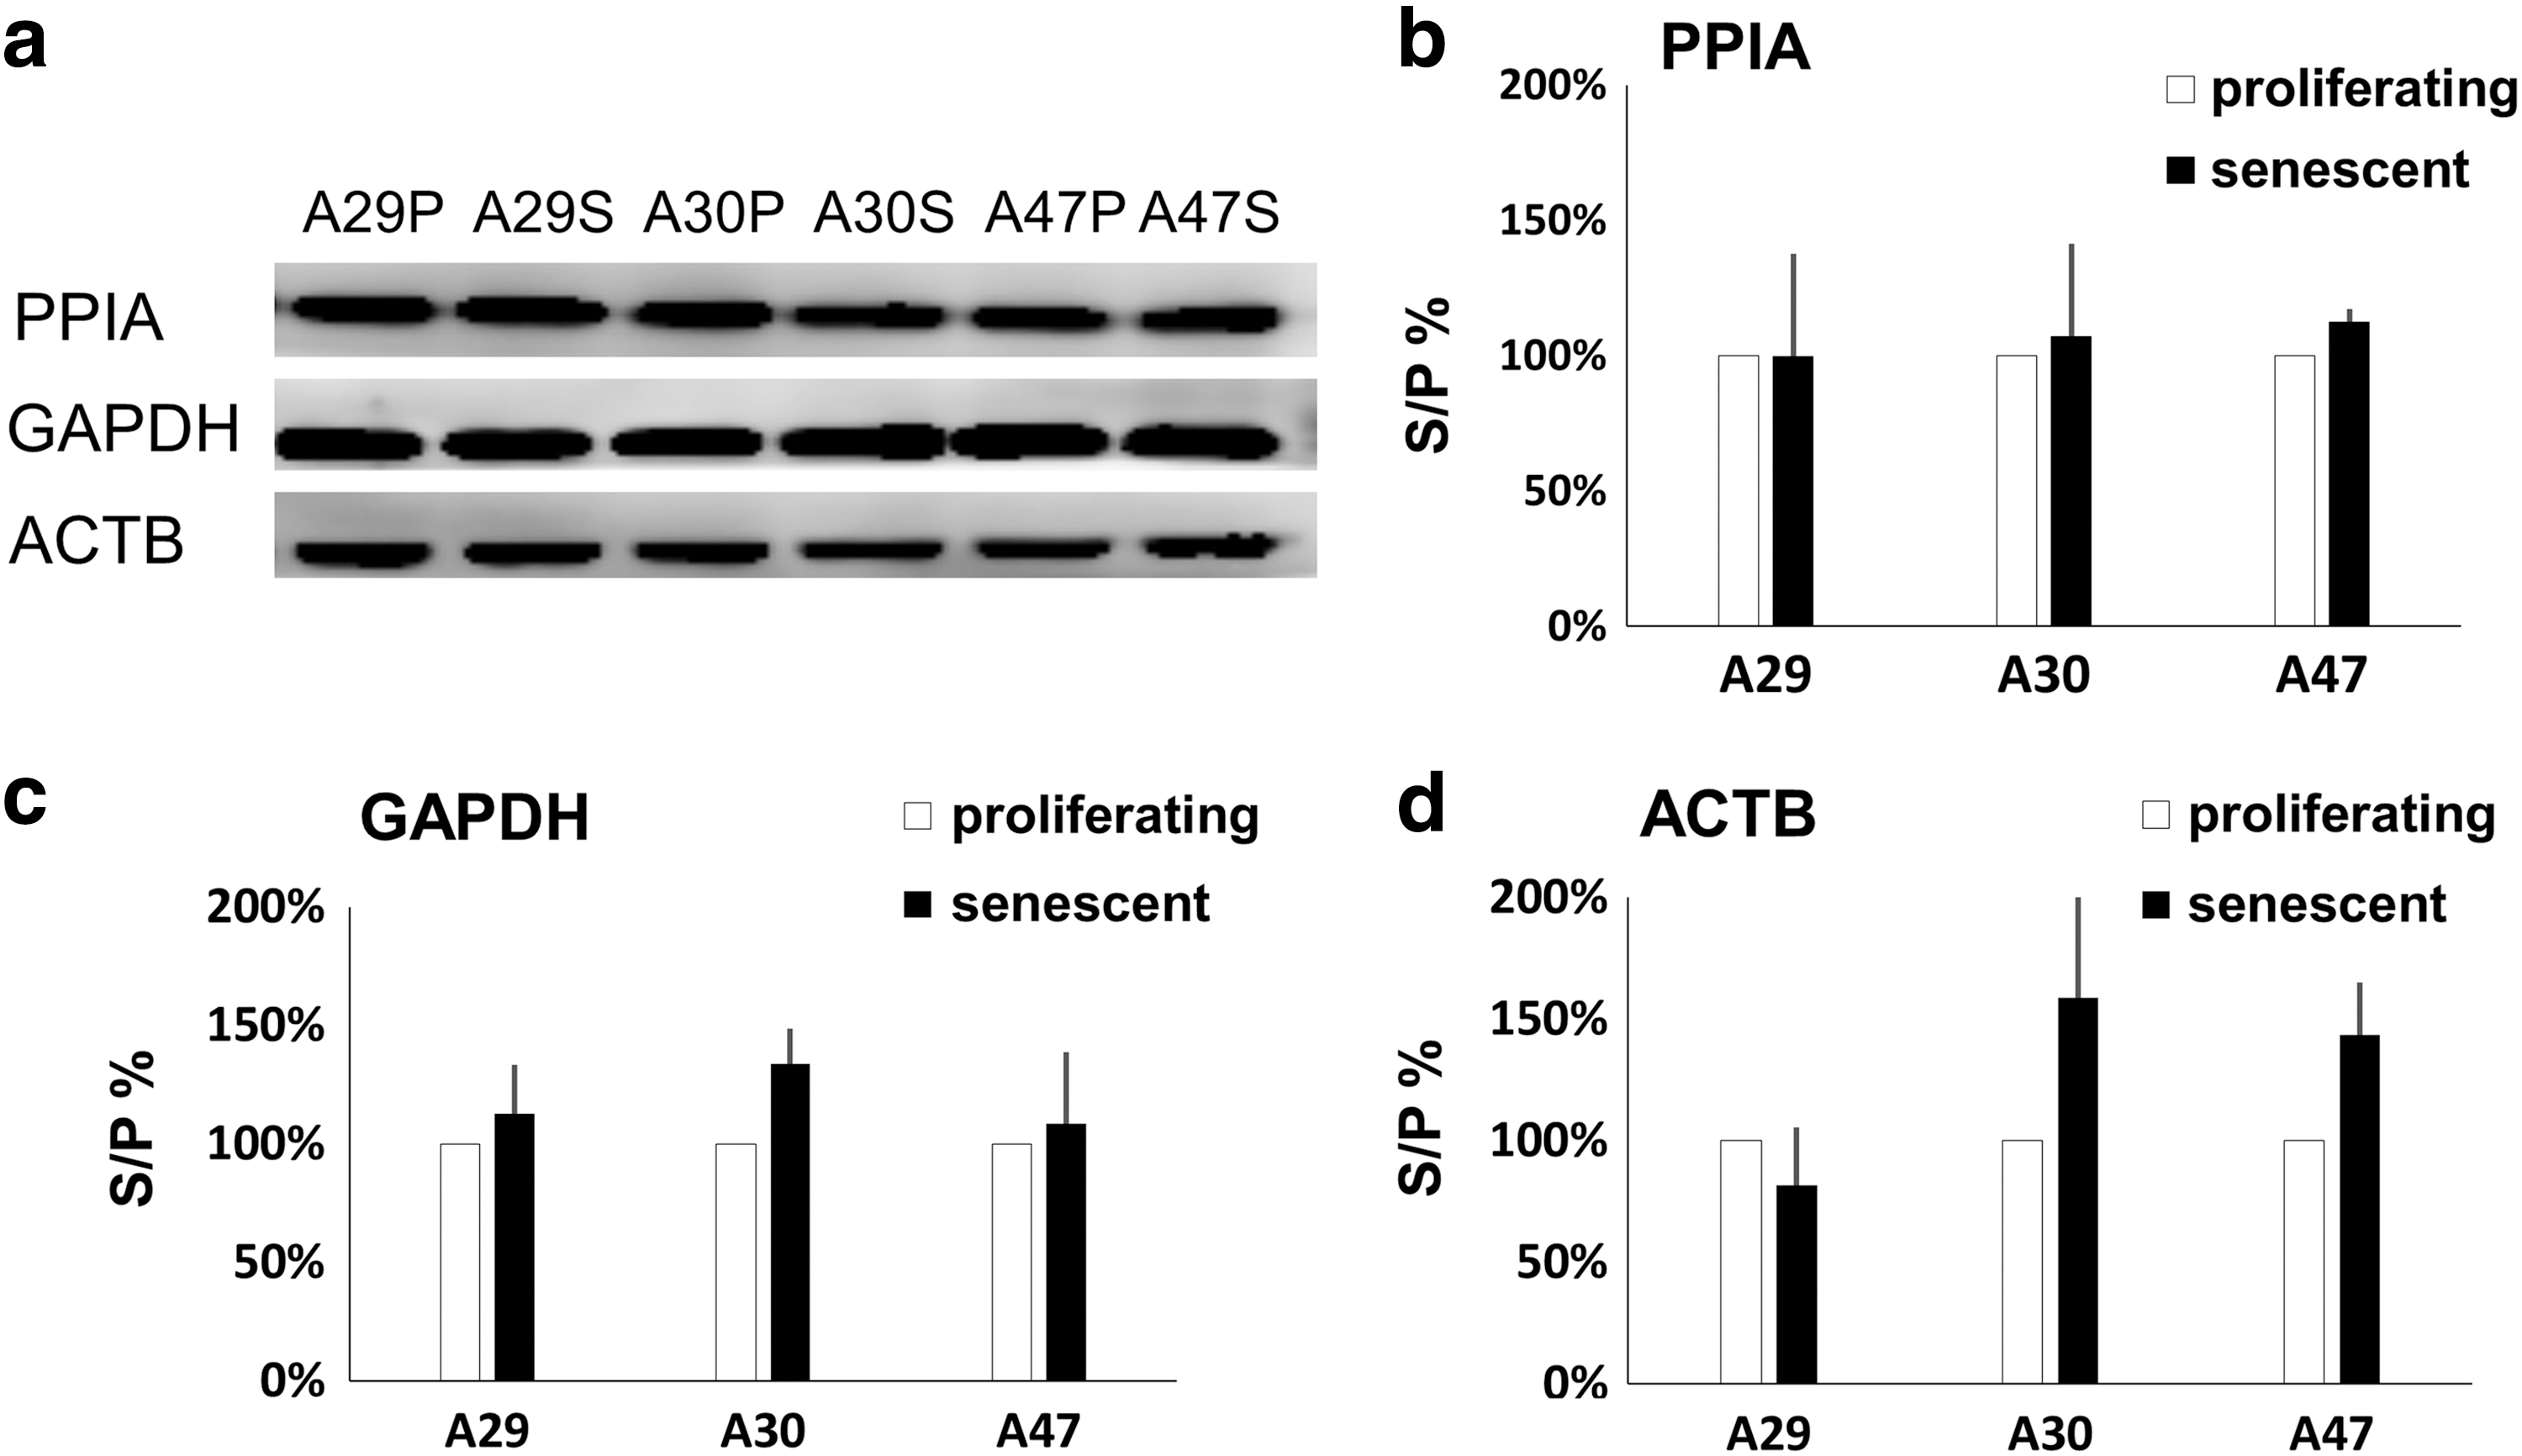
Western blot analysis of PPIA, GAPDH, and ACTB protein levels.
Furthermore, we also calculated the interindividual variability in the expression levels of the three proteins in the different proliferating samples (Supplementary Fig. S3). Thus, these results indicate that PPIA showed the highest stability in protein expression, while the performance of GAPDH was ordinary, and ACTB showed the lowest stability. These results are consistent with the results of the analysis performed using the three algorithms.
Effect of different choice of reference genes
After confirming the stability of the reference genes, we sought to determine whether an evaluation of senescence markers would produce different results if they were normalized to stable versus unstable reference genes in RT-qPCR.
Therefore, we selected five widely used senescence-associated markers: (1) P16INK4a , which is encoded by the INK4a/ARF locus that is correlated with the chronological age of nearly all tissues in both mice and humans [28 –30]; (2) P21CLP1 , which is, like P16, a CDK inhibitor and has also been extensively reported to increase with cellular senescence in aging organisms in both mice and humans [31,32]; (3) LMNB1, a protein component of nuclear lamina; this is a biomarker of senescence processes that declines in expression during cell senescence [33,34]; (4) poly-ADP-ribose polymerase 1 (PARP1), a factor that has been reported to be upregulated with age and can impair DNA repair signaling [35 –37]; (5) and ISG15, which has been shown to be significantly lowered in expression as telomere position changes: as telomeres become shorter during aging, chromosome looping and gene expression patterns change and related genes, such as ISG15, are correspondingly regulated [38].
We analyzed the expression levels of the five senescence markers in all of the 14 samples (proliferating and senescent MSCs) with RT-qPCR, and the results were normalized to PPIA, GAPDH, and ACTB, respectively. As shown in Fig. 4 and Supplementary Fig. S4, normalization to different reference genes resulted in different relative fold expression of the target genes. Using unsuitable reference genes led to the false evaluation of target genes, an effect that was particularly exemplified in A47 cells, as shown in Fig. 4.

Effect of choice of different reference genes. The mRNA levels of P16INK4a
When normalized to PPIA, GAPDH, or ACTB, the expression level of P16INK4a was higher in A47S (senescent stage) cells, by 9.04-, 8.26-, and 4.65-fold, respectively, than the expression levels observed in A47P (proliferating stage) cells (Fig. 4a). When normalized using PPIA or GAPDH, the expression of P21CLP1 was 1.63- or 1.49-fold higher in A47S cells, whereas its level was reduced to 0.83-fold when normalized using ACTB (Fig. 4b). In A47S cells, the expression of LMNB1 was reduced to 0.15-, 0.13-, or 0.08-fold, respectively (Fig. 4c); the expression of PARP1 was reduced to 0.56-, 0.52-, or 0.29-fold, respectively (Fig. 4d); and the expression of ISG15 was increased to 2.08-, 1.90-, or 1.07-fold, respectively (Fig. 4e).
Notably, as shown in Fig. 4b and e, the senescent state of the cells was not recognized (ISG15) or even refuted (P21CLP1 ) when gene expression was normalized using ACTB. Therefore, choosing a stable reference gene is very important when evaluating senescence using RT-qPCR analyses.
Discussion
The properties, potencies, and effects of senescent MSCs need to be explored to determine the potential of applications that involve this cell type in regeneration medicine and aging studies. Before initiating a study of senescence mechanisms, it is essential to screen for senescence-associated genes. RT-qPCR is considered the most efficient quantitative method for assessing RNA abundance. However, it requires assays that are carefully designed and that include strategies to optimize reactions to maximize their sensitivity and accuracy [39,40]. In earlier studies, the normal strategy for RT-qPCR normalization was to use a single housekeeping gene, usually GAPDH or ACTB, without further validation.
However, many reports have suggested that the expression of these genes can vary up to 10-fold across different samples [41,42]. In 2002, Vandesompele et al. suggested that experiments to determine the ideal reference genes should be carefully performed for each individual system by evaluating several genes [24].
In this study, we aimed to identify the optimal references genes to use in studies of senescence in hAD-MSCs. Cells were isolated from seven human donors with different age and both genders. To our knowledge, this is the first study to systematically determine the optimal references genes for a MSC-related senescence study. To obtain comparable results, we designed a rigorous set of parallel experiments that used the same conditions. We obtained data that displayed a high level of consistency and then analyzed the data using three independent expression stability analyses (geNorm, NormFinder, and BestKeeper). Despite the differences between these distinct statistical algorithms, PPIA was consistently ranked as the most stable reference gene, while ACTB, one of the most widely used reference genes in aging studies, was ranked last. GAPDH, another traditional reference gene, ranked in the middle.
Meanwhile, these results are consistent with results that were reported in 2013 and showed that “ACTB was the most unstable gene when evaluating adipose tissue-derived mesenchymal stromal cells” [43] and also the results reported in 2015 showing that “beta-2-microglobulin and peptidyl-prolyl isomerase A were the optimal reference genes for normalizing RT-qPCR data obtained from four different human MSCs” [44].
We considered the fact that ACTB encodes a cytoskeletal protein that is essential for cytoskeletal structure and kinetics. It should therefore not be surprising that its expression might be influenced by cellular senescence because senescence is a process that is characterized by morphological changes that result from changes in cellular structure and motility. A correlation between the actin cytoskeleton and senescence in human cells has been noted in some reports [45 –47], but it has not yet been adequately studied. GAPDH is a glyceraldehyde-3-phosphate that is involved in dehydrogenase activity and energy metabolism that has been reported to be associated with senescence in cancer cells [48 –50]. Finally, PPIA encodes a member of the peptidyl-prolyl cis-trans isomerase (PPIase) family and is involved in protein folding, but its role in senescence has not yet been explored.
To further validate the effect of reference genes, we assessed the expression of five senescence-associated genes (P16INK4a , P21CLP1 , LMNB1, PARP1, and ISG15) in both proliferating and senescent hAD-MSCs with normalization to PPIA, GAPDH, and ACTB, respectively. The results of assays in which expression was normalized to ACTB were inconsistent and showed statistically significant variation.
These results indicate that choosing an unsuitable reference gene can yield misleading results, and this is especially true when the expression levels of target genes, such as P21CLP1 , PARP1, and ISG15 in our study, are not markedly altered under different conditions. In addition, as has been shown, in stem cells, slight changes in crucial protein factors can have effects that are strong enough to alter a cell's stage. Therefore, using a stable reference gene is of substantial importance for obtaining reliable experimental results in studies of stem cell aging.
In conclusion, our findings suggest that in senescence studies using hAD-MSCs replicative-senescence cell model, PPIA is the optimal reference gene to use for normalization in RT-qPCR assays. Our findings contribute to basic research in this field in addition to translational research into clinical cell therapies for aging-related diseases.
Footnotes
Acknowledgments
This study was supported by grants from the National Key Scientific Program of China (no. 2011CB964901), the National Collaborative Innovation Program, and the National Science and Technology Major Projects for “Drug Research and Development” (no. 2014ZX09101042). The authors also thank Stephen Dalton (University of Georgia) for reading and recommending this article.
Author Disclosure Statement
No competing financial interests exist.
References
Supplementary Material
Please find the following supplemental material available below.
For Open Access articles published under a Creative Commons License, all supplemental material carries the same license as the article it is associated with.
For non-Open Access articles published, all supplemental material carries a non-exclusive license, and permission requests for re-use of supplemental material or any part of supplemental material shall be sent directly to the copyright owner as specified in the copyright notice associated with the article.