
Abstract
The differentiation capacity, hematopoietic support, and immunomodulatory properties of human bone marrow mesenchymal stromal cells (BM-MSCs) make them attractive therapeutic agents for a wide range of diseases. Clinical scale cultures (CSCs) have been used to expand BM-MSCs for their use in cell therapy protocols; however, little is known about the functionality of the expanded cells. The main goal of the present study was to evaluate the functional characteristics of BM-MSCs expanded from CSCs to determine the quality of the cells for cellular therapy protocols. To address this issue, we analyzed the morphology, immunophenotype, differentiation potential (adipogenic, osteogenic and chondrogenic), hematopoietic support, and immunosuppressive capacity of BM-MSCs from short scale cultures (SSCs) and CSCs in a comparative manner. After 12 days of culture in CSCs (HYPERFlask System), BM-MSCs reached cell numbers of 125.52 × 10⁶ ± 25.6 × 10⁶ MSCs, which corresponded to the number of cells required for transplantation (∼1.7 × 10⁶ MSCs/kg for a 70-kg patient). After expansion, BM-MSCs expressed the characteristic markers CD73, CD90, and CD105; however, expansion decreased their differentiation capacity toward the adipogenic, osteogenic, and chondrogenic lineages and their ability to inhibit T-cell proliferation compared with SSCs-MSCs. Importantly, CSCs-MSCs maintained the ability to support the proliferation and expansion of hematopoietic progenitor cells and the capacity to express the molecules, cytokines, and extracellular matrix proteins involved in the regulation of hematopoiesis. Our study highlights the need to evaluate the functional properties of the expanded BM-MSCs for verification of their quality for cell therapy protocols.
Introduction
M
The number of MSCs obtained from BM is limited. Therefore, the cells must be expanded in clinical scale cultures (CSCs) to obtain a sufficient number for use in HSCT (cell doses up to 5 million MSC/kg body weight) [2]. Although encouraging results have been obtained using MSCs in HSCT, their application is not effective in GVHD in all cases [1,5]. The differences in these results that related to the clinical application of MSCs reported by several groups may be due to the applied MSC expansion conditions in the CSCs and even the number of passages and the utilized doses.
Currently, several groups are attempting to optimize CSC conditions to improve MSC expansion and quality, and good results have been reported [6 –8]. Other studies have provided evidence demonstrating changes in the immunophenotype of expanded MSCs, as well as the loss of their multipotency and proliferation capacity [9–10]. Therefore, culture conditions (eg, culture media, supplements, or growth surface used) and clinical expansion itself can affect the functional properties of MSCs and should be considered to determine the most suitable in vitro MSC expansion system that does not change the properties required for cell therapy protocols.
In general, most experiments have only studied the maintenance of the stem cell phenotype and the differentiation potential of MSCs following CSCs and have not investigated the functional properties of MSCs before [short scale cultures (SSCs)] and after CSCs. Therefore, examining the differentiation, hematopoietic support, and immunosuppressive abilities of MSCs before and after subjecting them to CSCs is essential. To date, little is known regarding this aspect; thus, it is important to establish whether these characteristics are altered in CSCs-MSCs before they can be applied clinically.
Materials and Methods
Isolation of BM-MSCs and SSCs
BM samples were obtained from hematologically healthy donors according to the Declaration of Helsinki and the Local Ethics Committee of Villacoapa Hospital, Mexican Institute for Social Security (IMSS). After written informed consent, human BM aspirates were obtained from five donors as we previously reported [11]. Briefly, mononuclear cells (MNCs) were obtained from BM samples by density gradient centrifugation (Ficoll-Paque PLUS; Sigma-Aldrich, St. Louis, MO) and were seeded at a density of 0.2 × 10⁶ MNCs/cm2. The cells were resuspended in low-glucose Dulbecco's modified Eagle's medium (Lg-DMEM; Gibco, Thermo Fisher Scientific, Waltham, MA) supplemented with 10% fetal bovine serum (FBS; Gibco), 10 μL /mL of
Clinical scale cultures of MSCs
CSCs of MSCs were performed as follows. MSCs from SSCs were seeded at a density of 2 × 10³ cells/cm2 into 1,720 cm2 HYPERFlask cell culture vessels (Corning, Inc.) in Lg-DMEM (Gibco) supplemented with 10% FBS (Gibco), 10 μL/mL of
Morphological characterization of MSCs
To observe structural differences between MSCs obtained from SSCs and CSCs, the cells were grown in a Petri dish (Corning, Inc.) at a density of 4 × 10³ cells/cm2. After 6 days of culture, the cells were stained with toluidine blue (Sigma-Aldrich) and examined under a phase contrast microscope.
Immunophenotyping of MSCs
Immunophenotypic analysis of MSCs was performed by flow cytometry as we previously reported [11]. Monoclonal antibodies against CD14, CD31, CD34, CD45, CD105, HLA-DR (Caltag Laboratories, Thermo Fisher Scientific), CD13, CD73, CD90, and HLA-ABC (Becton Dickinson, Franklin Lakes, NJ) conjugated with FITC (fluorescein isothiocyanate), PE (phycoerythrin), or APC (allophycocyanin) were used. Previously blocked with Fc receptor blocker (Human Blocking Reagent; Miltenyi Biotec, Bergisch Gladbach, Germany), 1–2 × 10⁵ cells were resuspended in 100 μL of phosphate-buffered saline (PBS; Gibco) supplemented with 3% FBS and 1 mM EDTA and incubated with the appropriate antibodies for 20 min. The cells were subsequently washed with 1 mL of PBS (supplemented with 3% FBS and 1 mM EDTA) and fixed with FACS Lysing Solution (Becton Dickinson). The cells were acquired using a FACSCanto II (Becton Dickinson). At least 10,000 events were collected per sample, and the data were analyzed with the FlowJo 7.6.1 software (FlowJo LLC, Ashland, OR).
Adipogenic, osteogenic, and chondrogenic differentiation of MSCs
The osteogenic and adipogenic differentiation capacities were induced with Stem Cell Kits™ (STEMCELL Technologies, Inc., Vancouver, Canada) on days 21 and 14, respectively. The chondrogenic capacity was induced using Chondrogenic Differentiation Medium (Cambrex; Cambrex Bio Science Walkersville, Inc., Walkersville, MD) supplemented with 10 ng/mL transforming growth factor beta (TGF-β; Cambrex) for 28 days as previously reported [12]. The differentiation capacity was determined by cytochemistry, immunostaining, and the detection of transcripts associated with each lineage by real-time polymerase chain reaction (PCR).
Adipogenic differentiation was determined by cytochemistry and observing lipid vacuoles stained with Oil Red O (Sigma-Aldrich) and detecting the peroxisome proliferator-activated receptor (PPAR)-γ and lipoprotein lipase (LPL) transcripts. Osteogenic differentiation was determined by detecting alkaline phosphatase (ALP) activity (SIGMAFAST BCIP/NBT; Sigma-Aldrich), performing immunocytochemistry for osteopontin (OPN; Abcam, Inc., Cambridge, MA) and pro-collagen I (pro-Col-I; Santa Cruz Biotechnology, Inc., Dallas, TX) and detecting the ALP, OPN, and collagen I (Col-I) transcripts. Chondrogenic differentiation was evaluated by the formation of micromasses. Histological sections were prepared for immunohistochemistry detection of collagen II (Col-II; Abcam, Inc.). The Aggrecan (ACAN) and SRY-box 9 (SOX9) transcripts were also detected. All transcripts were evaluated by real-time PCR (see the Real-Time PCR section for details).
Coculture of MSCs/umbilical cord blood-hematopoietic progenitor cells
Umbilical cord blood (UCB) samples were collected according to the Institutional Declaration of Helsinki and the Local Ethics Committee of Troncoso Hospital, IMSS. After written informed consent, UCB samples were obtained from five normal full-term deliveries. CD34+CD38−Lin− HPCs were enriched from MNCs by negative selection using StemSep™ kit (STEMCELL Technologies) according to the kit's instructions as we previously reported [13,14]. MSC layers at 80% confluence were incubated with 0.3 μg/mL of mitomycin C (Mitolem, Lemery, DF., Mexico) to inhibit cell growth. Ten thousand enriched CD34+CD38−Lin− cells were seeded onto MSC layers in six-well plates (Corning, Inc.) in Stemline medium (Sigma-Aldrich) with or without the early-acting cytokines thrombopoietin (TPO), Flt-3 ligand (FL), stem cell factor (SCF), and interleukin-6 (IL-6) all at a concentration of 10 ng/mL (all from PeproTech, Rocky Hill, NJ). Cultures were collected on day 14, and the medium was changed on day 7.
Proliferation of hematopoietic cells
The total numbers of nucleated and viable cells from the cultures were determined with a hemocytometer using Turk's solution and trypan blue stain (Gibco), respectively [13,14].
Colony-forming cell assays
To determine HPC expansion, the presence of colony-forming cells (CFCs) was analyzed using the methylcellulose assay (MethoCult™; STEMCELL Technologies) as we previously reported [13,15]. After 14 days of culture, CFCs were counted with the aid of an inverted microscope. CFCs were classified as follows: erythroid colonies, including colony-forming cell erythroids (CFC-Es) and burst-forming cell erythroids (BFC-Es), and myeloid colonies, including CFC-Gs, colony-forming cell myeloids (CFC-Ms), and CFC-GMs.
Long-term culture-initiating cell assays
Primitive HPCs were detected using the long-term culture-initiating cell (LTC-IC) assay [pre-colony-forming cells (pre-CFCs)] based on the method described by Eaves and colleagues [16,17] as we previously reported [14]. Briefly, after coculture with MSCs for 14 days, hematopoietic cells were cultured with the M210B4 stromal line as a feeder layer for 35 days. Subsequently, MNCs were harvested and seeded in cultures with methylcellulose for CFC quantification. The eight CFC/1 LTC-IC [14,16,17] proportion was used.
Quantification of CD34+CD38−Lin− cells
To determine primitive HPC expansion, the frequency and fold increase of CD34+CD38−Lin− cells were analyzed by flow cytometry. 2–3 × 10⁵ MNCs were incubated with antibodies against CD34, CD38, CD14, CD16, CD19, CD41a, and CD71 conjugated with FITC, PE, or APC (Becton Dickinson). The cells were acquired on a FACSCanto II (Becton Dickinson). At least 10,000 events were collected per sample, and the data were analyzed with the FlowJo 7.6.1 software (FlowJo LLC).
Assessment of molecules involved in MSC-hematopoietic cell interaction
To detect the expression of molecules involved in MSC-hematopoietic cell interaction, MSCs were analyzed by flow cytometry. Monoclonal antibodies against CD146, CD54 (Becton Dickinson), Jagged-1, N-cadherin, and intracellular stromal cell-derived factor 1 (SDF-1; R&D Systems, Inc., Minneapolis, MN) conjugated with carboxyfluorescein (CFS), FITC, PE, or APC were used. Cytofix/Cytoperm buffer (Becton Dickinson Pharmingen) was used according to the supplier's instructions to permit the detection of intracellular SDF-1. Cells were acquired in a FACSCanto II (Becton Dickinson). At least 10,000 events were collected per sample, and the data were analyzed with the FlowJo 7.6.1 software (FlowJo LLC).
Assessment of cytokines in MSC conditioned culture media
To quantify the secreted cytokine concentrations, supernatants were obtained from MSC cultures. MSCs were seeded in a six-well plate (Corning, Inc.) and grown to 80% confluency; thereafter, the culture media were exchanged for Stemline medium (Sigma-Aldrich). After 4 days, the conditioned medium was carefully harvested and centrifuged for 10 min at 2,500 rpm to remove debris. Cytokine analyses were performed with a cytometric flex bead array (CBA; Becton Dickinson Biosciences) for IL-6 and granulocyte macrophage colony-stimulating factor (GM-CSF) and enzyme-linked immunosorbent assay (ELISA Kit; R&D Systems, Inc.) for TPO and SCF according to the suppliers' instructions.
Assessment of extracellular matrix molecules expressed by MSCs
To quantify the expression of extracellular matrix molecules in MSCs, we detected fibronectin (FN), laminin (LAMA), and Col-I transcripts by real-time PCR (see Real-Time PCR section for details).
Real-time PCR
Total RNA was extracted from MSCs with the TRIzol reagent (Invitrogen, Thermo Fisher Scientific). Complementary DNA (cDNA) was prepared using the High Capacity cDNA Reverse Transcription Kit (Applied Biosystems, Abingdon, United Kingdom). The cDNA samples were analyzed by relative quantification using the LightCycler® 480 Probes Master Kit (Roche Applied Science, Indianapolis, IN) and universal probes (Roche Applied Science) following the manufacturer's protocol in a LightCycler 480 System (Roche Applied Science). The primers obtained from IDT are listed in Supplementary Table S1 (Supplementary Data are available online at
Coculture MSCs/peripheral blood MNCs
MNCs were obtained from peripheral blood (PB) samples by density gradient centrifugation (Ficoll-Paque PLUS; Sigma-Aldrich). Cocultures of MSCs/MNCs were performed in a 1:2 ratio (1 × 10⁵ MSCs:2 × 10⁵ MNCs) in 24-well plates (Corning, Inc.). MNCs were activated with 5 μg/mL of phytohemagglutinin (PHA) (Sigma-Aldrich) in 50% RPMI (Gibco) and 50% Lg-DMEM (Gibco) media supplemented with 10% FBS (Gibco), 10 μL/mL of
Proliferation of CD3+, CD4+, and CD8+ cells
MNCs were stained with 5 μM carboxyfluorescein succinimidyl ester (CFSE) before activation and coculture with MSCs. The proliferation of CD3+, CD4+, and CD8+ cells was analyzed by flow cytometry. PE-conjugated monoclonal antibodies against CD3, CD4, and CD8 (Becton Dickinson) were used. The cells were acquired using a FACSCanto II (Becton Dickinson). At least 10,000 events were collected per sample, and the data were analyzed with the FlowJo 7.6.1 software. MNCs activated in the absence of MSCs were used as positive controls and set at 100% proliferation. The levels of proliferation observed in the cocultures were normalized to this control [11].
Statistical analysis
The mean ± standard deviation or standard errors of the mean of the experiments conducted are reported. The Student's t-test or one-way analysis of variance and Kruskal–Wallis test were employed using the IBM SPSS Statistics 22 software. Statistical significance was considered when the P value was <0.05.
Results
SSC-MSC and CSC-MSC characteristics
To obtain MSCs from CSCs, BM-MSCs were seeded at a density of 2 × 10³ cells/cm2 in eight HYPERFlask cell culture vessels with Lg-DMEM supplemented with 10% FBS. After 12 days, we obtained an average of 15.69 × 10⁶ ± 3.2 × 10⁶ MSCs from each HYPERFlask. Thus, we obtained a total of 125.52 × 10⁶ ± 25.6 × 10⁶ CSC-MSCs, which corresponded to the number of cells required for the transplantation of ∼1.7 × 10⁶ MSCs/kg for a 70 kg patient. The MSC yield in HYPERFlask was 9,990 ± 900 cells/cm2 after 12 days in culture, which was lower than that obtained from normal cell culture flasks, because in a shorter time (6 days in culture) it was 9,122 ± 1,860 cells/cm2. To determine structural differences between MSCs obtained from the SSCs and CSCs, the cells were grown in a Petri dish, stained with toluidine blue and examined under a phase contrast microscope. Figure 1A, a shows the typical fibroblastoid morphology of SSC-MSCs [12], whereas in the CSC-MSCs (Fig. 1A, b) we observed not only fibroblast cells but also a higher content of “large cells” with abundant cytoplasm. Similar to the MSCs from SSCs as previously reported [12], MSCs from CSCs expressed markers characteristic of MSCs, such as CD73, CD90, CD105, CD13, and HLA-ABC. The expression of hematopoietic markers (CD14, CD34, and CD45) was not observed; CD31 and HLA-DR were also not present (Supplementary Table S2).

Morphology and adipogenic differentiation capacity are modified in MSCs from CSCs.
Differentiation capacity of SSC-MSCs and CSC-MSCs
After 14 days of induction, adipogenic differentiation was detected based on the presence of positive lipid vacuoles after Oil Red O staining and PPAR-γ and LPL expression by real-time PCR. CSC-MSCs presented the formation of lipid vacuoles positive for Oil Red O staining; however, the formation of adipocytes was lower compared with SSC-MSCs (Fig. 1B, a, b). No PPAR-γ messenger RNA (mRNA) expression was detected in the CSC-MSCs, whereas an expression level of 0.22 ± 0.26 was observed in the SSC-MSCs (Fig. 1C). In addition, the LPL mRNA expression was significantly lower (P < 0.05) in the CSC-MSCs compared with the SSC-MSCs (25.9 ± 12.8 and 224.1 ± 97.6, respectively; Fig. 1C).
After 21 days of induction, the osteogenic differentiation capacity was determined by detecting ALP activity and performing immunocytochemistry to assess the presence of OPN and pro-Col-I; in addition, the ALP, OPN, and Col-I expression levels were measured by real-time PCR. Both SSC-MSCs and CSC-MSCs presented ALP activity and OPN and pro-Col-I positivity by immunocytochemistry (Fig. 2A, a–f). ALP and OPN mRNA expression showed a tendency to decrease in the CSC-MSCs compared to the SSC-MSCs (0.53 ± 0.15 and 1.0 ± 0.49 for ALP and 0.32 ± 0.23 and 0.85 ± 0.59 for OPN, respectively, Fig. 2B). Conversely, the Col-I mRNA expression showed a tendency to increase in the CSC-MSCs compared with the SSC-MSCs (0.86 ± 0.36 and 0.36 ± 0.10, respectively; Fig. 2B).
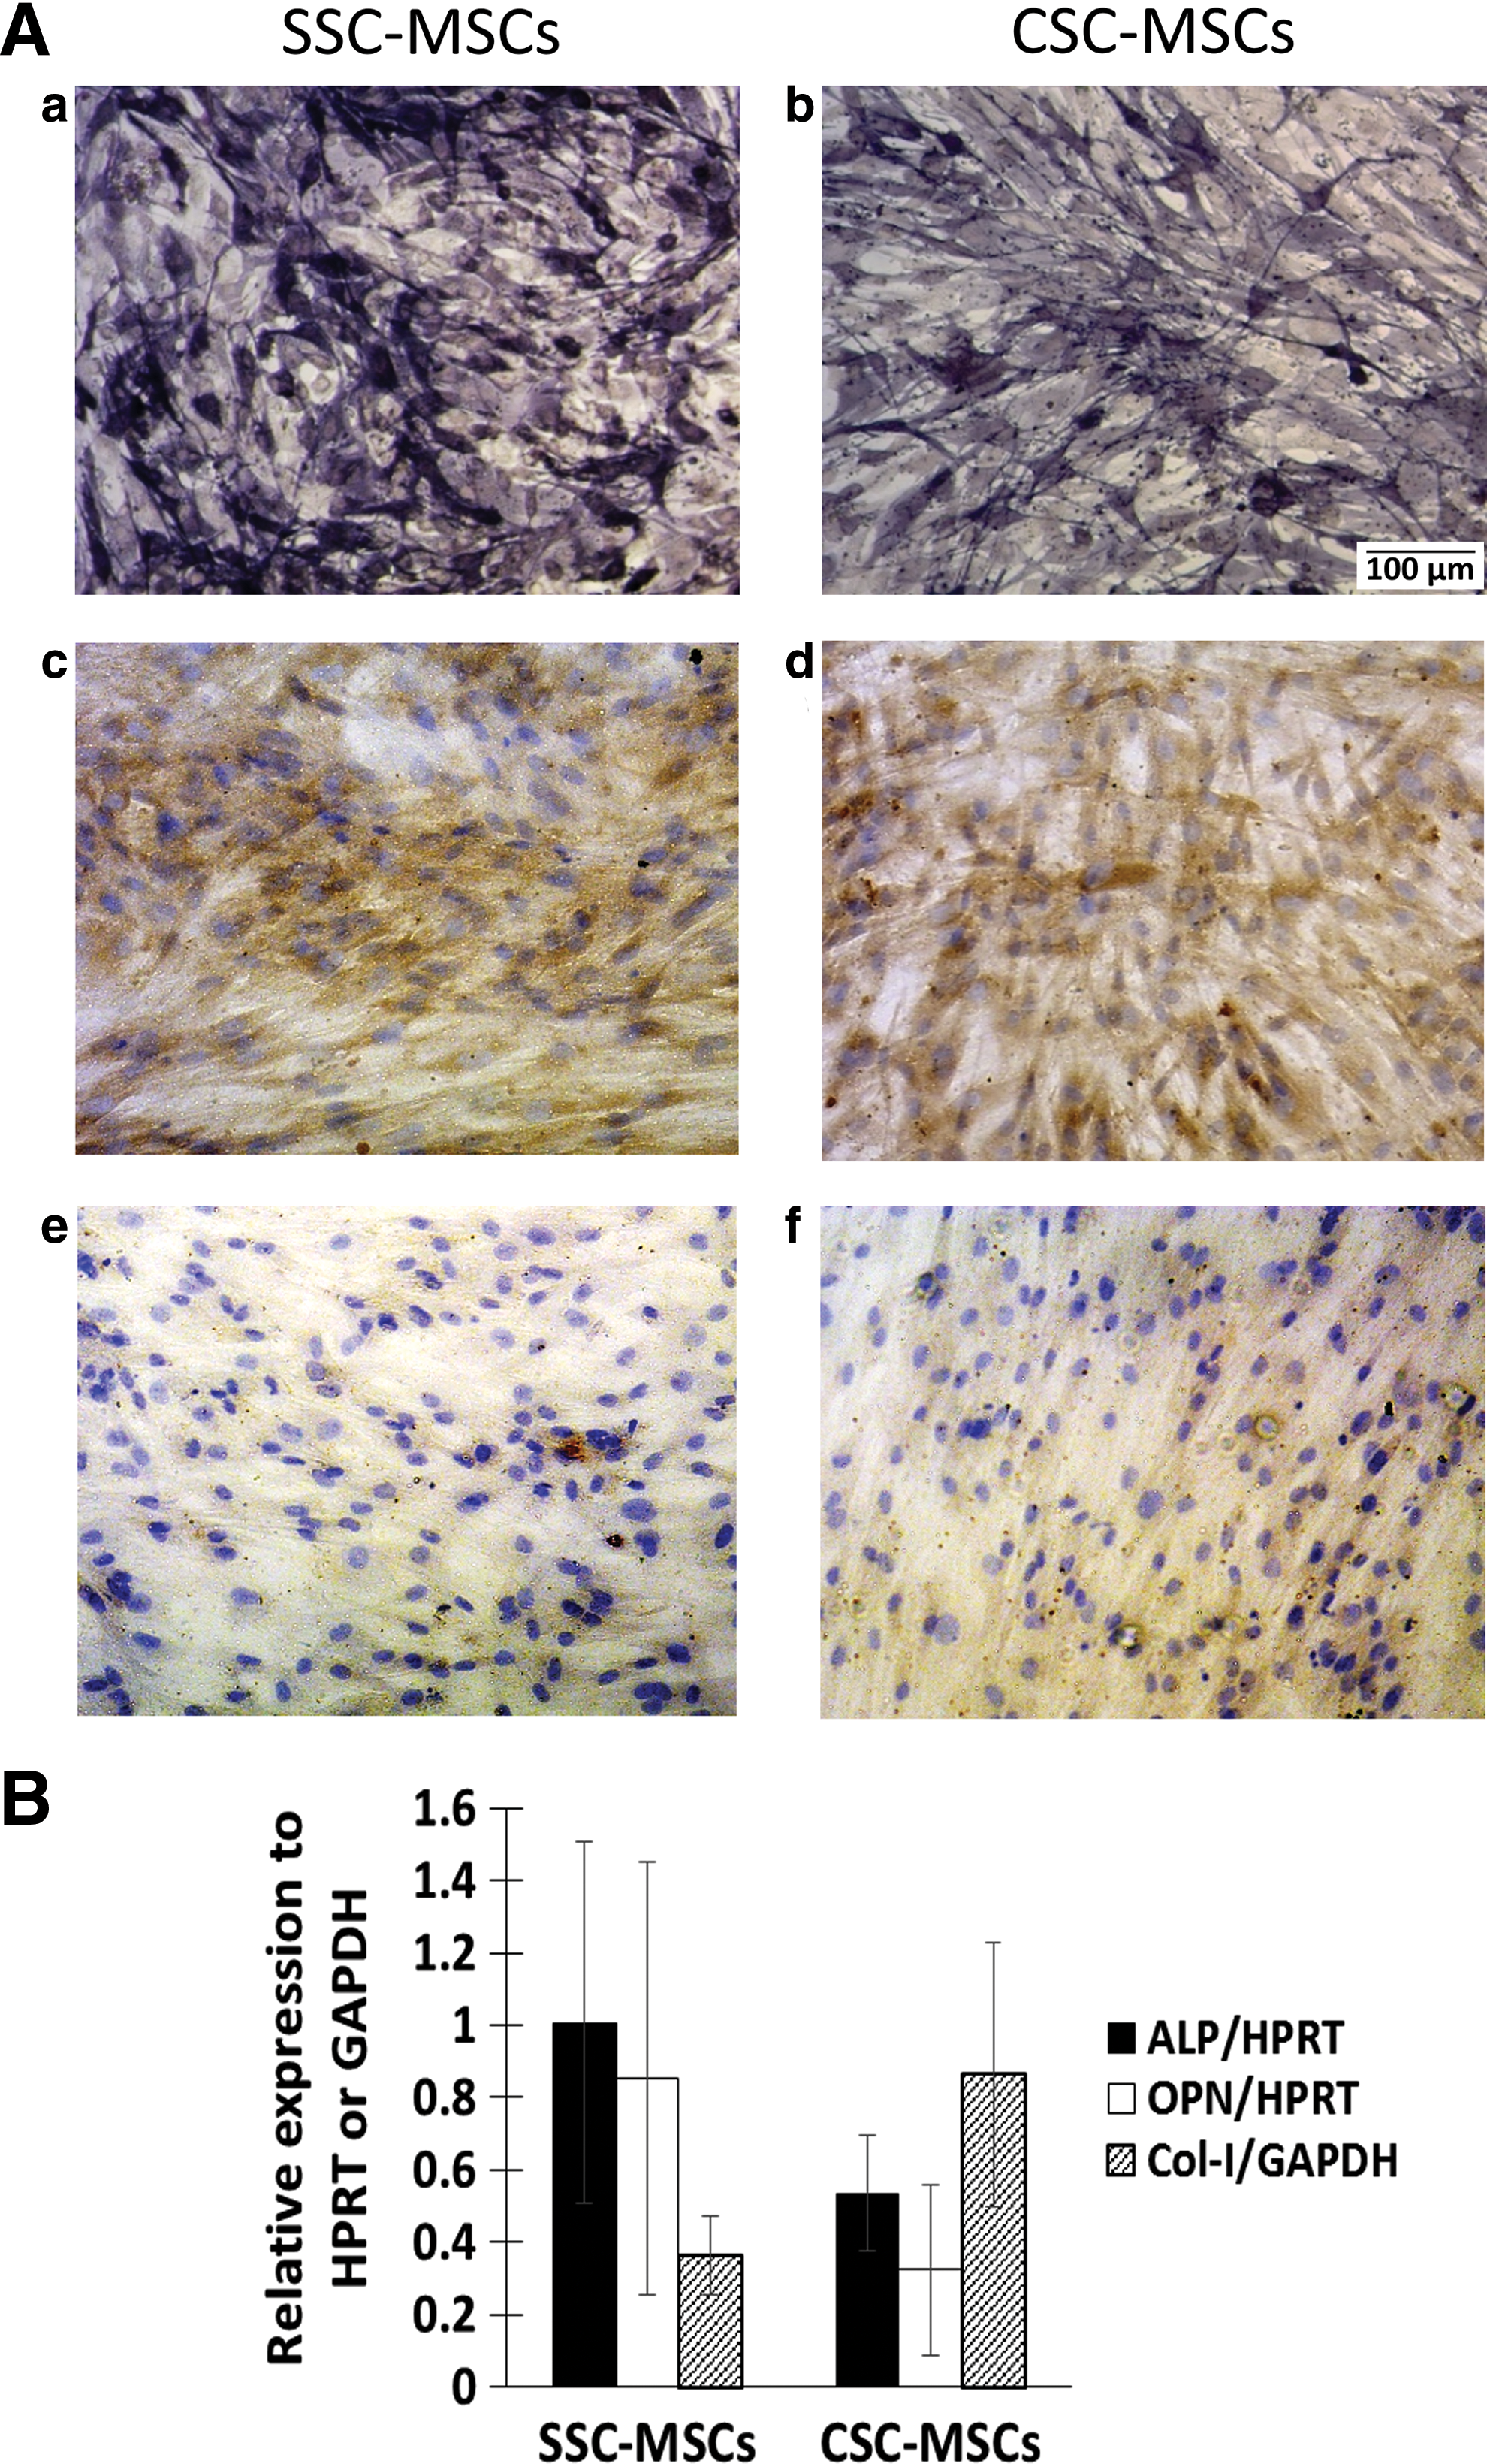
Osteogenic differentiation capacity in MSCs from CSCs.
After 28 days of induction, histological sections were prepared to analyze the chondrogenic differentiation capacity. Col-II positivity by immunohistochemistry was determined in the micromasses, and SOX9 and ACAN expression was measured by real-time PCR. Both SSC-MSCs and CSC-MSCs were able to form micromasses, but Col-II positivity by immunohistochemistry was decreased in the micromasses from CSC-MSCs in contrast to SSC-MSCs (Fig. 3A, a, b). SOX9 and ACAN mRNA expression was decreased in the CSC-MSCs compared with the SSC-MSCs (1.94 ± 0.69 and 4.66 ± 1.88, respectively, for SOX9 and 0.12 ± 0.11 and 0.92 ± 0.19, respectively, for ACAN, P < 0.05) (Fig. 3B).
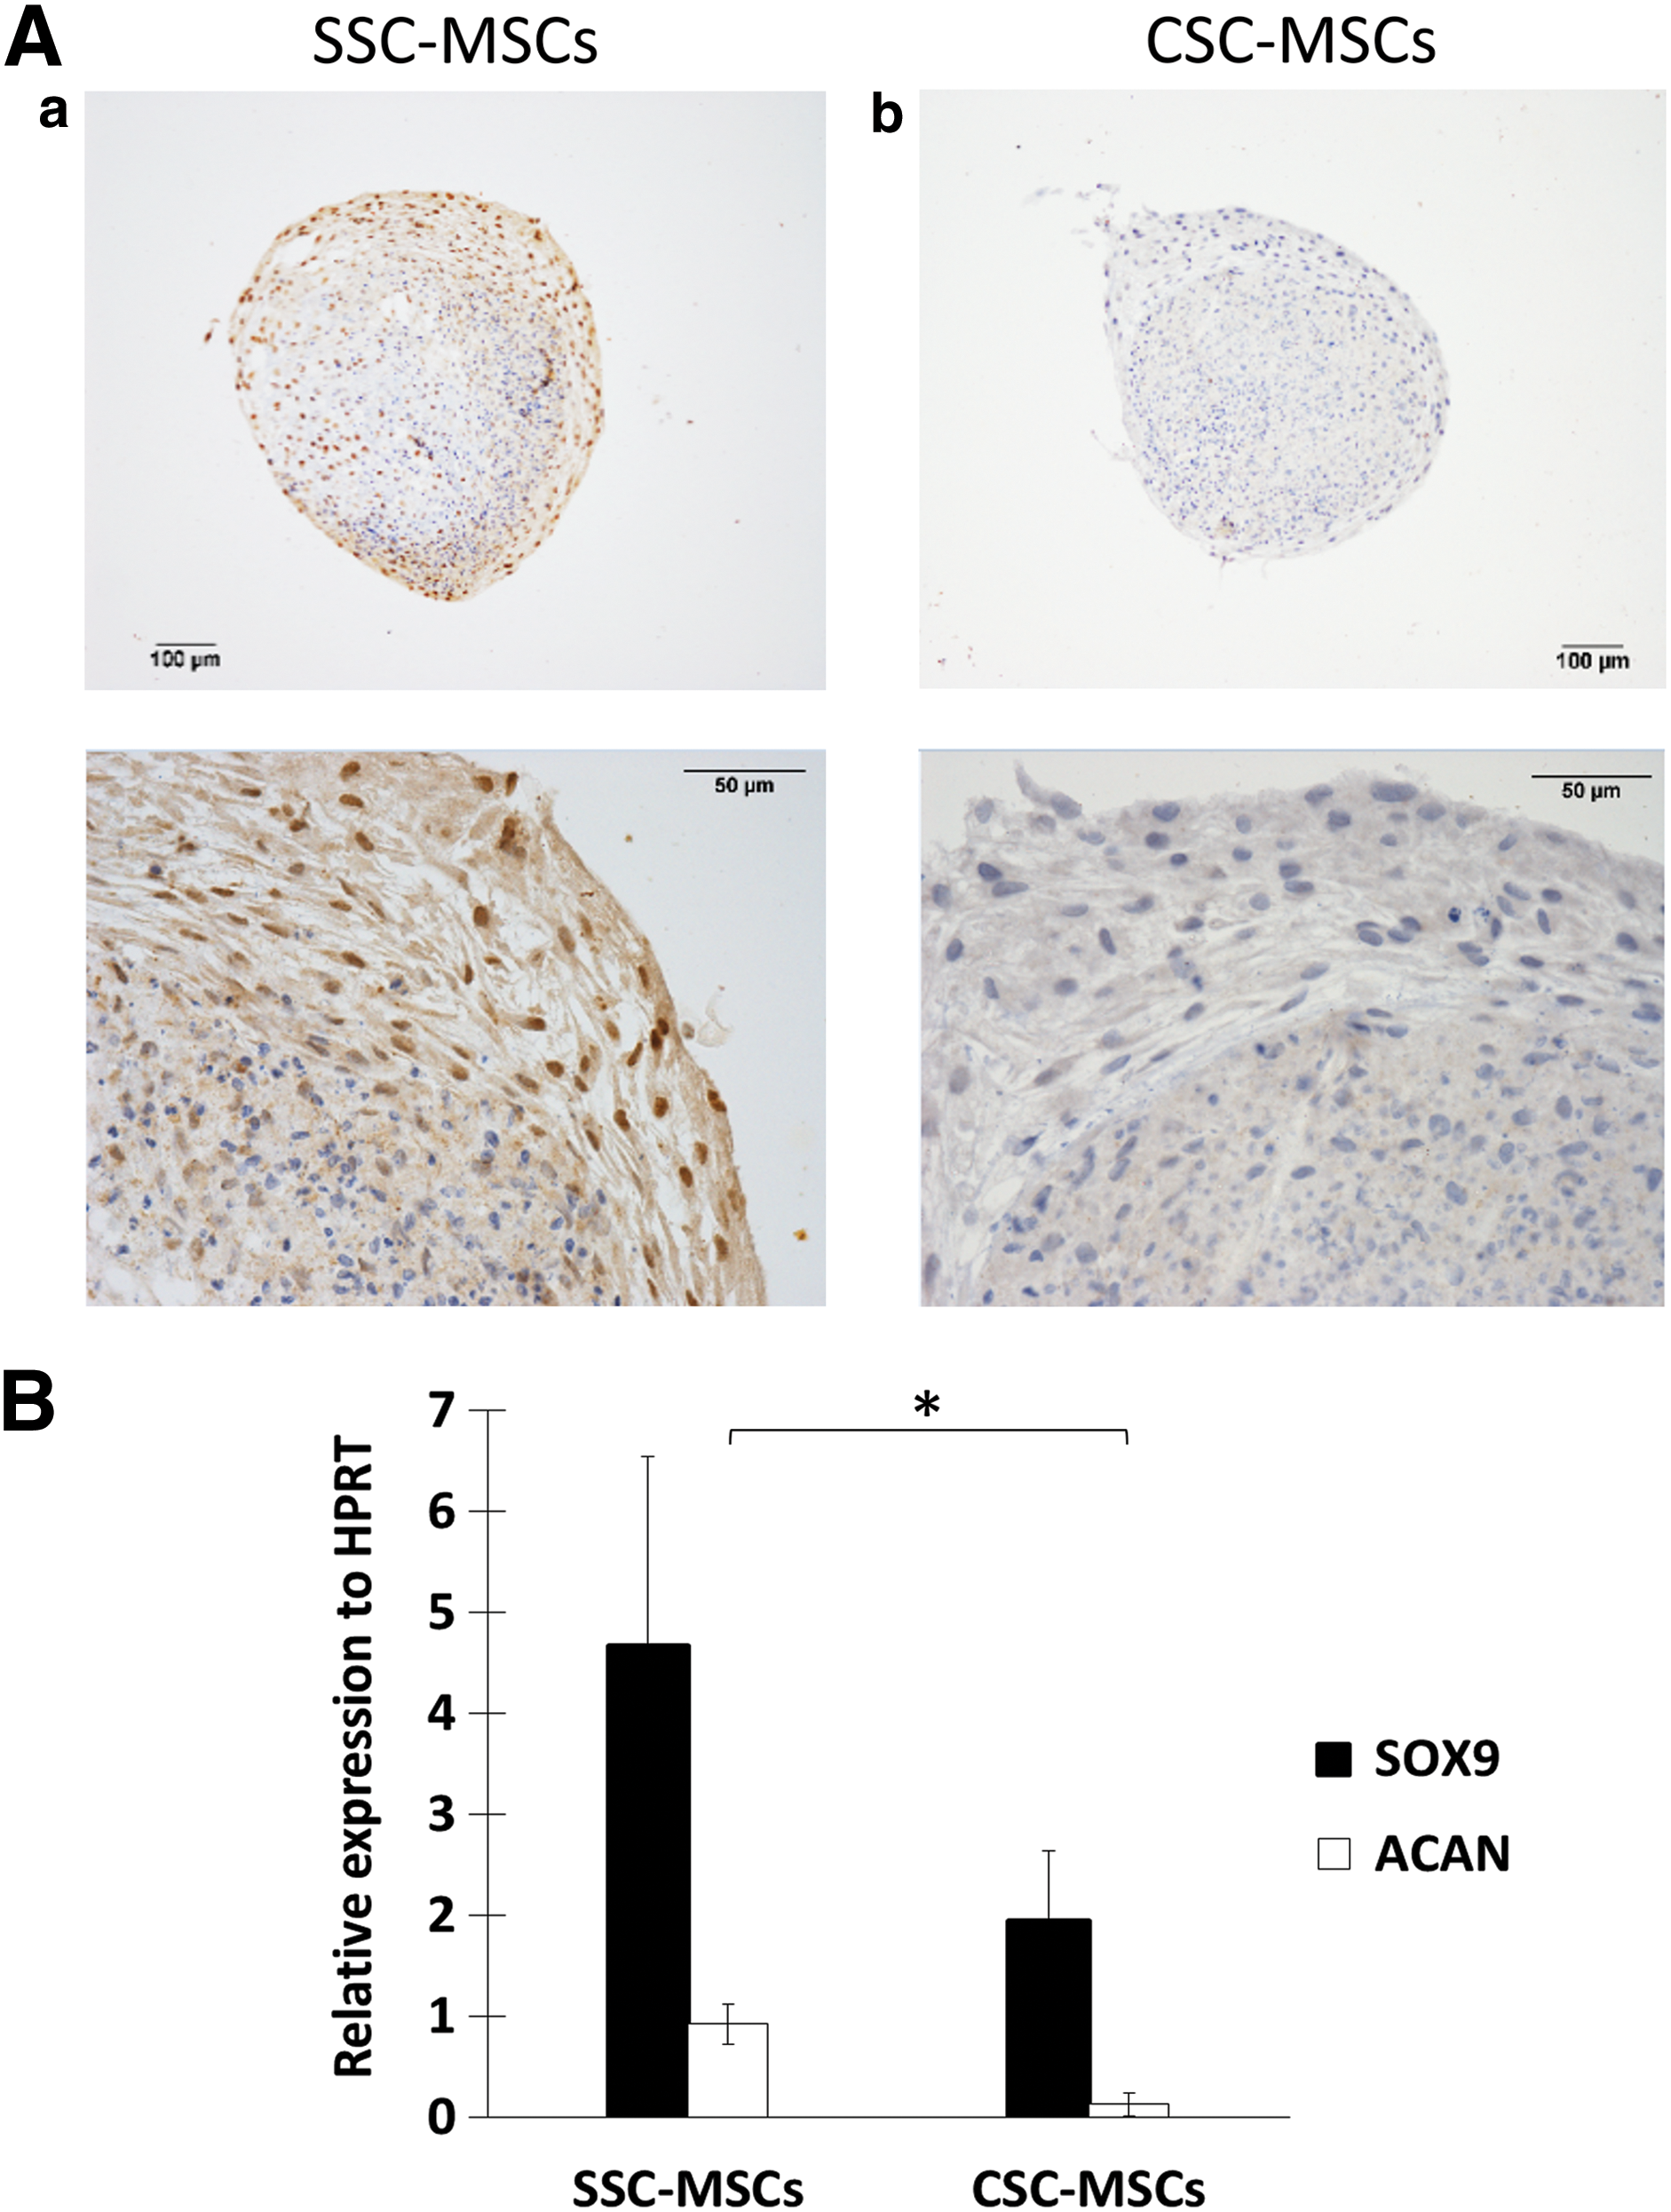
Chondrogenic differentiation capacity is decreased in MSCs from CSCs.
Capacity of SSC-MSCs and CSC-MSCs for hematopoietic proliferation
We previously defined proliferation as the production of new cells from a cell population regardless of the type of cells produced [15]. Thus, the proliferation of the hematopoietic progenitor-enriched cell population was determined based on the total cell number generated in the culture with a hemocytometer, Turk's solution, and trypan blue staining. Figure 4A shows hematopoietic cell cultures in the absence of MSCs or with MSCs from SSCs or CSCs (Fig. 4A, a–c, respectively).
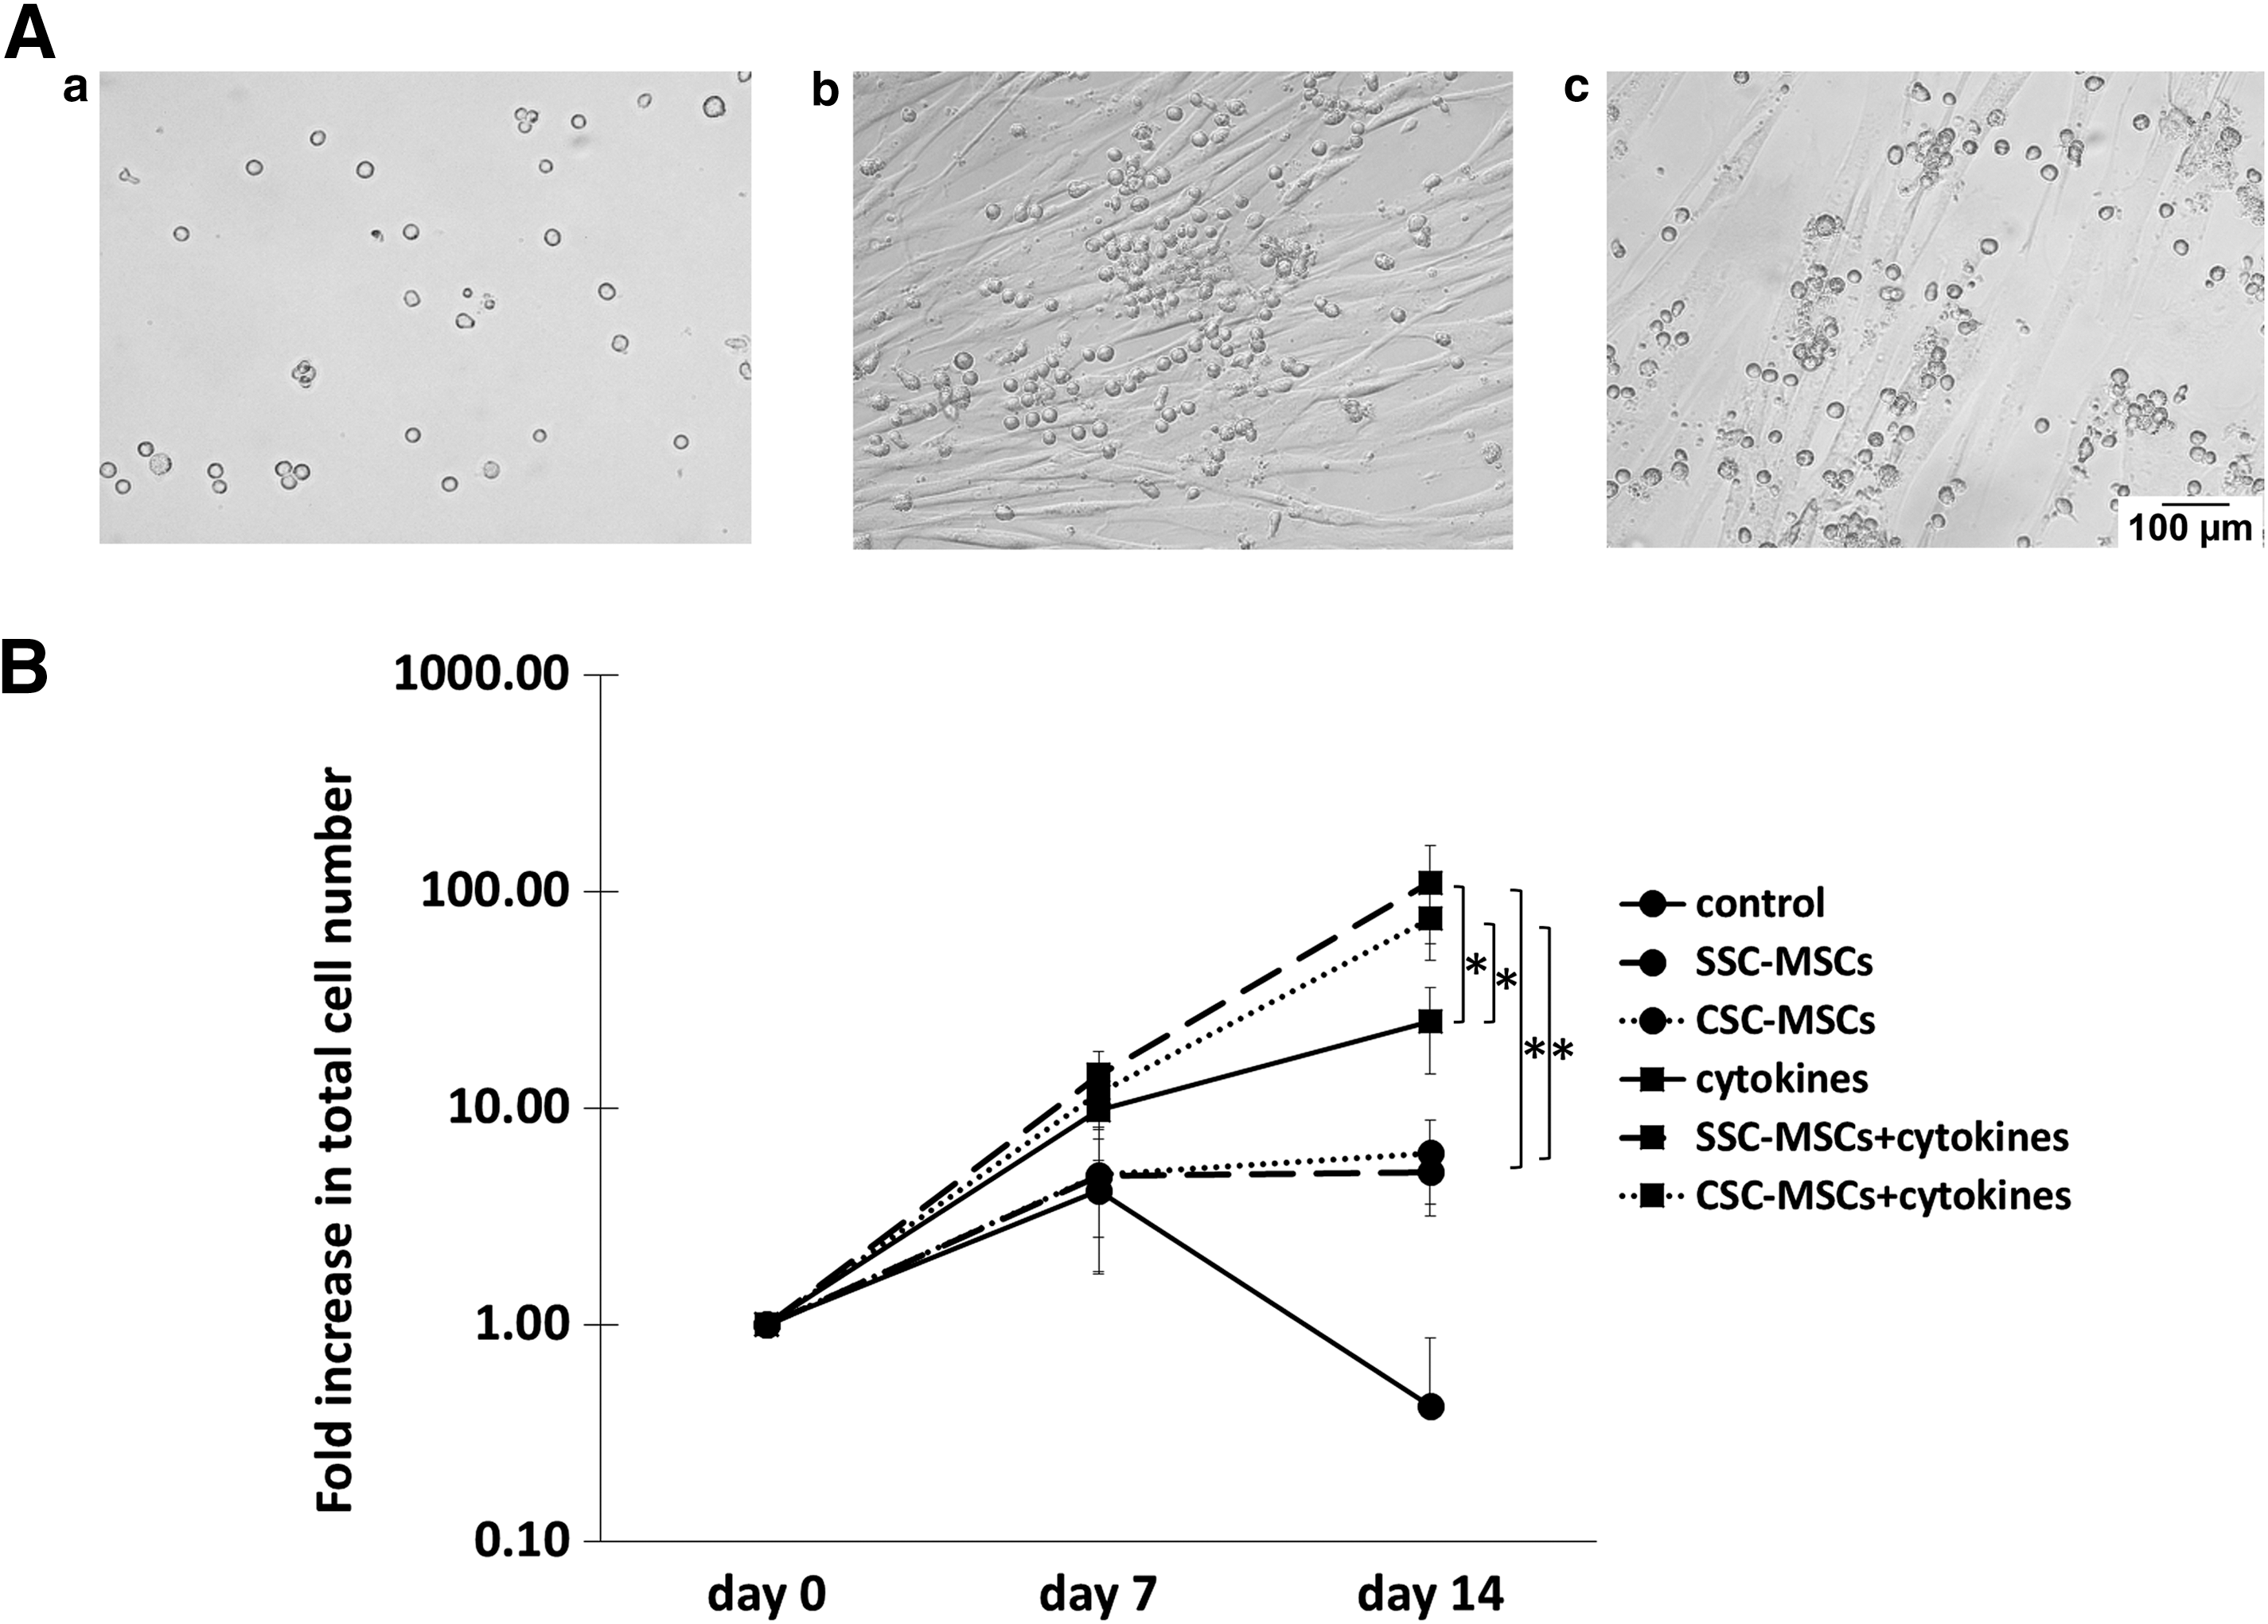
CSCs do not modify the capacity of MSCs to increase the proliferation of hematopoietic cells.
As shown in Fig. 4B, the hematopoietic cells were unable to proliferate in the absence of both MSCs and human recombinant cytokines (control); in this culture, the total number of nucleated cells decreased gradually and disappeared by day 14. On day 14, a fold increase in the total number of hematopoietic cells was observed in the cocultures in the absence of cytokines in the presence of MSCs from CSCs and SSCs (6.19 ± 2.6 and 5.07 ± 1.88, respectively; Fig. 4B). Interestingly, when cytokines (FL, SCF, TPO, and IL-6) were added to the cocultures, significantly greater fold increases (P < 0.05) were observed with MSCs from CSCs and SSCs (74.5 ± 26.4 and 110 ± 52.7, respectively) compared with the cultures with only cytokines (25 ± 10.7) or MSCs (Fig. 4B). No significant differences were detected in the number of hematopoietic cells obtained in cocultures from CSC-MSCs and SSC-MSCs.
Hematopoietic progenitor cell expansion capacity of SSC-MSCs and CSC-MSCs
We previously defined cellular expansion as the production of cells that maintained specific characteristics of the population of cells from which they originated [15]. In this study, we assessed the expansion of progenitors capable of forming both myeloid and erythroid colonies in semisolid cultures. Myeloid colonies included CFC-G, CFC-M, and CFC-GM and erythroid colonies included CFC-E and BFC-E (Fig. 5A). On day 14, slight fold increases in CFC-Ms were observed in cultures in the absence of cytokines and in the presence of SSC-MSCs or CSC-MSCs (1.26 ± 1.04 and 1.42 ± 1.41, respectively; Fig. 5B, a). Interestingly, when cytokines were added to the cocultures, the fold increases of CFC-Ms were 150.2 ± 85.62 and 217.6 ± 109.1 with MSCs from CSCs and SSCs, respectively; these increases were significantly greater (P < 0.05) than the increases in cultures with cytokines alone (24.4 ± 8.4; Fig. 5B, a). Similarly, slight fold increases in CFC-Es were observed in the presence of CSC-MSCs and SSC-MSCs (0.89 ± 0.94 and 0.83 ± 0.65, respectively; Fig. 5B, b). When cytokines were added to the cocultures, the fold increases of CFC-Es with CSC-MSCs and SSC-MSCs (77.32 ± 43.45 and 109.1 ± 65.1, respectively) were significantly greater (P < 0.05) compared with cultures with cytokines alone (15.3 ± 10.6; Fig. 5B, b). No significant differences were detected in the number of myeloid and erythroid progenitors obtained in cocultures from CSC-MSCs and SSC-MSCs.
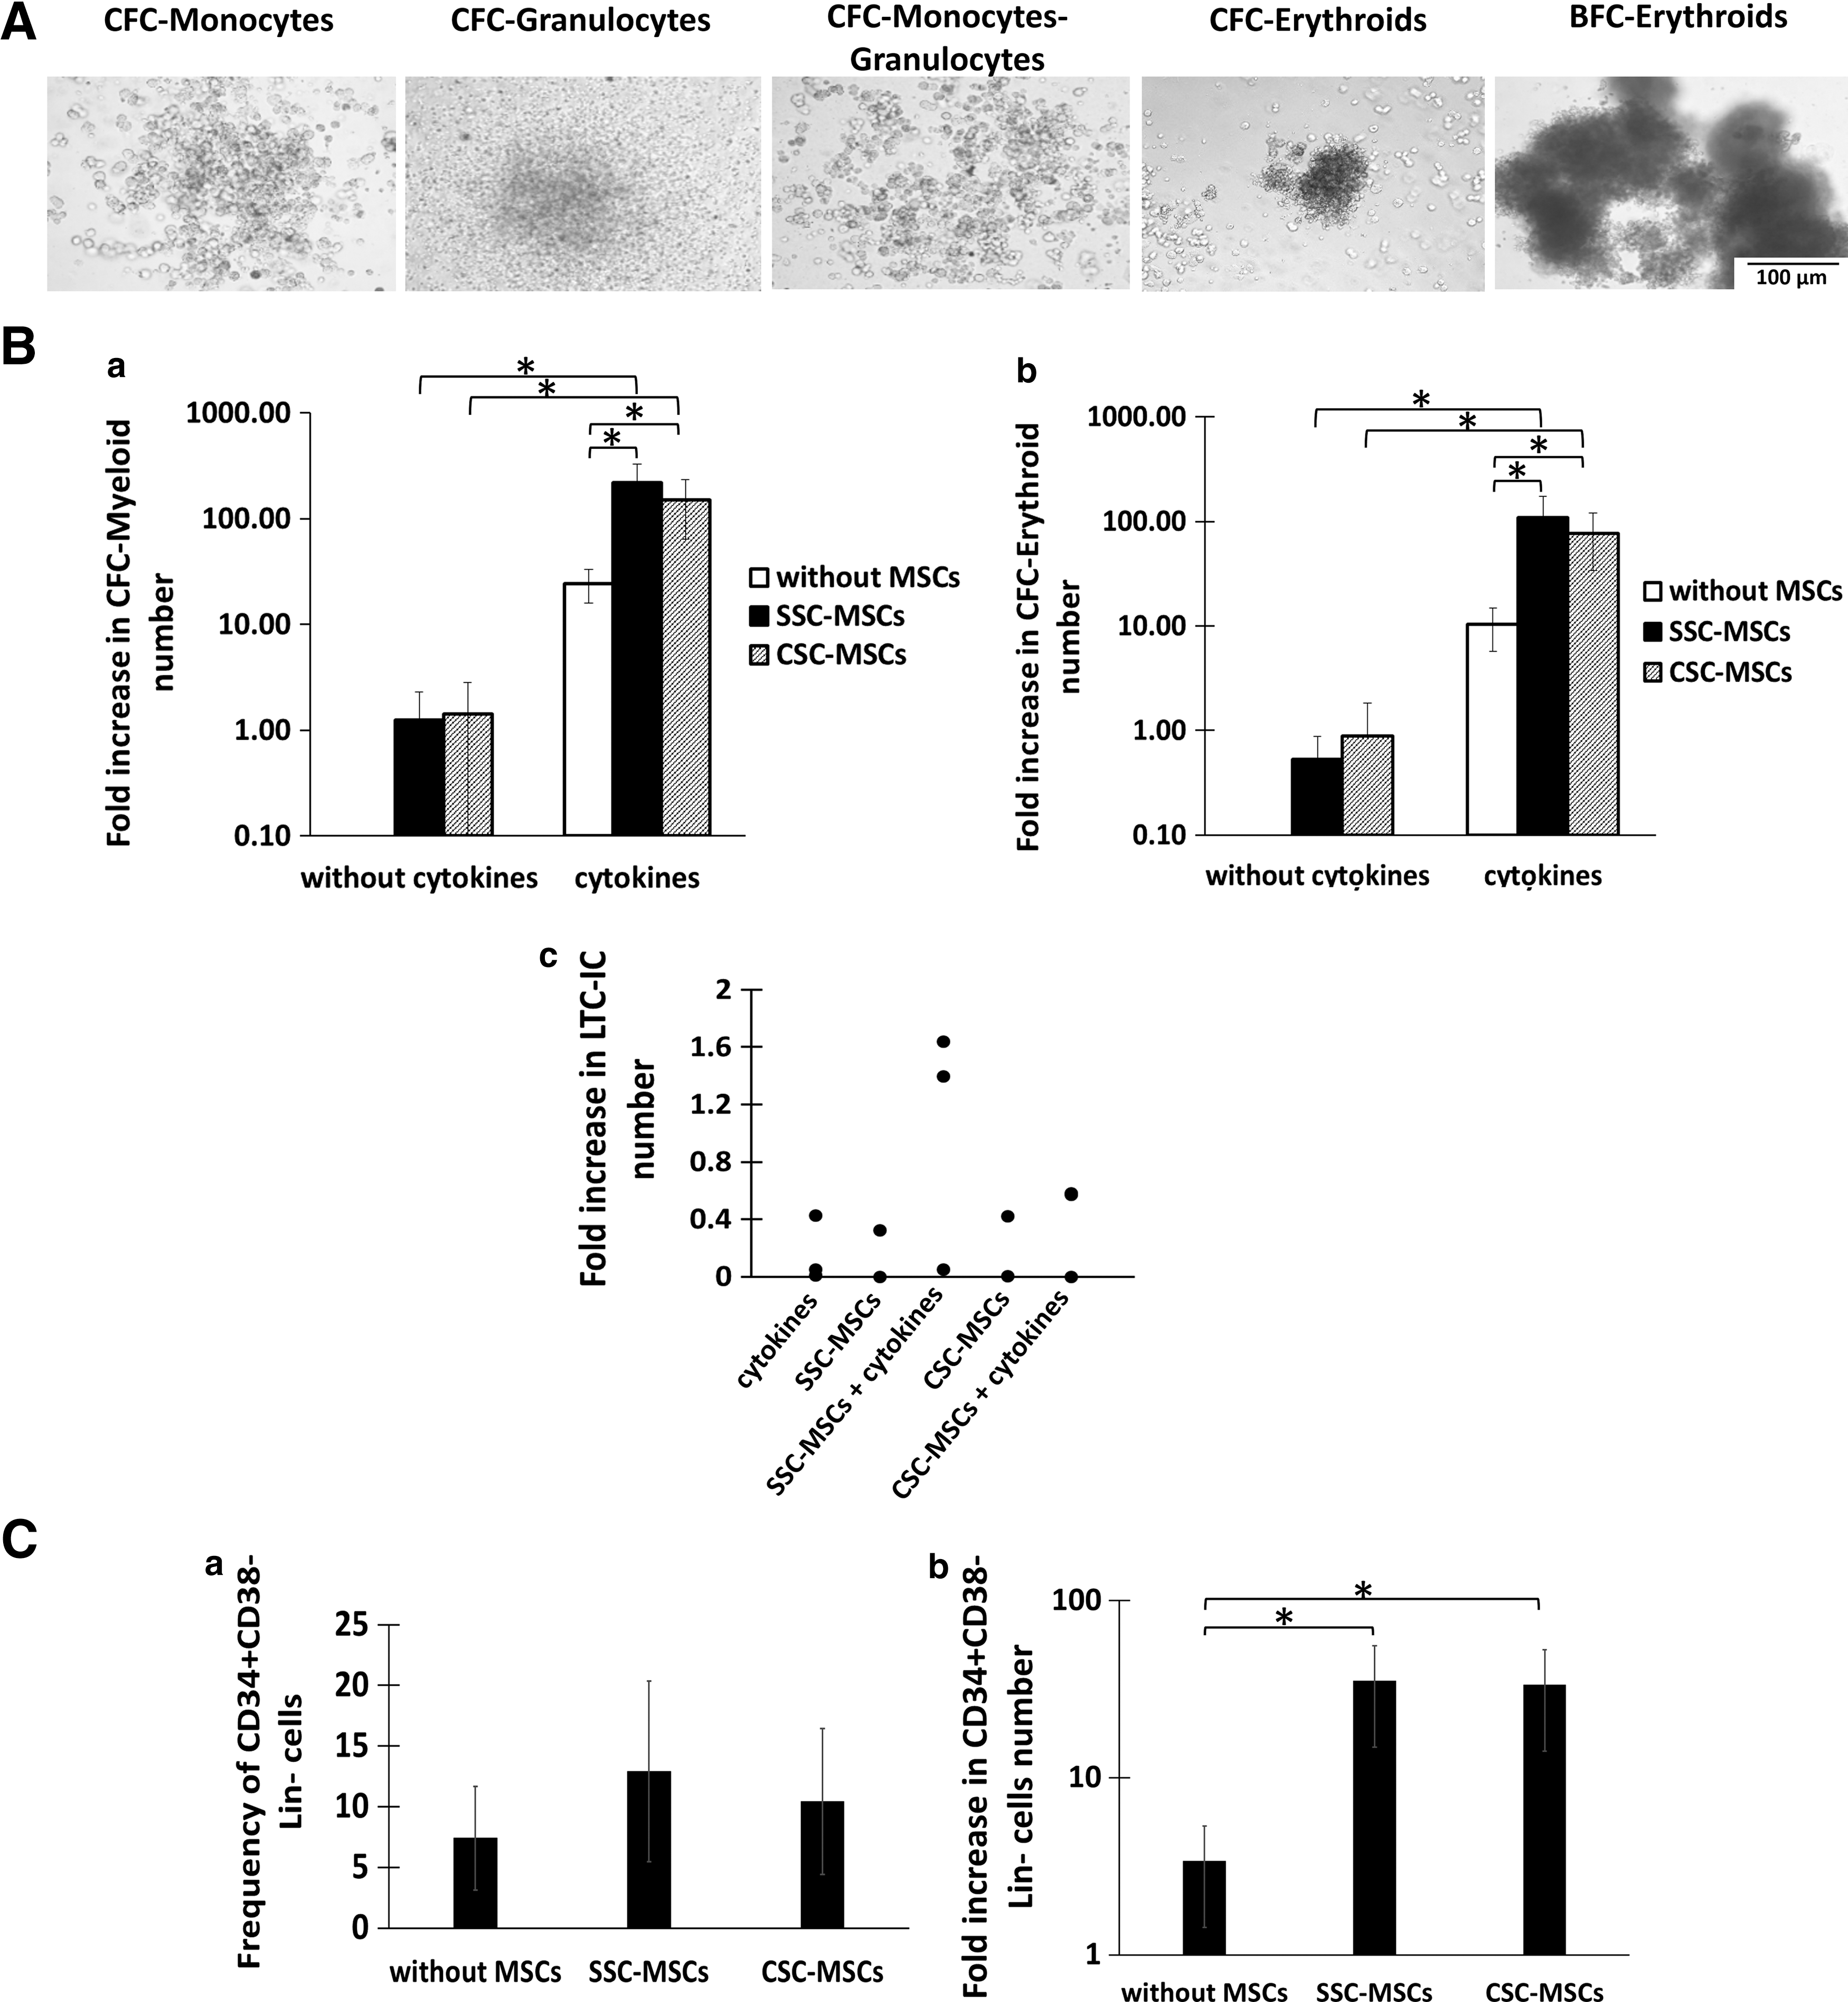
CSC does not modify the capacity of MSCs to increase HPC expansion.
Expansion of more primitive CFC (pre-CFC) and CD34+CD38−Lin− cells
We analyzed the effect of CSC-MSCs and SSC-MSCs on the formation of primitive HPCs with a LTC-IC capacity in the absence or presence of cytokines. Similar to the cultures with cytokines alone, the presence of LTC-ICs was observed on day 14 of some cultures with only CSC-MSCs and SSC-MSCs. When cytokines were added to the cocultures, slight fold increases of the LTC-IC numbers were observed with MSCs from SSCs compared with cultures with MSCs from CSCs (Fig. 5B, c). However, no significant differences were detected between the CSC-MSCs and SSC-MSCs.
Another parameter used to determine primitive HPC expansion is the increase in the number of cells with the CD34+CD38−Lin− immunophenotype, which we evaluated in this study. Cultures were generated with a population enriched in CD34+CD38−Lin− cells in the presence of cytokines and in the absence and presence of CSC-MSCs or SSC-MSCs. On day 14 of culture, increases were observed in the CD34+CD38−Lin− cell frequency in cultures with CSC-MSCs and SSC-MSCs (10.4 ± 6 and 12.9 ± 7.4, respectively), compared with cultures without MSCs (7.4 ± 4.2), although no significant differences were observed in the frequency values (Fig. 5C, a). However, the fold increases in the number of CD34+CD38−Lin− cells in cultures with CSC-MSCs or SSC-MSCs were significantly greater (P < 0.05) (33.4 ± 19.3 and 35.3 ± 20.3, respectively), compared with cultures without MSCs (3.3 ± 1.9; Fig. 5C, b). No significant differences were detected in cell numbers between the cultures from CSC-MSCs and SSC-MSCs.
Expression of molecules, cytokines, and extracellular matrix that regulate hematopoiesis
As part of the analysis of the hematopoietic support capacity of the CSC-MSCs, we analyzed the expression and secretion of important molecules involved in the regulation of hematopoietic cell formation and compared them with the molecules expressed in SSC-MSCs. Among the molecules analyzed, we determined the expression of important molecules for cell–cell contact by flow cytometry. In SSC-MSCs and CSC-MSCs, we observed a half level in the expression of CD146 and N-cadherin (Supplementary Table S3). Jagged-1 expression was not detected in either type of MSCs. We also observed a tendency for an increase in CD54 in CSC-MSCs compared to SSC-MSCs. Furthermore, we observed high intracellular expression of SDF-1 in both SSC-MSCs and CSC-MSCs (Supplementary Table S3). There were no significant differences in the expression of these molecules between the two types of cultures.
Regarding cytokine secretion, we quantified TPO, SCF, IL-6, and GM-CSF in the conditioned medium by CBA or ELISA. TPO was produced in similar quantities in the SSC-MSCs and CSC-MSCs (Supplementary Table S4). We also observed a tendency for a decrease in the production of SCF and IL-6 in the CSC-MSCs compared to the SSC-MSCs; however, no significant differences were detected (Supplementary Table S4). Furthermore, GM-CSF was not detected in the MSC cultures.
We also quantified the expression of ECM transcripts by real-time PCR. We observed a tendency for an increase in the expression of FN in CSC-MSCs compared to SSC-MSCs (2.86 ± 1.5 and 1.42 ± 0.91, respectively; Fig. 6). LAMA expression was similar in the CSC-MSCs and SSC-MSCs (0.15 ± 0.01 and 0.44 ± 0.28, respectively), whereas Col-I was significantly higher in the CSC-MSCs compared to the SSC-MSCs (1.35 ± 1.04 and 0.16 ± 0.07, respectively; P < 0.05; Fig. 6).
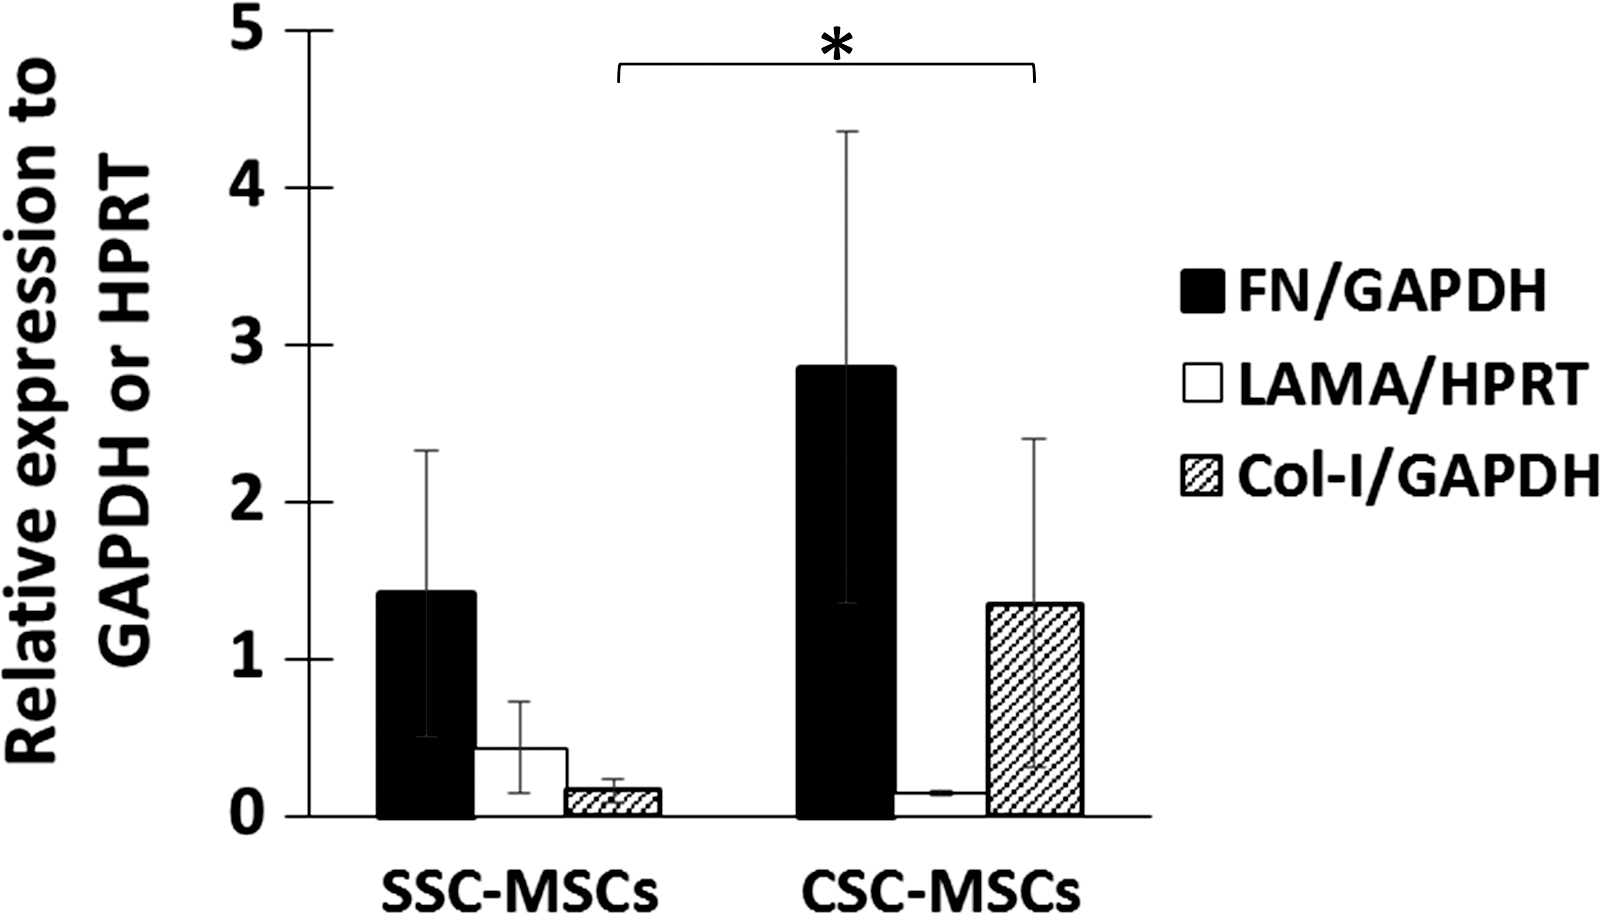
Gene expression analysis of matrix extracellular proteins. Expression of FN, LAMA, and Col-I in SSC-MSCs and CSC-MSCs detected by real-time PCR. n = 5 (*P < 0.05). FN, fibronectin; LAMA, laminin.
Immunosuppressive capacity of the SSC-MSCs and CSC-MSCs
The immunosuppressive capacity of the CSC-MSCs was evaluated in cocultures of MNCs from PB stimulated with PHA in the absence or presence of SSC-MSCs or CSC-MSCs (Fig. 7A, a–c). The proliferation of CD3+, CD4+, and CD8+ T cells (stained with CFSE) was determined by flow cytometry. The proliferation of activated T cells cultured in the absence of MSCs was considered 100% of the proliferative response (positive control). The CSC-MSCs showed significantly less ability to inhibit CD3+ T-cell proliferation compared to the SSC-MSCs (96.8% ± 1% and 71.7% ± 1.7%, respectively; P < 0.05; Fig. 7B, a). Similar results were obtained for CD8+ T-cell proliferation in the presence of CSC-MSCs (96.9% ± 1.6%) and SSC-MSCs (64.6% ± 1.25%; P < 0.05; Fig. 7B, c). Interestingly, although CD4+ T-cell proliferation was significantly reduced (56.27% ± 5.3%, P < 0.05) in the presence of CSC-MSCs compared to the positive control, this inhibition was significantly less than that observed with SSC-MSCs (41.1% ± 2.3%; P < 0.05; Fig. 7B, b).
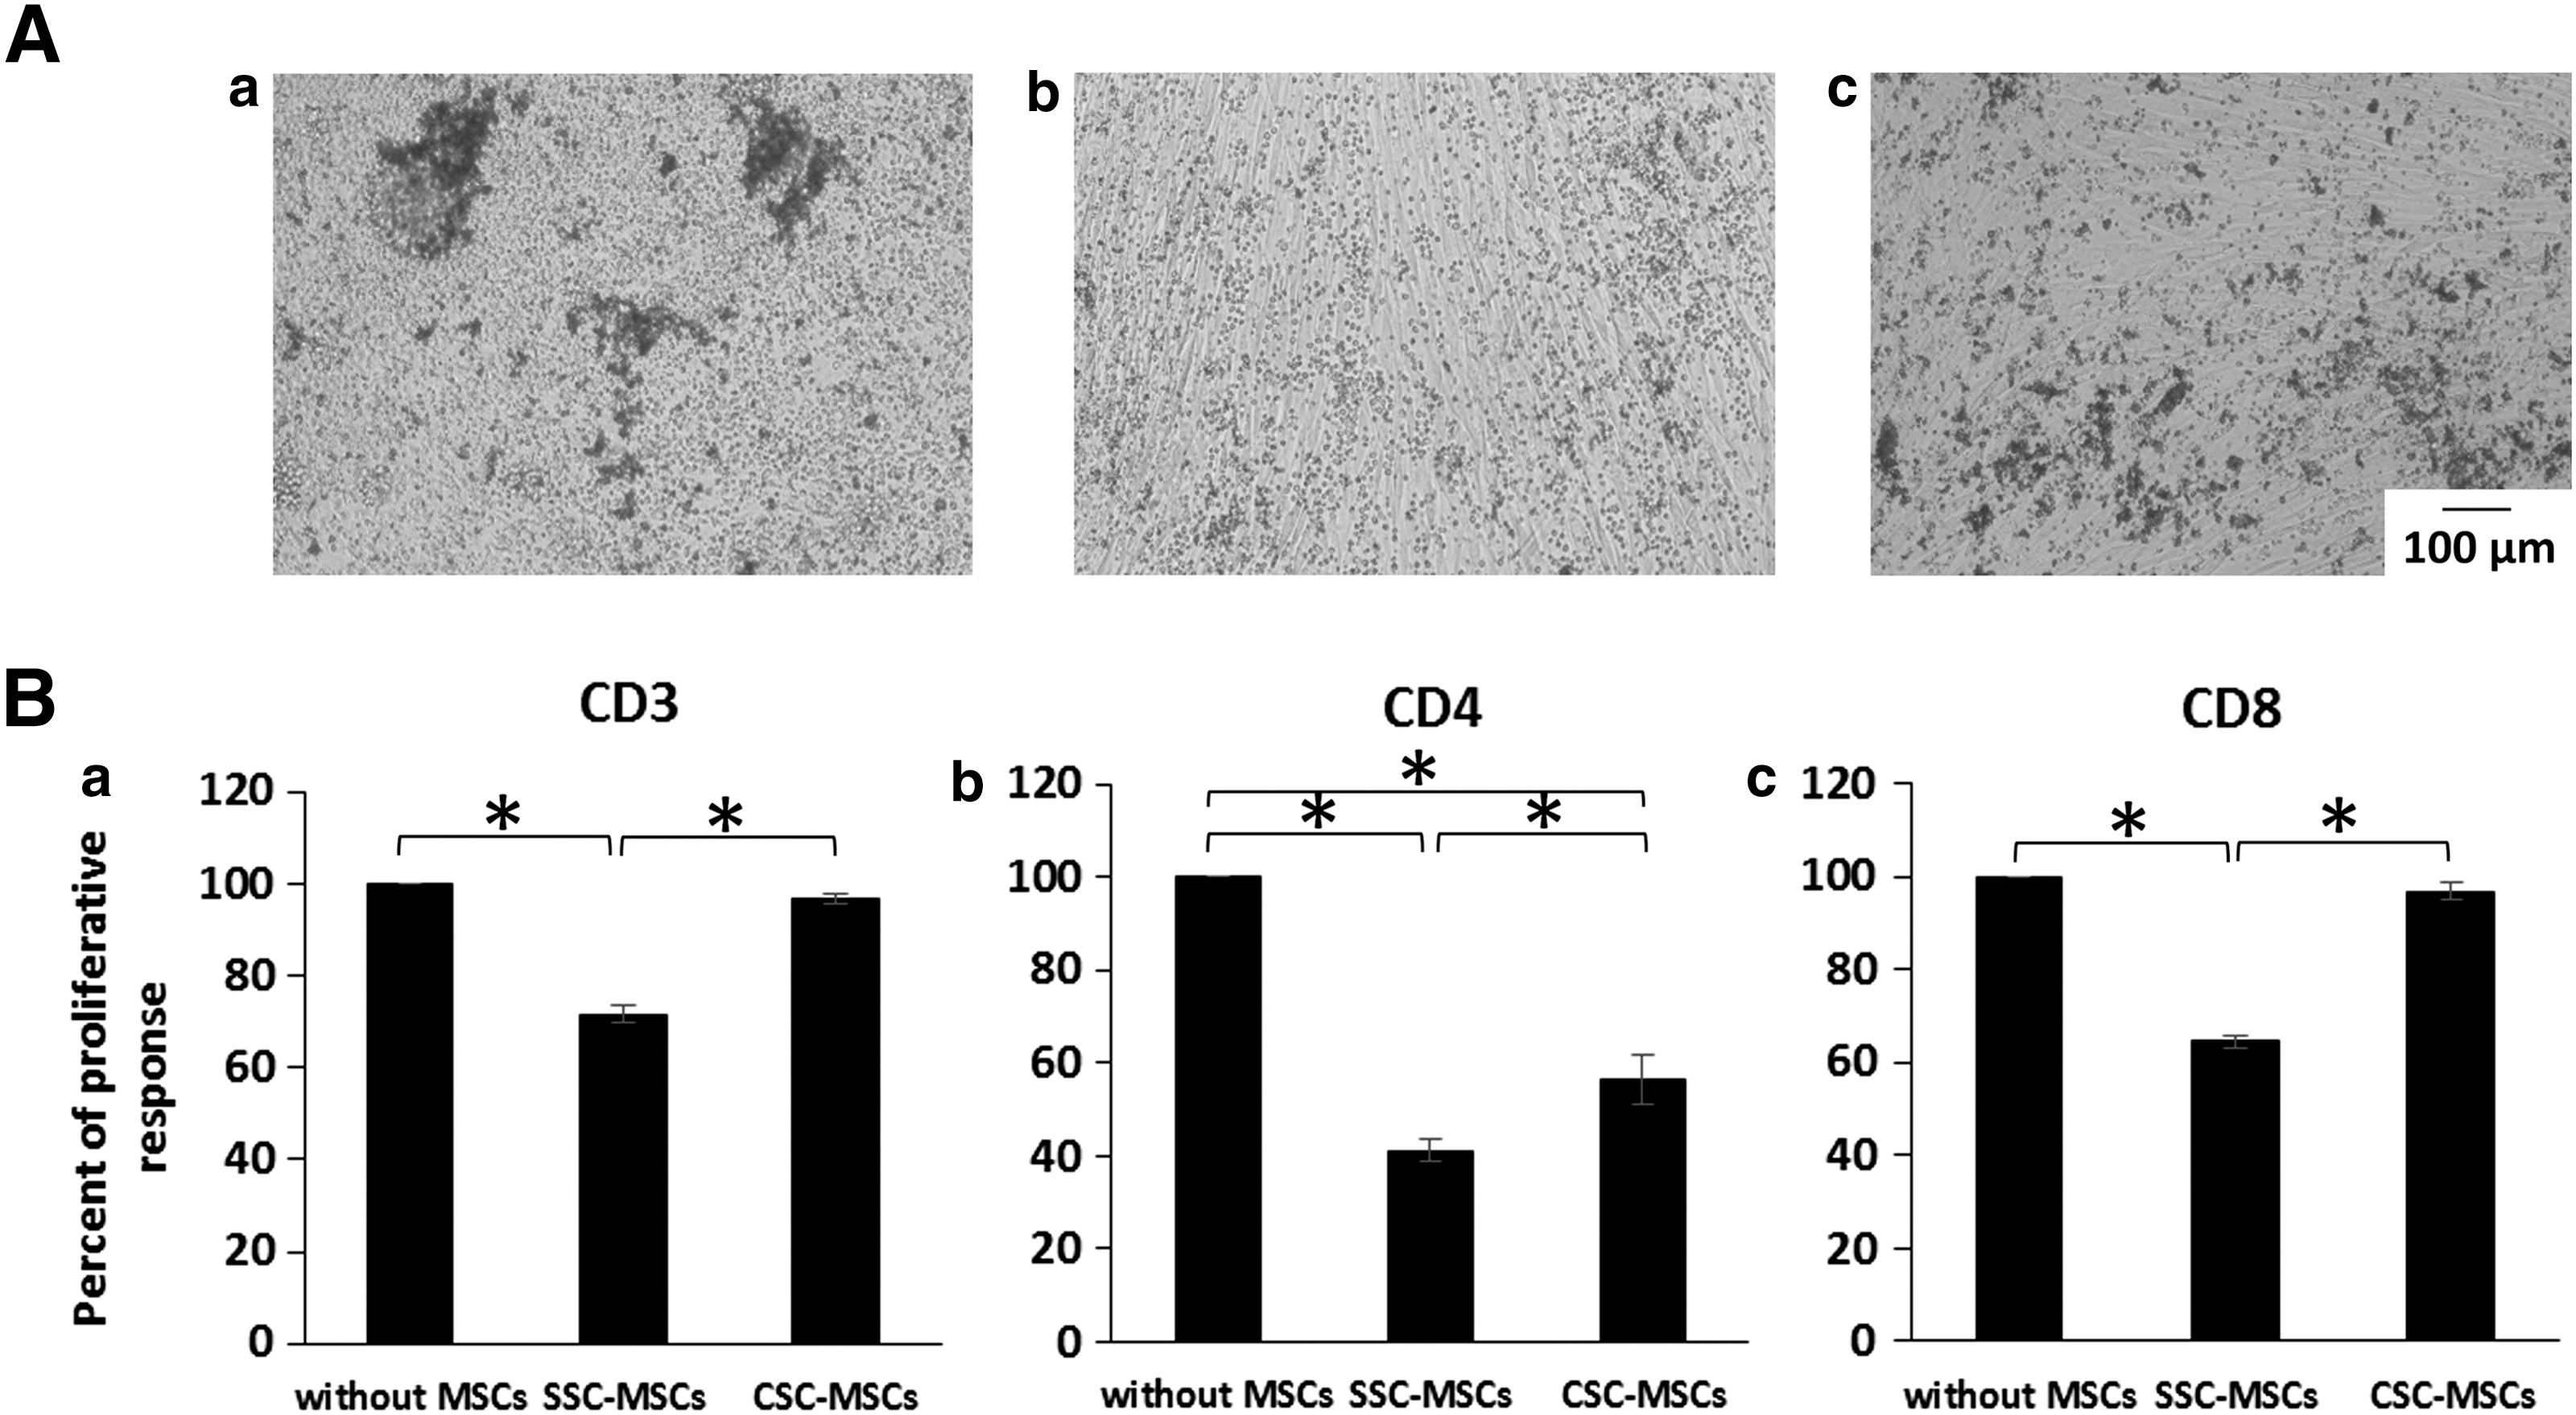
CSCs decrease the capacity of MSCs to inhibit CD3+, CD4+, and CD8+ T-cell proliferation.
Discussion
MSCs were first described by Friedenstein et al. almost four decades ago [19]. Since then, MSCs have become one of the most attractive cell types for cell therapy due to their capacity to differentiate toward different cell lineages (adipocytes, osteoblasts, chondrocytes, endothelial cells, and cardiomyocytes) [20], their immunosuppressive properties [3], and their hematopoietic cell support [2]. At present, several clinical trials involving the use of MSCs for hematopoietic cell transplant, GVHD, autoimmune diseases, and tissue regeneration are in progress [1,3,4]. However, the low frequency of MSCs in BM (1/0.031 × 106 MNCs) [12] raises the need to expand the cells to reach the number needed for clinical applications (1–5 × 10⁶/kg) [2]. Different groups have been able to expand MSCs on a clinical scale and in sufficient numbers for their use in clinical trials [7,8,21 –23]. However, the expanded cells may present differences in their functional characteristics due to the cell expansion procedure, and this issue has not been addressed by these studies. The aim of this study was to compare the morphology, immunophenotype, differentiation capabilities, hematopoietic support, and immunosuppression of BM-MSCs before (SSC-MSCs) and after (CSC-MSCs) their clinical scale expansion.
We found that the CSC-MSCs maintained a fibroblastic morphology and an immunophenotype similar to SSC-MSCs, which was consistent with previous reports [6,7,24 –29]. However, we found a difference in the sizes of the cells. CSC-MSCs contained a higher proportion of cells with abundant cytoplasm, which we previously described as “large cells” [12]. The presence of “large cells” has been associated with decreased adipogenic and chondrogenic differentiation potential in MSC cultures [30,31], although further studies showed that such cells are associated with cellular senescence, which has been demonstrated by beta-galactosidase staining [32,33].
Regarding the differentiation potential of CSC-MSCs, several reports showed that they retained their adipogenic, osteogenic, and chondrogenic capabilities even at late passages [24 –28], but there were also reports that the expansion of MSCs in CSCs diminished their ability to differentiate into these lineages [10,31,34]. In the present work, we evaluated the differentiation potential of CSC-MSCs using cytochemical, immunohistochemical, and gene expression analyses to help clarify this controversy. We found that the adipogenic potential of CSC-MSCs was drastically decreased when assessed by cytochemistry (Oil Red O staining) and real-time PCR (LPL and PPAR-γ). The osteogenic potential of CSC-MSCs was slightly reduced compared to SSC-MSCs, and we found decreased expression of ALP by cytochemistry and OPN by immunohistochemistry and real-time PCR. It is important to mention that high ALP activity has been observed at 14th day, but in our study, expression of ALP was determined at 14 and 21 days and there were no significant differences between both days of induction (data not shown). Similar ALP activity was observed at 14 and 21 days. Notably, the expression of pro-Col-I and Col-I was not reduced, but was higher than the expression in SSC-MSCs, although the difference was not significant. Regarding the chondrogenic differentiation, MSCs from CSCs had the ability to form micromasses; however, they exhibited reduced expression of Col-II and ACAN.
Decreased differentiation of CSC-MSCs toward adipocytes, osteoblasts, and chondrocytes was also observed in MSCs cultured under standard conditions after 8–10 passages [10]. This decrease has also been associated with the presence of “large cells” in the culture, which have a decreased differentiation capacity [30,31]. This finding may not impede the ability to use CSC-MSCs for cell therapy because the decreased differentiation potential has been shown to be reversible in the presence of morphogens and growth factors [34] and suggest that most clinical MSC applications do not rely on differentiating donor cells, but on the secretion of trophic factors that induce host tissue regeneration [35].
We also analyzed MSC hematopoietic support before and after their expansion in CSCs. We found that CSC-MSCs could support the proliferation and expansion of early HPCs (immunophenotype CD34+CD38−Lin−), late HPCs (CFC-Ms and CFC-Es), and primitive HPCs (LTC-ICs). In agreement, we found that CSC-MSCs did not exhibit modified expression of the cell surface molecules (CD146, CD54, and N-cadherin), chemokines (SDF-1), cytokines (TPO, SCF, and IL-6), and extracellular matrix proteins (FN and LAMA) involved in the self-renewal, homing, proliferation, and differentiation of HSCs/HPCs [2]. Interestingly, we did not detect GM-CSF in the CSC-MSCs or SSC-MSCs supernatant in contrast to other reports [36,37]. However, the culture conditions were different from those evaluated in our study. The increased expression of Col-I transcripts in CSC-MSCs could be related to Col-I's ability to support hematopoiesis given its involvement in maintaining the functional characteristics of the HSCs in hematopoietic niches [2]. However, this result may also suggest the onset of a fibrotic reaction (related to senescence of MSCs) [38] and should be considered in future clinical applications, especially for treating diseases such as cardiac ventricular fibrosis after myocardial infarction and lung allografts [38,39]. To the best of our knowledge, this is the first study to determine the hematopoietic support of CSC-MSCs and establish that this capacity is not lost after their culture on a large scale. These results support the use of CSC-MSCs for hematopoietic recovery in patients undergoing HSCT, which to date have shown positive effects [2,40].
Finally, we assessed whether the CSC modified the immunosuppressive capacity of MSCs. We analyzed the ability of CSC-MSCs to inhibit PHA-activated CD3+, CD4+, and CD8+ T-cell proliferation. We observed that CSC-MSCs showed a reduced immunosuppressive capacity compared to SSC-MSCs because they were not able to inhibit the proliferation of CD3+ and CD8+ T cells. However, it is important to note that CSC-MSCs retained their ability to suppress the proliferation of CD4+ T cells although to a minor extent compared to SSC-MSCs. The decreased ability of CSC-MSCs to inhibit T-cell proliferation may explain the cases where no favorable response is observed in the treatment of GVHD [1,5].
The presence of senescent cells (characterized by morphological alterations), the decrease in the differentiation potential and immunosuppressive capacity of MSCs from CSCs, suggests that MSCs expanded in CSCs reveal a gradual loss of functionality [10,32,33,41]. The mechanisms underlying MSCs replicative senescence may include telomere shortening, accumulation of DNA damage, and epigenetic changes [10]. Alves et al. demonstrated that MSCs were capable of accumulating DNA damage during in vitro culture; moreover, p16 and p21 expression was increased, resulting in the loss of their differentiation potential [42]. After large-scale in vitro expansion, MSCs acquired genetic alterations [43,44], but these alterations did not lead to malignant transformation [45,46]. It is important to mention that in our culture system, we have used xenogenic FBS as a supplement for the in vitro MSC expansion. However, it was demonstrated by several working groups that human serum and platelet lysate provide much better growth support (and less senescence) than FBS [26,47], although it has also been reported that the use of platelet lysate decreases the immunosuppressive capacity of MSCs [47]. We are currently doing research along this line.
In summary, our study shows that there is a differential regulation of CSC-MSC properties because the hematopoietic support capacity is not affected despite decreases in their ability to differentiate and cause immunosuppression. To our knowledge, this is the first study in which the hematopoietic support capacity and immunosuppressive properties of BM-MSCs from SSCs and CSCs are compared in a comparative manner. Our results suggest that large-scale MSC production for clinical use must include proper quality controls to ensure the efficacy of MSCs for use in patients.
Footnotes
Acknowledgments
We gratefully acknowledge the technical assistance of Guadalupe Alarcón Santos, Beatriz Hernández, Martina Flores, Luis Chávez, and Juan de Dios Moreno. Grant Sponsor: research in the authors' laboratory is supported by grants from the Mexican Institute of Social Security (IMSS, grant no. 1159 and PRIO-10) and the National Council of Science and Technology (CONACYT, grant no. 87183), Mexico. We appreciate the contribution of the Thematic Network for Stem Cells and Regenerative Medicine for its financial support. This article constitutes a partial fulfilment of the Graduate Program in Biological Sciences of the National Autonomous University of Mexico (UNAM) to obtaining the academic degree of doctor. Guadalupe Rosario Fajardo Orduña acknowledges the scholarship and financial support provided by the CONACYT and the Graduate Program in Biological Sciences of UNAM for the training received during the studies.
Author Disclosure Statement
The authors declare that they have no competing or financial interests.
References
Supplementary Material
Please find the following supplemental material available below.
For Open Access articles published under a Creative Commons License, all supplemental material carries the same license as the article it is associated with.
For non-Open Access articles published, all supplemental material carries a non-exclusive license, and permission requests for re-use of supplemental material or any part of supplemental material shall be sent directly to the copyright owner as specified in the copyright notice associated with the article.