
Abstract
The plasticity of the mammary gland relies on adult mammary stem cells (MaSCs) and their progenitors, which give rise to various populations of mammary epithelial cells (MECs). To face global challenges, an in-depth characterization of milk-producing animal mammary gland plasticity is required, to select more sustainable and robust dairy cows. The identification and characterization of MaSC and their progenitors will also provide innovative tools in veterinary/human medicine regarding mammary tissue damage (carcinogenesis, bacterial infections). This study aimed to determine the dynamics of mammary cell populations throughout a lactation cycle. Using mammary biopsies from primiparous lactating dairy cows at 30, 90, 150, and 250 days of lactation, we phenotyped cell populations by flow cytometry. To investigate cell lineages, we used specific cell-surface markers, including CD49f, CD24, EpCAM (epithelial cell adhesion molecule), and CD10. Two cell populations linked to milk production were identified: CD49f +/EpCAM− (y = 0.88x + 4.42, R 2 = 0.36, P < 0.05) and CD49f −/EpCAM− (y = −1.15x + 92.44, R 2 = 0.51, P < 0.05) cells. Combining immunostaining analysis, flow cytometry, daily milk production data, and statistical approaches, we defined a stem cell population (CD24+/CD49f +) and four progenitor cell populations that include bipotent luminal progenitors (CD24−/CD49f +), lumino-alveolar progenitors (CD24−/EpCAM+), myoepithelial progenitors (CD24+/CD10−), and lumino-ductal progenitors (CD49f −/EpCAM+). Interestingly, we found that the bipotent luminal progenitors (CD24−/CD49f +) decreased significantly (P < 0.05) during lactation. This study provides the first results of mammary cell lineage, allowing insight into mammary cell plasticity during lactation.
Introduction
M
During early lactation, the rate of proliferating mammary cells overtakes the rate of apoptosis, thereby increasing the number of mammary cells. The decline in MY during late lactation is due to loss of mammary cells (apoptosis) and remodeling of mammary tissue. This results in alveolar regression during involution [4]. To date, our understanding of the phenotypic differentiation of mammary epithelial cells (MECs) is limited. Current knowledge in mice and humans indicates the existence of stem cell and/or bipotent stem/progenitor cell populations that give rise to mature/differentiated cells [5]. The presence of mammary stem cells (MaSCs) and their progenitors in the bovine mammary gland has been recently shown [6]. Since they play a crucial role in cell proliferation and tissue regeneration, the characterization of bovine MaSCs is needed, to improve dairy cow productivity and mammary gland health, as well as to expand the lifespan of cows. In addition, the bovine mammary gland represents an excellent alternative model for biomedical research to investigate the role of MaSC in mammary function and carcinogenesis [7].
Evidence for the existence of MaSCs has been primarily derived from transplantation experiments with murine mammary tissues. These studies revealed that ductal architecture could be regenerated in vivo when isolated parenchymal segments were transplanted into cleared mammary fat pads [8 –10]. Furthermore, it was shown that epithelial cells isolated from virgin, pubertal, gestational, and lactating glands could all repopulate cleared fat pads [9]. As such a variety of parenchymal structures can regenerate a complete parenchymal framework; it is likely that progenitor or stem cells are present throughout the mammary epithelium. To date, MaSC studies in ruminants have been very sparse. Recently, Baratta et al. investigated different epithelial cell subpopulations in milk cells by flow cytometry [11]. They found an increase in CD49f + cells and cytokeratin 14/18 cells at the end of lactation in dairy cows.
In 2002, Ellis and Capuco were the first to provide data on the proliferation rate of MECs, using histological analysis of mammary gland explants from heifers, which were injected with BrdU before euthanasia [6]. They identified different staining intensities in MEC populations and proposed that the lightly stained cells were the primary proliferative cell population. In 2010, Martignani et al. showed that a putative bovine MaSC population was able to regenerate and maintain a complete mammary gland structure [12]. They hypothesized that these putative MaSCs can give rise either to luminal (cytokeratin 18 positive) or myoepithelial (cytokeratin 14 positive) cells under specific cell culture conditions. To our knowledge, no studies have been performed on the lineage, hierarchy, and proportion of mammary cell populations throughout a lactation cycle.
Flow cytometry with specific cell-surface markers is a sensitive approach to lineage and quantifies cell populations and subpopulations in the mammary gland [7]. The expression of cluster of differentiation (CD) molecules, such as heat stable antigen (CD24) and integrin alpha-6 (CD49f), has been widely used to identify epithelial cells in the mammary gland [13,14]. Recently, four populations have been found in the developing mammary gland (at puberty) by expression of CD24 and CD49f. Cell sorting experiments allowed the characterization of putative stem cells (CD24MedCD49f Pos), putative progenitor cells (CD24HighCD49f Neg), and basal (CD24NegCD49f Pos) and luminal (CD24MedCD49f Neg) subpopulations[15].
In the human mammary gland, the combination of the cell-surface markers EpCAM (epithelial cell adhesion molecule) and CD49f has served to identify basal cell populations [16,17]. In lactating goats, EpCAM has been found by immunostaining in luminal populations of alveoli and seems to be related to cell proliferation [18]. Moreover, cell populations expressing EpCAM and CD49f represent a source of mammary progenitors with stem cell characteristics, due to their ability to form mammospheres [19 –21]. To characterize myoepithelial cells, the neutral endopeptidase CD10, also called common acute lymphoblastic leukemia antigen (CALLA), has been identified at the apical surface of myoepithelial cells during cell contraction in the mammary gland [22,23]. In the bovine mammary gland, CD10 has also been shown to be a relevant marker of myoepithelial cell differentiation in prepubertal bovine mammary gland [24].
The present study aims to determine the cellular hierarchy throughout a lactation cycle, to understand the involvement of the various cellular populations in bovine mammary gland plasticity and milk production. Toward this aim, we used flow cytometry to identify cellular populations using the cell-surface markers CD49f, CD24, EpCAM, and CD10 in mammary explant sampled from lactating dairy cows at 30, 90, 150, and 250 days of lactation. The identification of cell populations allowed us to highlight MEC plasticity during lactating periods.
Materials and Methods
All animal procedures were discussed and approved by the National Ethics Committee for Animal Experiments (File No. 00943.02), in compliance with French regulations (Decree No. 2001-464, May 29, 2001).
Animals and experimental design
The five primiparous Holstein cows used in this study were raised at the Méjusseaume INRA-Rennes (France) experimental barn. The cows were collectively housed and fed in barns during the winter and in fields during the summer. They were milked twice daily during the entire experimental period.
Milk production recording and milk composition analysis
The MY was recorded daily for 52 weeks. Milk samples were collected weekly for somatic cell counting (SCC) and milk composition analysis. Milk protein and fat contents were determined by an independent laboratory using an infrared method (LILLAB, Chateaugiron, France).
Mammary tissue sampling
Mammary tissue samples were collected by biopsy at days 30 (B1), 90 (B2), 150 (B3), and 250 (B4) of lactation (adapted from the method of Farr et al. [25]) from the left and the right halves of the udder. Biopsies were taken approximately halfway between the base of the teat and the dorsal body wall in a region containing a large amount of secretory tissue. Each biopsy was divided into three parts. The first part was cut into small explants (1 mm3) and samples were stored in 90% fetal bovine serum (FBS, 10270-106; Gibco)/10% dimethyl sulfoxide (DMSO) at −150°C for tissue digestion and cell isolation. The second part was immediately frozen in liquid nitrogen and stored at −80°C until RNA extraction was performed. The last part was washed in phosphate-buffered saline (PBS) before fixation for histological analysis (See Histological section). DMSO and PBS were from Sigma-Aldrich (Saint-Quentin Fallavier, France,
Mammary biopsy digestion and single cell suspension
Tissue explants were thawed and incubated for 3 h at 37°C in a digestion medium containing Dulbecco's modified Eagle's medium nutrient mixture F-12 (31331-028; Gibco), 5% FBS, 5 μg/mL insulin (15523; Sigma-Aldrich), 1 μg/mL hydrocortisone (H-0888; Sigma-Aldrich), 7,000 U/mL collagenase type II (54N15271; Worthington), and 2,000 U/mL hyaluronidase (H3506-G1; Sigma-Aldrich). After centrifugation at 500 g for 5 min at 4°C, 2 mL of trypsin-ethylene-diamine-tetraacetic acid (EDTA, T4049-100ML; Sigma-Aldrich) was added to the pellet to complete the dissociation process. After centrifugation, the pellet, composed of cells and remaining tissue, was drained through a 70 μm filter (Miltenyi Biotec, Paris, France,
Histological analysis
Mammary tissue samples were fixed in 4% paraformaldehyde (pH 7.4) (P6118; Sigma-Aldrich) for 2 h and paraffin embedded (327204; Sigma-Aldrich) using standard protocols provided by the H2P2 platform (University of Rennes 1, France). Tissue sections (5 μm thickness) were mounted on Superfrost Plus slides (4951PLUS4; Thermo Scientific, Paris, France,
Immunological staining procedure
Immunohistochemical labeling was performed using slides bearing three tissue sections. Two tissue sections were processed for each primary antibody, while the third section was used as a negative control. Following rehydration, tissue sections were preincubated for 1 h in 0.2% Triton X-100 and 1% normal goat serum (NGS) in Tris-buffered saline (TBS) (1% TBS-NGS) and incubated overnight at 4°C with either anti-CD10-PE, anti-CD49f-PE, anti-EpCAM-FITC, and anti-CD24-PE or alpha smooth muscle actin (αSMA) antibodies, all diluted at 1:200. Negative control (Isotypes) tissue sections were incubated in a drop of 1% TBS-NGS. Slides were rinsed with TBS and incubated with the relevant isotype control (1:300 dilution) for 1 h at room temperature. Slides were washed in TBS, treated with Hoechst 33258 dye (Sigma-Aldrich, Lyon, France) and mounted with VECTASHIELD mounting medium (H-1000; Vector Laboratories, Burlingame, CA). Tissue sections were observed by fluorescence microscopy using an Eclipse E400 Nikon microscope (Nikon France, Le Pallet, France), using both 568 and 350 nm wavelength absorption/excitation.
Quantitative real-time polymerase chain reaction procedure
Total RNA was extracted from tissue samples after grinding them in liquid nitrogen with a mortar and pestle using TRIzol (Invitrogen, Paris, France). Briefly, tissue powder was homogenized in 1 mL of TRIzol reagent, incubated for 5 min at room temperature, and supplemented with 200 μL chloroform (Sigma-Aldrich). The mixture was centrifuged at 12,000 g for 15 min at 4°C and the upper aqueous phase, which contains the total RNA, was recovered and mixed with 500 μL of isopropyl alcohol to precipitate the RNA. Total RNA was extracted using the RNeasy Mini Kit according to the manufacturer's instructions (74014; Qiagen). Total RNA concentration and the 260/280 nm and 260/230 nm absorbance ratios were measured on a NanoDrop ND-1000 spectrophotometer (NanoDrop Technologies, Wilmington, DE).
RNA quality was then determined on an Agilent 2100 Bioanalyzer (Agilent Technologies, Massy, France) by RNA profile and RNA integrity, measured using Agilent 2100 Expert Software, version B.02 (Agilent Technologies,
The amplification program consisted of an initial denaturation step at 95°C for 10 min followed by 40 cycles of denaturation at 95°C for 10 s and combined primer-annealing-extension at 60°C for 1 min, during which fluorescence was measured. A melting curve was produced after completion of the thermal PCR program to check for the presence of a gene-specific peak and the absence of a primer dimer. Raw cycle threshold (Ct) values obtained from raw StepOne Software version 2.3 (Applied Biosystems) were transformed into quantities using the comparative Ct method [26] and specific efficiencies. Ribosomal Protein Large P0 (RPLP0: Forward 5′ CAACCCTGAAGTGCTTGACAT 3′, Reverse 5′ AGGAGATGGATCAGCCA 3′) was used as the endogenous control gene. Results at days 90, 150, and 250 are expressed as percent of the tissue content at day 30.
Flow cytometry analysis
Cells obtained from mammary biopsy digestions were prepared for flow cytometry analysis with MACS buffer (autoMACS™ with 2% bovine serum albumin; Miltenyi Biotec,
EpCAM, epithelial cell adhesion molecule; FITC, fluorescein isothiocyanate.
After labeling, cells were centrifuged at 400 g and resuspended in 0.3 mL of MACS buffer. Multistaining of the four antibodies was performed to determine specific populations. Propidium iodide (PI) was used to identify the live cells. Acquisition of the PI-stained population was gated to forward-scattered light (FSC) and side-scattered light (SSC) to exclude dead cells and delineate cell granularity and size, as well as doublets, by adjustments in height and photomultiplicator voltage. Flow cytometry analysis was performed on a data set of 30,000 events (single cells) using an MACSQuant® Analyzer10 (Miltenyi Biotec) and data were analyzed using MACSQuantify analysis software (Miltenyi Biotec). Results were expressed in percentages (dot plot analysis).
Statistical analyses
Each experimental condition was repeated thrice. Milk composition, flow cytometry, and qPCR data were subjected to analysis of variance (one-way ANOVA) using the following model: y ij = μ + timei + ɛij (y = flow cytometry data or qPCR data; μ = mean; i = time of biopsies and ɛ = residuals). Post hoc Tukey pairwise comparisons were used. Differences were considered significant at P < 0.05. All statistical analyses were performed using R software (the R foundation).
Results
MY of primiparous lactating dairy cows
Daily MY was recorded for the five primiparous cows, from calving to the drying-out period. As expected, the MY was significantly different at each mammary gland biopsy time point of mammary biopsies (30, 90, 150, and 250 days) with 29.9, 34.3, 32.9, and 19 kg/day, respectively (P < 0.05) (Fig. 1). The mean of daily MY described a classical lactation curve, with a peak of production at ≈60 days postcalving. Analysis of milk composition data showed that fat and protein yields varied according to MY, as expected during lactation in primiparous dairy cows (Table 2). Furthermore, SCC values were less than 250 × 103 cells/mL throughout lactation, showing that the cows and their mammary glands were healthy. This prerequisite was the first step to validate our experimental model.
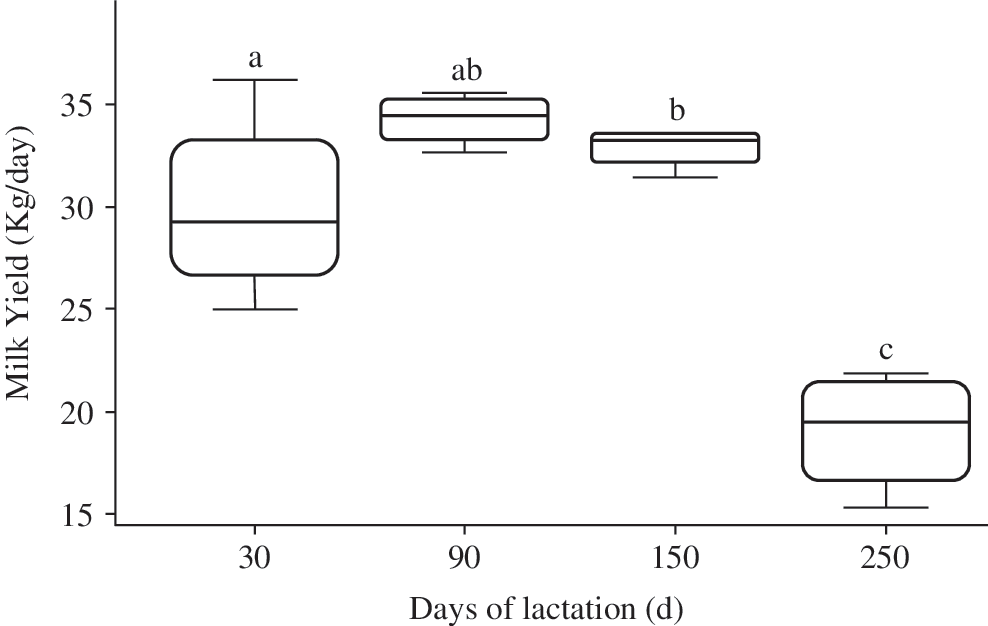
Representative box plots of MY during the lactation cycle. Each box plot represents the mean (five dairy cows) of daily milk production (kg/day) before mammary gland biopsy at the indicated time point. The letters above the box plots indicate statistically significant (P < 0.05) differences between each value and the value at each of the other three time points. MY, milk yield.
The milk of five primiparous lactating cows was collected throughout lactation. The MY was recorded daily over 52 weeks. Milk samples were collected weekly for SCC and to determine the milk fat and protein composition. The data are expressed as the mean value ± SEM at 30 (biopsy 1: B1), 90 (B2), 150 (B3), and 250 (B4) days of lactation. Different letters indicate statistically significant (P < 0.05) differences between each value and the value at each of the other three time points.
MY, milk yield; SCC, somatic cell counting.
Mammary gland morphology and differentiation during lactation
The second step to validate our experimental approach was to examine the morphology of the mammary gland tissue using eosin/hematoxylin staining of tissue sections at each biopsy time point (Fig. 2). At 30 days of lactation, the mammary alveoli displayed small luminal spaces (Fig. 2, left upper panel). At 90 days, distinct luminal spaces appeared, in agreement with the high secretory activity of the MEC at this time of the lactation cycle (Fig. 2, right upper panel). In contrast, we noted the regression of the alveolar structure at 150 and 250 days of lactation, with stromal tissue increasing and taking the place of the mammary epithelium at the end of lactation (Fig. 2, lower panels). In line with these observations, we observed that the level of cytokeratin 19 (CK19), estimated using RT-qPCR (Fig. 3), varied significantly throughout lactation, with maximal expression at 150 days of lactation (P < 0.05).
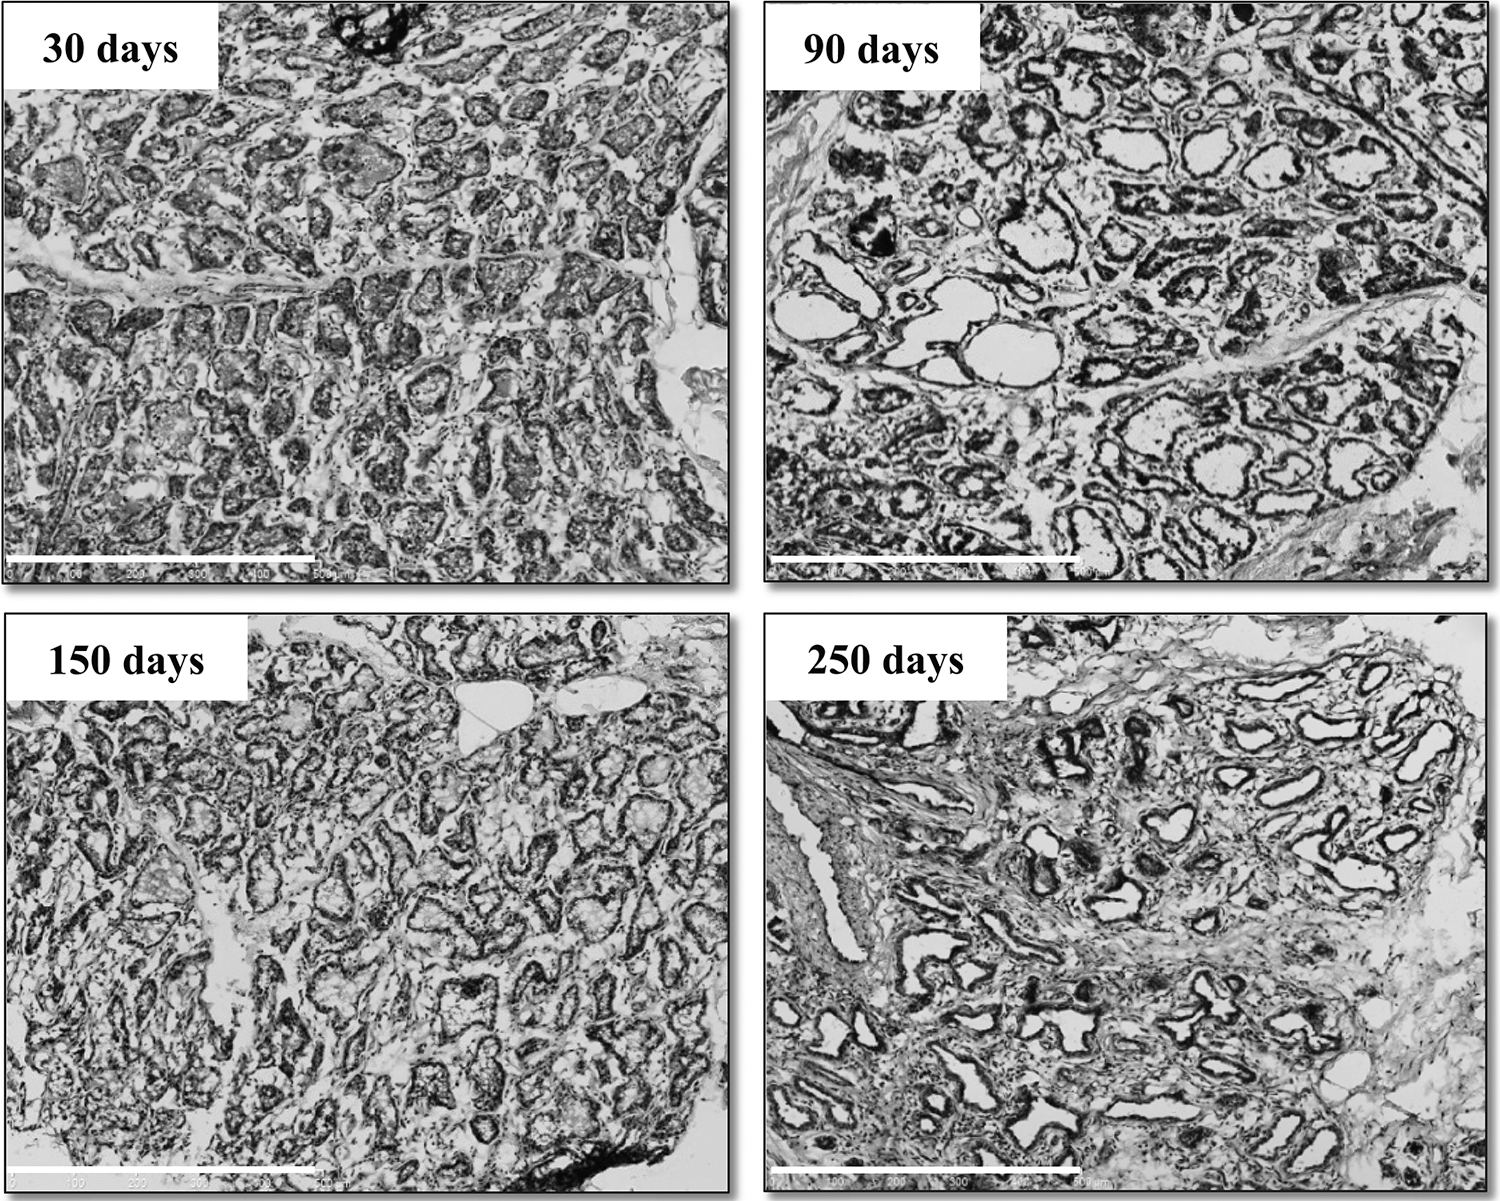
Organization of the mammary gland secretory tissue throughout lactation. Mammary tissue was collected by biopsy at 30, 90, 150, and 250 days of lactation and processed for hematoxylin/eosin histological staining. The stained tissue sections were scanned using a NanoZoomer (Hamamatsu). Scale bar = 500 μm.
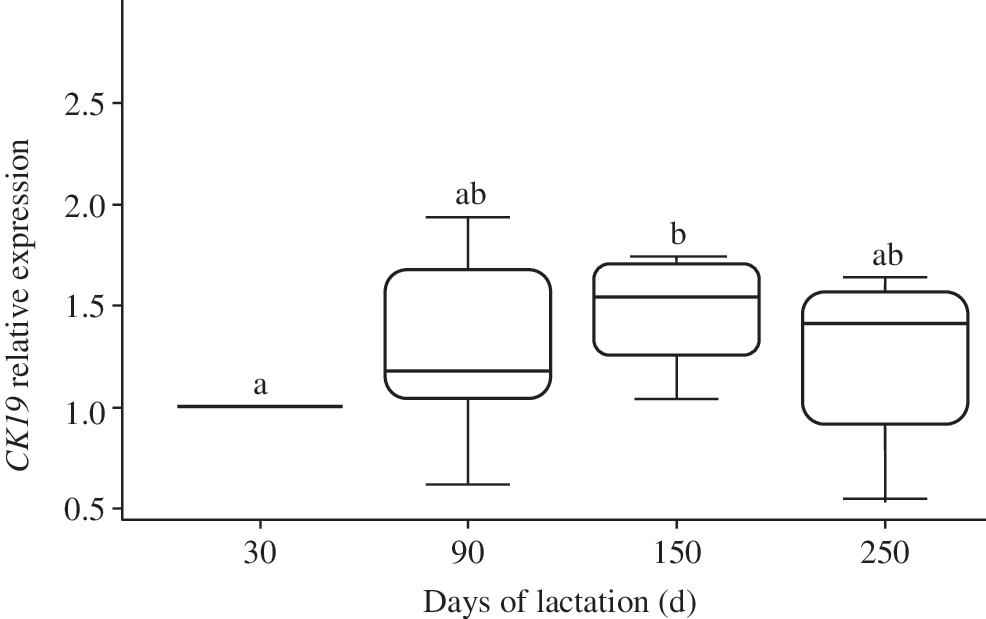
Representative box plots of relative CK19 gene expression throughout lactation. Each box plot represents the mean (five dairy cows) of CK19 expression at the indicated time point before mammary biopsy (RPLP0 was used as the reference gene). Results at days 90, 150, and 250 are expressed as percentage of the tissue content at day 30. Different letters above the box plots indicate statistically significant (P < 0.05) differences between each value and the value at each of the other three time points.
In situ localization of cell-surface markers in mammary gland tissue
To estimate the relevance of the four lineage markers used in the present study (CD10, CD49f, CD24, and EpCAM), we characterized their expression in specific cell populations within mammary gland sections during lactation. DAPI staining allowed us to identify nuclei in the alveoli and stroma. Immunohistochemical labeling using antibodies against CD10 showed exclusive staining of cells surrounding the luminal MEC layer, corresponding to myoepithelial cells (Fig. 4A, left panels). In line with this, αSMA counterstaining was observed in the myoepithelial cell layer around CD49f-positive cells (Fig. 4A, right panels). CD49f was expressed and localized in cells located in the basal part of the lumen. Expression of CD24 and EpCAM was also examined in situ. CD24 was only detected in some of the cells located in the luminal MEC layer (Fig. 4B, left panels). Higher magnification of CD24 staining confirmed the specific cell-surface staining and localization (Fig. 4B, left panels, insets). With regard to EpCAM localization, we observed apical staining in some of the luminal MEC (Fig. 4B, right panels).
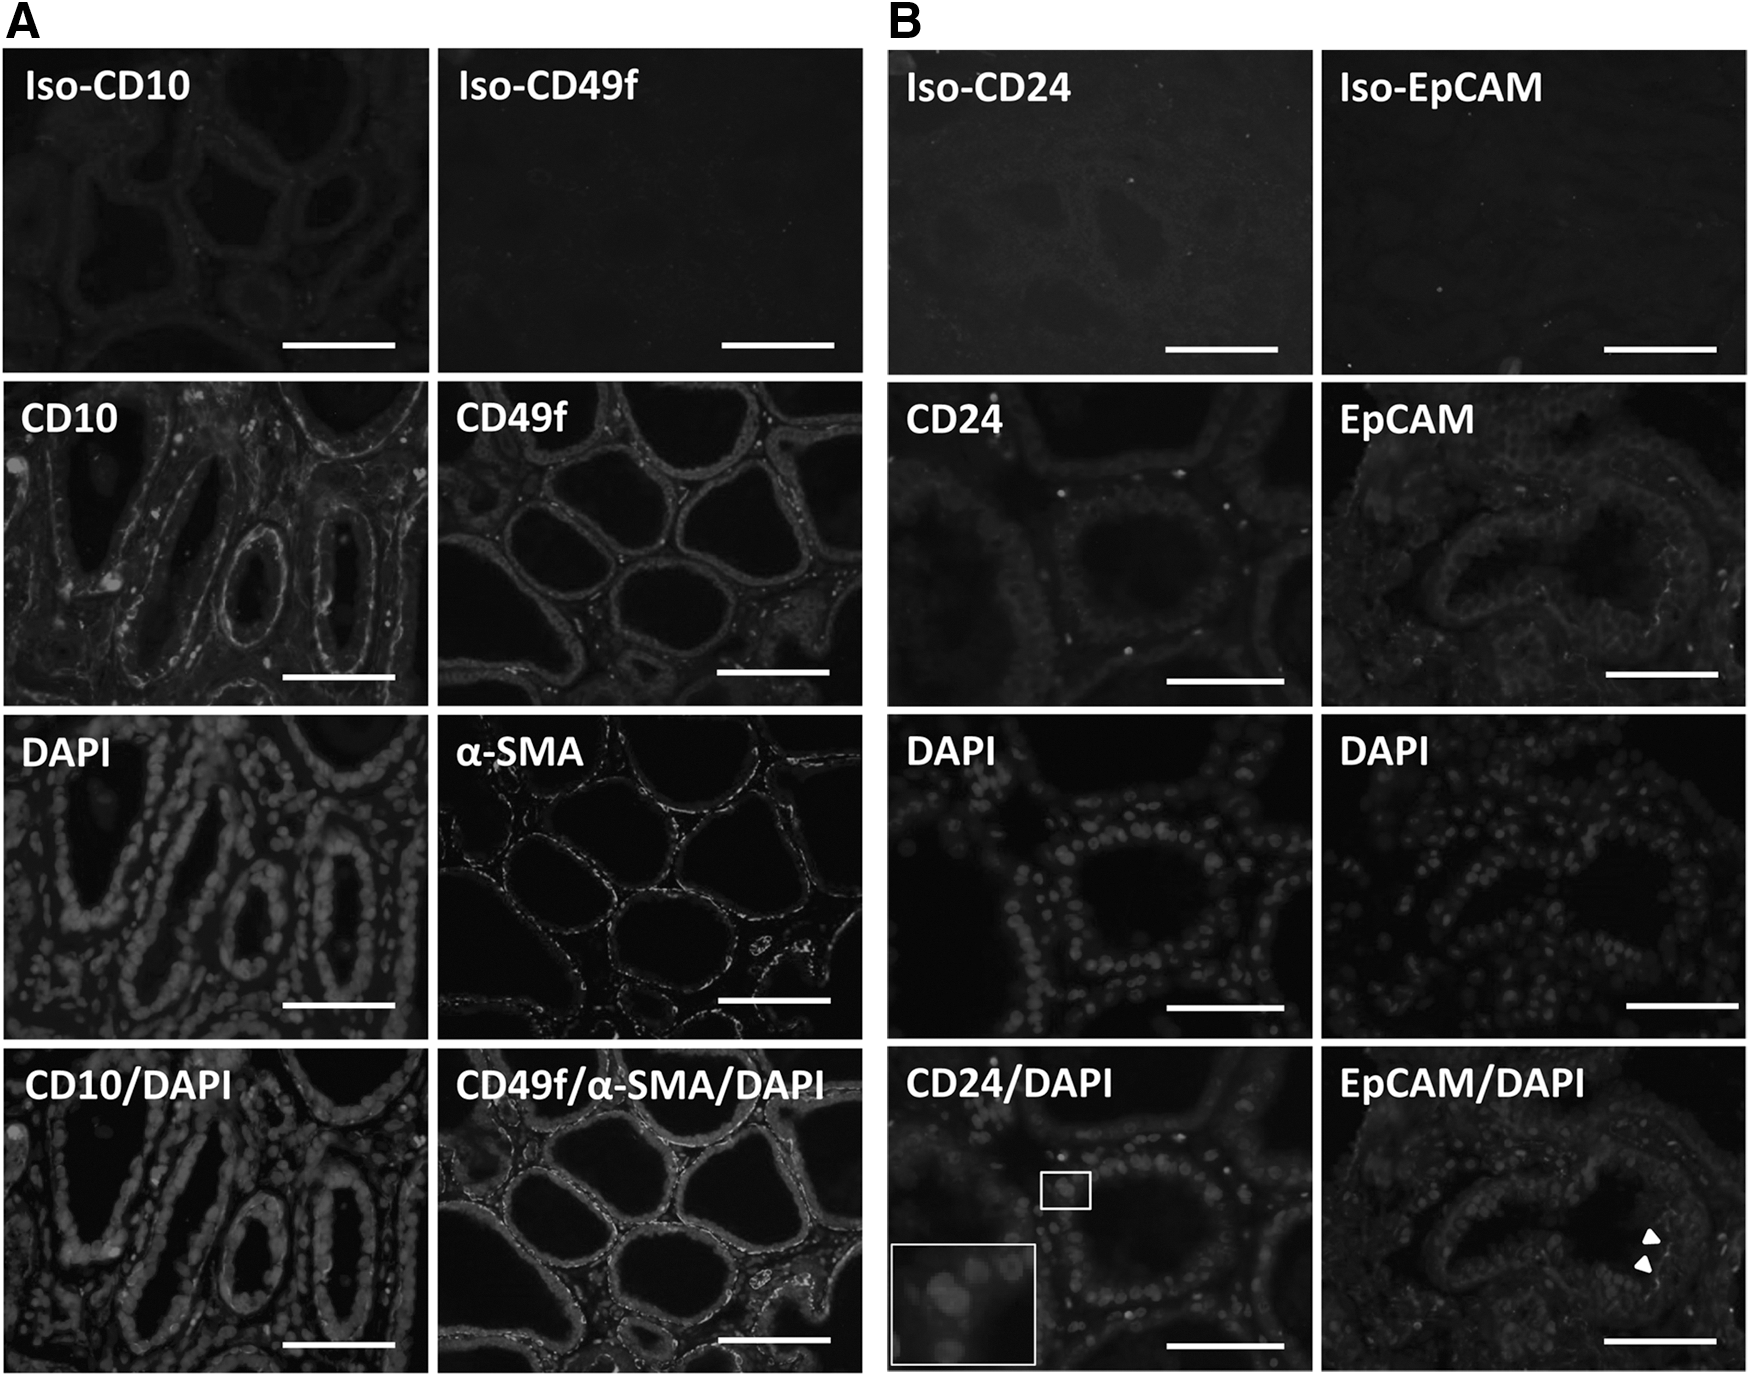
In situ localization of cell-surface markers in lactating mammary gland tissue.
Gating strategy for flow cytometry data analysis
To validate the multicolor panel of the four antibodies used in the present study, coupled with four different fluorochromes, we performed single cell staining with each antibody (Table 3) and Fluorescent Minor One. To develop this technique, essential to set up our multicolor assays, we used a manual compensation matrix based on the median fluorescence intensity procedure. We also ensured that only single living cells were analyzed, by eliminating cell aggregates and dead cells from our analysis. To eliminate aggregates, we performed doublet exclusion using FSC-H/A and SSC-H/A parameters. To discriminate between live cells and dead cells, we used PI staining. This technical strategy is essential to analyze each cell-surface marker in single living cells (Fig. 5A). The strategy to analyze the expression of the three other cellular markers used in the present study within a stained population (here, the CD49f-positive cells) is illustrated in Fig. 5B. In our example, we gated on CD49f-positive cells to analyze coimmunostained populations: CD49f and EpCAM, CD49f and CD10, and CD49f and CD24. This procedure was applied for each cell-surface marker (CD49f, CD10, CD24, and EpCAM).
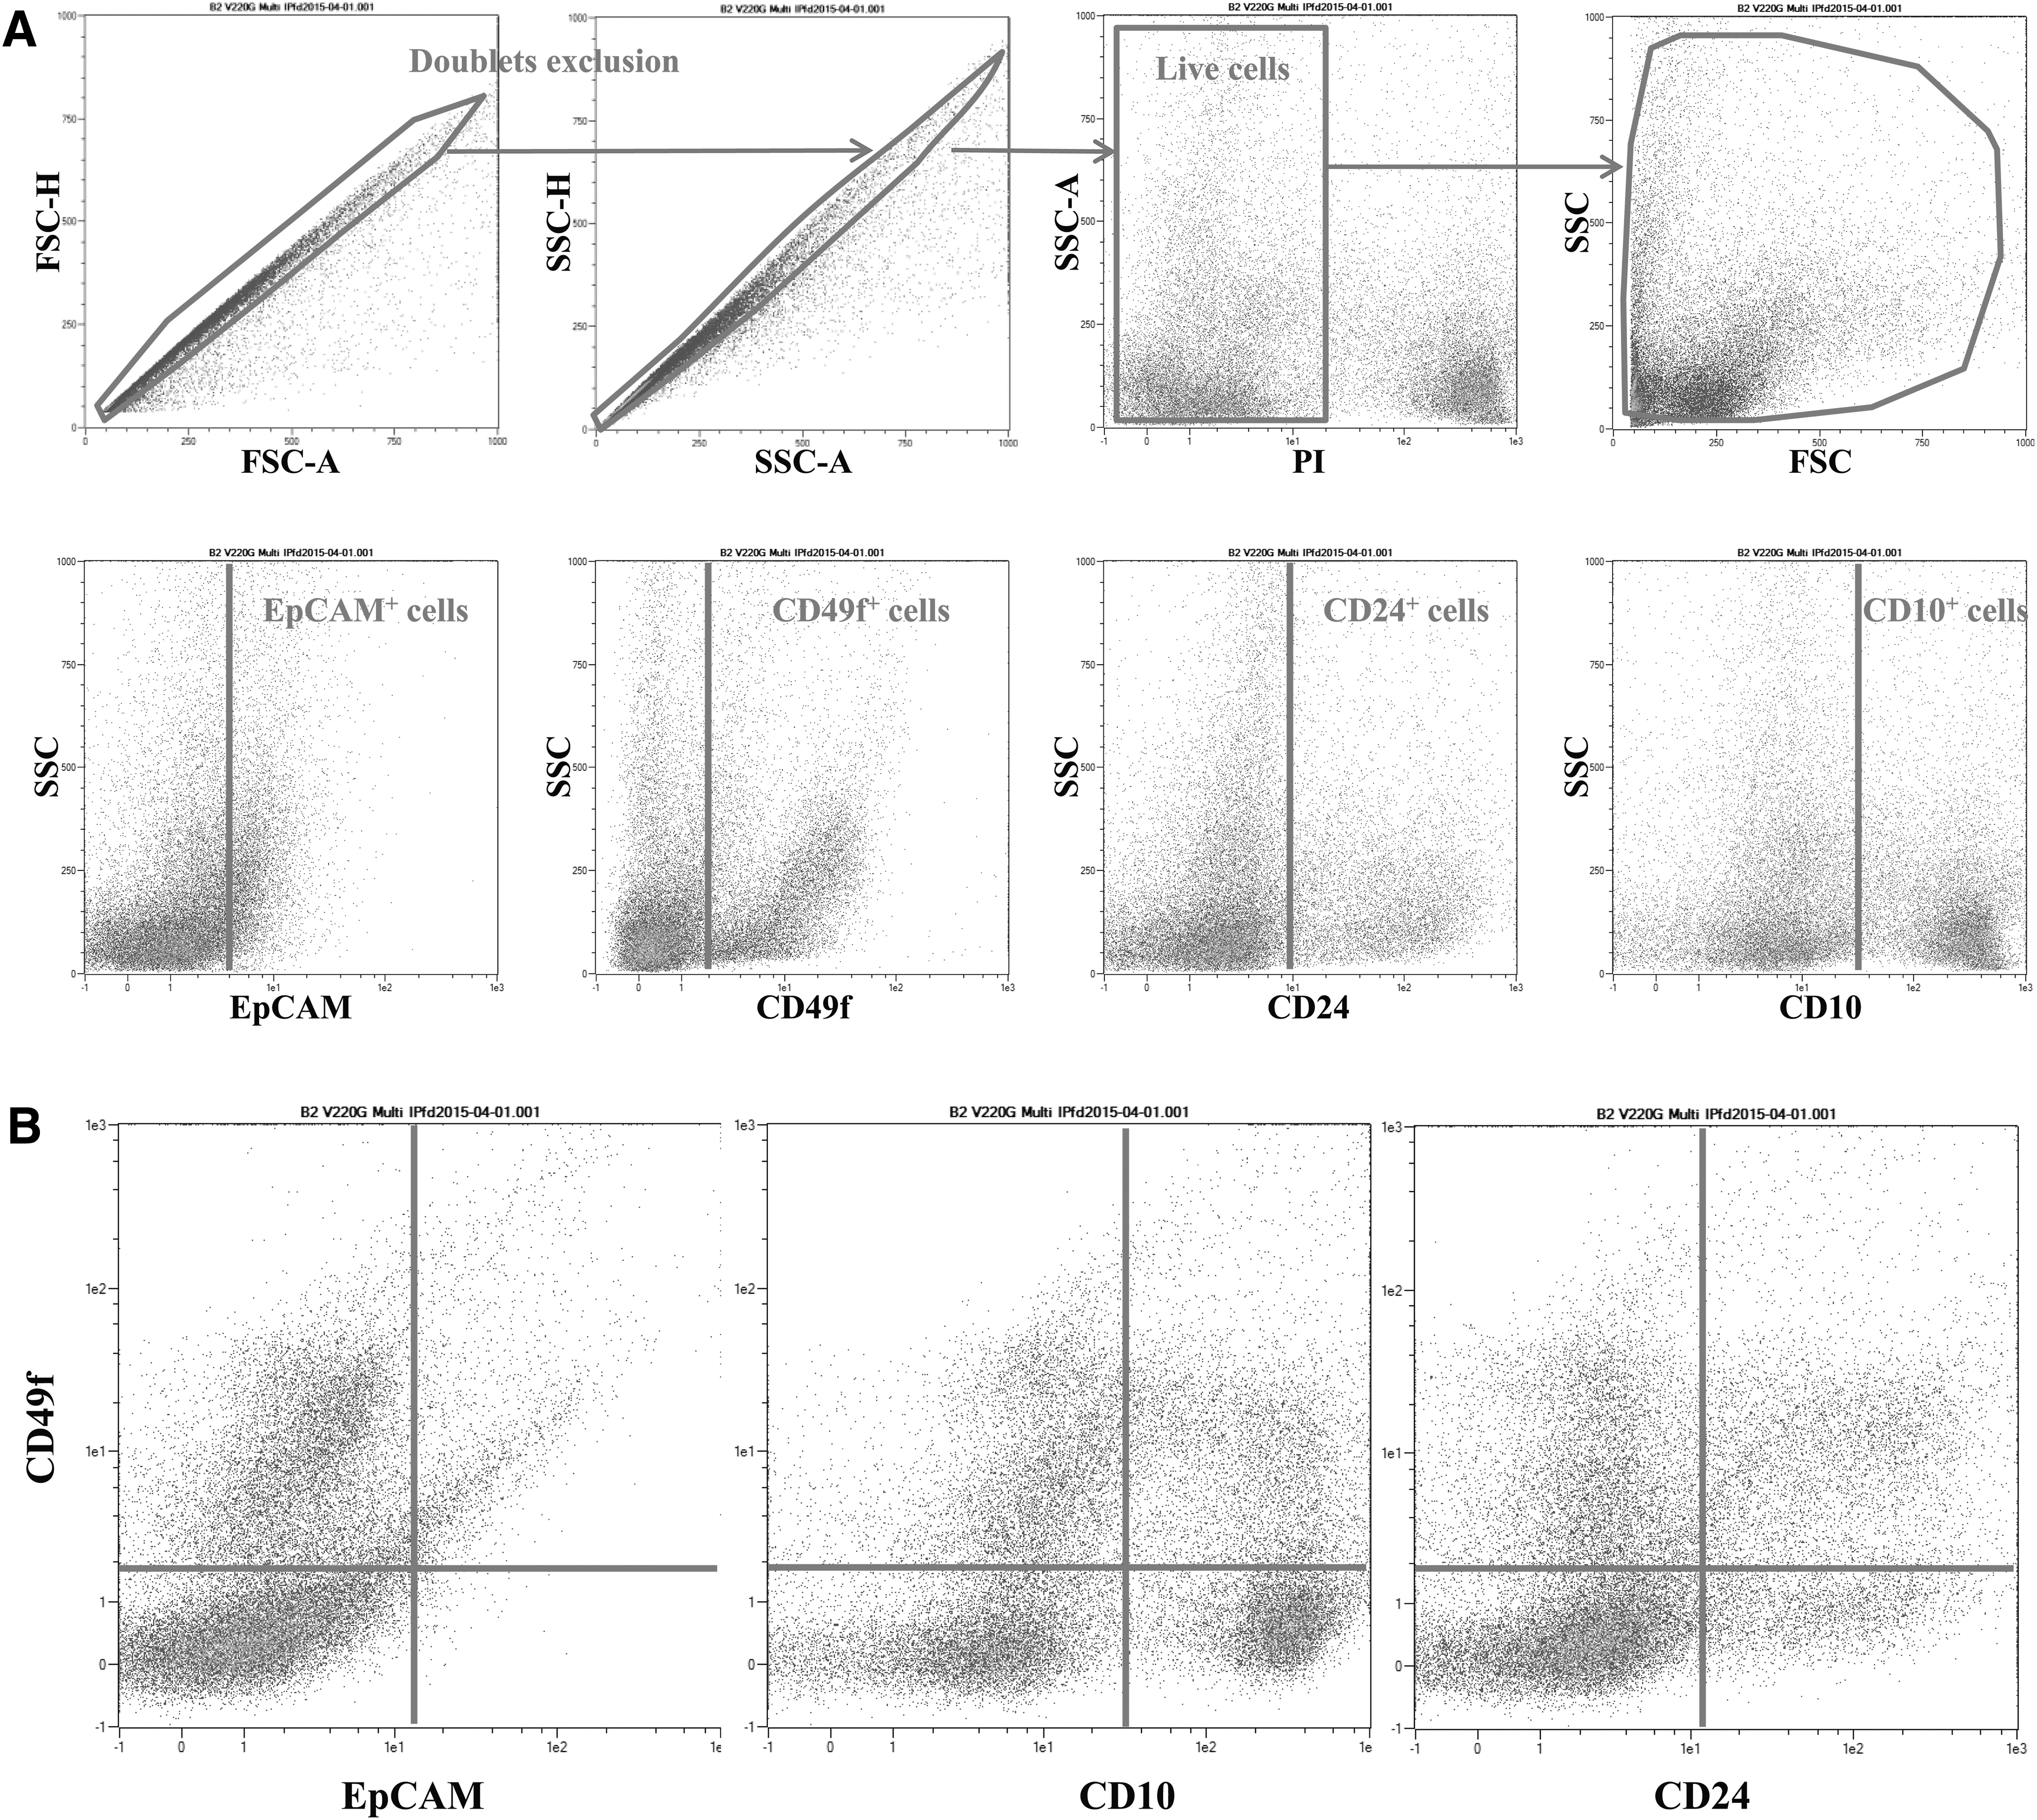
Gating strategy used to analyze the stained cell populations by flow cytometry.
Mammary biopsies were collected at 30 (biopsy 1: B1), 90 (B2), 150 (B3), and 250 (B4) days of lactation. After tissue digestion and cell dissociation, single cell suspensions were phenotyped using anti-CD24, -EpCAM, -CD10, and -CD49f antibodies. Each data point corresponds to the mean ± SEM of fluorescence for each single staining. Different letters indicate statistically significant (P < 0.05) differences between each value and the values at each of the other three time points.
Cell hierarchy and lineage in the bovine mammary gland during lactation
After tissue dissociation and single cell isolation, we determined the proportion of each putative cell type according to the expression of cell-surface markers at four stages of the lactation cycle, namely 30, 90, 150, and 250 days of lactation. Flow cytometry dot plots depicting the main populations (CD49f +, CD24/CD49f, and CD49f/EpCAM) at 30, 90, 150, and 250 days of lactation are presented in Fig. 6. First, we analyzed single staining with CD24, CD10, EpCAM, and CD49f cell-surface markers (Table 3). We observed that the predominant cell population expressed CD49f. Interestingly, the proportion of CD49f-positive cells significantly decreased over the lactation cycle (B1: 47% vs. B4: 28.8%, P < 0.05, data not shown). The proportions of the other single-stained cell populations were lower (<7%) and their expression did not vary during lactation (data not shown).
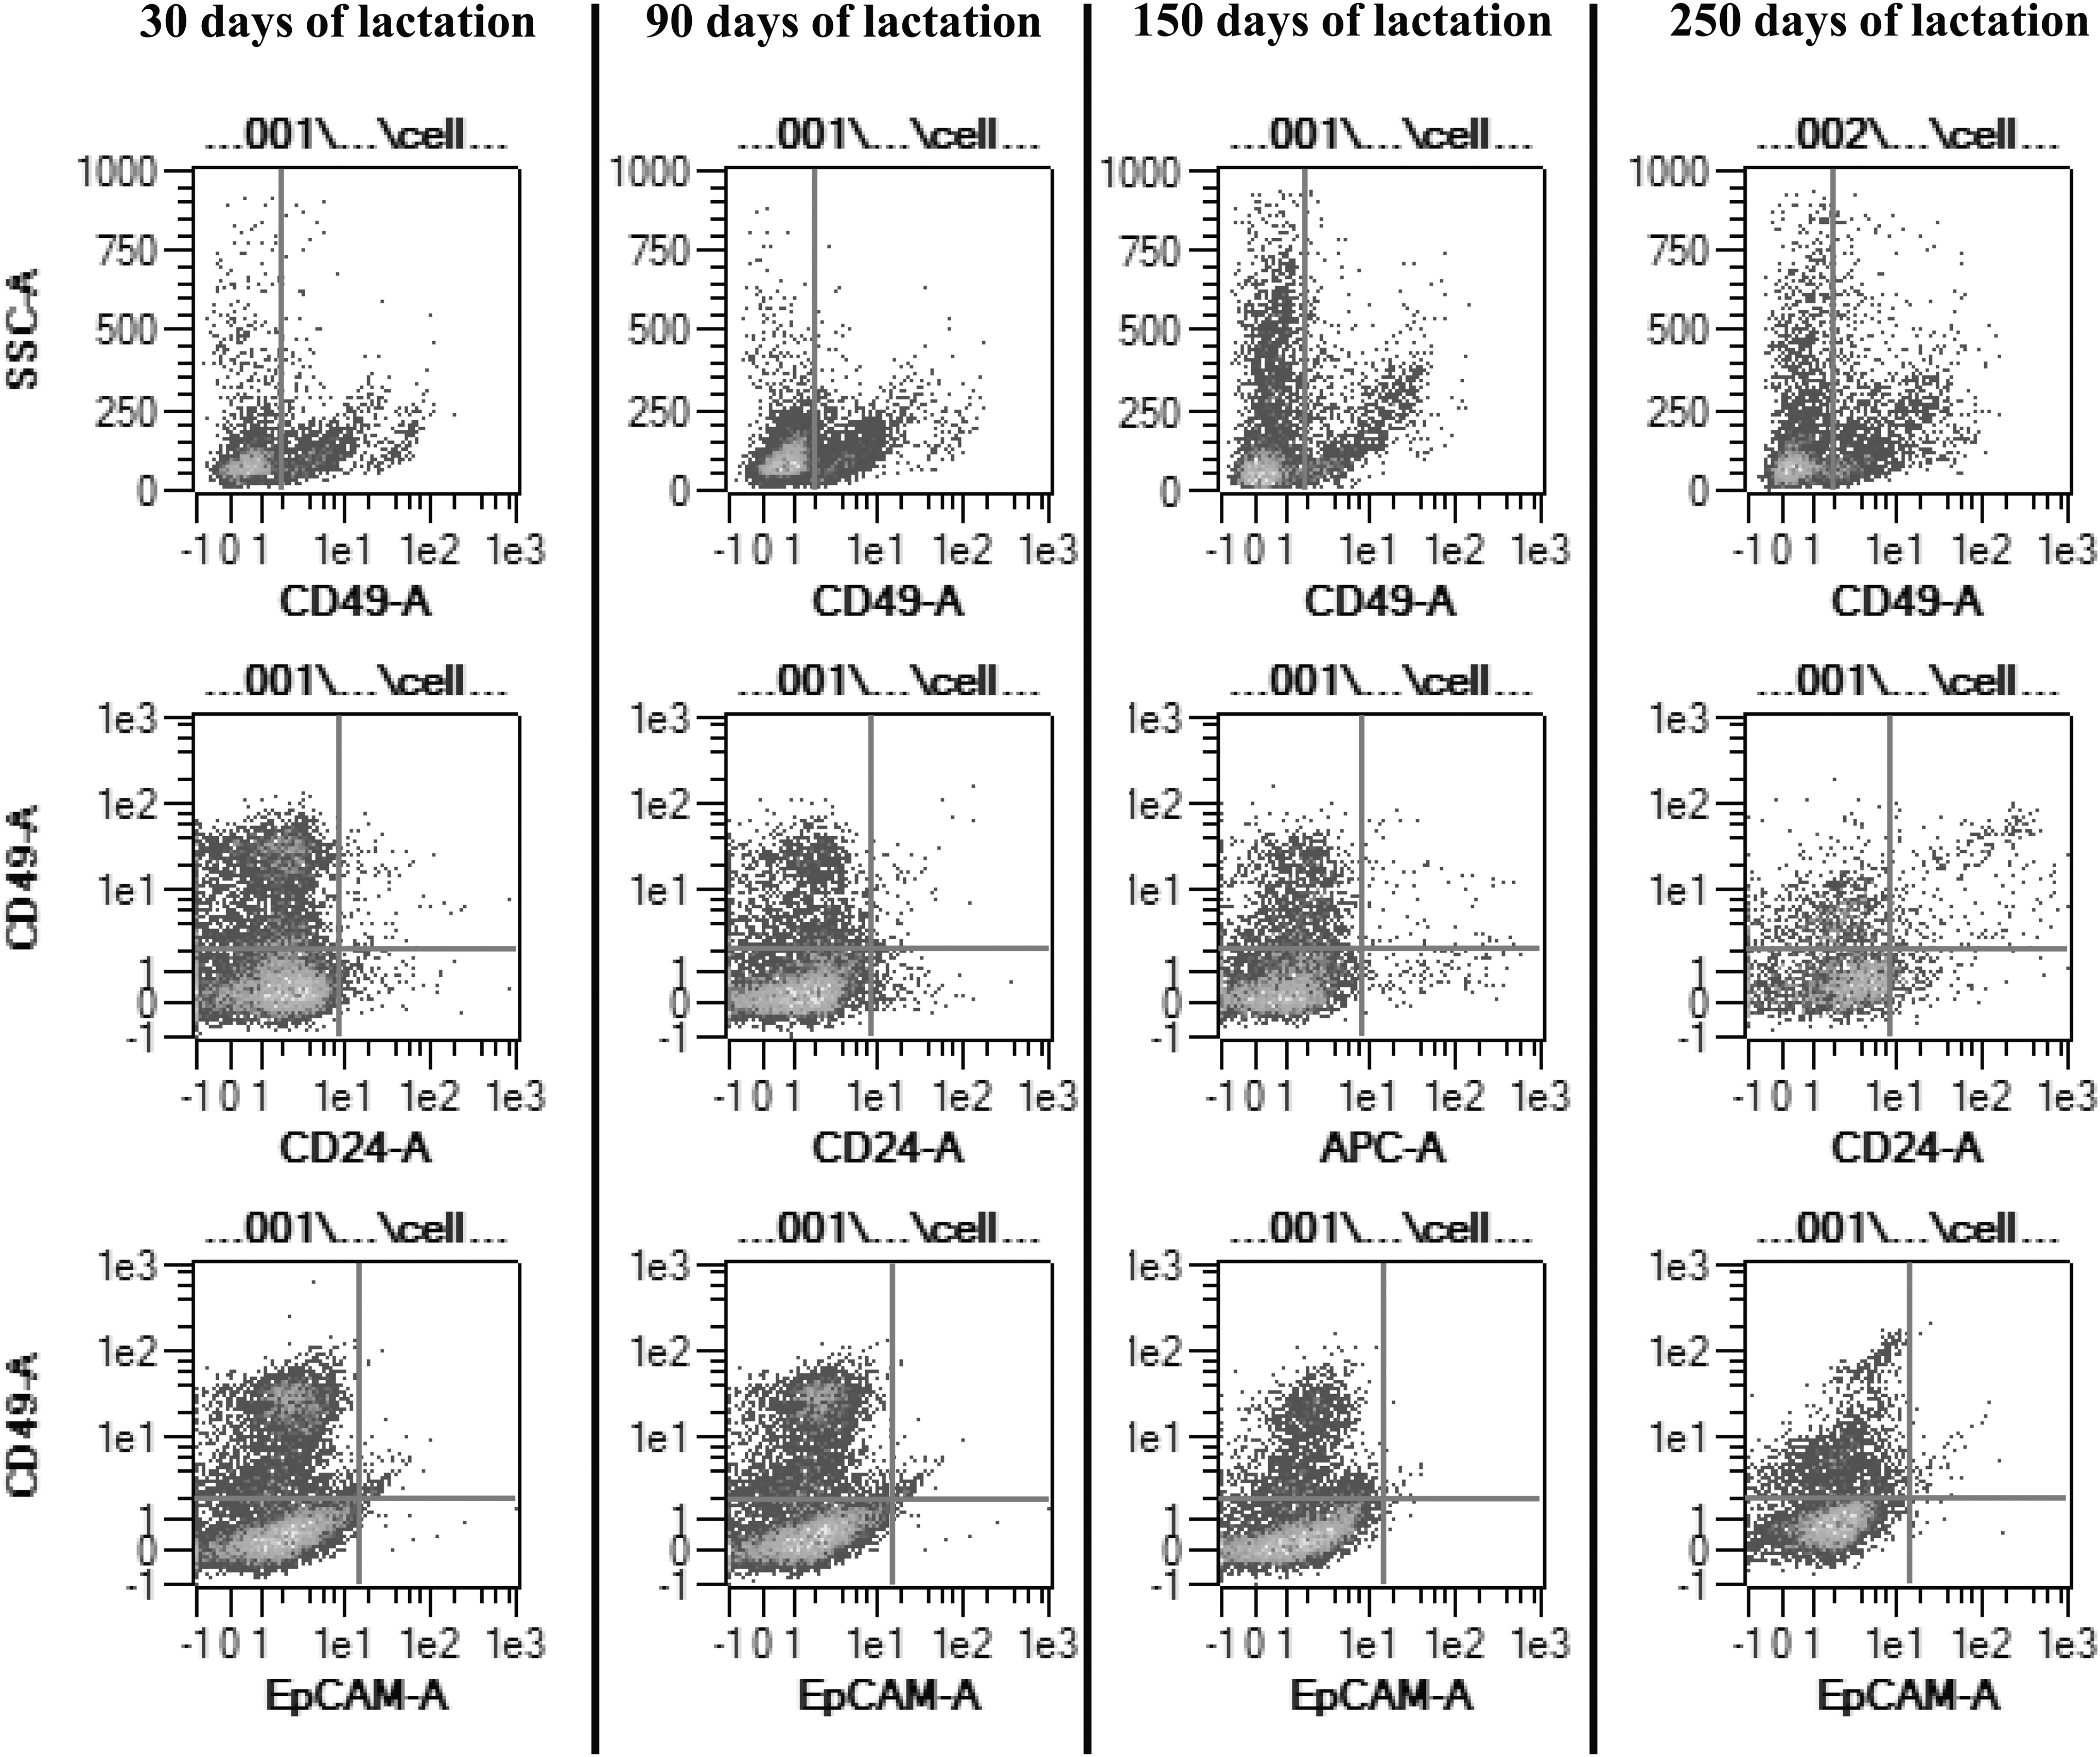
Evolution of main MEC populations over the lactation. Flow cytometry dot-plots depicting the main populations at 30, 90, 150, and 250 days of lactation. Upper panels highlighted CD49f-positive cells, middle panels: CD49f/CD24 populations, and lower panels: CD49f/EpCAM populations.
Next, we defined double-stained cell populations using combinations of CD10, CD49f, CD24, and EpCAM markers. The different marker combinations were determined in accordance with their specific localization, as observed by immunochemistry and reported in the literature for other lactating species (Table 4). First, we showed that the proportion of CD24+/CD49f + cells did not significantly evolve throughout the lactation cycle. Concerning the putative progenitor populations, we found that CD24−/CD49f + cells represented the majority of the cells among the putative progenitors. Of note, the proportion of this cell population significantly decreased during lactation, from 38.2% (B1) to 23.8% (B4) (P < 0.05). In contrast, the proportions of the other putative progenitors were very low (0.7%–5.1%) and their expression did not vary significantly during lactation. Next, we focused on the mature (differentiated) cell populations. The cell populations, which did not express EpCAM and in which CD49f was either present or absent (CD49f +/EpCAM− and CD49f −/EpCAM−), were the most abundant putative mature cells. Interestingly, the variations in both populations over the lactation period were in opposite directions. Indeed, the CD49f +/EpCAM− cells significantly decreased while the CD49f −/EpCAM− cells increased from 38% (B1) to 21.5% (B4) and from 55% (B1) to 68.5% (B4), respectively. The proportion of the third population of putative mature cells, that is, CD49f +/CD10+ cells did not significantly vary between 30 and 250 days of lactation and remained low (from 1.7% to 3.4%).
Mammary biopsies were collected at 30 (biopsy 1: B1), 90 (B2), 150 (B3), and 250 (B4) days of lactation. After tissue digestion, cell dissociation, and single cell isolation, the proportion of each cell type was determined at each stage of lactation according to the expression of cell-surface markers. Light gray line represents putative stem cell population, middle gray line represents putative progenitor cell populations and dark gray line represents putative mature cell populations. The proportions of double-stained cell populations, using EpCAM, CD49f, CD24, and CD10 markers, are presented as the mean of fluorescence ± SEM. Different letters indicate statistically significant (P < 0.05) differences between each value and the values at each of the other three time points.
Correlation between putative mature cell proportion and MY
Statistical analysis showed a positive correlation between the proportions of CD49f-positive cells and the MY (R 2 = 0.39, P < 0.05), as the number of CD49f-positive cells increased as the level of milk production increased (Fig. 7A). In contrast, we observed opposite changes in the proportion of CD49f −/EpCAM− cells and the proportion of CD49f +/EpCAM− cells in relation to MY (Fig. 7B, C). Indeed, the correlation between CD49f −/EpCAM− cells and milk production was negative (R 2 = 0.51, P < 0.05, Fig. 6B), whereas the proportion of CD49f +/EpCAM− cells positively correlated with milk production (R 2 = 0.35, P < 0.05, Fig. 7C).
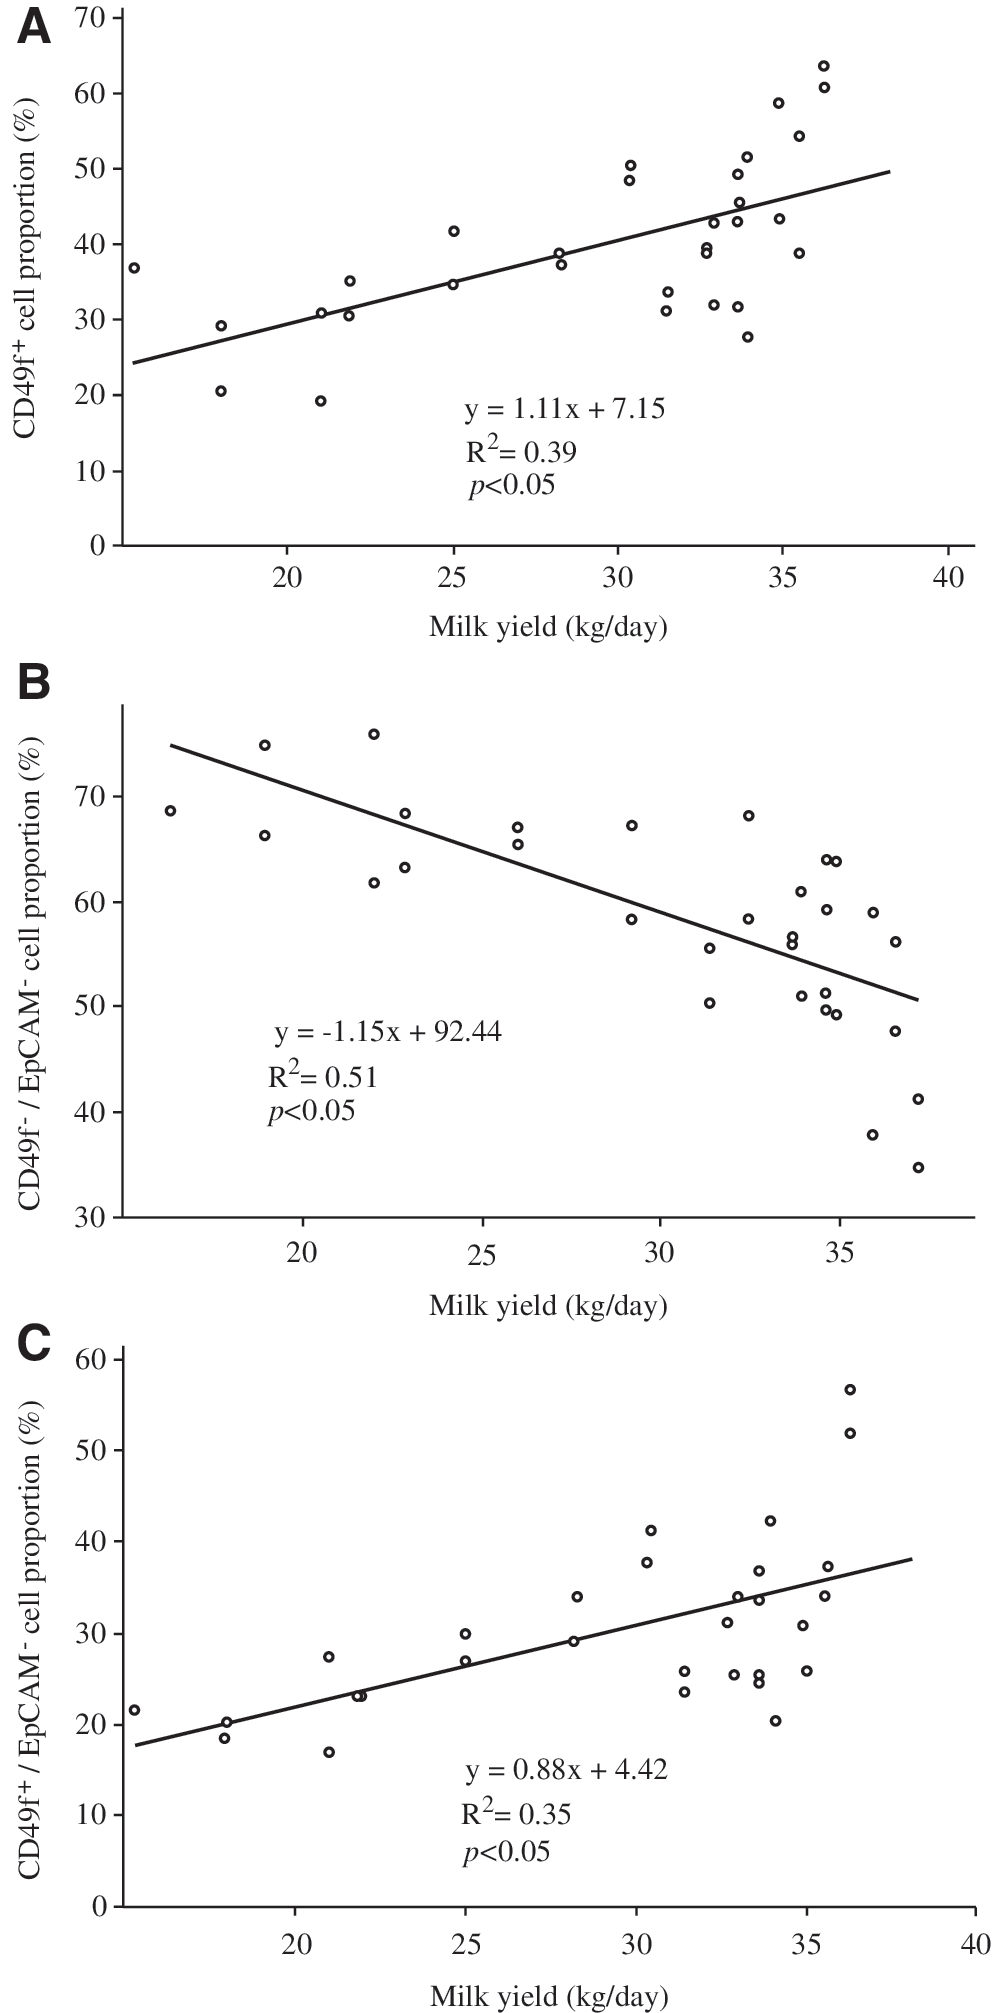
Analysis of the correlation between the proportions of various cell populations and MY.
Discussion
During the development of the mammary gland (mammogenesis) and lactation (galactopoiesis) in dairy cows, each cell population has a specific feature involved in mammary gland plasticity. Like most glandular tissue, the adult mammary gland is composed of many cell types that interact to shape the organ and make it functional. In this study, we specifically focused on epithelial-like, myoepithelial, and progenitor/stem cells implicated in mammary gland plasticity. Flow cytometry is a suitable method to analyze and to discriminate between single cell phenotypes on precious and small samples such as mammary gland biopsies. We used this method to analyze and to identify the lineage of cell populations based on the expression of cell-surface markers commonly used in the mammary gland field: CD49f, CD24, CD10, and EpCAM.
The prerequisites for our study were to ensure that mammary explant samples were representative of a lactating mammary gland. Using five primiparous dairy cows, we first monitored their zootechnical data to ensure their MY responses and the quality of the milk composition. A classical lactation curve is defined by a peak in milk production between 30 and 90 days of lactation, followed by a decrease in milk production. To validate the mammary gland samples before the phenotypic characterization of mammary cells, we observed the morphology of the tissue obtained by biopsy and analyzed the expression of the CK19 gene (a conventional marker of mature alveolar cells [27,28]). As expected, we observed an increase in the surface of luminal spaces in alveoli at 90 days of lactation, followed by a decline, which correlated with the decline in MY. These key events validated that the mammary biopsies represented well the four chosen stages of lactation.
In this study, we demonstrated that cell populations expressing EpCAM and CD49f cell-surface markers varied significantly and inversely during lactation from 30 to 250 days of lactation. Indeed, 30 days after the beginning of lactation, the proportion of CD49f +/EpCAM− cells reached their maximal expression level (38%), while the proportion of CD49f −/EpCAM− cells started at their minimal expression level (55%). We also showed that these relative proportions were reversed in late lactation, with 21% CD49f +/EpCAM− cells and 68.5% CD49f −/EpCAM− cells. Moreover, the statistical correlations established between CD49f +/EpCAM− cells and CD49f −/EpCAM− cells and MY demonstrated that these two cell populations are related to milk production. When milk production increased, the proportion of CD49f +/EpCAM− cells increased, whereas the proportion of CD49f −/EpCAM− cells decreased. Both CD49f and EpCAM are cell-surface markers associated with cell adhesion and are very often used to phenotype mammary gland cells and their degree of maturation. Altogether, these data and the literature strongly suggest that mammary alveolar cells that are involved in milk production (myoepithelial and lumino-alveolar cells) expressed CD49f, while epithelial cells present in the mammary ducts (lumino-ductal cells) did not express this marker.
CD49f is also expressed mainly by bipotent progenitors and basal/myoepithelial cells of the breast [29 –31]. In addition, it is well known that the loss of EpCAM is correlated to a decrease in progenitor activity [31]. Thus, we hypothesized that differentiated mature cells did not express the marker EpCAM. Considering these results and the literature, we hypothesize that CD49f and EpCAM are suitable markers to discriminate between mature luminal cells and their progenitors. In 2012, Rauner and Barash demonstrated that CD24−CD49f + cells are bipotent progenitor cells that give rise to luminal progenitors and then differentiate into luminal cells. In human breast and mouse mammary gland, CD24−/CD49f + cells are also considered to be bipotent progenitor cells. This has been established through in vivo transplantation and in vitro experiments [32,33]. In our study, the proportion of CD24−/CD49f + cells significantly decreased during lactation (38% in early lactation vs. 23.8% in late lactation).
In the lactating mammary gland, the self-renewal of MEC is constantly ensured by two mechanisms: cell proliferation and programmed cell death (apoptosis). Capuco et al. estimated that, in the lactating bovine mammary gland, the average rate of proliferation was about 0.3% per day and the average rate of apoptosis was about 0.56% per day, corresponding to a cell turnover of ∼50% during lactation [34]. Progenitor cells are the main actors in this biological process, as they both proliferate and give rise to differentiated cells involved in milk synthesis; these cells are then removed from the mammary epithelium by apoptosis. Thus, the high proportion of bipotent progenitor cells found in early lactation is consistent with the literature.
To perform a complete lineage and cell hierarchy analysis in the bovine lactating mammary gland, we also focused on myoepithelial cells and their putative progenitors. A characteristic of myoepithelial cells is a dual phenotype of both smooth muscle (positive for αSMA) and epithelial cells [35]. Myoepithelial cells also express CD10 (neutral endopeptidase). Clarke et al. used CD10 as a myoepithelial marker to separate myoepithelial cells from luminal cells by immunomagnetic techniques [36]. In 2009, Ellis and colleagues showed that CD10 is a marker of myoepithelial cells within the mammary gland in heifers during mammogenesis. In our study, immunolocalization of CD10 in lactating mammary gland sections confirmed that CD10 was specifically expressed by myoepithelial cells [24]. Thus, we included CD10 in our flow cytometry panel, to thoroughly phenotype myoepithelial cells. Based on the presence of CD49f at the surface of basal epithelial cells [37], we decided to combine CD49f and CD10 to analyze putative mature myoepithelial cells.
Our results showed that the CD49f +/CD10+ cell population, like the CD10+ population, was few and present without significant variation from B1 to B4. This stable proportion of putative myoepithelial cells proves that this population must be conserved during the entire lactation cycle. The same process has also been observed in skeletal muscle, in which the proportion of satellite cells is conserved for muscle homeostasis [38]. In murine mammary gland, the presence of mature and functional myoepithelial cells has been associated with the identification of myoepithelial progenitors and their expression of CD24 [5]. Despite very scarce literature about myoepithelial progenitor phenotypes, the transition from progenitors to differentiated cells occurs with different modifications, such as a switch in cell-surface markers. Hence, we hypothesized that the putative bovine myoepithelial progenitors were CD10−/CD24+. This hypothesis was supported by our immunostaining data, which demonstrated that CD10+ cells were mature myoepithelial cells only.
In many reports, the expression of CD24 is associated with a stem cell phenotype. In 2006, Shackleton et al. isolated a discrete subpopulation of mouse mammary cells on the basis of cell-surface markers (Lin−CD29hiCD24+). They showed that a single cell from this subpopulation, marked with a LacZ transgene, could reconstitute a complete mammary gland in vivo. The transplanted cell contributed to both the luminal and myoepithelial lineages and generated functional lobulo-alveolar units during pregnancy. The self-renewing capacity of these cells was demonstrated by serial transplantation of clonal outgrowths. In this study, we found, by immunolocalization, that CD24 was expressed by some luminal cells within the mammary epithelium. Rauner and Barash also showed CD24+ cells in the luminal compartment of developing mammary gland sections in heifers. CD24 is also highly expressed in luminal progenitors in the breast [39,40].
Using the combination of the CD49f and CD24 markers to sort primary MEC, they isolated CD24+/CD49f + cell populations that were able to form large mammospheres in vitro. They also showed that these cells had a high proliferation rate and were able to form organized colonies. These proliferative properties of undifferentiated cells define a stem cell phenotype, with the ability for multipotency and self-renewing. These features allowed defining the CD24+/CD49f + population as putative MaSCs. In our study, this population was present throughout lactation with a maximal proportion (3.3%) observed at 90 days of lactation (P = 0.09). Therefore, the CD24+/CD49f + population could play this putative MaSC role in bovine mammary gland. In conclusion, we hypothesized a stem cell population (CD24+/CD49f +) and four progenitor cell populations: bipotent luminal progenitors (CD24−/CD49f +), lumino-alveolar progenitors (CD24−/EpCAM+), myoepithelial progenitors (CD24+/CD10−), and lumino-ductal progenitors (CD49f −/EpCAM+).
This study provides a dynamic view of the mammary cell populations based on common markers used in mammary gland cell lineage identification. Our next goal will be to carry out the same analyses on mammary glands at different physiological stages: before and after puberty and during gestation, as well as at the peak of lactation and at the drying-out stage. An analysis of functional proteins (cytokeratins, steroid receptors, and aldehyde dehydrogenase activity) will be performed on sorted cells, isolated from the different populations described in this study and combined with mammosphere assays. In summary, this study not only contributes to a better understanding of the role of stem cells in the plasticity of the mammary gland but also identifies new biomarkers for veterinary and human medicine.
Footnotes
Acknowledgments
This research was cosupported by the French National Institute of Agricultural Science (INRA) and the INRA-PHASE department.
Author Disclosure Statement
No competing financial interests exist.